an interactive gis approach in open space planning using a
TRANSCRIPT

An Interactive GIS Approach in Open Space Planning Using a Multiple Criteria Ranking System Kendis WilleDepartment Heights, WinRochester, M Keywords: correlation Abstract The future oresources comean more henvironmentwildlife habiare being de Fortunthe county’sOlmsted Couover potentiaand the Olmprotect envirconcerns raiWho choose This pranking systegroups on a system for aimplementedproduce suit The sua variety of othought betwto discuss anhad high lev
Introductio If a person lithe suburbanarea, chance
1
1,2
1
t of Resource Analysis, St. Mary’s University of Minnesota, 700 Terrace ona, Minnesota 55987. Rochester-Olmsted Planning Department, innesota 55904
open space, ranking, multi-criteria, GIS, single additive weighting,
f our open spaces is uncertain. Development pressures on open space ntinue as people migrate into the rural areas around cities. More people ouses, mini malls, and the need for recreational opportunities. In addition, ally insensitive development eliminates our prairies, wetlands, and vital tat from our communities. These things that represent our natural heritage stroyed at an alarming rate. ately, in Olmsted County Minnesota, measures are being sought out to solve
growing concern over the loss of open spaces. Loss of open space in nty is a loss of the county’s natural heritage and vital habitat. The concerns l open space loss in the county have been expressed through public surveys
sted County General Land Use Plan, which explores policies used to help onmental corridors and natural ecosystems important to the county. These se many questions. Where are these vital areas? How do we choose them? s them? How do we get local citizens involved? ilot study addressed these open space concerns using a multiple criteria m determined by local governmental groups. The results from polling these
list of open space criteria were inserted into a geographical information nalysis. The maps made from the ranks were analyzed and a model . A single additive weighting model was applied using the ranked scores to
ability maps for four types of open spaces. itability maps show a promising representation of areas that could be used for pen spaces. The numbers behind the maps also show a direct correlation of een the groups polled. Furthermore, the rankings serve as a guide for groups d reach consensus on the small number of open space types for which they els of disagreement.
n
ves in a rural area or along edge of a metropolitan s are that they live not far
from a stream, prairie, or patch of woods. Chances are also good that none of these special places will be recognizable twenty or thirty years from now, unless they are in a park, forest,
2

2
easement or wildlife refuge. If these areas are left subject to development, they will become lawns, roofs, or parking lots stripped of all history and much beauty (Arendt, 1996). An open space can be considered an oasis of greenery and heritage in a concrete desert. With urban and rural sprawl on the rise, the threat to these vital natural areas soars. The effects of expansion are many and can include decline of environmental quality, loss of natural resource production, diminished economic opportunity, and a loss of a sense of place. For visitors and admirers, an open space provides visual relief, seasonal change, recreation, and a link to the natural world (Francis and Marcus, 1997). The future of Minnesota’s natural resource heritage is under pressure like never before (MDNR, 2000). In Olmsted County alone, the 1990 population of 106,470 persons will increase to 133,735 persons by 2020, according to the Olmsted County population projections (Olmsted County Planning Advisory Commission, Rochester-Olmsted Planning Department, 1995). With increasing population in Olmsted County, the need to protect and preserve open space areas deepens. This need was voiced through a public survey given to Olmsted County residents in 1995. According to the survey, 56.8% percent of county residents are very concerned about open space issues with 91.5% at least “somewhat concerned.” Furthermore, residents expressed belief that forested areas, wetlands, wildlife habitat, sand and gravel deposits, and lands with endangered species should be protected and regulated by local government (Olmsted Planning Advisory Commission, Rochester-Olmsted Planning Department, 1995). The idea
of protecting open space is further supported in the Olmsted County General Land Use Plan, which states that “the intent of the Plan is to protect important resources from being lost to development or damaged by poor management.” Olmsted County is not the only county in Minnesota that is seeking a way to preserve and protect open space areas. The Green Corridor Project in Chisago and Washington counties has paved a way for both citizens and local planners to become involved in identifying and managing open space areas. The Green Corridor Project “is dedicated to helping Chisago and Washington County residents keep the beautiful countryside, farmland, and special natural areas that make them great places to live” (1000 Friends of Minnesota, 1999). In 1998, Chisago and Washington Counties conducted a survey in which 85% of respondents said that more open space needs to be protected. So, The Green Corridor Project members embarked on a mission to propose a strategic, community-based approach to conserving land, using a geographical information system (GIS). A collaborative team of planners, experts, and local citizens were formed and criteria for open space areas were developed. Through hundreds of meetings, a ranking system for the open space evolved and was mapped using GIS. The end result of The Green Corridor Project was four incentive-based tools to retain open spaces. Donated conservation easements, purchased development rights, transferred development rights, and land acquisition programs were implemented. By forming committees, developing

3
criteria, involving the community and ranking criteria based on community input, maps of potential open spaces were formed. In addition, new programs were set in place for all future open spaces to be preserved (1000 Friends of Minnesota, 1999). This idea of involving the community in local planning using GIS is explored in a study by Emily Talen (2000), an assistant professor in the Department of Urban and Regional Planning at the University of Illinois, Urbana-Champaign. Her article, “Bottom-Up GIS”, featured in the Journal of the American Planning Association tells of the value of involving local citizens in the GIS planning process, especially when multiple factors are involved. Talen and a team of graduate students set off to test their interactive GIS with groups of citizens in Dallas, Texas. Meetings were held to discover what was liked, disliked, or desired for the surrounding Dallas communities. A set of criteria-related questions, along with organized data sets in GIS, were developed prior to the meetings. Facilitators asked questions of the residents pertaining to their communities. They replied with descriptions, evaluations, or prescriptions for positive and negative criteria pertaining to their community. For example, residents were asked to point out sites that could be built on or preserved and then asked to expand on why they chose what they did. The facilitators represented the residents’ likes and dislikes using GIS as a tool, thus creating working maps that could be updated based on new perceptions. Like the Green Corridor Project, local citizens were given a chance to shape how their communities look and feel. Talen stated
that “GIS can be used…in a way that lets residents characterize their local environment.” In addition, the State of Minnesota has adopted a statewide Metro Greenways program facilitated by the Minnesota Department of Natural Resources (MDNR). The Greenway program’s goal is to connect environmental corridors throughout the state using a GIS system. In doing so, the state will provide recreation and preservation on a statewide basis (MDNR, 2000). The Green Corridor Project, the Metro Greenways program, the “Bottom-Up GIS” study, and the apparent concern for open space in Olmsted County reflect the need to preserve our open spaces before all are subjected to endless single-family subdivisions and perpetual parking lots. GIS is a tool that can attempt to solve this growing issue in our communities. In response to the demand by the county government and citizens to protect open space areas that are in the path of development, a GIS model was developed to identify and prioritize these valuable areas in Olmsted County. The main objective of this pilot study is to evaluate and rank four types of open spaces using multi-criteria decision making based on criteria values associated with the preferences of local decision makers. It has been argued that this technique allows information on planning goals and objectives to be converted into evaluation criteria and brought into a framework that incorporates the opinion of interested groups (Massam, 1988). This study will evaluate this argument with the hope it will bring a sound decision making tool
4
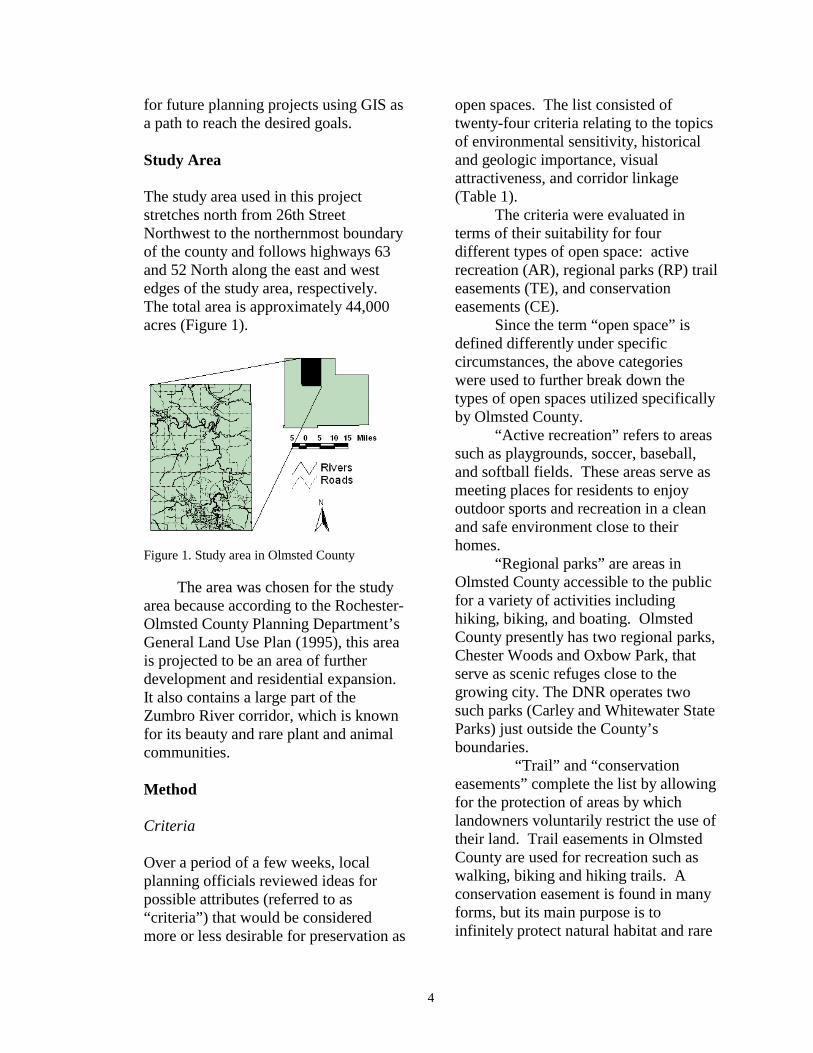
for future planning projects using GIS as a path to reach the desired goals. Study Area The study area used in this project stretches north from 26th Street Northwest to the northernmost boundary of the county and follows highways 63 and 52 North along the east and west edges of the study area, respectively. The total area is approximately 44,000 acres (Figure 1).
The area was chosen for the study area because according to the Rochester-Olmsted County Planning Department’s General Land Use Plan (1995), this area is projected to be an area of further development and residential expansion. It also contains a large part of the Zumbro River corridor, which is known for its beauty and rare plant and animal communities. Method Criteria Over a period of a few weeks, local planning officials reviewed ideas for possible attributes (referred to as “criteria”) that would be considered more or less desirable for preservation as
open spaces. The list consisted of twenty-four criteria relating to the topics of environmental sensitivity, historical and geologic importance, visual attractiveness, and corridor linkage (Table 1). The criteria were evaluated in terms of their suitability for four different types of open space: active recreation (AR), regional parks (RP) trail easements (TE), and conservation easements (CE). Since the term “open space” is defined differently under specific circumstances, the above categories were used to further break down the types of open spaces utilized specifically by Olmsted County. “Active recreation” refers to areas such as playgrounds, soccer, baseball, and softball fields. These areas serve as meeting places for residents to enjoy outdoor sports and recreation in a clean and safe environment close to their homes. “Regional parks” are areas in Olmsted County accessible to the public for a variety of activities including hiking, biking, and boating. Olmsted County presently has two regional parks, Chester Woods and Oxbow Park, that serve as scenic refuges close to the growing city. The DNR operates two such parks (Carley and Whitewater State Parks) just outside the County’s boundaries. “Trail” and “conservation easements” complete the list by allowing for the protection of areas by which landowners voluntarily restrict the use of their land. Trail easements in Olmsted County are used for recreation such as walking, biking and hiking trails. A conservation easement is found in many forms, but its main purpose is to infinitely protect natural habitat and rare
Figure 1. Study area in Olmsted County

5
communities. With continuous population growth in Olmsted County, these four types of open spaces are vital
to the community and the natural landscapes that define the county.
Table 1. The twenty-four open space criteria used in the study. The ID’s (identifiers) will be used throughout the paper to reference the criteria. SITE ATTRIBUTES RELATED TO OPEN SPACE IDsite is a long way from the nearest public park Asite itself is ugly or smelly with little potential for cleanup Bsite has potential to buffer from unattractive site Cattractive views to and from site Dsite is near to or has surface water features Esite has development constraints - flood plain Fsite has development constraints - wetlands Gsite has development constraints - blufflands Hsite has development constraints - steep slopes Isite has high agricultural use potential Jsite has high extractive use potential Ksite has high residential use potential Lsite has high commercial use potential Msite has rare communities on or adjacent to site Nsite has or is adjacent to geologic features Qsite has a wildlife corridor going through it Rsite has or is part of a large forest in good condition Ssite has another public purpose - hillside recharge Tsite has another public purpose - stormwater management Usite has another public purpose - wellhead protection Vsite has or is adjacent to a historic site Wsite has or is adjacent to an archeological site X
Organizations Four local citizen advisory organizations were involved in this study, not only as experts, but also as local citizens concerned about the fate of their environment. The County Planning Advisory Commission (PAC), the Rochester City Planning and Zoning Commission (PZC), the Oronoco Township Planning Commission (ORO), and the Rochester Committee on Urban Design and Environment (CUDE). These organizations were chosen for their local influence on zoning and environmental issues on different levels within the city of Rochester and Olmsted County.
Both the PAC and the PZC have advisory and decision making powers on local zoning issues for Olmsted County and the City of Rochester, respectively. The PAC is an appointed advisory body to the Olmsted County Board of Commissioners. The board is composed of township officers, a County Board member, and community residents (Olmsted Planning and Advisory Commission, Rochester-Olmsted Planning Department, 1995). The Oronoco Township Advisory Commission addresses township planning and zoning issues and was involved because the entire township lies within the study area chosen for the pilot study.

6
Finally, CUDE, was involved because this organization investigates environmental issues and aids city agencies in developing policies and programs to enhance the quality of life in Rochester. Due to the scope and timeframe of this project, these organizations provided a wide range of views and preferences on open space issues. The Olmsted County Environmental Commission and the Olmsted County Park Board were also approached during this study, but their results were not used due to poor response or extremely low agreement on open space issues. Gathering Data In order to accurately record and process the ranked votes given by the organizations on the open space criteria, a system of software and hardware called “OptionFinder” was used. The OptionFinder system works using hand held radio transmitters with numeric keypads, linked to a radio receiver that is in turn linked to a laptop computer. Participants respond to questions by indicating a numeric score on their keypads. As each criterion was projected on a screen, the participants were asked to score the attractiveness of that criteria for open space on a scale from one (not attractive) to six (extremely attractive). As each criterion was shown, a slide depicting that characteristic was also shown. For example, when the criteria “the site has or is adjacent to a historic site” was shown, a slide of the historic Oronoco school was displayed. Participants voted and moved to the next section. This process was repeated until each criterion was voted on for each of the four open space types.
The OptionFinder system tabulates votes for all criteria under each type of open space. Once the voting was complete, the participants were able to immediately view the results. The average scores were projected on the screen. The scores exhibited which criteria they felt were the most important, relevant, or suitable for each type of open space. As a preliminary step in the study, charts displaying high, low, and average scores were developed to examine the responses to specific criteria (Figure 2). These charts show a detailed view of how voting was distributed throughout the group. The chart shows not only the ranking according to average score, but also the level of agreement among the group. Similar charts were developed for the other organizations for each type of open space. This exercise not only allowed for discussion on the values participants attached to the open space criteria, it also allowed for fast reliable numbers to be used in a GIS. The numbers used in the OptionFinder system could quickly be transferred to a spreadsheet program, such as Microsoft Excel for further analysis. GIS is an effective way to spatially examine the expression of ideas and preferences (Talen, 2000). As in the “Bottom-Up GIS” study, not every expressed criteria or preference had spatial context. For example, site attractiveness or buffering from unattractive sites cannot easily be articulated using GIS. In contrast, criteria such as residential or commercial potential could be spatially expressed smoothly using GIS. Furthermore, the OptionFinder allows for quick transfer of data into any spreadsheet, which

7
1.00
2.00
3.00
4.00
5.00
6.00
A B C D E F G H I J K L M N O P Q R S T U V W X
Criteria
Scor
e
Figure 2. A chart showing the Rochester City Planning and Zoning Commission’s average, high, and low scores for each criteria for conservation easements. The line with circles represents the average score for the PZC participants. The triangles represent the lowest score a participant voted and the square the highest vote. The chart is used to view the overall distribution of votes.
speeds up the process of ranking and mapmaking. In terms of validity, vague questions asked of citizens about open space criteria “can be made much more spatially specific in a GIS context, and therefore, one could argue, more meaningful” (Talen, 2000). In addition, a study on the evolution of spatial representations between many actors in the Journal of Geographic Information and Decision Making states that “only the representations of the environment, by the effective decision makers, can induce reality at the end” (Ferrand, 1980). All of the averaged numbers from the four organizations were, again, averaged to produce one composite score for each criteria for each type of open space (Table 2). These raw scores represent the overall preferences on open space for these organizations.
Using the Rochester-Olmsted Planning Department’s GIS data, data layers were created based on association with the criteria in Table 1. All data layers and analyses were completed using the Environmental Systems Research Institute’s (ESRI) ArcView GIS software. Each criteria in Table 1 was studied and attached to spatial data in ArcView. Many different ArcView extensions and tools were used to develop the final layers. The buffer tool was used to draw boundaries, or buffers, at specific distances around features in the data layers. The County Biological Survey data (CBS) was buffered 300 ft, the feedlot sites were buffered 1000 ft, and the surface water features were buffered 100 ft. The buffers were then

8
Table 2. Indicates the total averages for all four open space types from all four groups polled (one, not attractive to six, extremely attractive). These numbers were attached to spatial data layers in GIS for the final mapping process. The ID references Table 1 criteria used in the study.
Total Total Total TotalID AR RP TE CEA 3.7 3.8 3.7 4.2B 1.4 1.5 1.6 2.1C 3.5 3.5 3.9 3.8D 4.2 5.2 4.6 3.8E 4 5.1 4.5 4.3F 3.3 4.3 4 4.3G 2.4 4 2.8 4.5H 2.4 4.9 3.9 4.8I 2.1 4.3 3.6 4.7J 2.1 2.1 2.4 2.7K 2.1 2.3 2.5 2.5L 4.3 3 3.9 2.5M 2.3 1.9 2.8 2.3N 2.2 3.8 2.9 4.4Q 2.8 4.7 4 4.6R 2.3 4.7 4.2 4.9S 2.2 4.8 4.4 4.9T 1.9 3.6 3.2 4.4U 2.7 4.3 3.9 4.3V 2.9 3.7 3.2 4.1W 3.2 4.7 4.7 3.8X 1.9 3.5 2.5 4.3
used as new data layers for further analysis. These distance buffers were based on expert opinion from the DNR, Winona County Planning, and the Rochester-Olmsted Planning Department. Due to accuracy issues voiced by planning and DNR officials, soils data rather than the National Wetlands Inventory (NWI) data was used to map wetland areas. Wetland soil areas that were located in pasture, forest, or water land cover areas were given the highest score. The wetland soils that were
located in cropland had a point subtracted from the total, since cropland may or may not contain the original wetland. Areas that were already protected, such as DNR Scientific and Natural Areas and public parks, were also mapped using parcel data and tax codes from the county assessors office and pre-mapped areas. Commercial and residential sites were also mapped using the parcel data. Areas of extraction potential and geologic features were mapped using the sand and gravel deposit theme from the Olmsted County’s Geologic Atlas. Areas of extraction activities were concentrated in the primary deposits, while geologic features were most likely found in the upland deposits, according to Jeff Green, DNR Hydrologist. Mapping the agricultural areas was completed using parcel and land use data. ESRI’s ArcView Xtool extension was used to update the cropland areas. Within the Xtool extension is a command that allows a person to erase parts of one data layer based on another data layer. All of the 1992 cropland that overlapped current residential and commercial parcels were erased using the ArcView Xtool extension. The remaining themes: landfills, floodplains, forests, historic sites, and wellhead protection areas were not altered in the final mapping. ArcView’s Geoprocessing extension was used on these data layers to retain only the data that is contained in the study area. This is called clipping, which results in a new data layer, in which features from the original layers are cut to the boundaries of the study area. Once all nineteen themes were created, they were converted into raster files using ESRI’s Spatial Analyst

9
extension in ArcView. When working with data that changes gradually, has indistinct borders, or is mixed together, Spatial Analyst is used to convert the layers into raster data layers. Raster divides the data layers into a matrix of equally sized square cells. Each cell stores a numeric value that is chosen by the user. In this case, the numbers entered are from Table 2. In order to assure the best possible accuracy and ease in future analysis, a 30-foot cell size was used for all data layers and all areas were clipped to the study area using Spatial Analyst. Without uniform clipping, “nodata” values appear in the final raster data layers that cannot be read by Spatial Analyst. As a last step, four new fields were added to each raster data layer, one for each type of open space (AR, active recreation, RP, regional parks, TE, trail easements, and CE, conservation easements). Analysis A series of four overlay analyses on the new fields were completed. The overlay analysis was done using ArcView’s Spatial Analyst extension, which enables users to efficiently perform the overlay analysis needed in this project. Overlay analysis can be a difficult process, but GIS allows for an easy way to execute the task. A GIS is capable of performing automated overlay analysis that applies to intervariable relationships created by overlaying or stacking two or more data layers (Avery, 1992). The process of using the raw scores, with no additional weighting measures, to indicate areas suited for specific types of open spaces is referred to as the Single Additive Weighting Model (SAW) (Massam
1988). Hwang and Yoon (1981) suggest that the “simple additive weighting (SAW) method is probably the best known and very widely used method of Multi-Attribute Decision Making.” While some might contest the legitimacy of using a simple additive function for combining impacts in order to obtain a single value, it has been argued by Hwang and Yoon (1981) that “theory, computations, and experience all suggest that the SAW method yields extremely close approximations…while remaining far easier to use and understand.” For those who rely on the use of the SAW to tackle a plan, it is most important that clear recognition of the potential errors be incorporated into the study (Massam, 1988). Thus, in order to verify ranking and accuracy between groups, diversity scores and Spearman Rank correlations were performed on the data. These analyses allowed the groups to quantify their disagreements on open space criteria (Table 1) and validate the correlation of thinking between groups and the final suitability maps. Diversity scores (calculated as the ratio of actual to maximum possible variance) were derived using the OptionFinder system. Following each voting session, the diversity scores for each criteria under each type of open space were calculated. For example, for a group of six participants, a diversity score of 100% meant that three people voted “one” and three people voted “six”, the maximum level of disagreement. The scores allowed the group to see the amount of agreement and disagreement on a given criteria for each open space type. As an example of the four diversity charts created, Figure 3 shows the Olmsted County Planning Advisory Commission’s diversity scores.

10
0 .0
10 .0
20 .0
30 .0
40 .0
50 .0
A B C D E F G H I J K L M N Q R S T U V W X
C rite ria
Perc
ent D
isag
reem
ent
Figure 3. The diversity scores for the Olmsted County Planning Advisory Commission voting. The Criteria represent the individual ID’s from Table 1. The solid black bar represents active recreation (AR), light gray is regional parks (RP), speckled is trail Easements (TE) and the sideways slash is conservation easements (CE). The chart is used to reflect the disagreement for each criteria for each type of open space. Furthermore, the scores were the basis for discussion on how the group would judge future planning, environmental, and zoning projects. Areas where they disagree can be further discussed and researched in order to facilitate consistency within the group. In this study a disagreement of thirty percent or more was considered poor, based on the experience of the Rochester-Olmsted Planning Department. The PAC had 18.7% of their scores above 30% disagreement (Figure 3). This is figured as a total of all bars on the chart. Out of the 18.7%, trail easements ranked most often above 30%. Among the criteria that caused the higher trail easement disagreement were wetlands, slope, residential areas, geologic features, forests, storm water management, and archeological areas. The PZC had 10.4% of their scores above 30%. Active recreation scores ranked the most often above 30% with
agriculture, geologic features, wellhead protection, and historic areas causing the high disparity. CUDE also displayed the most discrepancy regarding active recreation with 20.8% of their scores above 30% disagreement. Numerous criteria contributed to this disagreement. Oronoco Township had 18.7% of their scores above 30%. Conservation easement open space faced the most disagreement. Overall, 17.1% of all diversity scores for all four organizations represent those areas over 30% disagreement. This percentage is extremely low and is a key factor concluding the accuracy in the final suitability maps. In other words, the low disagreement within groups and between groups means that the final suitability maps are a positive representation of thoughts and concerns of the groups. Furthermore, the diversity scores are a tool for organizations to explore their

11
agreements and disagreements on open space issues. This aspect will be discussed in a later section. A Spearman Rank correlation analysis was also completed as part of the error testing suggested by Massam (1988, 1999). Very commonly in GIS, data is ordinal rather than interval or ratio in scale. This either arises because the original data are themselves based on rankings, or ratio or interval data has been transformed into ranks in producing a map. The appropriate correlation measures for such data are the Spearman’s Rank correlations (Bonham-Carter 1994). Tables 3a-d shows the final correlations between organizations. Tables 3a-d Correlations for active recreation (AR) (a), regional parks (RP) (b), trail easements (TE) (c), and conservation easements (CE) (d) between groups in the study. All correlations are at .001 significance or greater, unless indicated otherwise. Table 3a.
Ar PAC Ar Oro Ar CUDE Ar PZCAr PAC 1 0.646 0.682 .482**Ar Oro # 1 0.686 0.794Ar CUDE # # 1 0.708Ar PZC # # # 1 ** Significant at .01 Table 3b.
Rp PAC Rp Oro Rp CUDE Rp PZCRp PAC 1 0.698 0.777 0.617Rp Oro # 1 .605* 0.696Rp CUDE # # 1 0.764Rp PZC # # # 1 *Significant at .0025 Table 3c.
Te PAC Te Oro Te CUDE Te PZCTe PAC 1 0.791 0.721 0.744Te Oro # 1 0.695 0.763Te CUDE # # 1 0.619Te PZC # # # 1
Table 3d. Ce PAC Ce Oro Ce CUDE Ce PZC
Ce PAC 1 0.769 0.805 0.844Ce Oro # 1 0.777 0.629Ce CUDE # # 1 0.697Ce PZC # # # 1 This correlation permits a comparison of strength of spatial associations between one ranking from one organization and a second ranking from another organization. According to Bonham-Carter (1994), these inter-ranking correlation measures are generally useful for exploring relationships rather than confirming them. Not only can organizations explore disagreements internally, they can explore external relationships as well. Organizations on a city, township and county level with a clear vision will serve the community in such a way that will benefit all citizens. Since most correlations between the groups are .60 or greater and are significant at .001, it can be assumed that the output maps produced from these scores are reliable representations of the likes and dislikes between groups. An exception is the score of .482 for active recreation between the PAC and PZC, which is less significant (.01) when studied in conjunction with the remaining high correlations. The regional park correlation between CUDE and ORO is significant at .0025, which is also less than the other correlations. But, it is still highly significant. The rankings leading to the two lower correlations between open space scores should be discussed further. Using the diversity scores and high/low charts, groups can get a detailed picture of their disagreements. Discussion of these disagreements may improve the correlations among groups.

12
All Criteria Averages
Active Recreation Averages
6.03.51.0
Con
serv
atio
n E
asem
ent A
vera
ges
6.0
3.5
1.0
X
WV
UT
SRQ
N
MLK
J
I HG
F E
DC
B
A
All Criteria Averages
Trail Easement Averages
6.03.51.0
Activ
e Re
crea
tion
Aver
age
6.0
3.5
1.0
X
WV
U
TSR
Q
NM
L
KJ IHG
F
ED
C
B
A
All Criteria Averages
Regional Park Averages
6.03.51.0
Activ
e R
ecre
atio
n Av
erag
es
6.0
3.5
1.0
X
WV
U
TSR
Q
NM
L
KJ IHG
F
ED
C
B
A
All Criteria Averages
Conservation Easement Averages
6.03.51.0
Regi
onal
Par
k A
vera
ges
6.0
3.5
1.0
X
W
V
U
T
SRQ
N
M
L
KJ
I
H
GF
ED
C
B
A
Simplifying the Open Space Analysis Categorizing open space in Olmsted County reveals interesting relationships between the categories. When the final criteria averages for all four organizations are presented in scatterplots, distinct relationships between open space areas are exposed. Figures 4a-4f represent all possible relationships between open spaces. Any criteria falling in the upper right box is considered attractive for both types of open spaces. A criteria that falls in the lower left box is considered to be less attractive for both types of open space.
Figure 4a. Scatterplot depicting criteria ranking relationships between conservation easements and active recreation open spaces. Criteria ID’s fall within four areas, thus showing whether or not the same criteria is good for both open spaces (1=not attractive, 6=extremely attractive).
Figure 4b. Scatterplot depicting criteria ranking relationships between trail easement and active
recreation open spaces. Criteria ID’s fall within four areas, thus showing whether or not the same criteria is good for both open spaces (1=not attractive, 6=extremely attractive).
Figure 4c. Scatterplot depicting criteria ranking relationships between regional park and active recreation areas. Criteria ID’s fall within four areas, thus showing whether or not the same criteria is good for both open spaces (1=not attractive, 6=extremely attractive).
Figure 4d. Scatterplot depicting conservation easement and regional park open spaces. Criteria ID’s fall within four areas, thus showing whether or not the same criteria is good for both open spaces (1=not attractive, 6=extremely attractive). The first three scatterplots demonstrate that the different types of open space show significant differences in suitability based on the suitability criteria used. A number of types of sites would be highly suitable for conservation easements but not well suited for active recreation (Figure 4a).

13
All Criteria Averages
Trail Easement Averages
6.03.51.0
Reg
iona
l Par
k A
vera
ges
6.0
3.5
1.0
X
W
V
U
T
SRQ
N
M
L
KJ
I
H
GF
ED
C
B
A
All Criteria Averages
Conservation Easement Averages
6.03.51.0
Trai
l Eas
emen
t Ave
rage
s
6.0
3.5
1.0
X
W
V
U
T
SR
Q
NM
L
K J
IH
G
F
ED
C
B
A
Thus, suitability for some types of open space usually cannot be used to predict suitability of any of the other types of open spaces.
Using this technique allows for visual representation of possible connections between open space views. If two types of open spaces share the same distribution of criteria, then they could be combined into a single category. This could be helpful if dealing with tight deadlines and shortened meeting periods. Another model might not have the same results. Figure 4d clearly represents a predictive nature between regional park and conservation easement areas. Criteria B, M, K, L, and J are unattractive for both and the remaining criteria were considered attractive for both. Thus, according to the final averages, regional park and conservation easement areas are scored alike and can be used to predict one another using the SAW model. Figures 4e and 4f show a less predictive relationship. Although most criteria between the areas are similar, there are still six to seven criteria that are different. Thus, caution must be taken if combining these open space types into a single category.
Figure 4e. Scatterplot depicting trail easement and conservation easement open spaces. Criteria
ID’s fall within four areas, thus showing whether or not the same criteria is good for both open spaces (1=not attractive, 6=extremely attractive).
Figure 4f. Scatterplot depicting criteria ranking relationships between the regional park and trail easement open spaces. Criteria ID’s fall within four areas, thus showing whether or not the same criteria is good for both open spaces (1=not attractive, 6=extremely attractive). Reviewing all six relationships reveals the reasoning behind choosing four different types of open spaces. The only relationship that can clearly be used for a predictive purpose is the RP and CE relationship (Figure 4d). Figures 4e and 4f also represent close relationships that could be used for predictive purposes, but there would be more error in that decision. Results ArcView’s Spatial Analyst was used to produce four different maps based on the composite averages between the organizations.

14
The active recreation map (Figure 5) is different from the remaining three maps, due to the desire to have playgrounds near residential areas rather than removed from developed areas. The regional park (Figure 6), trail easement (Figure 7) and conservation easement (Figure 8) maps are similar in the sense that all three have high suitability sites that are closely related and located in close proximity to each other.
Figure 6. Regional park suitability At present, Olmsted County has only two regional parks, Chester Woods with
1335 acres of natural land for many types of recreation and Oxbow Park with 570 acres for family recreation that is situated close to the city. Most of the highly suitable areas are found along the Zumbro River corridor with a few sites near the town of Oronoco. Although none of the sites are of the magnitude of Chester Woods, there remain many areas that could serve as smaller natural oases for the public to visit and recreate. It is probable that additional regional park sites will be identified through a countywide open space plan. As Rochester’s population grows, so does the trail system throughout the city.
Figure 7. Trail easement suitability The trail easement map shows a distinct corridor stretching from Rochester’s already popular parks to the northern tier of the county. This is useful information for planners working on future trail easement projects. A system of trails extending through the countryside could bestow economic and recreational growth to other areas of the county. Finally, conservation easement suitability depicts large areas
Figure 5. Active recreation suitability

15
surrounding the Zumbro River corridor. Since most of the rare plant and animal
Figure 8. Conservation easement suitability communities reside in these areas, conservation easements are applicable here. Much of the areas are also part of large intact oak forests that are considered high in biodiversity value, according to the Minnesota Biological Survey data. Remnant native plant communities may not tolerate high levels of recreational use, but are suited for open space protection through conservation easements. The results of the four maps are considered accurate and justifiable. Since only 17.1% of all diversity scores were above 30% disagreement and the correlations between groups are highly significant at .001, it can be strongly stated that these maps represent the thoughts, ideas, and perceptions of the members of the four groups that were involved. The maps represent the outcome of using a GIS ranking system to link citizens, technology, and planning policy. Discussion
A number of conclusions and recommendations can be drawn from this pilot study. Ideas on future analysis, weighting scales, combinations, and public involvement are discussed in the following section. Suggestions A clear visual adjustment to the project would be to add in a majority neighborhood analysis to the final maps. Neighborhood analysis completed using Spatial Analyst will eliminate small cells that are irrelevant to the study and smooth out the larger areas. Less time will be spent reviewing small unlikely patches of open space and more time spent on researching the larger intact areas. A key to this study is the weighting scale used. This study used the SAW model as suggested by Massam (1988) and Hwang and Yoon (1991). Although the model returned positive results, improvements could be sought out. An index overlay model, also called a multiplicative model, as described by (Bonham-Carter, 1994) might yield better results. This technique assumes that map features occurring in each input theme are assigned ranks, as well as the themes themselves receiving different multipliers. The added multipliers for each theme can be suggested by planning staff or by the voters. The multipliers can then be used after the individual feature ranking has taken place. The index overlay model allows for a more flexible approach in ranking multiple criteria. The tables of ranks and the theme mulitpliers can be adjusted to reflect the judgement of experts and citizens alike (Bonham-Carter,1994 ).

16
Furthermore, the multiplier aids in producing well-defined maps that clearly depict the important areas for open space. For example, some heavily wooded areas were chosen as appropriate sites for active recreation. These wooded areas could be eliminated from the high ranking by assigning a high weight to the residential theme. The resulting map would represent more desirable criteria in two different ways. Active recreation would be located closer to residential areas, which is a priority. The high ranked areas would also consist of more open areas where trees will not have to be striped from the land. Another outcome of this study was the relationship between open spaces as interpreted in Figures 4a-4f. The only relationship with a 100% positive correlation was between regional park and conservation easement areas. Thus, these two open space types could be joined into one category in the future. The remaining relationships are different enough that retaining the separate types is advisable. In contrast, the multiplicative model (index overlay) could change the scatterplots in such a way that regional parks and conservation easements could remain in separate categories. The model chosen, along with professional opinion, will determine whether or not combining will take place. Finally, it can be said that the results of analysis such as correlation and diversity scores yield discussion on open space topics by organizations. In this study, four important local decision making groups gave their input on open space issues. It would be nice to say that all levels of government are similar in thinking when it comes to environmental decisions such as open space.
Unfortunately, this was not the case. Correlation and diversity measures show a different picture for Olmsted County. Within groups there is clear evidence of disagreement regarding the importance of certain criteria. For example, wetlands seem to be an area of discrepancy for each organization. Why? This can only be answered by further discussion within the group. These charts can be a tool to facilitate discussions and enable the group to become more consistent in their policies, resulting in more well informed recommendations on issues pertaining to the future of Olmsted County. In addition, these analyses show discrepancy between groups on certain criteria for different open spaces. While the PAC thinks that agricultural areas should not be incorporated into conservation easements, the Oronoco Township Planning Commission and the PZC are uncertain whether these areas should be included in conservation easements. This is only one example of disagreements between city, county, and township groups. Although the correlation and diversity scores are good, there is room for improvement and improvement can begin with discussion on these opposing views within each group. Indeed, few conflicts involving social and political values are ever fully removed. Such conflicts of interest are managed through discussion and tested, in order to judge the utility of the multi-criteria ranking system. It would be the objective of this type of project to “maximize agreement among the interest groups” (Massam, 1988). None of the groups applying their judgments for the types of open space had access to the maps shown above. As a next step, the maps could be treated as intermediate products, so that

17
the groups could discuss not only their internal disagreements and their disagreements with other groups, but also the geographic implications of the rankings they came up with. The maps themselves would then inform the group discussion process refining their conclusions. Conclusion There are many benefits to using GIS in a multi-criteria arena with local involvement. Discussions of values and preferences are made spatially specific in GIS. The spatial implications of specific values for local open space issues are revealed. The interactive process involved in expressing views and preferences may deepen the exploration of issues, allowing local citizens and decision makers to articulate ideas that were previously unexplored. GIS, in fact, may legitimize individual expression by giving it a technical edge. Local citizens’ perceptions are elevated to the level of database themes that are at the core of GIS (Talen, 2000). Concern for the future of Olmsted County’s open spaces deepens as time progresses and more land is converted to development. The birth of new programs throughout Minnesota, such as Minnesota’s Smart Growth Initiative, which helps communities “work for smart or responsible growth” (Minnesota Environmental Quality Board, 2000), show the desire for a responsible and accurate open space modeling system The use of GIS in determining the future of Minnesota open space has great potential. The Green Corridor Project, Minnesota Greenways, Olmsted County’s General Land Use Plan, Goodhue County’s open space pilot
study, and the Smart Growth Initiative are just a few examples of how important preserving open space is to local citizens and the government. GIS along with public input can help provide a framework to identify these precious places. From the standpoint of people who are interested in how their township or county will look and feel in 20 years, as a place in which to live, possibly the most important aspect of the open space model is the opportunity it offers to create a network of protected lands (Ardent, 1996). People in Olmsted County, through the aid of GIS, have within their reach the chance to create a true fabric of open space that flows among any number of rural, suburban, and urban areas. Without such an approach, wildlife habitat will continue to dwindle, opportunities to connect informal neighborhood trails into an area-wide greenway system will be lost forever, and the chance for hiking, biking and fishing in regional parks and playgrounds will diminish.
GIS can be a critical unifying element, a tool that can be applied by planning staff, landowners, local decision making bodies, and citizens. Using appropriate modeling techniques, educated citizens and organizations, statistical backup, and a willingness to blend all ideas together, an open space model can work effectively to preserve our open spaces for wildlife and humans alike. Acknowledgements Many thanks to the Rochester-Olmsted Planning Department staff for their technical and financial support on this project. Another thanks goes to the

18
Olmsted County Planning Advisory Commission, the City Planning and Zoning Commission, the Oronoco Township Advisory Commission, the Rochester Committee on Urban Design and Environment, the Olmsted County Park Board, and the Environmental Commission for their input into the project. Without them, it would not have been possible. Thanks to St. Mary’s University for their continuing support and to Phil Wheeler for making it all happen. References Arendt, Randall. 1996. Conservation Design for Subdivisions: A Practical Guide to Creating Open Space Networks. Island Press: Washington. Avery, T.E. 1992. Fundamentals of Remote Sensing and Airphoto Interpretation. Prentice-Hall: New Jersey. Bonham-Carter, G. 1994. Geographic Information Systems for Geoscientists. Pergamon: Canada. Francis, C., Marcus, C. 1997. People Places. Island Press: New York. Hwang, C.L, Yoon, K. 1981. Multi- Attribute Decision Making. Spring Verlag: New York. Massam, Bryan H. 1999. The Classification of Quality of Life Using Multi-criteria Analysis. Journal Of Geographic Information and Decision Analysis 3: 1-8. Massam, Bryan H. 1988. Multi-criteria Decision Making (MCDM) Techniques in Planning. Progress in Planning 30: 1-81. Minnesota Department of Natural Resources (MDNR). 2000. Minnesota Greenways: Some Answers. Report, Minnesota DNR 2 pp.
Minnesota Environmental Qualtiy Board. 2000. From Policy to Reality Model Ordinances for Sustainable Development. Biko Associates, Inc. 1-22 pp. Olmsted County Planning Advisory Commission, Rochester-Olmsted Planning Department. 1995. General Landuse Plan. Rochester-Olmsted Planning Department: Rochester. 1-133 pp. 1000 Friends of Minnesota. 1999. Planning for Open Space Conservation In Your Community: The Green Corridor Project Shares Its Lessons. Report, Green Corridor Project. 20 pp. Talen, Emily. 2000. Bottom-Up GIS. Journal of the American Planning Association. 66: 279-294. Suggestions for further reading American Society of Planning Officials.
1963. Special Zoning Districts for Open Space. Report, Planning Advisory Service. 75pp.
Girling, Cynthia L. 1994. Yard, Street, Park: The Design of Suburban Open Space. J. Wiley. New York. Heckscher, August. 1977. Open Spaces: The Life of American Cities. Harper and Row. New York. Steiner, Frederick. 1991. The Living Landscape. McGraw Hill. New York. Tkach, Robert J. 1997. A New Approach to Multi-criteria Decision Making in Water Resources. Journal Of Geographic Information and Decision Analysis. 1: 25-43.

19

20

21

22

23