moore county gis interactive map - test… · 1 moore county gis interactive map (revised...
TRANSCRIPT
1
Moore County GIS Interactive Map (Revised 08/17/2016)
Website Path: http://www.moorecountync.gov/gis
Click on Interactive Mapping on the left.
Table of Contents
Website Layout Reference Guide .......................................................................... Page 2
Main Toolbar – Detail Description .......................................................................... Page 3
Step-by-step Instructions
Zoom In, Zoom Out, Pan ............................................................................ Page 4
Identify ....................................................................................................... Page 5
Buffer ......................................................................................................... Page 6
Turn Layers On/Off .................................................................................... Page 7
Search Options .......................................................................................... Page 7
Quick Search ........................................................................................ Page 7
Helpful Hint: How to display more results ................................. Page 8
Advanced Search ................................................................................. Page 9
Coordinate Search................................................................................ Page 10
Comparable Search .............................................................................. Page 10
Mailing Labels ............................................................................................ Page 11
Measure ..................................................................................................... Page 12
Draw (add graphics) ................................................................................... Page 12
Print or Email Map ...................................................................................... Page 13
View Pictometry Data ................................................................................. Page 14
Moore County GIS Department
P.O. Box 905, 302 S McNeill Street, Carthage, NC 28327 Telephone: (910) 947-1078 • Fax: (910) 947-2313
2
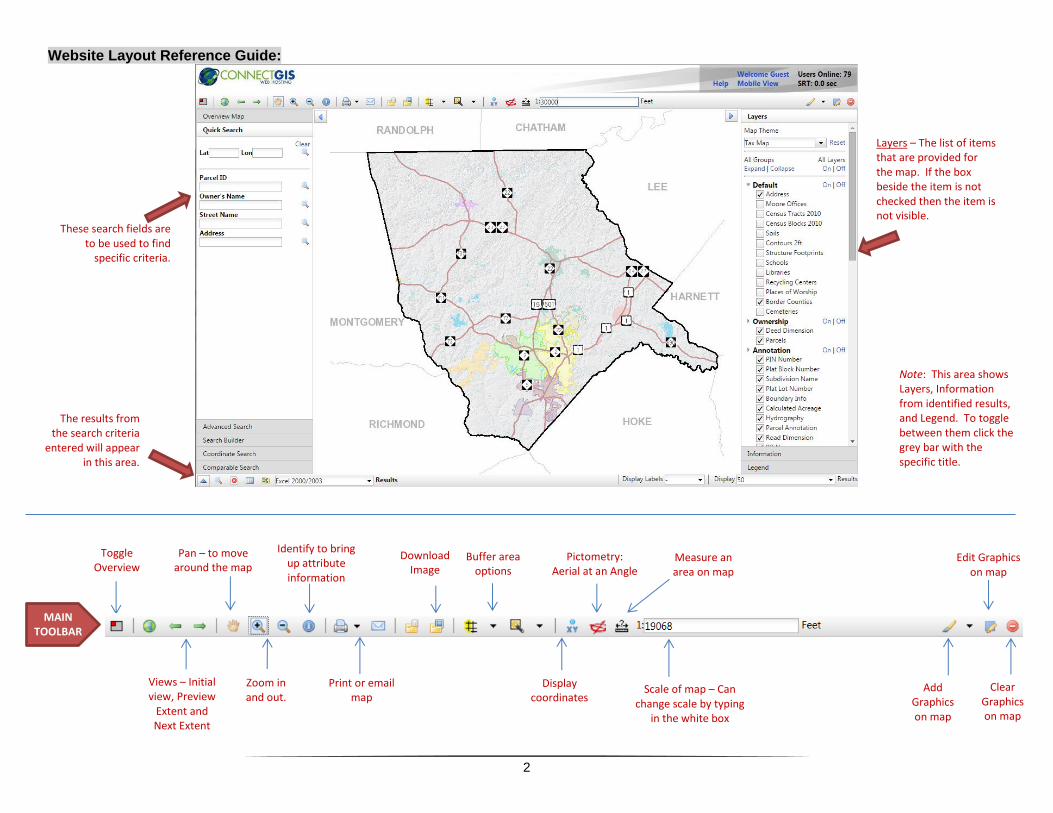
Website Layout Reference Guide:
These search fields are to be used to find
specific criteria.
The results from the search criteria
entered will appear in this area.
Toggle Overview
Views – Initial view, Preview
Extent and Next Extent
Pan – to move around the map
Zoom in and out.
Identify to bring up attribute information
Print or email map
Buffer area options
Display coordinates
Measure an area on map
Clear Graphics on map
Scale of map – Can change scale by typing
in the white box
Edit Graphics on map
Layers – The list of items that are provided for the map. If the box beside the item is not checked then the item is not visible.
MAIN TOOLBAR
Add Graphics on map
Note: This area shows Layers, Information from identified results, and Legend. To toggle between them click the grey bar with the specific title.
Download Image
Pictometry: Aerial at an Angle
3
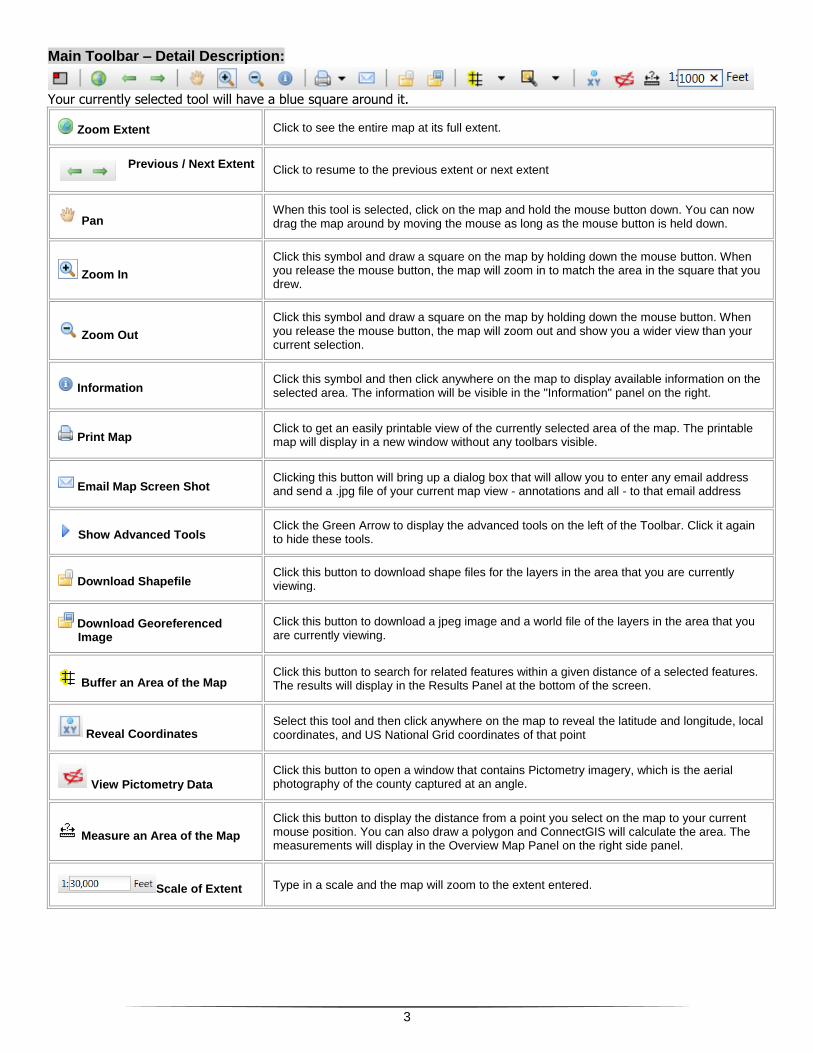
Main Toolbar – Detail Description:
Your currently selected tool will have a blue square around it.
Zoom Extent Click to see the entire map at its full extent.
Previous / Next Extent Click to resume to the previous extent or next extent
Pan When this tool is selected, click on the map and hold the mouse button down. You can now drag the map around by moving the mouse as long as the mouse button is held down.
Zoom In
Click this symbol and draw a square on the map by holding down the mouse button. When you release the mouse button, the map will zoom in to match the area in the square that you drew.
Zoom Out
Click this symbol and draw a square on the map by holding down the mouse button. When you release the mouse button, the map will zoom out and show you a wider view than your current selection.
Information Click this symbol and then click anywhere on the map to display available information on the selected area. The information will be visible in the "Information" panel on the right.
Print Map Click to get an easily printable view of the currently selected area of the map. The printable map will display in a new window without any toolbars visible.
Email Map Screen Shot Clicking this button will bring up a dialog box that will allow you to enter any email address and send a .jpg file of your current map view - annotations and all - to that email address
Show Advanced Tools Click the Green Arrow to display the advanced tools on the left of the Toolbar. Click it again to hide these tools.
Download Shapefile Click this button to download shape files for the layers in the area that you are currently viewing.
Download Georeferenced Image
Click this button to download a jpeg image and a world file of the layers in the area that you are currently viewing.
Buffer an Area of the Map Click this button to search for related features within a given distance of a selected features. The results will display in the Results Panel at the bottom of the screen.
Reveal Coordinates Select this tool and then click anywhere on the map to reveal the latitude and longitude, local coordinates, and US National Grid coordinates of that point
View Pictometry Data
Click this button to open a window that contains Pictometry imagery, which is the aerial photography of the county captured at an angle.
Measure an Area of the Map
Click this button to display the distance from a point you select on the map to your current mouse position. You can also draw a polygon and ConnectGIS will calculate the area. The measurements will display in the Overview Map Panel on the right side panel.
Scale of Extent Type in a scale and the map will zoom to the extent entered.

4
Zoom In, Zoom Out, & Pan:
Zoom Extent Click to see the entire map at its full extent.
Previous Extent
Next Extent
Click to resume to the previous extent or next extent.
Pan
When this tool is selected, click on the map and hold the mouse button down. You can now drag the map around by moving the mouse as long as the mouse button is held down.
Zoom In
Click this symbol and draw a square on the map by holding down the mouse button. When you release the mouse button, the map will zoom in to match the area in the square that you drew.
Zoom Out
Click this symbol and draw a square on the map by holding down the mouse button. When you release the mouse button, the map will zoom out and show you a wider view than your current selection.
When zooming in and out draw a box that looks like the red outlined box below.
5
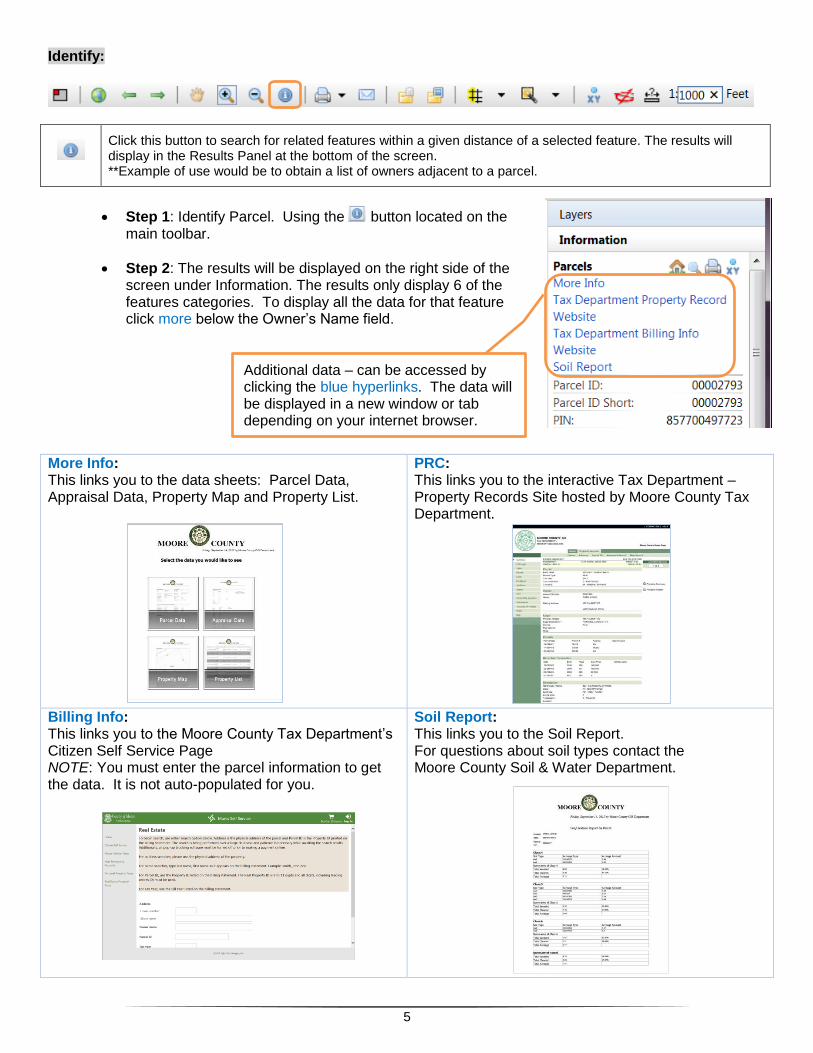
Identify:
Click this button to search for related features within a given distance of a selected feature. The results will display in the Results Panel at the bottom of the screen. **Example of use would be to obtain a list of owners adjacent to a parcel.
Step 1: Identify Parcel. Using the button located on the main toolbar.
Step 2: The results will be displayed on the right side of the screen under Information. The results only display 6 of the features categories. To display all the data for that feature click more below the Owner’s Name field.
More Info: This links you to the data sheets: Parcel Data, Appraisal Data, Property Map and Property List.
PRC: This links you to the interactive Tax Department – Property Records Site hosted by Moore County Tax Department.
Billing Info: This links you to the Moore County Tax Department’s Citizen Self Service Page NOTE: You must enter the parcel information to get the data. It is not auto-populated for you.
Soil Report: This links you to the Soil Report. For questions about soil types contact the Moore County Soil & Water Department.
Additional data – can be accessed by clicking the blue hyperlinks. The data will be displayed in a new window or tab depending on your internet browser.
6
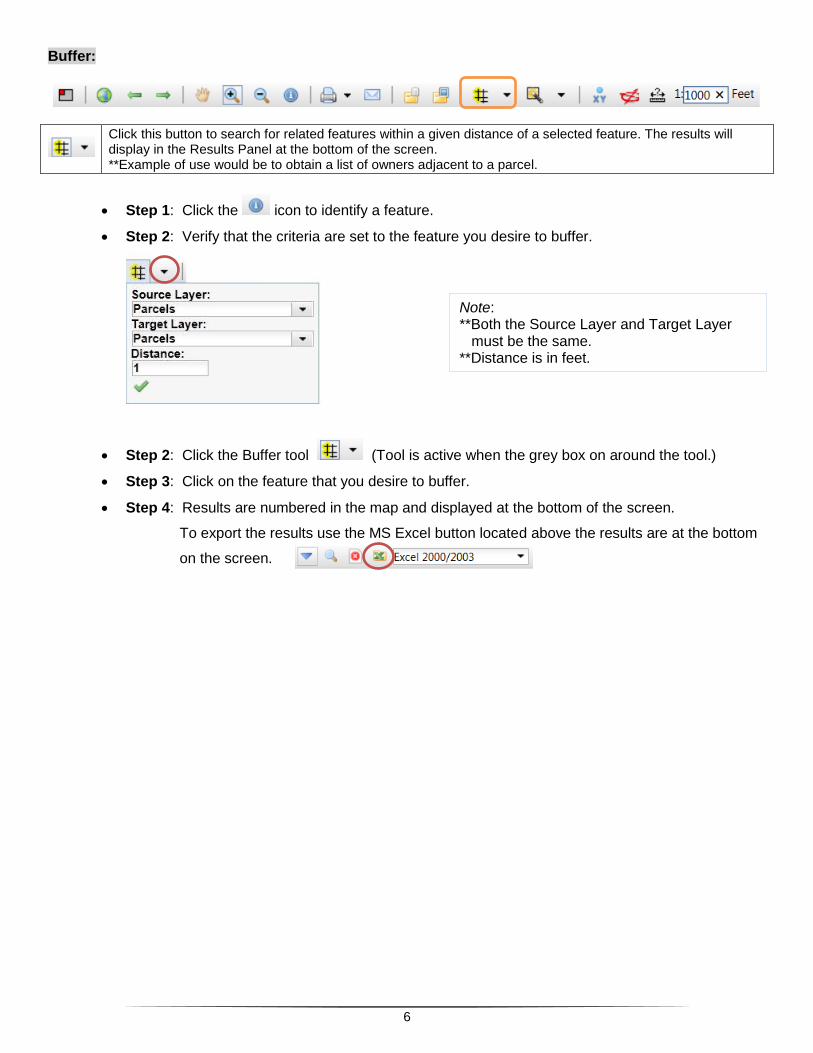
Buffer:
Click this button to search for related features within a given distance of a selected feature. The results will display in the Results Panel at the bottom of the screen. **Example of use would be to obtain a list of owners adjacent to a parcel.
Step 1: Click the icon to identify a feature.
Step 2: Verify that the criteria are set to the feature you desire to buffer.
Step 2: Click the Buffer tool (Tool is active when the grey box on around the tool.)
Step 3: Click on the feature that you desire to buffer.
Step 4: Results are numbered in the map and displayed at the bottom of the screen.
To export the results use the MS Excel button located above the results are at the bottom
on the screen.
Note: **Both the Source Layer and Target Layer
must be the same. **Distance is in feet.
7
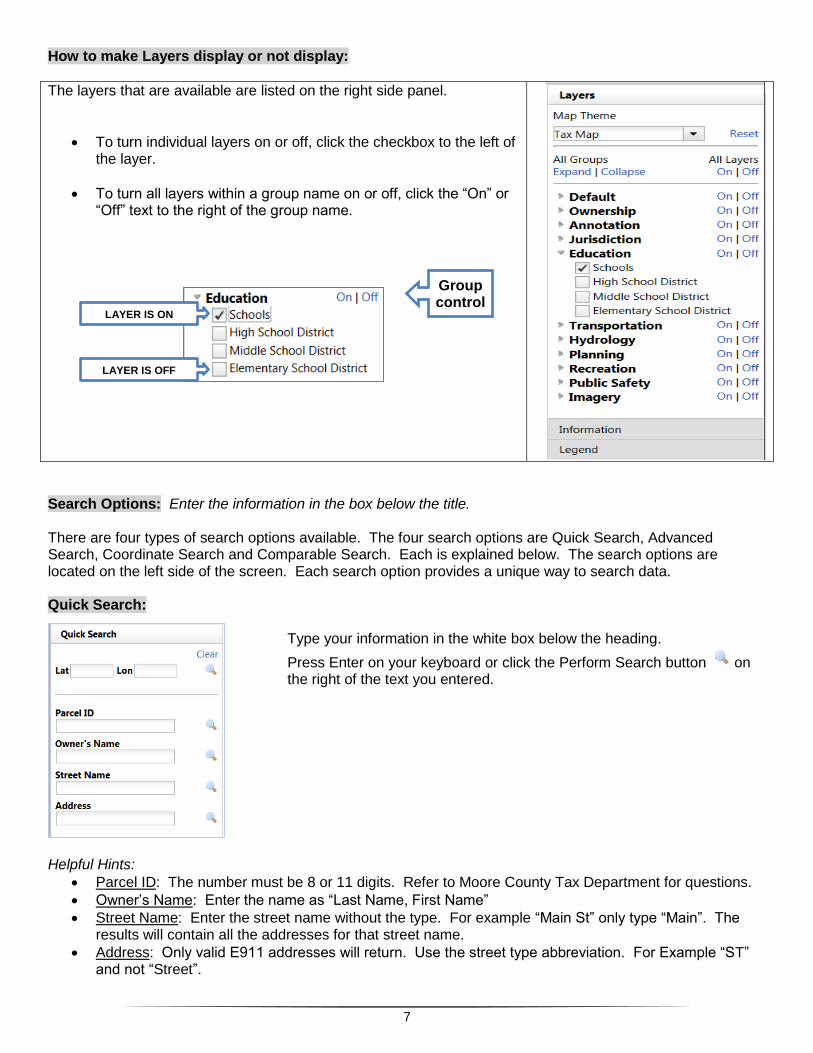
How to make Layers display or not display:
The layers that are available are listed on the right side panel.
To turn individual layers on or off, click the checkbox to the left of the layer.
To turn all layers within a group name on or off, click the “On” or “Off” text to the right of the group name.
Search Options: Enter the information in the box below the title. There are four types of search options available. The four search options are Quick Search, Advanced Search, Coordinate Search and Comparable Search. Each is explained below. The search options are located on the left side of the screen. Each search option provides a unique way to search data. Quick Search:
Type your information in the white box below the heading.
Press Enter on your keyboard or click the Perform Search button on the right of the text you entered.
Helpful Hints:
Parcel ID: The number must be 8 or 11 digits. Refer to Moore County Tax Department for questions.
Owner’s Name: Enter the name as “Last Name, First Name”
Street Name: Enter the street name without the type. For example “Main St” only type “Main”. The results will contain all the addresses for that street name.
Address: Only valid E911 addresses will return. Use the street type abbreviation. For Example “ST” and not “Street”.
Group control
LAYER IS ON
LAYER IS OFF
8
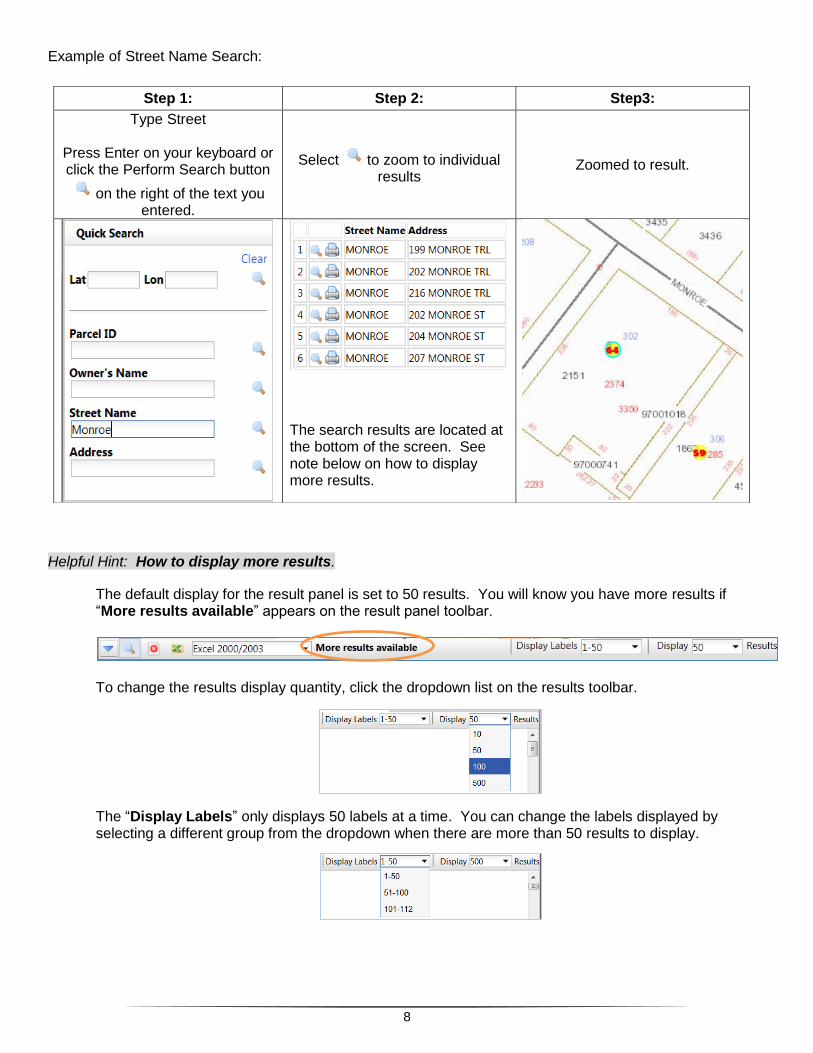
Example of Street Name Search:
Helpful Hint: How to display more results.
The default display for the result panel is set to 50 results. You will know you have more results if “More results available” appears on the result panel toolbar.
To change the results display quantity, click the dropdown list on the results toolbar.
The “Display Labels” only displays 50 labels at a time. You can change the labels displayed by selecting a different group from the dropdown when there are more than 50 results to display.
Step 1: Step 2: Step3:
Type Street
Press Enter on your keyboard or click the Perform Search button
on the right of the text you entered.
Select to zoom to individual results
Zoomed to result.
The search results are located at the bottom of the screen. See note below on how to display more results.
9
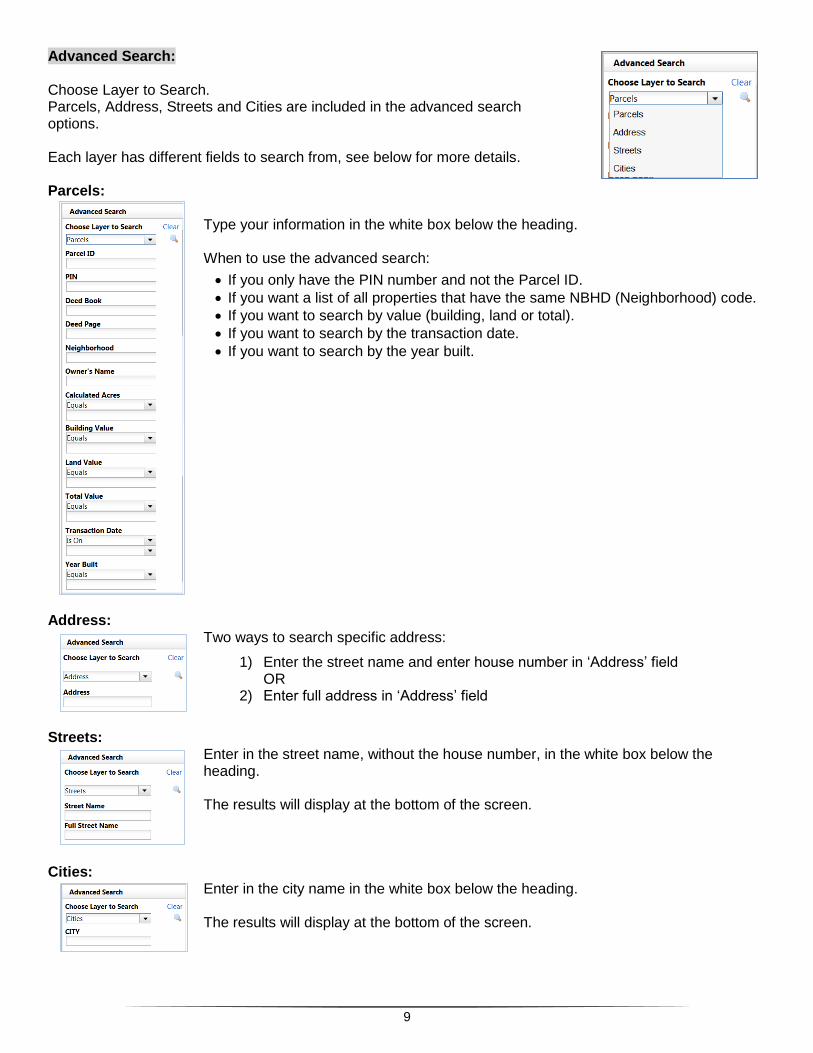
Advanced Search: Choose Layer to Search. Parcels, Address, Streets and Cities are included in the advanced search options. Each layer has different fields to search from, see below for more details. Parcels:
Type your information in the white box below the heading. When to use the advanced search:
If you only have the PIN number and not the Parcel ID.
If you want a list of all properties that have the same NBHD (Neighborhood) code.
If you want to search by value (building, land or total).
If you want to search by the transaction date.
If you want to search by the year built.
Address:
Two ways to search specific address:
1) Enter the street name and enter house number in ‘Address’ field OR
2) Enter full address in ‘Address’ field
Streets:
Enter in the street name, without the house number, in the white box below the heading. The results will display at the bottom of the screen.
Cities: Enter in the city name in the white box below the heading. The results will display at the bottom of the screen.
10
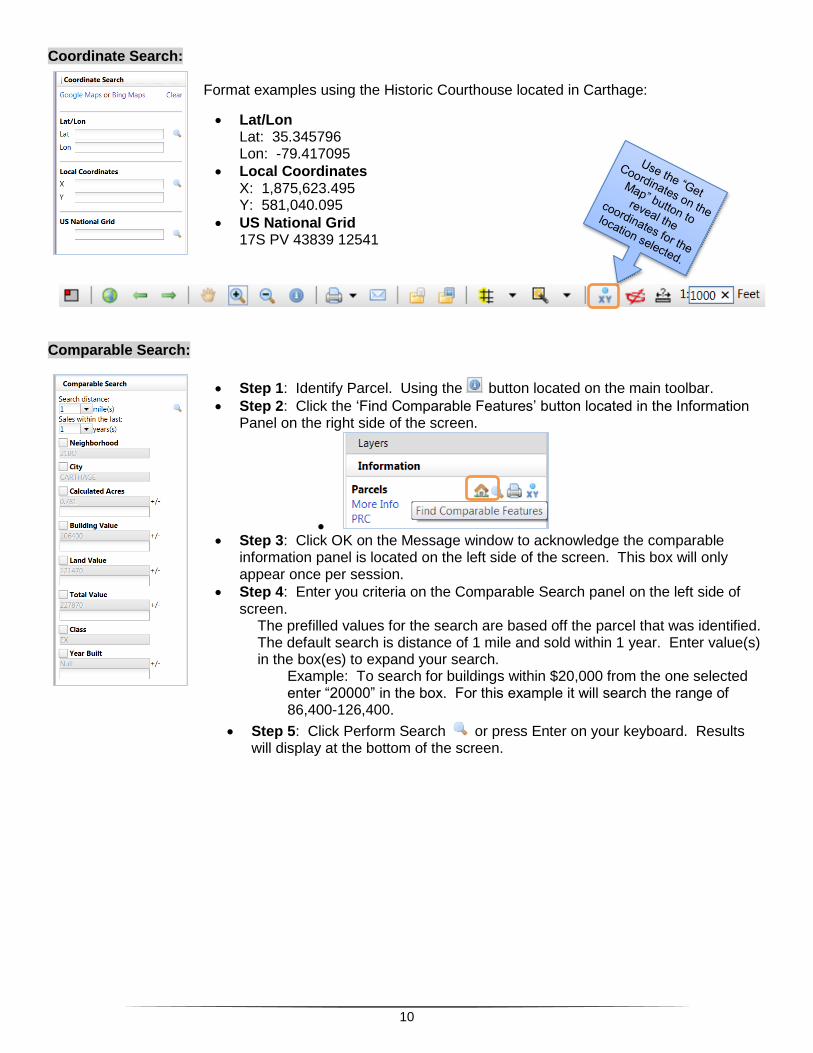
Coordinate Search: Format examples using the Historic Courthouse located in Carthage:
Lat/Lon Lat: 35.345796 Lon: -79.417095
Local Coordinates X: 1,875,623.495 Y: 581,040.095
US National Grid 17S PV 43839 12541
Comparable Search:
Step 1: Identify Parcel. Using the button located on the main toolbar.
Step 2: Click the ‘Find Comparable Features’ button located in the Information Panel on the right side of the screen.
Step 3: Click OK on the Message window to acknowledge the comparable
information panel is located on the left side of the screen. This box will only appear once per session.
Step 4: Enter you criteria on the Comparable Search panel on the left side of screen.
The prefilled values for the search are based off the parcel that was identified. The default search is distance of 1 mile and sold within 1 year. Enter value(s) in the box(es) to expand your search.
Example: To search for buildings within $20,000 from the one selected enter “20000” in the box. For this example it will search the range of 86,400-126,400.
Step 5: Click Perform Search or press Enter on your keyboard. Results will display at the bottom of the screen.
11
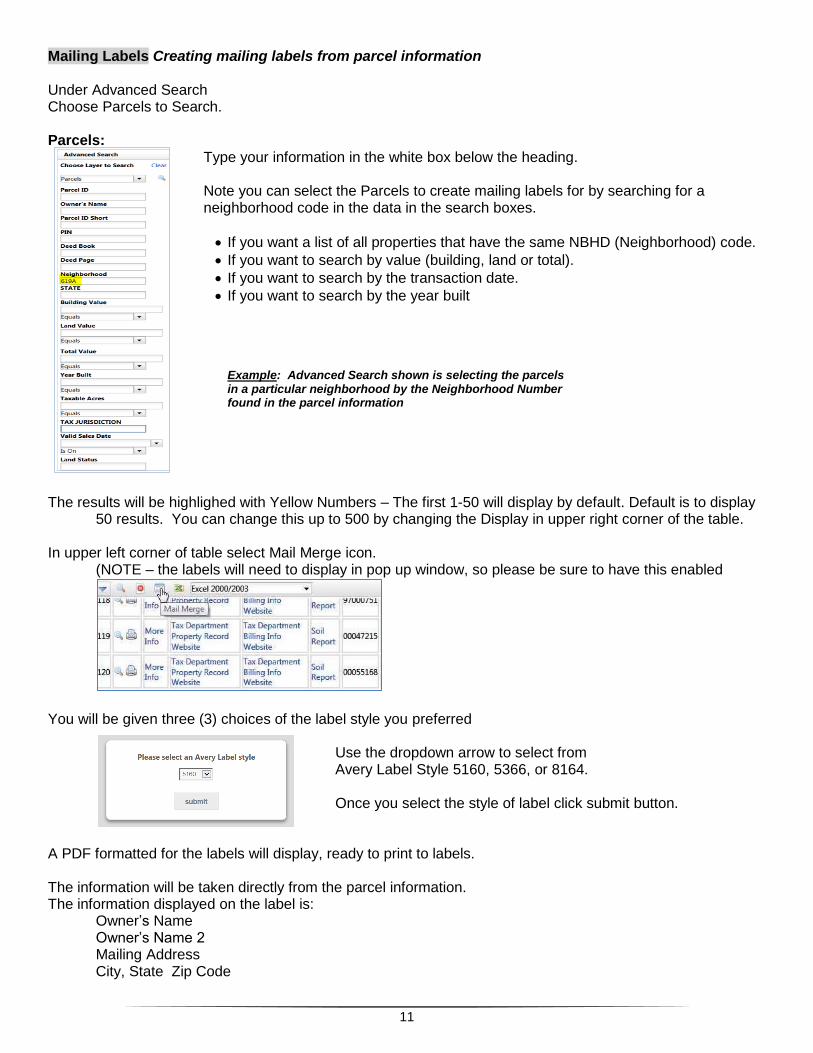
Mailing Labels Creating mailing labels from parcel information Under Advanced Search Choose Parcels to Search. Parcels:
Type your information in the white box below the heading. Note you can select the Parcels to create mailing labels for by searching for a neighborhood code in the data in the search boxes.
If you want a list of all properties that have the same NBHD (Neighborhood) code.
If you want to search by value (building, land or total).
If you want to search by the transaction date.
If you want to search by the year built
Example: Advanced Search shown is selecting the parcels in a particular neighborhood by the Neighborhood Number found in the parcel information
The results will be highlighed with Yellow Numbers – The first 1-50 will display by default. Default is to display
50 results. You can change this up to 500 by changing the Display in upper right corner of the table.
In upper left corner of table select Mail Merge icon. (NOTE – the labels will need to display in pop up window, so please be sure to have this enabled
You will be given three (3) choices of the label style you preferred
Use the dropdown arrow to select from Avery Label Style 5160, 5366, or 8164. Once you select the style of label click submit button.
A PDF formatted for the labels will display, ready to print to labels. The information will be taken directly from the parcel information. The information displayed on the label is:
Owner’s Name Owner’s Name 2 Mailing Address City, State Zip Code
12
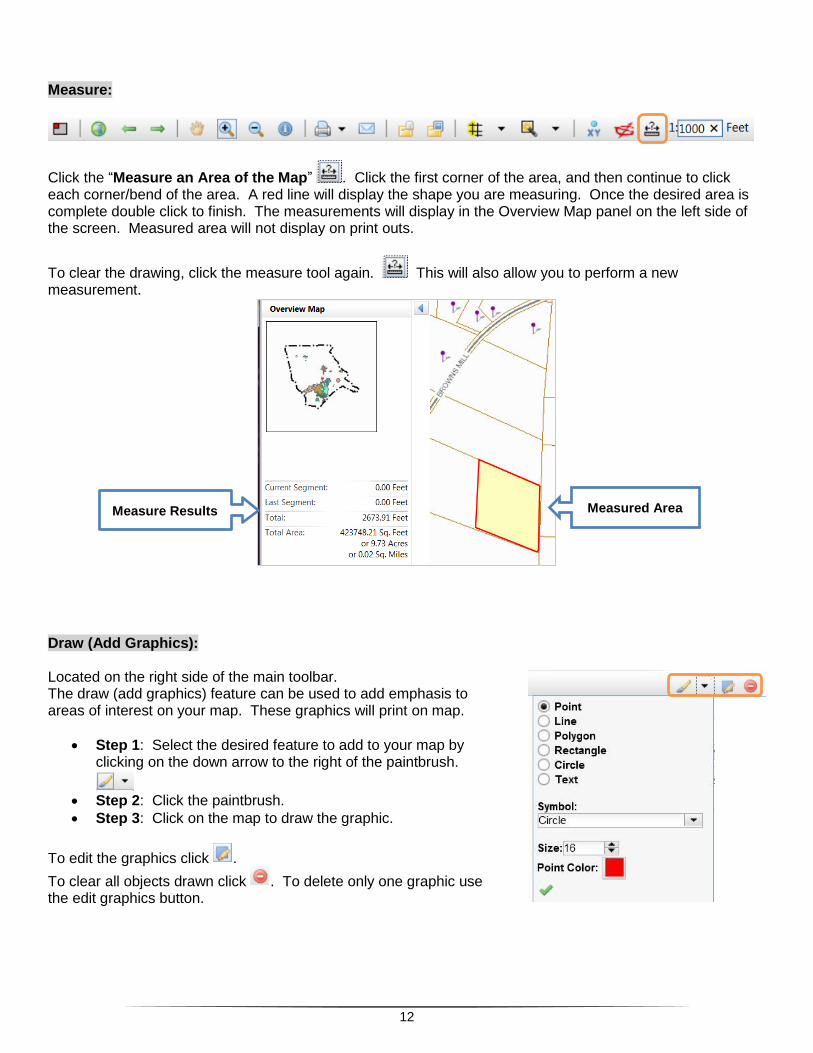
Measure:
Click the “Measure an Area of the Map” . Click the first corner of the area, and then continue to click each corner/bend of the area. A red line will display the shape you are measuring. Once the desired area is complete double click to finish. The measurements will display in the Overview Map panel on the left side of the screen. Measured area will not display on print outs.
To clear the drawing, click the measure tool again. This will also allow you to perform a new measurement.
Draw (Add Graphics): Located on the right side of the main toolbar. The draw (add graphics) feature can be used to add emphasis to areas of interest on your map. These graphics will print on map.
Step 1: Select the desired feature to add to your map by clicking on the down arrow to the right of the paintbrush.
Step 2: Click the paintbrush.
Step 3: Click on the map to draw the graphic.
To edit the graphics click .
To clear all objects drawn click . To delete only one graphic use the edit graphics button.
Measure Results Measured Area
13
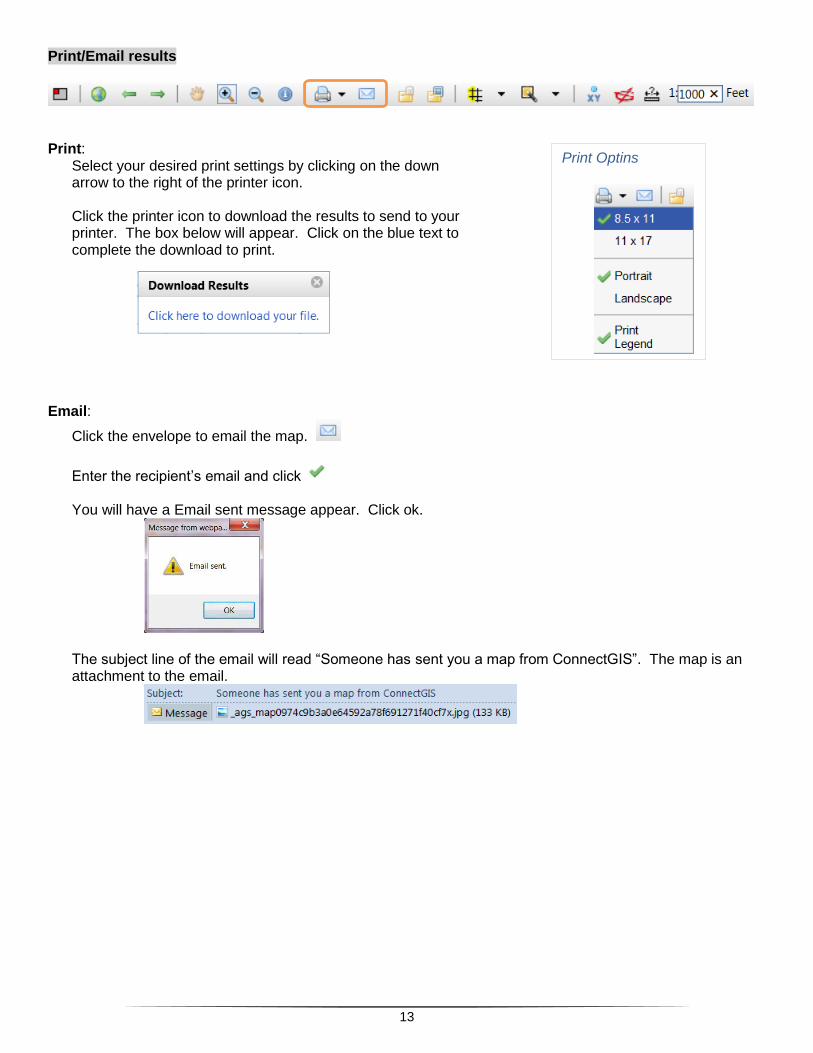
Print/Email results
Print:
Select your desired print settings by clicking on the down arrow to the right of the printer icon. Click the printer icon to download the results to send to your printer. The box below will appear. Click on the blue text to complete the download to print.
Email:
Click the envelope to email the map.
Enter the recipient’s email and click You will have a Email sent message appear. Click ok.
The subject line of the email will read “Someone has sent you a map from ConnectGIS”. The map is an attachment to the email.
Print Optins
14
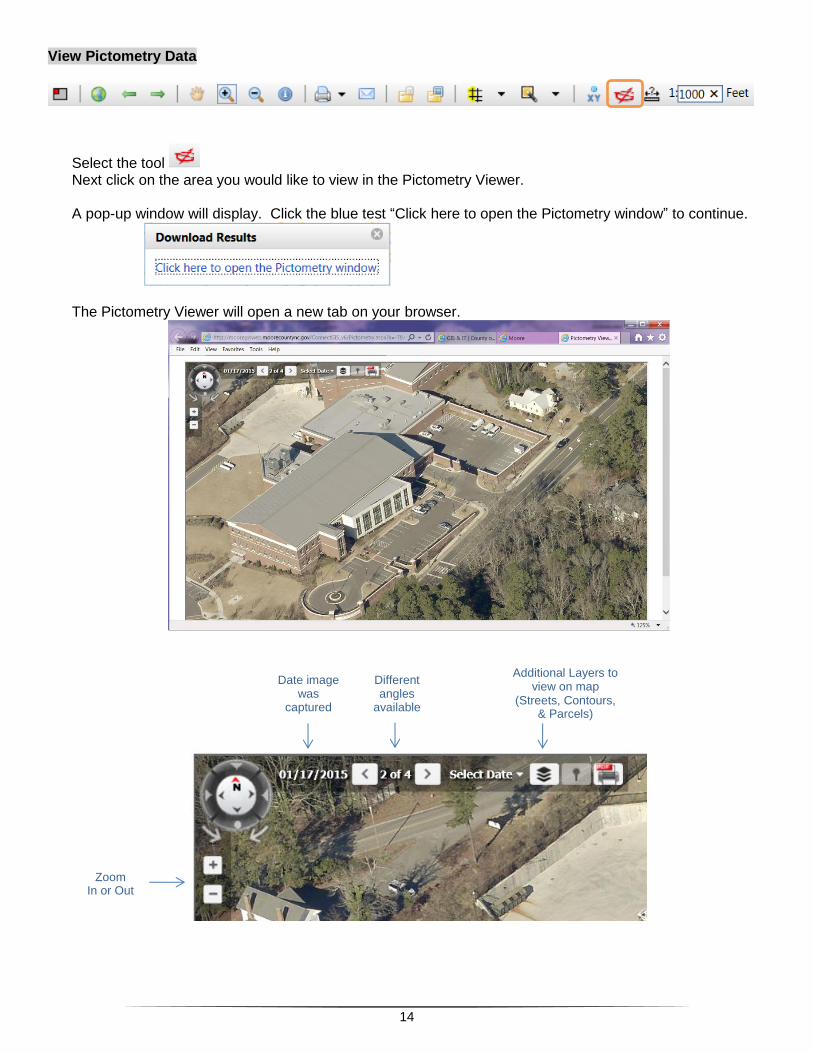
View Pictometry Data
Select the tool Next click on the area you would like to view in the Pictometry Viewer. A pop-up window will display. Click the blue test “Click here to open the Pictometry window” to continue.
The Pictometry Viewer will open a new tab on your browser.
Date image was
captured
Different angles
available
Additional Layers to view on map
(Streets, Contours, & Parcels)
Zoom In or Out