an integrated spatio-temporal classification method for urban fringe change detection analysis
TRANSCRIPT

This article was downloaded by: [University Library Utrecht]On: 14 April 2013, At: 22:09Publisher: Taylor & FrancisInforma Ltd Registered in England and Wales Registered Number: 1072954 Registeredoffice: Mortimer House, 37-41 Mortimer Street, London W1T 3JH, UK
International Journal of RemoteSensingPublication details, including instructions for authors andsubscription information:http://www.tandfonline.com/loi/tres20
An integrated spatio-temporalclassification method for urban fringechange detection analysisYetao Yang a , Qiming Zhou b , Jianya Gong c & Yi Wang aa Institute of Geophysics and Geomatics, China University ofGeosciences, Wuhan, 430074, PR Chinab Department of Geography, Hong Kong Baptist University,Kowloon, 9999, Hong Kongc State Key Laboratory of Information Engineering in Surveying,Mapping and Remote Sensing, Wuhan University, Wuhan, PR ChinaVersion of record first published: 10 Oct 2011.
To cite this article: Yetao Yang , Qiming Zhou , Jianya Gong & Yi Wang (2012): An integrated spatio-temporal classification method for urban fringe change detection analysis, International Journal ofRemote Sensing, 33:8, 2516-2531
To link to this article: http://dx.doi.org/10.1080/01431161.2011.616551
PLEASE SCROLL DOWN FOR ARTICLE
Full terms and conditions of use: http://www.tandfonline.com/page/terms-and-conditions
This article may be used for research, teaching, and private study purposes. Anysubstantial or systematic reproduction, redistribution, reselling, loan, sub-licensing,systematic supply, or distribution in any form to anyone is expressly forbidden.
The publisher does not give any warranty express or implied or make any representationthat the contents will be complete or accurate or up to date. The accuracy of anyinstructions, formulae, and drug doses should be independently verified with primarysources. The publisher shall not be liable for any loss, actions, claims, proceedings,demand, or costs or damages whatsoever or howsoever caused arising directly orindirectly in connection with or arising out of the use of this material.
International Journal of Remote SensingVol. 33, No. 8, 20 April 2012, 2516–2531
An integrated spatio-temporal classification method for urban fringechange detection analysis
YETAO YANG*†, QIMING ZHOU‡, JIANYA GONG§ and YI WANG††Institute of Geophysics and Geomatics, China University of Geosciences, Wuhan 430074,
PR China‡Department of Geography, Hong Kong Baptist University, Kowloon 9999, Hong Kong§State Key Laboratory of Information Engineering in Surveying, Mapping and Remote
Sensing, Wuhan University, Wuhan, PR China
(Received 12 March 2010; in final form 7 June 2011)
The urban fringe is the transition zone between urban land use and rural land use.It represents the most active part of the urban expansion process. Change detec-tion using multi-temporal imagery is proven to be an efficient way to monitorland-use/land-cover change caused by urban expansion. In this study, we pro-pose a new multi-temporal classification method for change detection in the urbanfringe area. The proposed method extracts and integrates spatio-temporal contex-tual information into multi-temporal image classification. The spatial informationis extracted by object-oriented image segmentation. The temporal information ismodelled with temporal trajectory analysis with a two-step calibration. A prob-abilistic schema that employs a global membership function is then used tointegrate the spectral, spatial and temporal information. A trajectory accuracymeasurement is proposed to assist the comparison on the performances of theintegrated spatio-temporal method and classical pixel- and ‘snapshot’-based classi-fication methods. The experiment shows that the proposed method can significantlyimprove the accuracies of both single scene classification and temporal trajectoryanalysis.
1. Introduction
Multi-temporal remote-sensing images are now widely used for change detection andproven to be an efficient data source for mapping land use/land cover and its changein urban fringe areas. Numerous methods have been developed for land-use/land-cover change detection and modelling. These methods can be categorized into twogeneral approaches: binary change/non-change detection such as image differencing(Maktav and Erbek 2005) and change vector analysis (CVA) (Lunetta et al. 2004)and change nature (or ‘from–to’) detection such as post-classification comparison(Dewidar 2004), multi-temporal image-integrated classification (Zhao et al. 2004)and change trajectory classification and modelling (Zhou et al. 2008a). For changedetection in urban fringe areas, one often needs to gain information on both the loca-tion and the nature of land-use/land-cover change for better understanding of thespatio-temporal patterns and effects of the change.
*Corresponding author. Email: [email protected]
International Journal of Remote SensingISSN 0143-1161 print/ISSN 1366-5901 online © 2012 Taylor & Francis
http://www.tandf.co.uk/journalshttp://dx.doi.org/10.1080/01431161.2011.616551
Dow
nloa
ded
by [
Uni
vers
ity L
ibra
ry U
trec
ht]
at 2
2:09
14
Apr
il 20
13
Spatio-temporal classification method for urban fringe 2517
The post-classification comparison method has been reported as a suitableapproach for detecting the nature of change in detail (Lu et al. 2004). Using thismethod, multi-temporal images are classified independently and then compared onthe time interval defined by each scene (or ‘snapshot’) at the pixel level. To ease thediscussion below, we call this method the ‘per-pixel, per-scene classification’ (PPC)method. Since the comparison of this ‘snapshot’ classification ignores the errors ofclassification for each snapshot image, the uncertainty of the overall results using thePPC method can be quite significant (Serra et al. 2003), often leading to rather poorperformance (Boucher et al. 2006).
In an urban fringe area, for better change detection based on the multi-temporalimage, one often has to solve two typical problems:
• the multi-sensor, multi-resolution images acquired in different seasons of longhistory need to be effectively integrated and normalized, so that valid compari-son can be made; and
• the highly heterogeneous nature of land use/land cover needs to be well delin-eated and classified.
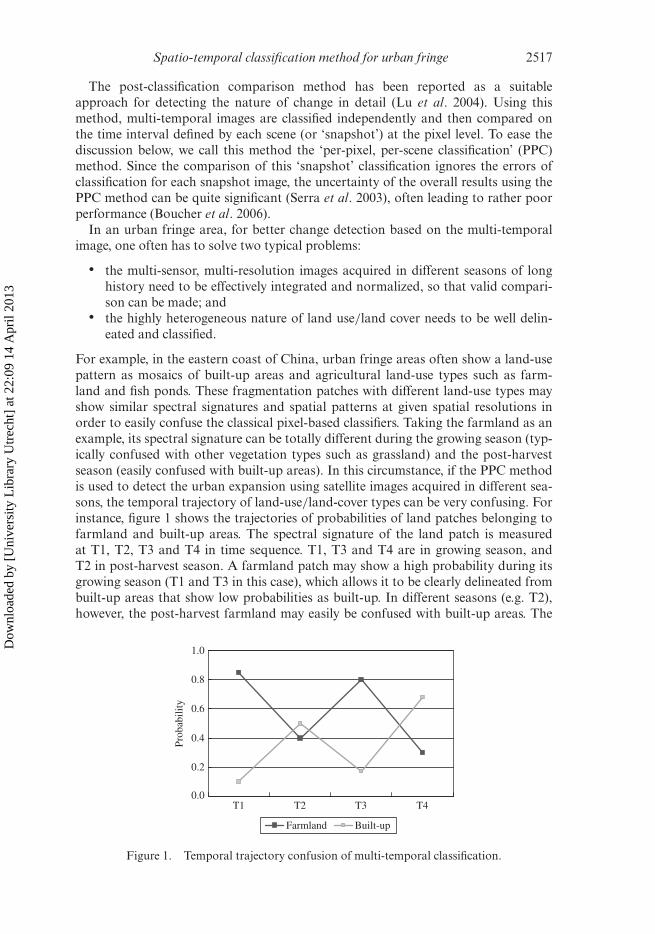
For example, in the eastern coast of China, urban fringe areas often show a land-usepattern as mosaics of built-up areas and agricultural land-use types such as farm-land and fish ponds. These fragmentation patches with different land-use types mayshow similar spectral signatures and spatial patterns at given spatial resolutions inorder to easily confuse the classical pixel-based classifiers. Taking the farmland as anexample, its spectral signature can be totally different during the growing season (typ-ically confused with other vegetation types such as grassland) and the post-harvestseason (easily confused with built-up areas). In this circumstance, if the PPC methodis used to detect the urban expansion using satellite images acquired in different sea-sons, the temporal trajectory of land-use/land-cover types can be very confusing. Forinstance, figure 1 shows the trajectories of probabilities of land patches belonging tofarmland and built-up areas. The spectral signature of the land patch is measuredat T1, T2, T3 and T4 in time sequence. T1, T3 and T4 are in growing season, andT2 in post-harvest season. A farmland patch may show a high probability during itsgrowing season (T1 and T3 in this case), which allows it to be clearly delineated frombuilt-up areas that show low probabilities as built-up. In different seasons (e.g. T2),however, the post-harvest farmland may easily be confused with built-up areas. The
0.0
0.2
0.4
0.6
0.8
1.0
T1 T2 T3 T4
Prob
abili
ty
Farmland Built-up
Figure 1. Temporal trajectory confusion of multi-temporal classification.
Dow
nloa
ded
by [
Uni
vers
ity L
ibra
ry U
trec
ht]
at 2
2:09
14
Apr
il 20
13
2518 Y. Yang et al.
patch may also change from farmland to built up in the urbanization process (e.g. T4)(see §2.2). The PPC method will make the land-use change trajectory unreadable inthis circumstance.
Besides spectral confusion between different land-use types, the spectral signatures’spatial variations in a single patch will also confuse the classification process. Thesespatial variations happen in two locations: on the patch boundary or in the patchinterior. On the patch boundary, the pixels often represent land-use transition fromone type to another type, so their spectral signatures are mixed and it is difficultto classify them. In the patch interior, if spectral signatures are confused betweendifferent land-use types and existing slight spatial variations, this patch may be clas-sified into fragmental small patches with different land-use types. Misclassificationcaused by spatial variations, either on the boundary or in the interior, will introducepseudo-changes on the temporal trajectory.
The integration of spatio-temporal contextual information into multi-temporalremote-sensing classification and change detection will reduce the effects caused bythe problem mentioned above and will improve the performance of the process. Infigure 1, if the classification results in T1 and T3 are used to help the classification ofthe T2 scene, the classification of T2 will overcome the spectral signatures’ confusionand improve the accuracy. Spatial contextual information will reduce spectral varia-tions on the boundary or in the interior of the patch, and will avoid a single patchbeing misclassified into fragmental small patches with different land-use types.
The introduction of temporal or spatial contextual information into the classifica-tion of multi-temporal satellite images has been discussed in the literature. A commonmethod to incorporate spatial information into classification is to model the spatialdistribution of land cover classes as a Gibbs–Markov random field (GMRF) (Schroderet al. 1998, Tso and Mather 2001, Zhou and Robson 2001). Geostatistics has also beenused to incorporate spatial autocorrelation in estimating or simulating classes (Steinet al. 1998). To integrate the temporal context into multi-temporal classification, thecascade approach (Swain 1978) and the transition probability matrix (TPM) model(Bruzzone and Serpico 1997) are widely used. Temporal contextual information wasalso used to assess the accuracy of multi-temporal imagery change detection (Carmeland Dean 2004, Liu and Zhou 2004) and for urban growth prediction (Liu and Zhou2005). To integrate spatio-temporal contexts into the classification, the employmentof methods such as Markov random fields (MRFs), geostatistics and fuzzy reasoninghas been reported (Melgani and Serpico 2003, Boucher et al. 2006, Mota et al. 2007).
Regardless of the method used, the feasible and accurate spatio-temporal contex-tual information extraction is the most important. There is still room to improvethose previously proposed methods. For example, in temporal contextual informationextraction, current models analyse the sequence of image in chronological order basedon transition probabilities. Only the former nearest neighbour is used as the temporalcontext for each ‘snapshot’. In the urban fringe area, however, the transition proba-bility of farmland to built-up area is high and the reverse process is unlikely. In sucha case, the transition probability model is unable to improve the classification. Thecurrent random or statistical models to extract and integrate spatial contextual infor-mation into multi-temporal imagery classification are based on a moving window withan arbitrary size. These methods neglect the spatial extension of land-use patches andintroduce inaccurate spatial contextual information on patch boundaries.
The preceding discussion proves that the integration of temporal and spatial dimen-sions into a classification can significantly improve the results in terms of accuracy
Dow
nloa
ded
by [
Uni
vers
ity L
ibra
ry U
trec
ht]
at 2
2:09
14
Apr
il 20
13
Spatio-temporal classification method for urban fringe 2519
and reliability. However, due to the complexity of multi-temporal satellite image clas-sification in urban fringe areas, further research is needed to reduce the uncertaintycaused by the PPC method or spatio-temporal integrated methods, as discussed abovein multi-temporal image classification. This article reports a research that attemptsto develop a new integrated spatio-temporal classification (ISTC) method for land-use/land-cover change detection in urban fringe areas. In this study we propose touse object-oriented image segmentation to gain spatial contextual information and atwo-step temporal trajectory calibration model to extract temporal contextual infor-mation. The spectral classification results are then integrated with the spatial andtemporal contexts to get the final classification results.
2. Methodology
2.1 Study area, data and data preprocessing
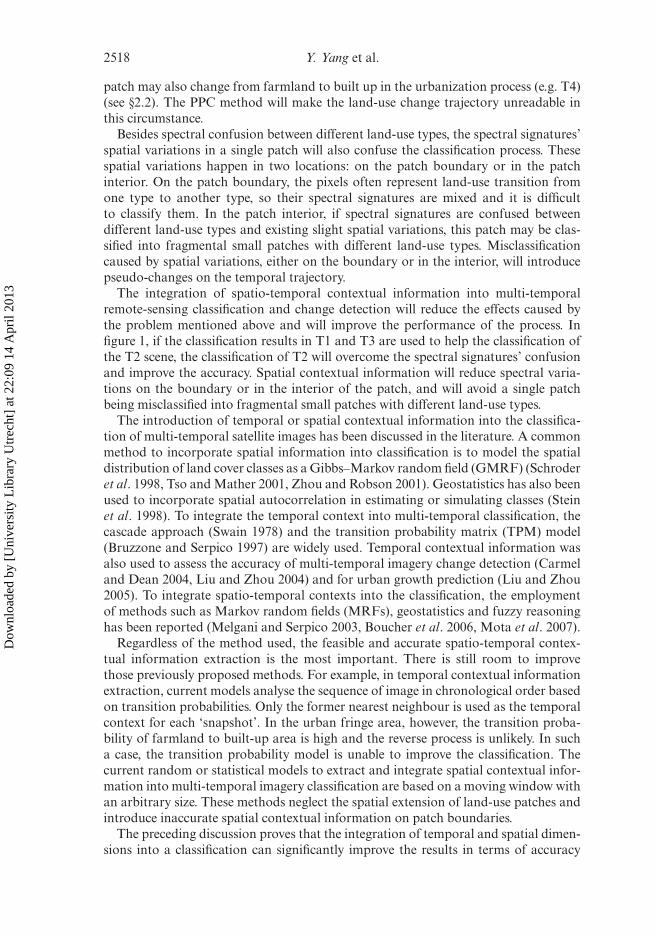
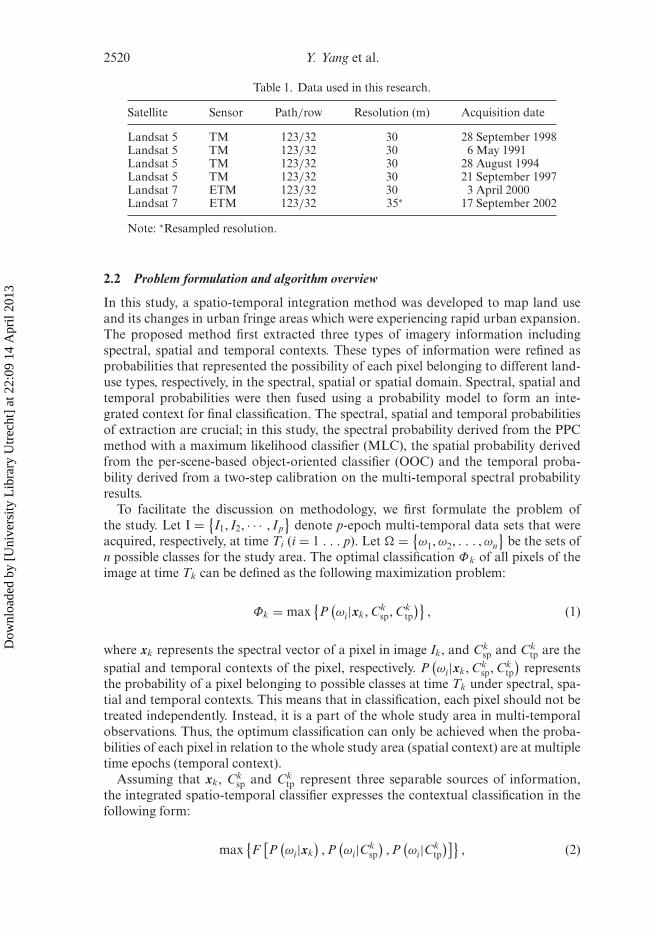
To test the proposed ISTC method, we selected a study area in the urban–ruraltransition zone located in the eastern part of Beijing with an area extent of19.5 km × 18.0 km (figure 2). The urban expansion in this area has mainly been in twostyles: spreading out from the urban core and along the axis of major highways acrossthis region. Six scenes of Landsat imagery were acquired (four Thematic Mapper (TM)images acquired in 1988, 1991, 1994 and 1997, and two Enhanced Thematic Mapper(ETM+) images acquired in 2000 and 2002, table 1). The images were geo-referencedand resampled to 30 m × 30 m pixels. For all images, the root mean squared error(RMSE) of the registration process was less than one-third of a pixel.
Figure 2. Study area located at the fringe of Beijing city.
Dow
nloa
ded
by [
Uni
vers
ity L
ibra
ry U
trec
ht]
at 2
2:09
14
Apr
il 20
13
2520 Y. Yang et al.
Table 1. Data used in this research.
Satellite Sensor Path/row Resolution (m) Acquisition date
Landsat 5 TM 123/32 30 28 September 1998Landsat 5 TM 123/32 30 6 May 1991Landsat 5 TM 123/32 30 28 August 1994Landsat 5 TM 123/32 30 21 September 1997Landsat 7 ETM 123/32 30 3 April 2000Landsat 7 ETM 123/32 35∗ 17 September 2002
Note: ∗Resampled resolution.
2.2 Problem formulation and algorithm overview
In this study, a spatio-temporal integration method was developed to map land useand its changes in urban fringe areas which were experiencing rapid urban expansion.The proposed method first extracted three types of imagery information includingspectral, spatial and temporal contexts. These types of information were refined asprobabilities that represented the possibility of each pixel belonging to different land-use types, respectively, in the spectral, spatial or spatial domain. Spectral, spatial andtemporal probabilities were then fused using a probability model to form an inte-grated context for final classification. The spectral, spatial and temporal probabilitiesof extraction are crucial; in this study, the spectral probability derived from the PPCmethod with a maximum likelihood classifier (MLC), the spatial probability derivedfrom the per-scene-based object-oriented classifier (OOC) and the temporal proba-bility derived from a two-step calibration on the multi-temporal spectral probabilityresults.
To facilitate the discussion on methodology, we first formulate the problem ofthe study. Let I = {
I1, I2, · · · , Ip}
denote p-epoch multi-temporal data sets that wereacquired, respectively, at time Ti (i = 1 . . . p). Let � = {
ω1, ω2, . . . , ωn
}be the sets of
n possible classes for the study area. The optimal classification Φk of all pixels of theimage at time Tk can be defined as the following maximization problem:
Φk = max{P
(ωi|xk, Ck
sp, Cktp
)}, (1)
where xk represents the spectral vector of a pixel in image Ik, and Cksp and Ck
tp are thespatial and temporal contexts of the pixel, respectively. P
(ωi|xk, Ck
sp, Cktp
)represents
the probability of a pixel belonging to possible classes at time Tk under spectral, spa-tial and temporal contexts. This means that in classification, each pixel should not betreated independently. Instead, it is a part of the whole study area in multi-temporalobservations. Thus, the optimum classification can only be achieved when the proba-bilities of each pixel in relation to the whole study area (spatial context) are at multipletime epochs (temporal context).
Assuming that xk, Cksp and Ck
tp represent three separable sources of information,the integrated spatio-temporal classifier expresses the contextual classification in thefollowing form:
max{F
[P
(ωi|xk
), P
(ωi|Ck
sp
), P
(ωi|Ck
tp
)]}, (2)
Dow
nloa
ded
by [
Uni
vers
ity L
ibra
ry U
trec
ht]
at 2
2:09
14
Apr
il 20
13
Spatio-temporal classification method for urban fringe 2521
Spatialprobability
Spectralprobability
Temporalprobability
Temporalcontext
Final classification of Ik
OOC
Ik I1, I2,..., Ip
MLC
MLC
Temporalcalibration
Integration
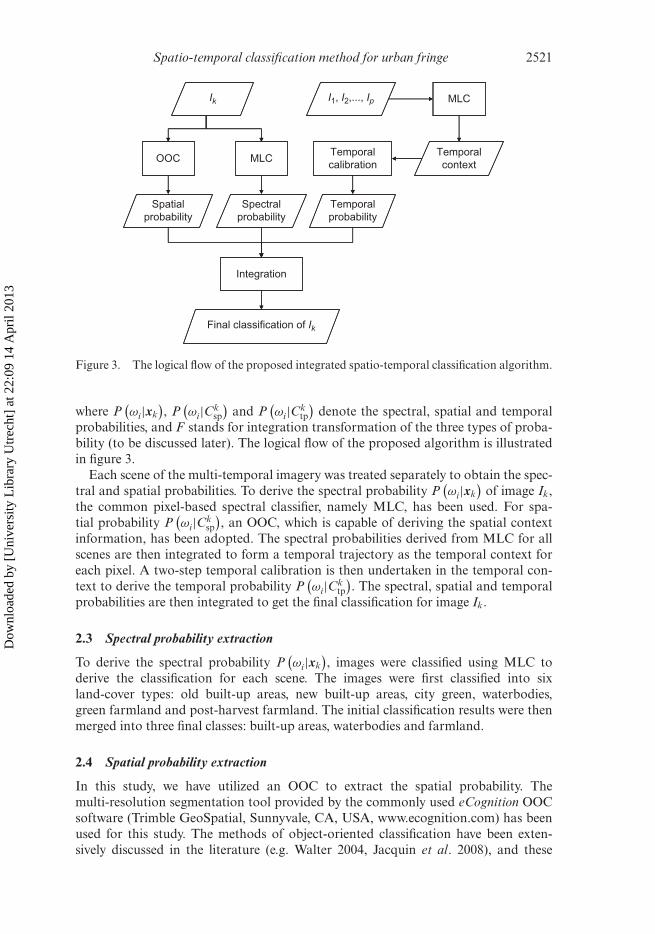
Figure 3. The logical flow of the proposed integrated spatio-temporal classification algorithm.
where P(ωi|xk
), P
(ωi|Ck
sp
)and P
(ωi|Ck
tp
)denote the spectral, spatial and temporal
probabilities, and F stands for integration transformation of the three types of proba-bility (to be discussed later). The logical flow of the proposed algorithm is illustratedin figure 3.
Each scene of the multi-temporal imagery was treated separately to obtain the spec-tral and spatial probabilities. To derive the spectral probability P
(ωi|xk
)of image Ik,
the common pixel-based spectral classifier, namely MLC, has been used. For spa-tial probability P
(ωi|Ck
sp
), an OOC, which is capable of deriving the spatial context
information, has been adopted. The spectral probabilities derived from MLC for allscenes are then integrated to form a temporal trajectory as the temporal context foreach pixel. A two-step temporal calibration is then undertaken in the temporal con-text to derive the temporal probability P
(ωi|Ck
tp
). The spectral, spatial and temporal
probabilities are then integrated to get the final classification for image Ik.
2.3 Spectral probability extraction
To derive the spectral probability P(ωi|xk
), images were classified using MLC to
derive the classification for each scene. The images were first classified into sixland-cover types: old built-up areas, new built-up areas, city green, waterbodies,green farmland and post-harvest farmland. The initial classification results were thenmerged into three final classes: built-up areas, waterbodies and farmland.
2.4 Spatial probability extraction
In this study, we have utilized an OOC to extract the spatial probability. Themulti-resolution segmentation tool provided by the commonly used eCognition OOCsoftware (Trimble GeoSpatial, Sunnyvale, CA, USA, www.ecognition.com) has beenused for this study. The methods of object-oriented classification have been exten-sively discussed in the literature (e.g. Walter 2004, Jacquin et al. 2008), and these
Dow
nloa
ded
by [
Uni
vers
ity L
ibra
ry U
trec
ht]
at 2
2:09
14
Apr
il 20
13
2522 Y. Yang et al.
have been applied to classify images with rich texture information, such as aerial pho-tographs, radar and very high resolution (VHR) satellite data (Baatz and Schäpe 1999,Benz et al. 2004). The key for the OOC is the image segmentation that forms imageobjects by grouping pixels based on their homogeneity in the neighbourhood. Theimage objects can be further merged into super-objects by measuring the differencebetween objects. By employing the image objects instead of pixels, the spatial attributesof pixels can be well conserved in the classification results.
Spatial scale is crucial for image segmentation; in this study, it has been adequatelytested according to the characteristics of Landsat imagery and land use patches’ spa-tial continuity in the study area. Then, the selected scale is applied to all images in thetime series to ensure the same scale in the spatial context of the temporal trajectory.After segmentation, the pixels form image objects and their attributes are calculatedat the same time. Three categories of attributes have been used to describe the imageobject: spectral metrics including mean, SD and band ratio; spatial metrics includingsize and shape index; and texture metrics including mean and variance. The probabili-ties of image objects belonging to land-use types are valued using a nearest-neighbourclassifier in eCognition. Finally, the spatial probability P
(ωi|Ck
sp
)for each pixel within
the image object is evaluated as the image object probability.
2.5 Temporal probability extraction
A commonly used method to integrate temporal context into classification is the use oftransition possibilities (Bruzzone and Serpico 1997, Bruzzone et al. 1999). One impor-tant feature of the transition possibility-based method is that the temporal dependencycontext is conveyed to the next scene in its temporal neighbourhood only through theimmediately previous scene. This means that only one former scene may be consideredas the temporal context. The classification errors in a former scene will be propagatedto the following scenes in such a cascade approach (Kaufmann and Seto 2001).
To fully use the temporal contextual information from all scenes, we propose a newapproach to represent the temporal context and to integrate the temporal contex-tual information to derive the overall temporal probability. The spectral probabilityP
(ωi|xk
)which is obtained from MLC for all scenes forms a vector and serves as the
temporal context. The temporal trajectory analysis of the temporal contextual vectoris then undertaken to derive the overall temporal probability.
The temporal trajectory analysis has been developed for land-use/land-coverchange detection and spatio-temporal modelling (Zhou et al. 2004, 2008a). It hasbeen reported useful to describe the land-use/land-cover transition and its effects onthe environment, economy and ecology, both in time and space (Zhou et al. 2008b).Following the principle of land-use/land-cover change trajectory, we can calibrate onthe temporal contextual vector to get the temporal probability.
In this study, we employ the temporal trajectory rule to extract the temporal proba-bility P
(ωi|Ck
tp
). To simplify the possible scenarios in this study, we made assumptions
based on two notable characteristics of the temporal trajectories in an urban fringearea:
• the land cover type ‘built-up areas’ (here we call it the ‘urban’ class) areconsistently increasing; and
• the rest of land cover types either remain unchanged or transited to the built-upareas.
Dow
nloa
ded
by [
Uni
vers
ity L
ibra
ry U
trec
ht]
at 2
2:09
14
Apr
il 20
13
Spatio-temporal classification method for urban fringe 2523
This means that once a pixel is characterized as ‘urban’, it will remain as ‘urban’.While the land cover type of a pixel is changing, the only consequence of that transi-tion is that the pixel becomes ‘urban’. Based on these two assumptions, the possibleclasses are merged into two groups as ‘urban’ and others, that is, �urban = {ωurban},�others = � − �urban, where ωurban denotes ‘urban’ class type, �urban denotes the set of‘urban’ class type and �others denotes the class types set excluding ‘urban’ class type.
Let Θ denote the temporal probability vector of each pixel in the time series of classtype ωi:
Θ = {P
(ωi|C1
tp
), P
(ωi|C2
tp
), · · · , P
(ωi|Cp
tp
)} = {θ1, θ2, · · · , θp
}. (3)
Two thresholds are set on θk ∈ Θ : Pmax represents a high probability for a pixel belong-ing to ωi and Pmin represents a nearly impossible case for a pixel belonging to ωi.Assuming that if θk /∈ [Pmin, Pmax], then the pixel is well defined in relation to class ωi,that is, when θk < Pmin, the pixel does not belong to class ωi, while when θk > Pmin,the pixel surely belongs to ωi. Our first-step temporal trajectory calibration is basedon this assumption.
For a non-urban class ωi ∈ �others, the temporal probability θk is calibrated to θ ′k by
the following rules:
θmax = max(θk+1, θk+2, · · · , θp
), (4)
θ ′k =
{θmax if θmax ≥ Pmax and θk ≥ Pmin ,
θk otherwise.(5)
For an urban class ωi ∈ �urban, the temporal probability θk is calibrated to θ ′k by the
following rules:
θmax = max (θ1, θ2 , · · · , θk−1) , (6)
θ ′k =
{θmax if θmax ≥ Pmax,
θk otherwise.(7)
The second-step calibration is based on the assumption that once a pixel is transitedfrom one class to another, it has little chance to reverse. Let θ ′′
k denote the temporalprobability after the second-step calibration, and θ ′′
k can be derived from equation (9).This calibration filters the peak and trough of Θ to smooth the curve of Θ :
θ ′′k =
{(θ ′
k−1+θ ′k+1)
2 if (θ ′k−1 − θ ′
k)(θ ′k+1 − θ ′
k) < 0,
θ ′k−1 otherwise.
(8)
After the two-step temporal calibration, the confusion induced by seasonal effects andrandom noise will be reduced. Using this method the complex iteration in temporalprobability extraction can also be avoided (Melgani and Serpico 2002).
Dow
nloa
ded
by [
Uni
vers
ity L
ibra
ry U
trec
ht]
at 2
2:09
14
Apr
il 20
13
2524 Y. Yang et al.
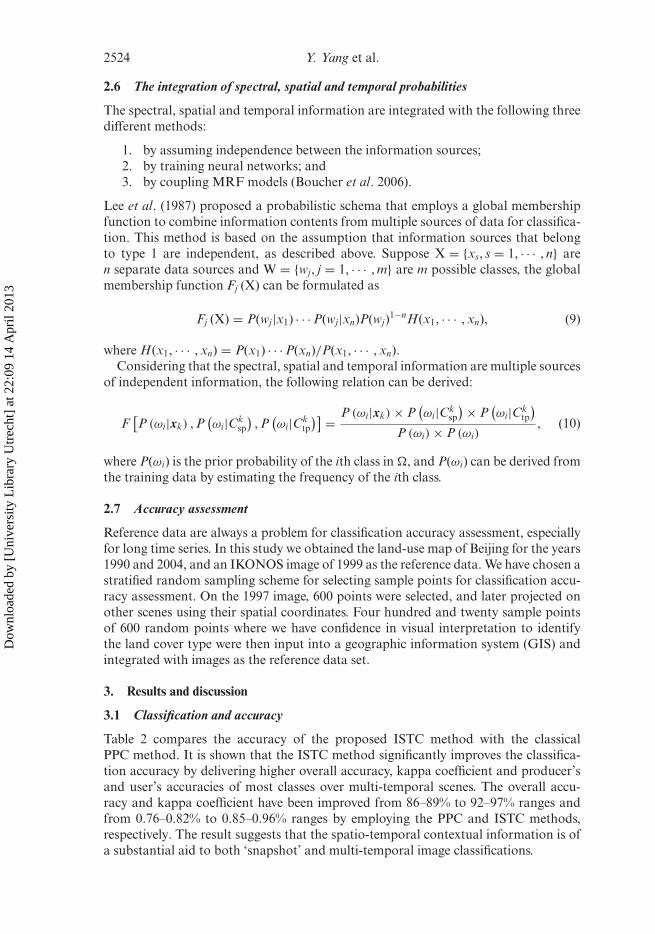
2.6 The integration of spectral, spatial and temporal probabilities
The spectral, spatial and temporal information are integrated with the following threedifferent methods:
1. by assuming independence between the information sources;2. by training neural networks; and3. by coupling MRF models (Boucher et al. 2006).
Lee et al. (1987) proposed a probabilistic schema that employs a global membershipfunction to combine information contents from multiple sources of data for classifica-tion. This method is based on the assumption that information sources that belongto type 1 are independent, as described above. Suppose X = {xs, s = 1, · · · , n} aren separate data sources and W = {wj, j = 1, · · · , m} are m possible classes, the globalmembership function Fj (X) can be formulated as
Fj (X) = P(wj|x1) · · · P(wj|xn)P(wj)1−nH(x1, · · · , xn), (9)
where H(x1, · · · , xn) = P(x1) · · · P(xn)/P(x1, · · · , xn).Considering that the spectral, spatial and temporal information are multiple sources
of independent information, the following relation can be derived:
F[P (ωi|xk) , P
(ωi|Ck
sp
), P
(ωi|Ck
tp
)] = P (ωi|xk) × P(ωi|Ck
sp
) × P(ωi|Ck
tp
)P (ωi) × P (ωi)
, (10)
where P(ωi) is the prior probability of the ith class in �, and P(ωi) can be derived fromthe training data by estimating the frequency of the ith class.
2.7 Accuracy assessment
Reference data are always a problem for classification accuracy assessment, especiallyfor long time series. In this study we obtained the land-use map of Beijing for the years1990 and 2004, and an IKONOS image of 1999 as the reference data. We have chosen astratified random sampling scheme for selecting sample points for classification accu-racy assessment. On the 1997 image, 600 points were selected, and later projected onother scenes using their spatial coordinates. Four hundred and twenty sample pointsof 600 random points where we have confidence in visual interpretation to identifythe land cover type were then input into a geographic information system (GIS) andintegrated with images as the reference data set.
3. Results and discussion
3.1 Classification and accuracy
Table 2 compares the accuracy of the proposed ISTC method with the classicalPPC method. It is shown that the ISTC method significantly improves the classifica-tion accuracy by delivering higher overall accuracy, kappa coefficient and producer’sand user’s accuracies of most classes over multi-temporal scenes. The overall accu-racy and kappa coefficient have been improved from 86–89% to 92–97% ranges andfrom 0.76–0.82% to 0.85–0.96% ranges by employing the PPC and ISTC methods,respectively. The result suggests that the spatio-temporal contextual information is ofa substantial aid to both ‘snapshot’ and multi-temporal image classifications.
Dow
nloa
ded
by [
Uni
vers
ity L
ibra
ry U
trec
ht]
at 2
2:09
14
Apr
il 20
13
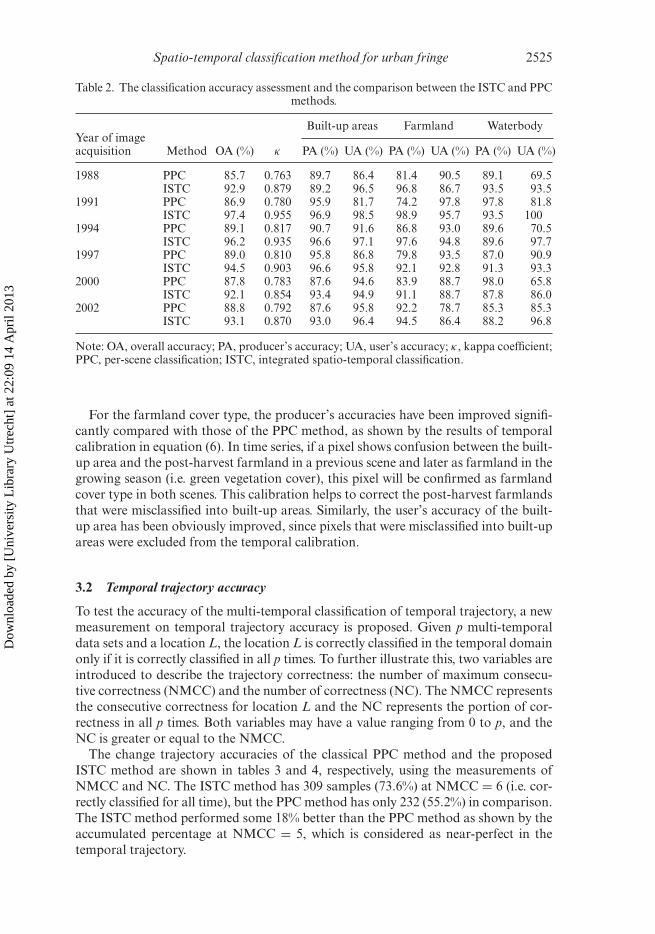
Spatio-temporal classification method for urban fringe 2525
Table 2. The classification accuracy assessment and the comparison between the ISTC and PPCmethods.
Built-up areas Farmland WaterbodyYear of imageacquisition Method OA (%) κ PA (%) UA (%) PA (%) UA (%) PA (%) UA (%)
1988 PPC 85.7 0.763 89.7 86.4 81.4 90.5 89.1 69.5ISTC 92.9 0.879 89.2 96.5 96.8 86.7 93.5 93.5
1991 PPC 86.9 0.780 95.9 81.7 74.2 97.8 97.8 81.8ISTC 97.4 0.955 96.9 98.5 98.9 95.7 93.5 100
1994 PPC 89.1 0.817 90.7 91.6 86.8 93.0 89.6 70.5ISTC 96.2 0.935 96.6 97.1 97.6 94.8 89.6 97.7
1997 PPC 89.0 0.810 95.8 86.8 79.8 93.5 87.0 90.9ISTC 94.5 0.903 96.6 95.8 92.1 92.8 91.3 93.3
2000 PPC 87.8 0.783 87.6 94.6 83.9 88.7 98.0 65.8ISTC 92.1 0.854 93.4 94.9 91.1 88.7 87.8 86.0
2002 PPC 88.8 0.792 87.6 95.8 92.2 78.7 85.3 85.3ISTC 93.1 0.870 93.0 96.4 94.5 86.4 88.2 96.8
Note: OA, overall accuracy; PA, producer’s accuracy; UA, user’s accuracy; κ, kappa coefficient;PPC, per-scene classification; ISTC, integrated spatio-temporal classification.
For the farmland cover type, the producer’s accuracies have been improved signifi-cantly compared with those of the PPC method, as shown by the results of temporalcalibration in equation (6). In time series, if a pixel shows confusion between the built-up area and the post-harvest farmland in a previous scene and later as farmland in thegrowing season (i.e. green vegetation cover), this pixel will be confirmed as farmlandcover type in both scenes. This calibration helps to correct the post-harvest farmlandsthat were misclassified into built-up areas. Similarly, the user’s accuracy of the built-up area has been obviously improved, since pixels that were misclassified into built-upareas were excluded from the temporal calibration.
3.2 Temporal trajectory accuracy
To test the accuracy of the multi-temporal classification of temporal trajectory, a newmeasurement on temporal trajectory accuracy is proposed. Given p multi-temporaldata sets and a location L, the location L is correctly classified in the temporal domainonly if it is correctly classified in all p times. To further illustrate this, two variables areintroduced to describe the trajectory correctness: the number of maximum consecu-tive correctness (NMCC) and the number of correctness (NC). The NMCC representsthe consecutive correctness for location L and the NC represents the portion of cor-rectness in all p times. Both variables may have a value ranging from 0 to p, and theNC is greater or equal to the NMCC.
The change trajectory accuracies of the classical PPC method and the proposedISTC method are shown in tables 3 and 4, respectively, using the measurements ofNMCC and NC. The ISTC method has 309 samples (73.6%) at NMCC = 6 (i.e. cor-rectly classified for all time), but the PPC method has only 232 (55.2%) in comparison.The ISTC method performed some 18% better than the PPC method as shown by theaccumulated percentage at NMCC = 5, which is considered as near-perfect in thetemporal trajectory.
Dow
nloa
ded
by [
Uni
vers
ity L
ibra
ry U
trec
ht]
at 2
2:09
14
Apr
il 20
13

2526 Y. Yang et al.
Table 3. Accuracy comparison by the number of correctness (NC) between the ISTC and PPCmethods.
NC 6 5 4 3 2 1 0
PPC Number of samples 232 102 60 22 3 1 0Percentage of samples (%) 55.2 24.3 14.3 5.2 0.8 0.2 0.0Accumulated percentage (%) 55.2 79.5 93.8 99.0 99.8 100 100
ISTC Number of samples 309 84 23 4 0 0 0Percentage of samples (%) 73.6 20.0 5.5 0.9 0.0 0.0 0.0Accumulated percentage (%) 73.6 93.6 99.1 100 100 100 100
Table 4. Accuracy comparison of the number of maximum consecutive correctness (NMCC)between the ISTC and PPC methods.
NMCC 6 5 4 3 2 1 0
PPC Number of samples 232 45 46 52 37 8 0Percentage of samples (%) 55.2 10.7 11.0 12.4 8.8 1.9 0.0Accumulated percentage (%) 55.2 65.9 76.9 89.3 98.1 100 100
ISTC Number of samples 309 42 27 33 8 1 0Percentage of samples (%) 73.6 10.0 6.4 7.9 1.9 0.2 0.0Accumulated percentage (%) 73.6 83.6 90.0 97.9 99.8 100 100
By comparing the NC and NMCC, it is observed that at NC = 3, the proposedISTC method and the PPC method show almost no difference in the accumulatedpercentage, but at NMCC = 3, the difference of 8.6% is shown. This difference isextended further when the higher level of NMCC is reached, meaning that the ISTChas over-performed PPC in trajectory accuracy of the multi-temporal remote-sensingclassification by considering the contextual information in the temporal and spatialneighbourhoods.
3.3 Change detection
The dominant land-cover change in the study area is the urban expansion; thus, inthis study we only focus on the expansion of built-up areas (i.e. the land-cover changeto built-up area from other types). Table 5 and figure 4 show the results of changedetection during the study period from 1988 to 2002.
Let letter ‘X’ and ‘O’ denote the ‘built-up area’ and ‘others’ cover types, respectively.Given the six-epoch image series, we can construct the change trajectory classificationscheme as shown in table 5.
Referring to figure 4, the ‘uncertain’ classes represent the change trajectory withchange from built-up area to other cover types. These trajectory types collide with theurban expansion rule as discussed in §2.5, which states that once a location is changedto built-up area from other cover types, it is unlikely to reverse back. When theseunlikely cases do occur in the classification results, they are regarded as uncertaintiesin the change detection process. Using the traditional PPC method, the ‘uncertain’classes occupy 21.3% of the total study area (figure 4(a); table 6). In comparison,the uncertain classes only comprise 7.6% of the total area while using the proposedISTC method (figure 4(b)), gaining an impressive 13.7% improvement in the overall
Dow
nloa
ded
by [
Uni
vers
ity L
ibra
ry U
trec
ht]
at 2
2:09
14
Apr
il 20
13

Spatio-temporal classification method for urban fringe 2527
Table 5. The change trajectory classification scheme.
Number Class name Trajectory
1 Old urban area X-X-X-X-X-X2 1988–1991 expansion O-X-X-X-X-X3 1991–1994 expansion O-O-X-X-X-X4 1994–1997 expansion O-O-O-X-X-X5 1997–2000 expansion O-O-O-O-X-X6 2000–2002 expansion O-O-O-O-O-X7 Farmland O-O-O-O-O-O8 Waterbody O-O-O-O-O-O9 Uncertain class 1 X-. . .-O-. . .X
10 Uncertain class 2 X-. . .-O
Note: X, built-up area; O, others.
(a) (b)
0 2 4 8 km
Class
1988–1991 expansion
1991–1994 expansion
1994–1997 expansion
1997–2000 expansion
2000–2002 expansion
Farmland
Waterbody
Old urban area
Uncertain class 1
Uncertain class 2
Figure 4. The expansion of the built-up area during the study period.
classification accuracy. Moreover, the PPC method produced uncertain classes all overthe whole study area, while the ISTC method managed to reduce the class 1 uncer-tainty to a minimum (0.1%) and restricted the class 2 uncertainty in the surroundingarea of early urban cores.
In figure 4(a), the ‘uncertain’ classes mainly distribute on the patch boundary, wherespectral signatures are in transition between adjacent land use types. So the patchboundary is easily classified into different land-use types in time series and detectedas changes, although there are no changes at all. Most of the class 1 uncertaintieshappen on the boundary, because boundaries may be repeatedly detected as unrealchanges. Besides the uncertainties on the patch boundary, the rest of them exist in
Dow
nloa
ded
by [
Uni
vers
ity L
ibra
ry U
trec
ht]
at 2
2:09
14
Apr
il 20
13
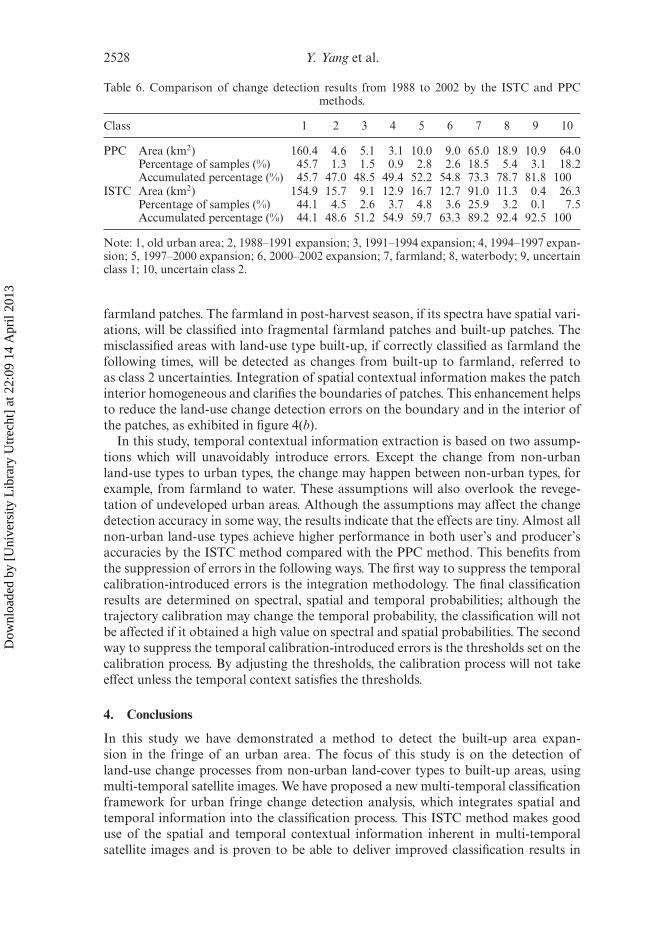
2528 Y. Yang et al.
Table 6. Comparison of change detection results from 1988 to 2002 by the ISTC and PPCmethods.
Class 1 2 3 4 5 6 7 8 9 10
PPC Area (km2) 160.4 4.6 5.1 3.1 10.0 9.0 65.0 18.9 10.9 64.0Percentage of samples (%) 45.7 1.3 1.5 0.9 2.8 2.6 18.5 5.4 3.1 18.2Accumulated percentage (%) 45.7 47.0 48.5 49.4 52.2 54.8 73.3 78.7 81.8 100
ISTC Area (km2) 154.9 15.7 9.1 12.9 16.7 12.7 91.0 11.3 0.4 26.3Percentage of samples (%) 44.1 4.5 2.6 3.7 4.8 3.6 25.9 3.2 0.1 7.5Accumulated percentage (%) 44.1 48.6 51.2 54.9 59.7 63.3 89.2 92.4 92.5 100
Note: 1, old urban area; 2, 1988–1991 expansion; 3, 1991–1994 expansion; 4, 1994–1997 expan-sion; 5, 1997–2000 expansion; 6, 2000–2002 expansion; 7, farmland; 8, waterbody; 9, uncertainclass 1; 10, uncertain class 2.
farmland patches. The farmland in post-harvest season, if its spectra have spatial vari-ations, will be classified into fragmental farmland patches and built-up patches. Themisclassified areas with land-use type built-up, if correctly classified as farmland thefollowing times, will be detected as changes from built-up to farmland, referred toas class 2 uncertainties. Integration of spatial contextual information makes the patchinterior homogeneous and clarifies the boundaries of patches. This enhancement helpsto reduce the land-use change detection errors on the boundary and in the interior ofthe patches, as exhibited in figure 4(b).
In this study, temporal contextual information extraction is based on two assump-tions which will unavoidably introduce errors. Except the change from non-urbanland-use types to urban types, the change may happen between non-urban types, forexample, from farmland to water. These assumptions will also overlook the revege-tation of undeveloped urban areas. Although the assumptions may affect the changedetection accuracy in some way, the results indicate that the effects are tiny. Almost allnon-urban land-use types achieve higher performance in both user’s and producer’saccuracies by the ISTC method compared with the PPC method. This benefits fromthe suppression of errors in the following ways. The first way to suppress the temporalcalibration-introduced errors is the integration methodology. The final classificationresults are determined on spectral, spatial and temporal probabilities; although thetrajectory calibration may change the temporal probability, the classification will notbe affected if it obtained a high value on spectral and spatial probabilities. The secondway to suppress the temporal calibration-introduced errors is the thresholds set on thecalibration process. By adjusting the thresholds, the calibration process will not takeeffect unless the temporal context satisfies the thresholds.
4. Conclusions
In this study we have demonstrated a method to detect the built-up area expan-sion in the fringe of an urban area. The focus of this study is on the detection ofland-use change processes from non-urban land-cover types to built-up areas, usingmulti-temporal satellite images. We have proposed a new multi-temporal classificationframework for urban fringe change detection analysis, which integrates spatial andtemporal information into the classification process. This ISTC method makes gooduse of the spatial and temporal contextual information inherent in multi-temporalsatellite images and is proven to be able to deliver improved classification results in
Dow
nloa
ded
by [
Uni
vers
ity L
ibra
ry U
trec
ht]
at 2
2:09
14
Apr
il 20
13
Spatio-temporal classification method for urban fringe 2529
terms of temporal trajectory accuracy. This is demonstrated by an 18.4% improve-ment in the total trajectory accuracy when the NMCC reaches level 5 in a six-epochanalytical case.
This study has proposed an alternative approach to extract the temporal contextualinformation from images. Compared with the widely used cascade model (Swain 1978,Feitosa et al. 2009) and TPM (Bruzzone and Serpico 1997, Bruzzone et al. 1999), theproposed linear calibration model avoids the complex iteration operation based on thepredetermined land-use change assumption – the urban expansion is an irreversibleprocess. This linear calibration model considers the temporal context over the entirestudy period for the classification of each scene. In comparison, the cascade and TPMmodels only utilize temporal information conveyed from the former nearest neigh-bour. The experiment of this study proves that the integration of spatial, temporaland spectral contextual information can derive good results in multi-temporal classi-fication without the complication of iteration termination (as required by MRF) orsubjective design of the input layer as required by an artificial neural network.
Further study will be focused on discovering land-use transition principles on thetemporal trajectory and their effects on temporal contextual information extraction.In this study, we have simply classified the land-use types into two categories: ‘urban’and ‘non-urban’. We extracted the contextual information based on the assumptionthat once a location is characterized as ‘urban’, it will remain as ‘urban’. While the‘non-urban’ location is changing, the only consequence type of that transition is‘urban’. In real-world cases, the land-cover change is more complex. For example,interchange between non-urban land-cover types is quite possible, and understand-ing these changes might be of critical importance in some applications. Thus, furtherinvestigations are needed to discover the transition rules of land-cover types andto develop the corresponding temporal trajectory calibration schema for temporalcontextual information extraction.
AcknowledgementThe research is supported by the National Key Basic Research and DevelopmentProgramme (2006CB701304), the Research Grants Council General Research Fund(HKBU 2029/07P) and the Hong Kong Baptist University Faculty Research Grant(FRG/06-07/II-76).
ReferencesBAATZ, M. and SCHÄPE, A., 1999, Multiresolution segmentation: an optimization approach
for high quality multi-scale image segmentation. In Angewandte GeographischeInformationsverarbeitung XII , J. STROBL and T. BLASCHKE (Eds.), pp. 12–23(Heidelberg: Wichmann).
BENZ, U.C., HOFMANN, P., WILLHAUCK, G., LINGENFELDER, I. and HEYNEN, M., 2004,Multi-resolution, object-oriented fuzzy analysis of remote sensing data for GIS-ready information. ISPRS Journal of Photogrammetry and Remote Sensing, 58, pp.239–258.
BOUCHER, A., SETO, K.C. and JOURNEL, A.G., 2006, A novel method for mapping landcover changes: incorporating time and space with geostatistics. IEEE Transactions onGeoscience and Remote Sensing, 44, pp. 3427–3435.
BRUZZONE, L., PRIETO, D.F. and SERPICO, S.B., 1999, A neural statistical approach to mul-titemporal and multisource remote-sensing image classification. IEEE Transactions onGeoscience and Remote Sensing, 37, pp. 1350–1359.
Dow
nloa
ded
by [
Uni
vers
ity L
ibra
ry U
trec
ht]
at 2
2:09
14
Apr
il 20
13
2530 Y. Yang et al.
BRUZZONE, L. and SERPICO, S.B., 1997, An iterative technique for the detection of land-covertransitions in multitemporal remote sensing images. IEEE Transactions on Geoscienceand Remote Sensing, 35, pp. 858–867.
CARMEL, Y. and DEAN, D.J., 2004, Performance of a spatio-temporal error model for rasterdatasets under complex error patterns. International Journal of Remote Sensing, 25,pp. 5283–5296.
DEWIDAR, K.M., 2004, Detection of landuse land cover changes for the northern part ofthe Nile delta (Burullus region), Egypt. International Journal of Remote Sensing, 25,pp. 4079–4089.
FEITOSA, Q., COSTA, A.O.P., MOTA, L.A., PAKZAD, K. and COSTA, C.O., 2009, Cascademultitemporal classification based on fuzzy Markov chains. ISPRS Journal ofPhotogrammetry and Remote Sensing, 64, pp. 159–170.
JACQUIN, A., MISAKOVA, L. and GAY, M., 2008, A hybrid object-based classification approachfor mapping urban sprawl in periurban environment. Landscape and Urban Planning,84, pp. 152–165.
KAUFMANN, R.K. and SETO, K.C., 2001, Change detection, accuracy, and bias in a sequentialanalysis of Landsat imagery in the Pearl River Delta, China: econometric techniques.Agriculture Ecosystems and Environment, 85, pp. 95–105.
LEE, T., RICHARDS, J.A. and SWAIN, P.H., 1987, Probabilistic and evidential approaches formultisource data analysis. IEEE Transactions on Geoscience and Remote Sensing, 25,pp. 283–293.
LIU, H. and ZHOU, Q., 2004, Accuracy analysis of remote sensing change detection by rule-based rationality evaluation with post-classification comparison. International Journalof Remote Sensing, 25, pp. 1037–1050.
LIU, H. and ZHOU, Q., 2005, Establishing a multivariate spatial model for urban growth pre-diction using multi-temporal images. Computers, Environment and Urban Systems, 29,pp. 580–594.
LU, D., MAUSEL, P., BRONDIZIO, E. and MORAN, E., 2004, Change detection techniques.International Journal of Remote Sensing, 25, pp. 2365–2470.
LUNETTA, R.S., JOHNSON, D.M., LYON, J.G. and CROTWELL, J., 2004, Impacts of imagerytemporal frequency on land-cover change detection monitoring. Remote Sensing ofEnvironment, 89, pp. 444–454.
MAKTAV, D. and ERBEK, F.S., 2005, Analysis of urban growth using multi-temporal satellitedata in Istanbul, Turkey. International Journal of Remote Sensing, 26, pp. 797–810.
MELGANI, F. and SERPICO, S.B., 2002, A statistical approach to the fusion of spectral andspatio-temporal contextual information for the classification of remote-sensing images.Pattern Recognition Letters, 23, pp. 1053–1061.
MELGANI, F. and SERPICO, S.B., 2003, A Markov random field approach to spatio-temporalcontextual image classification. IEEE Transactions on Geoscience and Remote Sensing,41, pp. 2478–2487.
MOTA, G.L.A., FEITOSA, R.Q., COUTINHO, H.L.C., LIEDTKE, C.E., MULLER, S., PAKZAD, K.and MEIRELLES, M.S.P., 2007, Multitemporal fuzzy classification model based on classtransition possibilities. ISPRS Journal of Photogrammetry and Remote Sensing, 62, pp.186–200.
SCHRODER, M., REHRAUER, H., SEIDEL, K. and DATCU, M., 1998, Spatial information retrievalfrom remote-sensing images – part II: Gibbs–Markov random fields. IEEE Transactionson Geoscience and Remote Sensing, 36, pp. 1446–1455.
SERRA, P., PONS, X. and SAURI, D., 2003, Post-classification change detection with datafrom different sensors: some accuracy considerations. International Journal of RemoteSensing, 24, pp. 3311–3340.
STEIN, A., BASTIAANSSEN, W.G.M., DEBRUIN, S., CRACKNELL, A.P., CURRAN, P.J., FABBRI,A.G., GORTE, B.G.H., VAN GROENIGEN, J.W., VANDERMEER, F.D. and SALDANA, A.,1998, Integrating spatial statistics and remote sensing. International Journal of RemoteSensing, 19, pp. 1793–1814.
Dow
nloa
ded
by [
Uni
vers
ity L
ibra
ry U
trec
ht]
at 2
2:09
14
Apr
il 20
13
Spatio-temporal classification method for urban fringe 2531
SWAIN, P.H., 1978, Bayesian classification in a time-varying environment. IEEE Transactions onSystems, Man, and Cybernetics, 8, pp. 879–883.
TSO, B. and MATHER, P., 2001, Classification Methods for Remotely Sensed Data (London:Taylor & Francis).
WALTER, V., 2004, Object-based classification of remote sensing data for change detection.ISPRS Journal of Photogrammetry and Remote Sensing, 58, pp. 225–238.
ZHAO, G., LIN, G. and WARNER, T., 2004, Using Thematic Mapper data for change detectionand sustainable use of cultivated land: a case study in the Yellow River delta, China.International Journal of Remote Sensing, 25, pp. 2509–2522.
ZHOU, Q., LI, B. and KURBAN, A., 2008a, Trajectory analysis of land cover change in aridenvironment of China. International Journal of Remote Sensing, 29, pp. 1093–1107.
ZHOU, Q., LI, B. and KURBAN, A., 2008b, Spatial pattern analysis of land cover change tra-jectories in Tarim Basin, northwest China. International Journal of Remote Sensing, 29,pp. 5495–5509.
ZHOU, Q., LI, B. and ZHOU, C., 2004, Studying spatial-temporal patterns of landuse change inarid environment of China. In Advances in Spatial Analysis and Decision Making, Z. LI,Q. ZHOU and W. KAINZ (Eds.), pp.189–200 (Lisse: Swets & Zeitlinger).
ZHOU, Q. and ROBSON, M., 2001, Automated rangeland vegetation cover and density estimationusing ground digital images and a spectral-contextual classifier. International Journal ofRemote Sensing, 22, pp. 3457–3470.
Dow
nloa
ded
by [
Uni
vers
ity L
ibra
ry U
trec
ht]
at 2
2:09
14
Apr
il 20
13