an integrated science plan for the lake tahoe basin: conceptual
TRANSCRIPT

37
An Integrated Science Plan for the Lake Tahoe Basin: Conceptual Framework and Research Strategies
A.W. Gertler,2 T.A. Cahill,3 T.M. Cahill,4 S.S. Cliff, 5 C. Emmett,6 J. Koracin,7 H. Kuhns,8 J.V. Molenar,9 J. Quashnick,10 and J.E. Reuter 11
IntroductionAir quality in the Lake Tahoe basin is known to affect lake water quality, forest health, and human health. The Lake Tahoe Watershed Assessment provided an initial summary of the status of our scientific knowledge regarding the factors leading to the observed decline in water quality (Reuter and Miller 2000) and steps that can be taken to restore the Lake Tahoe basin ecosystem (Murphy and Knopp 2000). Among the factors contributing to the decline in water quality are nitrogen (N), phosphorous (P), and sediment flow into Lake Tahoe. Cliff and Cahill (2000) reported that atmospheric deposition accounts for approximately 55 percent of the N and 15 percent of the P load into the lake. No estimate of atmospheric particulate input was presented. These estimates are highly uncertain. Although there has been extensive water sampling in the basin, there has been minimal air sampling. Thus, despite atmospheric deposition possibly being a major source of N input, a signifi-cant source of P input, and a potentially important source of particle deposition and sediment loading, we lack knowledge regarding the sources of these nutrients, the contribution from in-basin vs. out-of-basin pollutant sources, the spatial and tempo-ral distribution of pollutant deposition, and the factors contributing to the observed deposition.
In addition to the issue of declining water clarity, there also are concerns regarding the impact of atmospheric pollutants on human and forest health and aesthetics. For example, the ozone (O3) levels in the Lake Tahoe basin exceed
Chapter 3: Air Quality1
1 Citation for this chapter: Gertler, A.W.; Cahill, T.A.; Cahill, T.M.; Cliff, S.S.; Emmett, C.; Koracin, J.; Kuhns, H.; Molenar, J.V.; Quashnick, J.; Reuter, J.E. 2009. Air quality. In: Hymanson, Z.P.; Collopy, M.W., eds. An integrated science plan for the Lake Tahoe basin: conceptual framework and research strategies. Gen. Tech. Rep. PSW-GTR-226. Albany, CA: U.S. Department of Agriculture, Forest Service, Pacific Southwest Research Station: 37–81. Chapter 3.2 Division of Atmospheric Sciences, Desert Research Institute, Reno, NV 89512.3 University of California, Davis, Department of Physics, Davis, CA 95616.4 Arizona State University, Department of Integrated Natural Sciences, Tempe, AZ 85287. 5 University of California, Davis, Department of Applied Sciences, Davis, CA 95616.6 Air Quality Program, Tahoe Regional Planning Agency, Stateline, NV 89449.7 Division of Atmospheric Sciences, Desert Research Institute, Reno, NV 89512.8 Division of Atmospheric Sciences, Desert Research Institute, Reno, NV 89512.9 Air Resource Specialists, Inc., Fort Collins, CO 80525.10 Sierra Nevada Environmental Consulting, South Lake Tahoe, CA 96150.11 University of California, Davis, Department of Environmental Science and Policy, Davis, CA 95616.
38
GENERAL TECHNICAL REPORT PSW-GTR-226
current and proposed air quality standards that are designed to protect human health and welfare. In addition, elevated O3 leads to a decline in forest health that can increase the threat of fire owing to dead and dying trees. In terms of particulate matter (PM), PM2.5 (particulate matter with aerodynamic diameter less than 2.5µm or fine particulate matter) not only impacts in-basin visibility, but also is a concern because of its link to human health impacts.
To address the continuing concerns about air pollution impacts and develop a sound scientific approach for mitigating these impacts, this chapter updates the work of Cliff and Cahill (2000) and builds upon the Lake Tahoe Atmospheric Deposition Study (CARB 2006) by delineating remaining knowledge gaps and defining the research needs and strategies to close these gaps. To support this approach, a number of Tahoe-specific subthemes related to air quality were identi-fied, including: • Tahoe basin meteorology • Atmospheric deposition of N, P, and particles• Local vs. regional transport of air pollutants• Tahoe basin air quality: the criteria pollutants• Air pollution emission inventories• Atmospheric modeling of the Lake Tahoe basin • Impacts of fire on air quality
Climate change is likely to impact air quality through changes in emissions, activity, atmospheric transformations, and meteorology; however, at this time, these impacts are highly uncertain and have not been included in this summary.
In this chapter, we summarize our current state of knowledge on the selected subthemes and present the research needs and strategies that are recommended to improve our understanding of the impact of air quality on human health, water quality, and ecosystem health. We note up front that the lack of long-term compre-hensive air quality monitoring data substantially affects our ability to fully develop an understanding of the atmospheric processes leading to pollutant impacts. Addressing this shortcoming would necessitate a long-term commitment to routine monitoring coupled with data interpretation to address the identified air quality knowledge gaps outlined in this chapter.
Conceptual ModelThere are a number of coupled processes leading to air and water quality impacts caused by air pollution in the Lake Tahoe basin. Initially, we have emissions from both human activities and natural processes. For example, motor vehicle use

39
An Integrated Science Plan for the Lake Tahoe Basin: Conceptual Framework and Research Strategies
results in the direct emission of carbon monoxide (CO), oxides of nitrogen (NOx), hydrocarbons (HC, also referred to as volatile organic compounds, VOCs), and PM. Biogenic sources (i.e., trees) are a major contributor to VOC emissions. Follow-ing emission of pollutants into the air, meteorological factors influence pollutant concentrations through transport, dilution, temperature/relative humidity, and pre-cipitation. Simultaneously, chemical transformations take place in the atmosphere, leading to the formation of harmful species such as O3.
One issue of concern is the deposition of N, P, and sediment (related to PM) into the lake, which contributes to a decline in water clarity. As pollutants are dis-persed and react in the atmosphere, they can also deposit on surfaces through either wet or dry deposition pathways. Both of these are important in the basin; although, given the sporadic nature of rain and snow, it is likely the dry deposition pathway dominates.
In addition to the water clarity issue, air pollutants can negatively impact both human and ecosystem health. One way to assess potential impacts is to monitor ambient pollutant levels and compare the results with ambient air quality standards that are designed to protect human health and welfare. Currently, the only basin pollutant in violation of the standards is O3. Based on the determination of negative impacts (i.e., violation of the air quality standard, impact on water clarity, declin-ing visibility, etc.), management agencies can develop policies to reduce pollutant levels. In general, these involve the reduction of emissions.
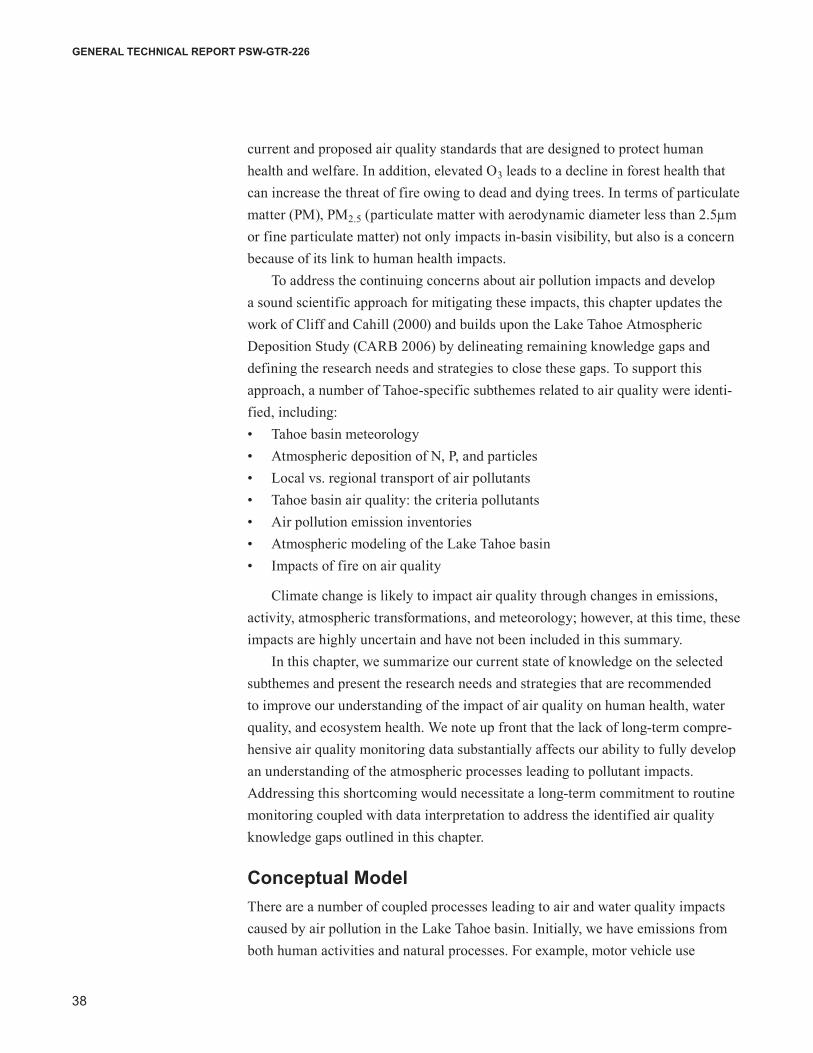
To aid management agencies in their efforts to improve air quality and mitigate negative environmental impacts, we can make use of a conceptual model (fig. 3.1). The four major components contributing come from mobile, area, stationary, and biogenic sources. Each of these has a number of 1° (primary) and 2° (secondary) drivers. For example, land use and transportation systems and policies (2° drivers) affect the number and activity of on- and off-road vehicles and business operations (1° drivers), which control mobile source emissions. Similarly, fire risk and suppres-sion (2° driver) influences naturally occurring fires and plant and animal outputs (1° drivers) that contribute to biogenic emissions. It is important to note there are overarching drivers that cannot be controlled: chemical and physical transforma-tions and meteorology and climate.
As described above, emissions from the four components lead to air quality and environmental impacts. These impacts can be identified and assessed using various indicators. Potential indicators in the Lake Tahoe basin are vehicle miles traveled and activity, measurements of long- and short-range visibility, air quality standards, concentrations of nonregulated pollutants, and measures of human and ecosystem health.

40
GENERAL TECHNICAL REPORT PSW-GTR-226
Figure 3.1—Conceptual model for Lake Tahoe basin air quality (AQ) subthemes. Identified are the primary sources of emissions in the Lake Tahoe basin airshed, the natural and human-caused drivers that affect these emissions, and arrows indicating the linkages among drivers and emission sources. These drivers and emission sources affect each of the air quality subthemes. Near-term air quality research priorities are indicated by symbols AQ1–AQ5 and correspond to the descriptions presented later in this chapter.
In this chapter, we’ve identified eight subthemes related to the various drivers and components outlined in the conceptual model that affect air quality issues in the Lake Tahoe basin. The sections that follow present the state of our knowledge regarding these subthemes and discuss measures that can be implemented to improve our understanding of the processes affecting air quality. By making use of the relationships among the various drivers, components, and indicators pre-sented in this conceptual model, basin managers can develop effective strategies to improve air quality in the basin.
Biogenicemissions
Component2° Driver 1° Driver Subtheme Theme IndicatorLinkage
Land use
Air quality
Subthemes Potentialindicators
Transportationsystems and
policies
Chemical andphysical
transformations
Meteorologyand
climate
Fire riskand
suppression
Road and bare soil
dust
Businessoperation
Human-causedfires
Naturallyoccurring
fires
Plant andanimal outputs
On- and off-roadvehicles
Stationaryemissions
Areaemissions
Mobileemissions
AQ2
AQ2
AQ2
AQ2
AQ2
AQ1
Tahoe basin air quality:the criteriapollutants
Atmosphericmodeling
Ecosystemand
human health
State and federal
air qualitystandards
Local vs.regionaltransport
Impactsof fire onair quality
AQ1
AQ3
AQ3
Atmosphericdeposition of
nitrogen,phosphorous,and particles
Air pollutantemission
inventories
Tahoe basinmeteorology
Tahoe basinvisibility
AQ2, AQ4
AQ1
AQ5
Nonregulatedpollutant
concentrations
Vehicle milestraveled
and activity
Long- andshort-range
visibility

41
An Integrated Science Plan for the Lake Tahoe Basin: Conceptual Framework and Research Strategies
Tahoe Basin MeteorologyTo understand the complex relationships among air quality, lake clarity, forest health, visibility, and human health in the Lake Tahoe basin, it is necessary to understand meteorology in and around the basin. Overall, our current understand-ing is limited and additional monitoring, research, and modeling efforts are needed.
The unique physical attributes of the basin play an extremely important role in defining the basin’s atmospheric processes. There are generally two types of regimes that have the largest impact on atmospheric processes in the basin: thermal inversions and atmospheric transport.
Thermal inversions—Because Lake Tahoe is located at a high elevation and surrounded by mountains on all sides, an atmospheric regime is created that, in the absence of strong synoptic weather systems, develops very strong, shallow inversions at all times of the year. Further, the rapid cooling at night generates downslope winds, which move from the ridgetops down and across populated areas and over the lake itself. Pollutants emitted by human and natural activities, along with those “carried in” with the downslope winds, will often become “trapped” at the surface (both land and lake surfaces) by thermal inversions, thereby creating areas of concentrated pollutant levels and increasing the chance for air pollutants to deposit on the lake and the surrounding watershed.
Atmospheric transport—The location of Lake Tahoe directly to the east of the Sierra Nevada Mountain crest creates the second most common meteorological regime: atmospheric transport of air pollutants from the Sacramento Valley/Bay area into the Lake Tahoe basin by mountain upslope winds. This pattern develops when the western slopes of the Sierra Nevada are heated, causing the air to rise in a chimney effect and move upslope and over the Sierra crest into the Tahoe basin. The strength of this pat-tern depends on the amount of heating, thus is strongest in summer, beginning in April and essentially ceasing in late October (Cahill et al. 1997). This upslope transport pattern is strengthened and made even more frequent by the alignment of the Sierra Nevada range across the prevailing westerlies common at this latitude, which combine with the terrain winds to force air up and over the Sierra Nevada mountains from upwind sources in the Sacramento Valley (Cliff and Cahill 2000). So, although this process is often discussed in terms of the out-of-basin air qual-ity impacts from pollutants generated in the Sacramento Valley and Bay area, the atmospheric transport regime can also include pollutant contributions from large-scale global atmospheric transport. For example, the atmospheric transport of dust

42
GENERAL TECHNICAL REPORT PSW-GTR-226
from Asia has been detected in numerous areas across California’s west coast and in the Tahoe basin (CARB 2003).
Another important meteorological regime, mediated by topography and low pressure systems, results in a summertime pattern that circulates moisture in from the east, often forming thunderstorms along the Sierra crest. In addition, strong high-pressure patterns north and northwest of Lake Tahoe can bring strong dry winds across the basin at almost any time of the year. Each of these meteorological regimes has a potential for concentrating anthropogenic pollutants within the Tahoe basin (Cliff and Cahill 2000).
Seasonal differences—Seasonal differences in meteorology play a large role in air pollutant processes as well. In the summer months, nightly inversions are common, thereby contributing to higher pollutant concentrations in trapped areas. Additionally, summertime weather conditions such as higher temperatures and fewer storms create conditions favoring higher emission rates and concentrations of certain pollutants, such as O3. More specifically, warmer temperatures can increase emission rates of pollutants from motorized equipment and biogenic sources. Further, secondary effects also can result in increased vehicle emissions owing to an increase in the number of vehicles within the basin because of the increase in popular summertime activities and the greater use of second homes. Another important meteorological regime generally associated with the summer months includes the atmospheric transport of pollutants from areas outside of the basin (see details under “Atmospheric trans-port” above).
Winter conditions in the basin are represented by cool temperatures and clear skies with periodic storms bringing precipitation in the form of rain and snow. These winter storms generally support strong vertical mixing in the atmosphere and the dilution of local and upwind pollutants while bringing in air from the very clean North Pacific sector (which accounts for the relatively low concentration of anthropogenic pollutants in the basin’s snowfall [Cliff and Cahill 2000]). Unlike the nightly occurrences in the summer months, inversions in the winter months may last into the daytime hours. As with summer night conditions, there are certain pollutants for which emissions are higher during the colder months, such as CO from motor vehicle exhaust. The increased emission rates coupled with thermal inversions can create localized areas of unhealthy pollutant concentrations.
There are many weather stations of variable size and type, which have been operated by both private and public parties in the basin. These stations range from simple temperature and wind speed and direction monitors used by private
43
An Integrated Science Plan for the Lake Tahoe Basin: Conceptual Framework and Research Strategies
citizens or companies, including ski resorts, and marinas, to those operated by government agencies and researchers who require quality-assured information to meet regulatory requirements and research needs. Unfortunately, the existing quality-assured weather stations are not yet extensive enough to answer the meteorological questions that remain. Further, simple ambient temperature and wind speed and direction measurements cannot account for the conditions that occur from ground level to thousands of meters above—a space that encompasses a very complex variety of atmospheric processes.
The most recent attempts to gather meteorological data at three locations in the basin occurred as part of the Lake Tahoe Atmospheric Deposition Study (LTADS), led by the California Air Resources Board (CARB 2006) in cooperation with other basin agencies. Unfortunately, this effort only continued for 1 year. This lack of consistent long-term meteorological measurements (and by extension, air quality monitoring) has hampered efforts to develop a better understanding of the factors influencing atmospheric processes in the basin.
One other issue not fully understood is the impact of climate change on Tahoe basin meteorology. Although it is likely this will lead to warmer temperatures in the basin, it is unclear how this will affect other variables such as relative humidity, wind patterns, and precipitation. All of these potential changes can greatly influ-ence pollutant emissions and atmospheric processes leading to the deposition of N, P, and sediment to the lake.
Knowledge GapsGiven the limited amount of high-quality meteorological data, there are substantial gaps in our understanding of the impact of meteorology on air quality. This has led to substantial knowledge gaps in the following areas:
• Spatial coverage of data collection is scarce, limiting our knowledge of microenvironments and our ability to accurately determine deposition in the basin.
• Only a limited number of meteorological variables are measured, making it difficult to employ detailed atmospheric models to assess atmospheric pro-cesses.
• There have been few upper air column measurements for use in evaluating chemical transformation and deposition pathways and validating atmo-spheric models.
• Advanced atmospheric models for use in evaluating management strategies have not been implemented for the Lake Tahoe basin, owing to the lack of adequate meteorological data.

44
GENERAL TECHNICAL REPORT PSW-GTR-226
Research Needs • An appropriate air quality model needs to be developed that can utilize a
full suite of meteorological data to better assess air pollutant trends, estimate impacts, and support the development of regulations that will assist in meet-ing air quality and other environmental goals. This model needs to be linked with an appropriate emissions inventory and relevant deposition data.
• Although existing meteorological information has provided researchers with a general understanding of typical meteorological regimes in the basin, far more monitoring locations and instruments are recommended to address the basin’s air quality and lake clarity planning needs. Ideally this would include both ground-based and upper air column measurements.
• The seasonal impact of meteorology on pollutant levels with an emphasis on emissions from prescribed fires and wildfires should be evaluated using existing data.
• Seasonal overflights with light aircraft could be done to measure the con-centrations of a number of air pollutants in the Tahoe basin and the meteo-rological conditions prevalent during these measurements. This will aid in the determination of meteorological conditions related to both deposition and in-basin vs. out-of-basin transport.
• Perform gradient flux or eddy correlation studies to determine pollutant deposition dynamics.
Atmospheric Deposition of Nitrogen, Phosphorus, and ParticlesThe atmospheric deposition of N, P, and particles to Lake Tahoe can be a substan-tial source of the pollutants contributing to declining lake water clarity (see section 4.5 in the “Water Quality” chapter of this science plan). Using on-lake deposition buckets, Jassby et al. (1994), Reuter et al. (2003), and Hackley et al. (2004, 2005) demonstrated that atmospheric inputs of N and P are a significant source of the nutrients supporting algal growth. Recent studies of water clarity implicate insolu-ble particles, largely soil derived, as important contributors to declining lake clarity (Coker 2000, Losada-Perez 2002, Swift et al. 2006). Preliminary estimates suggest that on the order of 15 percent of the fine, soil-derived particles enters directly into Lake Tahoe via atmospheric deposition (LRWQCB and NDEP 2008).
Deposition theory and validation have been summarized by Seinfeld and Pandis (1997). The dry deposition rate is codified by a net deposition velocity, which is, in turn, a sum of settling velocity for large particles and diffusion for small particles,

45
An Integrated Science Plan for the Lake Tahoe Basin: Conceptual Framework and Research Strategies
0.01 0.02 0.04 0.1 0.2 0.4 1 2 4 10
Particle diameter (µm)
0.6
0.5
0.4
0.3
0.2
0.1
0
Rem
oval
vel
ocity
(cm
/sec
)
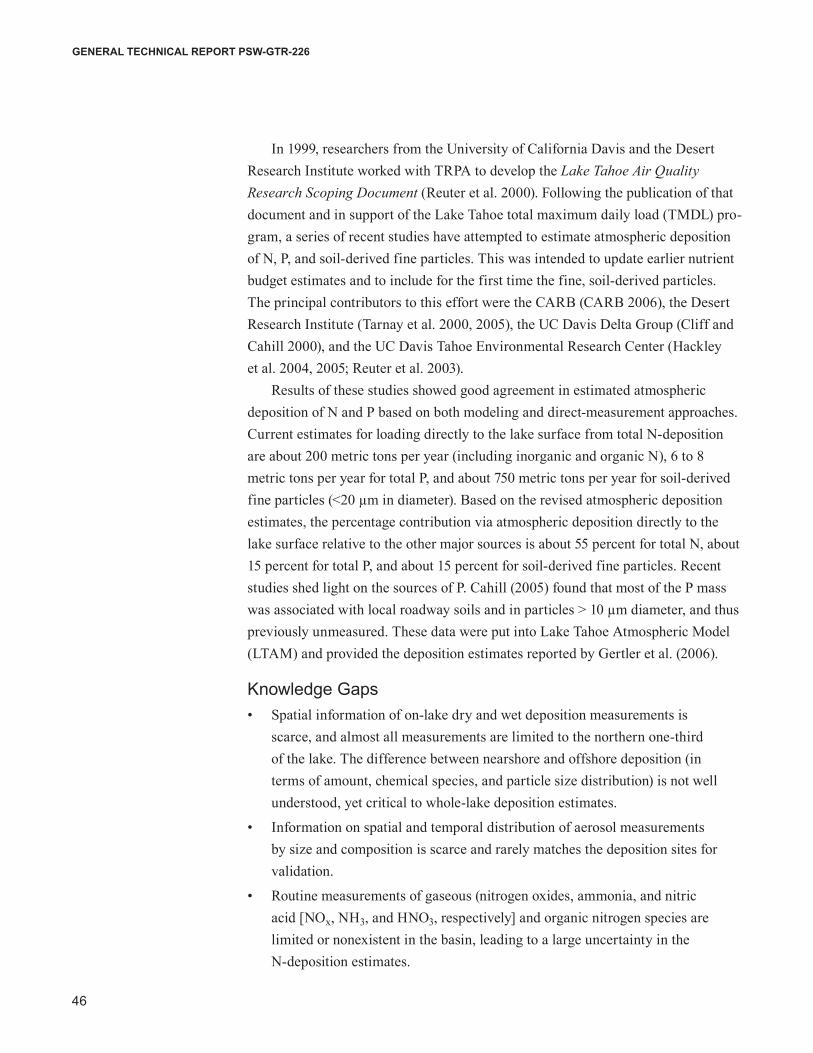
with the minimum total deposition velocity and thus the slowest removal rate occur-ring for particles in the range of 0.04 to 2.0 µm diameter (fig. 3.2).
This simple concept must be greatly modified in practice, when effects of boundary layer resistance and other factors are considered. Complex models have been developed to make these calculations, but direct in situ validation continues to be quite variable. No such model has been developed for Lake Tahoe, although the U.S. Forest Service (USFS) supported the development of a statistical model, the Lake Tahoe Airshed Model, in 2000 (Cliff and Cahill 2000).
In the 1980s, those working to understand the water quality trends in Lake Tahoe took a renewed interest in airborne nutrients (especially P and N) critical to algal growth. Studies of deposition elsewhere in the country (e.g., the Great Lakes) gave added impetus to this idea, as did the Nation’s interest in acid rain and deposition of nitric and sulfuric acids. Airborne substances undoubtedly play a role in Lake Tahoe’s water quality dynamics, but what role, exactly, was unclear at that time. In 1981 and 1982, the staff and consultants working on the Tahoe Regional Planning Agency’s (TRPA’s) threshold standards attempted to estimate the loading rate, in kilograms per hectare per year, of nitric acid that one might expect to see in the Sierra Nevada. Based on the responses received from scientific experts, TRPA estimated annual dissolved inorganic nitrogen load to the surface of Lake Tahoe on the same order of magnitude as the loads coming from surface streams and ground-water inputs. This conclusion—even without monitoring data to confirm it—influ-enced the development of TRPA’s threshold standards and subsequent regional plan. It caused TRPA to look beyond erosion and runoff control as methods to control eutrophication.
Figure 3.2—Plot of deposition velocities for particles. Above 0.3 µm, gravitational settling dominates, whereas below 0.2 µm, diffusion to surfaces dominates.
46
GENERAL TECHNICAL REPORT PSW-GTR-226
In 1999, researchers from the University of California Davis and the Desert Research Institute worked with TRPA to develop the Lake Tahoe Air Quality Research Scoping Document (Reuter et al. 2000). Following the publication of that document and in support of the Lake Tahoe total maximum daily load (TMDL) pro-gram, a series of recent studies have attempted to estimate atmospheric deposition of N, P, and soil-derived fine particles. This was intended to update earlier nutrient budget estimates and to include for the first time the fine, soil-derived particles. The principal contributors to this effort were the CARB (CARB 2006), the Desert Research Institute (Tarnay et al. 2000, 2005), the UC Davis Delta Group (Cliff and Cahill 2000), and the UC Davis Tahoe Environmental Research Center (Hackley et al. 2004, 2005; Reuter et al. 2003).
Results of these studies showed good agreement in estimated atmospheric deposition of N and P based on both modeling and direct-measurement approaches. Current estimates for loading directly to the lake surface from total N-deposition are about 200 metric tons per year (including inorganic and organic N), 6 to 8 metric tons per year for total P, and about 750 metric tons per year for soil-derived fine particles (<20 µm in diameter). Based on the revised atmospheric deposition estimates, the percentage contribution via atmospheric deposition directly to the lake surface relative to the other major sources is about 55 percent for total N, about 15 percent for total P, and about 15 percent for soil-derived fine particles. Recent studies shed light on the sources of P. Cahill (2005) found that most of the P mass was associated with local roadway soils and in particles > 10 µm diameter, and thus previously unmeasured. These data were put into Lake Tahoe Atmospheric Model (LTAM) and provided the deposition estimates reported by Gertler et al. (2006).
Knowledge Gaps• Spatial information of on-lake dry and wet deposition measurements is
scarce, and almost all measurements are limited to the northern one-third of the lake. The difference between nearshore and offshore deposition (in terms of amount, chemical species, and particle size distribution) is not well understood, yet critical to whole-lake deposition estimates.
• Information on spatial and temporal distribution of aerosol measurements by size and composition is scarce and rarely matches the deposition sites for validation.
• Routine measurements of gaseous (nitrogen oxides, ammonia, and nitric acid [NOx, NH3, and HNO3, respectively] and organic nitrogen species are limited or nonexistent in the basin, leading to a large uncertainty in the N-deposition estimates.
47
An Integrated Science Plan for the Lake Tahoe Basin: Conceptual Framework and Research Strategies
• Air quality models have not been developed that adequately incorporate Lake Tahoe’s complex meteorological conditions.
• The deposition of “black carbon” to the lake and its impact on water clarity have not been studied. Black carbon (also known as elemental carbon) is most evident as soot, and is formed through the incomplete combustion of fossil fuel, biofuel, and biomass.
• The distribution between the amount of N, P, and sediment deposited by wet and dry deposition pathways is uncertain.
• The greatest uncertainty in the deposition estimates is associated with soil-derived particle deposition to the lake surface (only 1 year of limited data exist). In addition, estimates of wet deposition of particles are based on measurements that are less direct than measurements of dry deposition of particles.
• The impact of N and P atmospheric deposition to the lake surface in the summer is not well understood. This is a time when biologically available N and P are low and watershed loading is at its annual minimum.
• Atmospheric loading onto the water surface could have a disproportionate effect on lake clarity within the 20- to 30-m Secchi depth; however, this has not been evaluated.
• Atmospheric deposition studies have not accounted for the contribution of pollutant fallout to the land surfaces surrounding Lake Tahoe that is subse-quently delivered to Lake Tahoe via hydrologic processes.
• Existing data are not readily available.
Research Needs• Conduct focused studies (gradient or eddy-correlation studies, along with
measurements of key species) of the sources and pathways of particle depo-sition to better inform models and restoration efforts.
• Add deposition sites on the lake and in the middle and southern sections along the lake.
• Conduct deposition measurements along nearshore-offshore transects and data sets that allow averaging among seasons.
• Add gaseous monitoring capabilities to existing and future sites.
• Add size-segregated and chemically speciated aerosol measurements to quantify the relationship between deposition of particulate matter expressed in terms of weight and the particle chemical composition and size distribu-tion most likely to affect lake clarity.
48
GENERAL TECHNICAL REPORT PSW-GTR-226
• Pursue development of a detailed air quality model that includes transport and deposition modules specific to Lake Tahoe conditions. Develop these models for use as water quality management tools.
• Determine the possible influence of “black carbon” deposition to the lake.
• Ascertain the relationship between pollutants entering via atmospheric deposition and the effects on lake clarity.
• Develop and sustain the infrastructure to combine data from all sources, archive results in easily accessible sources, and publish results.
Local Versus Regional Transport of Air PollutantsAtmospheric pollutants deposited in the Lake Tahoe basin can come from both in-basin and out-of-basin sources (see “Conceptual Model” section and fig. 3.1 for details). In terms of hemispheric atmospheric circulations, California is within the latitude range of prevailing westerly winds. However, because of relatively weak synoptic forcing, wind patterns tend to be modified by differential heating between the land and ocean. Previous studies have described the typical summer flow pat-tern in California as the marine air that penetrates through the Carquinez Straight and bifurcates around the delta region into south and north branches (Frenzel 1962, Hays et al. 1984, Moore et al. 1987, Schultz et al. 1961, Zaremba and Carroll 1999). This primary pattern is superimposed by thermally driven daytime upslope and nighttime downslope flows, hence making pollutant transport possible from the more heavily polluted regions, such as the San Francisco Bay area and the Sacra-mento Valley, up into the Sierra Nevada mountains.
To quantify how much HNO3 is transported from the Central Valley, Sacra-mento, and San Francisco Bay area to the Tahoe basin, Koracin et al. (2004) used advanced numerical atmospheric models (CALMET/CALPUFF, Scire et al. 2000 and MM5, Grell et al. 1995) to estimate the contributions from both in-basin and out-of-basin N sources. Simulations of in-basin emissions and out-of-basin emis-sions were performed separately to determine their relative contributions. The overall simulation results indicated that pollutant transport from the Sacramento Valley and the San Francisco Bay area to the Lake Tahoe basin occurs; however, as indicated in previous studies (Bytnerowicz et al. 2002, Carroll and Dixon 2002, Dillon et al. 2002), pollutant concentrations are significantly diluted on the west slopes of the Sierras at increasing elevations (fig. 3.3). In short, the results of the Koracin et al. (2004) work suggest that although daytime pollutant transport from upwind of the Lake Tahoe basin appears to be likely, the amount of HNO3 trans-ported into the basin is much less than that from in-basin sources. Note that esti-mates of the transport of additional N species (e.g., ammonia, ammonium, nitrate,

49
An Integrated Science Plan for the Lake Tahoe Basin: Conceptual Framework and Research Strategies
Figure 3.3—Nitric acid (HNO3) (µg/m3) plume evolution from the Central California Valley on August 28, 2000, beginning at noon (left panel) and continuing to 11 pm (right panel) from Gertler et al. (2006). Concentrations (filled contours overlaid with topography) are averaged over 3-hour intervals. The enclosed areas surrounding Sacramento and San Francisco designate the emission sources. Note the effects of daytime upslope flows (upper left panel) and nighttime downslope flows (lower right panel). Pollutant concentrations at elevated regions are low, implying minimal HNO3 transport to the basin.
San Francisco
HNO3 concentrations—Aug. 28, 12 to 2 p.m.
Lake Tahoe
HNO3 concentrations—Aug. 28, 3 to 5 p.m.
HNO3 concentrations—Aug. 28, 6 to 8 p.m. HNO3 concentrations—Aug. 28, 9 to 11 p.m.
Sacramento
Sacramento
San Francisco
Latitud
e
-122° -121° -120°Longitude
38
39
Sacramento
38°
39°
Lake Tahoe
-122° -121° -120°Longitude
San Francisco
-122 -121 -120Longitude
38
39
µg/m3
0.05
0.1
0.5
1
3
5
10
20
San Francisco
Sacramento
San Francisco
Sacramento
Sacramento
San Francisco
Sacramento
San Francisco
San Francisco
Sacramento
38°
39°
Lake Tahoe
0.05
0.1
0.5
1
3
5
10
20
Latitud
e
38
39
Latitud
e
-122° -121° -120°Longitude
38°
39°
Lake Tahoe
Lake Tahoe
Lake Tahoe
Lake Tahoe
Lake Tahoe µg/m3
0.05
0.1
0.5
1
3
5
10
20
Latitud
e

50
GENERAL TECHNICAL REPORT PSW-GTR-226
Figure 3.4—Distribution of ambient nitric acid (HNO3) concentrations (µg/m3) in the Lake Tahoe basin and its vicinity in the 2002 summer season from Gertler et al. (2006). Maximum levels (dark brown) are observed west of the lake and decrease with increasing elevation.
Interpolation byKriging (µg/m3)
Sampling stations(µg/m3)
0.5–0.91.0–1.21.3–1.51.6–1.81.8–1.9
0.50–0.650.66–0.800.81–1.101.11–1.251.26–1.401.41–1.551.56–1.80
39°30' N
39°0' N
120°30' W 120°0' W
White Cloud
Forest HillSeed Orchard
Serene Lakes
Hobart Hill
UpperIncline
Watson Creek
ClearCreek
Baker Pass
Valhalla
Riverton Ridge
Loon LakeBlodgett
Sly Park
Kelly Lake TahoeRegionalPark
GenoaPark
Woodford’s
0 5 10 20 30 mi.
Echo Summit
64 Acres
Cave Rock
Sugar PinePoint
nitrogen dioxide, or nitric oxide [NH3, NH4, NO3, NO2, and NO, respectively]), and the contribution from wet deposition were not determined as part of this study.
One of the great difficulties in evaluating air pollution transport into the Tahoe basin is the lack of data on the upwind western slope of the Sierra Nevada. Bytnerowicz et al. (2004) addressed this problem by using inexpensive passive samplers deployed throughout the region. Using a set of O3 and HNO3 concentration measurements, a spatial model of pollutant concentrations was constructed (Frączek et al. 2003). Frączek et al. observed a clear pattern in O3 and HNO3 concentrations over the course of the smog season with the lowest levels occurring in the first half of July and the first half of October, and the highest levels occurring in the second half of August. Elevated O3 and HNO3 concentrations southeast of the Tahoe basin were observed in the second half of August through the second half of September. Seasonal averages for HNO3 are shown in fig. 3.4.
For all pollutants, Bytnerowicz et al. (2004) found decreasing concentrations entering from the west into the Tahoe basin, indicating minimal transport to the lake. They postulated that the mountain range west of Lake Tahoe basin (i.e., Desolation Wilderness) creates a barrier that prevents polluted air masses from the West (Sacramento Valley and foothills of the Sierra Nevada) from entering the Lake Tahoe basin.
51
An Integrated Science Plan for the Lake Tahoe Basin: Conceptual Framework and Research Strategies
Cahill et al. (2004) used size-segregated chemically speciated measurements of chemical species to address the issue of in-basin versus out-of-basin sources of P. Measurements were performed in January 2002 and August 2002 using a particulate sampler developed at UC Davis (Cahill and Wakabayashi 1993) instead of using filter-based measurements. Samples were collected at the South Lake Tahoe site for 12 weeks in winter and 6 weeks in summer to allow analysis of synoptic weather patterns. They found that almost all the P observed occurs in the size fractions between 2.5 and 35 μm, consistent with the theory that resuspended road dust and soil is the major source. Previous studies in the area have used samplers with a 2.5-μm cut-point and thus would have missed the contribution from larger size fractions. This implies that most of the P comes from in-basin sources, as particles in this range tend to deposit rapidly.
Based on these findings, it appears that the majority of atmospheric species contributing to declining lake water clarity in Lake Tahoe come from in-basin sources. Using the emissions inventory estimates presented in the “Visibility in Lake Tahoe” section, the major in-basin sources of N, P, and fine particles are emissions from motor vehicles and areawide sources (e.g., paved and unpaved road dust and residential fuel combustion). In terms of the O3-forming precursors, the most likely sources are motor vehicles and biogenic emissions.
Knowledge Gaps• To date, studies have indicated most of the N, P, and sediment deposition
come from in-basin sources; however, out-of-basin sources contribute to N, PM2.5, and O3 levels in the basin. Quantifying these out-of-basin contribu-tions is recommended.
• The spatial and temporal resolution of airborne N, P, and particles is lim-ited. Most measurements have been performed as part of intensive studies and do not cover all periods of the year or a range of meteorological con-ditions. In addition, many key species and parameters are not monitored (e.g., gaseous N species, P, or size-segregated aerosol chemistry).
• There are limited measurement sites both in the basin and leading up to the basin for use in assessing the sources of the pollutants.
• Direct measurements of plume transport to the basin and deposition have been limited or nonexistent.