an integrated assessment scheme supporting decision making ... · mrf material recovery facilities...
TRANSCRIPT
UNIVERSITÀ DEGLI STUDI DI BRESCIA
DICATAM – Dipartimento di Ingegneria Civile, Architettura, Territorio, Ambiente e di Matematica
Dottorato di Ricerca in
METODOLOGIE E TECNICHE APPROPRIATE NELLA COOPERAZIONE INTERNAZIONALE ALLO SVILUPPO
Settore scientifico disciplinare: ICAR/03 Ingegneria Sanitaria-Ambientale
Ciclo XXVII
An Integrated Assessment Scheme
supporting decision making in waste management in low and middle-income countries
DOTTORANDO Ing. Andrea Perteghella
RELATORE Dott. Ing. Mentore Vaccari
CORRELATORE Dott. Gianni Gilioli
COORDINATORE DEL DOTTORATO Prof. Ing. Carlo Collivignarelli


Table of contents _____________________________________________________________________________________________
Table of contents …………………………………………………………..……. i
List of acronyms ................................................................................................. vii
Abstract (in Italian) ............................................................................................. xi Introduzione ............................................................................................................................................... xi
Obiettivo della ricerca ................................................................................................................................ xii
Struttura della tesi ....................................................................................................................................... xii
Conclusioni ............................................................................................................................................. xiv
Introduction .......................................................................................................... 1
Chapter 1. Integrated Sustainable Waste Management in Developing Countries ............................................................................................................. 5
Abstract ................................................................................................................................................ 5
1.1 The municipal solid waste issue in Developing Countries (DCs) ................................................... 5
1.2 The Integrated Sustainable Waste Management (ISWM) approaches .......................................... 10
1.2.1 Municipal Solid Waste Management: the Historical evolution .............................................. 10
1.2.2 The Schübeler et al. Sustainable Approach ............................................................................... 12
1.2.3 The Arnold van de Klundert et al. Sustainable Concept ........................................................ 13
1.2.3.1 ISWM applied in the real field: The Anschütz et al. assessment guidelines ................. 16
1.3 Wrap-up .............................................................................................................................................. 21
References .............................................................................................................................................. 23
Chapter 2. Multidimensional Assessment Methods for Solid Waste Management systems ....................................................................... 27
Abstract .............................................................................................................................................. 27
2.1 Solid Waste Management Assessment tools ..................................................................................... 27
2.2 The evolution of Solid Waste Management Assessment tools ...................................................... 31
2.3 Multidimensional assessment methods for SWM: an overview in developing countries .......... 35
2.4 Wrap up .............................................................................................................................................. 39
References .............................................................................................................................................. 40
Chapter 3. An Integrated Assessment Scheme for Solid Waste Management in Low and Middle-Income Countries ................................................. 45
Abstract .............................................................................................................................................. 45
3.1 The need of an Integrated Assessment Scheme (IAS) .................................................................... 45
3.2 The scenario analysis ............................................................................................................................ 47
3.3 Scenario Rating System ........................................................................................................................ 48
i
Table of contents _____________________________________________________________________________________________
3.4 Integrated Assessment Scheme dimensions description ................................................................. 50
3.4.1 Economic dimension .................................................................................................................... 50
3.4.1.1 Initial investment cost ........................................................................................................... 52
3.4.1.2 Total waste management cost .............................................................................................. 52
3.4.1.3 Monthly per-capita waste management cost ..................................................................... 52
3.4.1.4 Waste management cost per metric ton of managed waste ............................................ 52
3.4.2 Social dimension ............................................................................................................................ 53
3.4.2.1 Human rights/working conditions ..................................................................................... 60
3.4.2.2 Food security and safety ....................................................................................................... 66
3.4.2.3 Quality of the area ................................................................................................................. 68
3.4.2.4 Good governance .................................................................................................................. 71
3.4.3 Environmental dimension ............................................................................................................ 74
3.3.3.1 Provisioning ecosystem services.......................................................................................... 75
3.3.3.2 Air quality ............................................................................................................................... 76
3.3.3.3 Water quality .......................................................................................................................... 79
3.3.3.4 Soil quality .............................................................................................................................. 83
3.5 Wrap-up ............................................................................................................................................... 86
References ............................................................................................................................................... 87
Chapter 4. Enhancing Solid Waste Management in Zavidovici municipality (Bosnia-Herzegovina) using the IAS ............................................... 93
Abstract ............................................................................................................................................... 93
4.1 Territorial framework overview .......................................................................................................... 93
4.1.1 The Bosnian context ..................................................................................................................... 93
4.1.2 The Zavidovici municipality ........................................................................................................ 94
4.2 Scenario assessment in the Zavidovici municipality ........................................................................ 97
4.2.1 Z0: mixed waste collection (Zavidovici landfill) ....................................................................... 97
4.2.2 Z1: door to door waste collection (Zavidovici landfill) .........................................................104
4.2.3 Z2: door to door waste collection with Roma involvement (Zavidovici landfill) .............108
4.2.4 Z3: door to door waste collection and domestic composting (Zavidovici landfill) ..........111
4.2.5 Z4: door to door waste collection with Roma involvement and domestic composting (Zavidovici landfill) .............................................................................................................115
4.2.6 Z5: mixed waste collection (Zenica landfill) ...........................................................................117
4.2.7 Z6: door to door waste collection (Zenica landfill) ...............................................................120
4.2.8 Z7: door to door waste collection with Roma involvement (Zenica landfill) ....................123
4.2.9 Z8: door to door waste collection and domestic composting (Zenica landfill) .................126
ii
Table of contents _____________________________________________________________________________________________
4.2.10 Z9: door to door waste collection with Roma involvement and domestic composting (Zenica landfill) ................................................................................................................... 129
4.2.11 Sustainability assessment: the scenarios’ comparison ......................................................... 132
4.3 Conclusions .................................................................................................................................... 135
References ............................................................................................................................................ 137
Chapter 5. Enhancing Solid Waste Management in Maxixe municipality (Mozambique) using the IAS .......................................................... 139
Abstract ............................................................................................................................................ 139
5.1 Territorial framework overview ...................................................................................................... 139
5.1.1 The Mozambican context .......................................................................................................... 139
5.1.2 The Maxixe municipality ............................................................................................................ 140
5.2 Scenario assessment in Maxixe municipality .................................................................................. 143
5.2.1 M0: mixed waste collection (30%) and composting of the OFMSW (3%) ....................... 143
5.2.2 M1: mixed waste collection extension (80%) and composting of the OFMSW (3%) ..... 149
5.2.3 M2: mixed waste collection (80%) and composting of the OFMSW (30%) ..................... 153
5.2.4 M3: separate waste collection (80%) and composting of the OFMSW (30%) .................. 156
5.2.5 M4: separate waste collection (80%), composting of the OFMSW (30%) and plastic valorization .......................................................................................................................... 159
5.2.6 Sustainability assessment: the scenario comparison .............................................................. 162
5.3 Conclusions .................................................................................................................................... 165
References ............................................................................................................................................ 167
Chapter 6. Concluding remarks ........................................................................ 169
Annexes .......................................................................................................... 173
Annex 1: Country classification according to income ......................................................................... 173
Annex 2: Summary of the steps in the ISWM assessment process ................................................... 174
Annex 3: Topics, techniques and presentation approaches for the SA ............................................ 175
Annex 4: Topics, techniques and presentation approaches for waste system elements analysis .. 176
Annex 5: Checklist of sites to visit and focus for observation and narrative descriptions ............ 177
Annex 6: Topics, techniques and presentation approaches of the aspects analysis ........................ 178
Annex 7: Use of maps for the waste system element analysis ........................................................... 179
Annex 8: Design data for Z0 scenario ................................................................................................... 180
Annex 9: Design data for Z1 scenario ................................................................................................... 181
Annex 10: Design data for Z2 scenario ................................................................................................. 182
Annex 11: Design data for Z3 scenario ................................................................................................. 183
Annex 12: Design data for Z4 scenario ................................................................................................. 184
iii
Table of contents _____________________________________________________________________________________________
Annex 13: Design data for Z5 scenario .................................................................................................185
Annex 14: Design data for Z6 scenario .................................................................................................186
Annex 15: Design data for Z7 scenario .................................................................................................187
Annex 16: Design data for Z8 scenario .................................................................................................188
Annex 17: Design data for Z9 scenario .................................................................................................189
Annex 18: Design data for M0 scenario ................................................................................................191
Annex 19: Design data for M1 scenario ................................................................................................192
Annex 20: Design data for M2 scenario ................................................................................................193
Annex 21: Design data for M3 scenario ................................................................................................194
Annex 22: Design data for M4 scenario ................................................................................................195
iv


List of acronyms _____________________________________________________________________________________________
List of acronyms
AD Anaerobic Digestion
AHP Analytic Hierarchy Process
ANP Analytic Network Process
BATNEEC Best Available Techniques Not Entailing Excessive Cost
C&D Construction and Demolition waste
CBA Cost-benefit analysis
CBO Community Based Organization
CDM Clean Development Mechanism
CEA Cost effectiveness analysis
CIA Central Intelligence Agency
DALYs Disability Adjusted Life Years
DCDC Dhaka’s Community-based Decentralized Composting
DCs Developing Countries
DEMATEL DEcision MAking Trial and Evaluation Laboratory
DMS Data Management System
DSS Decision Support System
EA Emergy Analysis
Eco-Eff Eco-efficiency analysis
EIA Environmental Impact Assessment
EIA Environmental Impact Assessment
EnTA Environmental Technology Assessment
ES Expert System
FAO Food and Agriculture Organization of the United Nations
FM Forecasting Model
GIS Geographic Information System
HDI Human Development Index
vii
List of acronyms _____________________________________________________________________________________________
IAS Integrated Assessment Scheme
IMS Integrated Modelling System
INE Instituto Nacional de Estatistica/The national Institute of Statistics
IPPC Integrated Pollution Prevention Control
ISWM Integrated Sustainable Waste Management
LCA Life Cycle Assessment
LCC Life Cycle Cost approach
LCI Life Cycle Inventory
LCSA Life Cycle Sustainability Assessment
MAUT MultiAttribute Utility Theory
MBMS Model Base Management System
MCA Multi-Criteria Analysis
MCDA Multi-Criteria Decision Analysis
MCDM Multi-Criteria Decision-Making
MDGs Millennium Development Goals
MFA Material Flow Analysis
MIMES Model for description and optimization of Integrated Material flows and Energy Systems
MIS Integrated Modelling System
MoU Memorandum of Understanding
MRF Material Recovery Facilities
MSI Management System Information
MSW Municipal Solid Waste
MSWM Municipal Solid Waste Management
NGO Non-Governmental Organization
NIMBY Not In My Back Yard
NPV Net Present Value
O&M Operation and Maintenance
viii
List of acronyms _____________________________________________________________________________________________
OFMSW Organic Fraction of Municipal Solid Waste
OM Optimization Model
RA Risk Assessment
RRPLAN Resource Recovery PLANning
SA Stakeholder Analysis
SA Sustainable Assessment
SAFA Sustainability Assessment of Food and Agriculture systems
SAT Sustainability Assessment of Technologies
SD Scenario Development
SDGs Sustainable Development Goals
SEA Strategic Environmental Assessment
SLCA Social Life Cycle Analysis
SM Simulation Model
SNA Social and organizational Network Analysis
SoEA Socio Economic Assessment
UNCED United Nations Conference on Environment and Development
UNDP United Nations Development Programme
UNEP United Nations Environment Programme
UWEP Urban Waste Expertise Programme
WHP Waste Hierarchy Principle
WTE Waste To Energy plants
ix


Abstract _____________________________________________________________________________________________
Abstract (in Italian)
Introduzione La gestione dei rifiuti nei paesi a risorse limitate è una problematica complessa e spesso non è affrontata con la dovuta attenzione da parte degli attori coinvolti, dalle pubbliche amministrazioni ai singoli cittadini. In particolare, la gestione dei rifiuti ha spesso ricevuto un’attenzione secondaria nei confronti di altri aspetti quali l’accesso a fonti d’acqua potabile e a cure sanitarie e alle problematiche dell’approvvigionamento e sicurezza del cibo, come sottolineato anche dagli Obiettivi di Sviluppo del Millennio (MDGs)1. Tuttavia, i rifiuti e le modalità della loro gestione hanno un forte impatto sull’ambiente e sulla salute umana, in quanto rappresentano un’importante fonte di sostanze inquinanti e di perturbazione degli ecosistemi. Quotidianamente nei paesi a risorse limitate vengono prodotti circa 1.200.0002 tonnellate di rifiuti urbani e solo il 20%3 viene raccolto formalmente. Il deposito incontrollato di rifiuti, piuttosto che il loro smaltimento tramite combustione incontrollata, rappresentano le principali forme di gestione dei rifiuti quotidianamente praticate nei paesi a risorse limitate. Questo determina un forte inquinamento di aria, acqua e suolo, che riduce drasticamente la qualità di vita e il benessere delle persone. L’attenzione nei confronti della problematica della gestione dei rifiuti è aumentata verso la fine degli anni ‘90, in considerazione anche degli scarsi risultati ottenuti nell’implementazione di progetti di cooperazione improntati a considerare solo aspetti economici o tecnici a scapito di un approccio olistico a tale problematica nei paesi a risorse limitate4. Nel 2015, gli Obiettivi di Sviluppo Sostenibile (SDGs)5, che di fatto integrano i precedenti Obiettivi di Sviluppo del Millennio, confermano l’importanza di una corretta gestione dei rifiuti al pari delle altre priorità precedentemente descritte negli MDGs, al fine di promuovere lo sviluppo sostenibile. Come già sottolineato, la progettazione e l’implementazione di tecnologie e di soluzioni tecniche per la raccolta, lo smaltimento e la valorizzazione dei rifiuti, è sempre stata difficoltosa, e tutt’ora lo è, anche a causa del contemporaneo scarso utilizzo di strumenti di supporto alle decisioni. Negli ultimi 10 anni sono stati sviluppati differenti strumenti decisionali, utili per la scelta della tecnologia più appropriata a seconda dei vari contenuti e problemi, che tuttavia sono stati applicati principalmente in paesi sviluppati, dove è più facile reperire dati ed informazioni di qualità. Spesso, anche riuscendo a utilizzare uno strumento decisionale, in paesi a risorse limitate, i risultati ottenuti non sono sempre comprensibili dagli attori locali. Inoltre, è importante sottolineare che la maggior parte degli strumenti a supporto delle decisioni utilizzati, studiano ed analizzano un’unica dimensione per volta, venendo meno alla necessità di considerare la multidimensionalità che caratterizza il concetto di sostenibilità, che si basa sulla valutazione integrata delle dimensioni economica, ambientale e sociale. Questi limiti, oltre alla scarsa attenzione posta alla problematica della gestione sostenibile dei rifiuti,
1 MDGs: Millennium Development Goals (http://www.un.org/millenniumgoals/) 2 Hoornweg, D., Bhada-Tata, P. (2012). What a waste. A Global Review of Solid Waste Management. Washington, DC: World Bank. 3 Scheinberg, A., Wilson, D.C., Rodic, L. (2010). Solid Waste Management in the World’s Cities. Earthscan for UN-Habitat, London, UK. 4 Schübeler, P., Wehrle, K., Christen, J. (1996). Conceptual Framework for Municipal Solid Waste in Low-Income Countries. SKAT, St. Gallen, Switzerland. UMP/SDC Collaborative Programme on Municipal Solid Waste Management in Developing Countries, Urban Management Programme (UMP) working paper series no. 9. Available online at: http://www.worldbank.org/urban/solid_wm/erm/CWG%20folder/conceptualframework.pdf. 5 SDGs: Sustainable Development Goals (http://www.un.org/en/development/desa/news/sustainable/sdgs-post2015.html)
xi
Abstract _____________________________________________________________________________________________
hanno sempre ostacolato le decisioni più appropriate in merito alla gestione dei rifiuti. A partire da questa situazione è nata l’esigenza di sviluppare uno strumento di supporto alle decisioni multidimensionale. Tale strumento ha l’obiettivo di valutare contemporaneamente la dimensione economica, ambientale e sociale associate alla gestione sostenibile dei rifiuti nei paesi a risorse limitate.
Obiettivo della ricerca L’obiettivo principale della presente ricerca è quello di sviluppare uno strumento di supporto alle decisioni, in grado di guidare alla gestione sostenibile dei rifiuti in contesti a risorse limitate. Nello specifico, si è voluto sviluppare uno strumento di analisi multidimensionale finalizzato alla valutazione comparativa di differenti schemi di gestione dei rifiuti e delle implicazioni che tali schemi hanno rispetto alle dimensioni ecologiche, economiche e sociali. Lo strumento sviluppato fornisce risultati facilmente comprensibili anche per quei soggetti che non hanno una specifica formazione che gli consenta di cogliere tutti gli aspetti delle tematiche coinvolte nella gestione dei rifiuti. Gli elementi della facilità di utilizzo e della chiarezza nella esposizione dei risultati sono di particolare importanza per i decision makers. Lo strumento sviluppato è stato applicato a due differenti contesti (Bosnia-Erzegovina e Mozambico). L’applicazione ha comportato una fase di ricerca sul campo nei due contesti citati al fine di raccogliere dati, di verificarne l’applicabilità della soluzione metodologica sviluppata e la replicabilità di utilizzo. L’esperienza sul campo ha anche comportato l’interazione con la stakeholder community nei due contesti con cui sono state discusse le soluzioni tecniche caratterizzanti i diversi scenari valutati e le implicazioni delle diverse strategie di miglioramento degli schemi di gestione dei rifiuti.
Struttura della tesi Il presente lavoro è organizzato come segue.
Nel Capitolo 1 viene riportata l’evoluzione della gestione dei rifiuti e come nel tempo sia cambiata l’attenzione verso tale problematica fino al giorno d’oggi. Il capitolo fa principalmente riferimento a come dalla semplice gestione dei rifiuti del passato, principalmente basata sugli aspetti tecnici ed economici, si sia arrivati al concetto di gestione sostenibile dei rifiuti, dove la dimensione economica, ambientale e sociale si trovano ad essere considerate contemporaneamente ed organicamente. Nel presente lavoro, l’attenzione è stata posta sulla gestione dei rifiuti nei paesi a risorse limitate. In questi contesti, gli approcci seguiti fino a metà degli anni ‘90, hanno portato al fallimento di numerosissimi progetti per la cooperazione allo sviluppo, dando l’avvio all’esigenza di nuove idee e di nuovi strumenti di analisi e di supporto alle decisioni. A questo proposito viene presentata la nascita del concetto di gestione integrata e sostenibile dei rifiuti maturata alla fine degli anni ‘90, che ha influenzato successivamente gli approcci e gli schemi di lavoro nel campo delle cooperazione internazionale nel settore della gestione dei rifiuti.
Il Capitolo 2 parla dei differenti strumenti di supporto alle decisioni utilizzati nel campo della gestione dei rifiuti, analizzando la loro evoluzione nel tempo a partire dagli ‘60, che di pari passo ha seguito l’evoluzione tecnica e gestionale dei rifiuti. In particolare, è stata condotta una revisione degli strumenti decisionali applicati al campo dei rifiuti nei paesi a risorse limitate. Tale revisione ha messo in luce come questi strumenti siano in generale scarsamente utilizzati e ancor meno lo sono quelli che considerano gli aspetti multidimensionali della sostenibilità. E’ bene sottolineare che il loro
xii
Abstract _____________________________________________________________________________________________
scarso impiego è dovuto anche alla complessità della loro applicazione, oltre che all’importante mole di dati ed informazioni richiesta, dati che spesso non sono ottenibili o affidabili in paesi in via di sviluppo. Nonostante questi vincoli è chiara la necessità e la validità di sviluppare e applicare strumenti di analisi multidimensionale e di supporto alle decisioni nei paesi a risorse limitate.
Il Capitolo 3 descrive lo strumento multidimensionale di supporto alle decisioni sviluppato durante il dottorato di ricerca (qui definito Integrated Assessment Scheme o IAS:). Lo strumento è basato su una procedura valutativa che tiene conto dalle 3 dimensioni associate al concetto di sostenibilità: la dimensione ambientale, economica e sociale. Il sistema di valutazione ha una natura gerarchica, ciascuna dimensione è stata suddivisa in differenti categorie, ciascuna delle quali, a sua volta, è costituita da specifici indicatori. Lo strumento è utilizzato per valutare differenti schemi di gestione di rifiuti definiti in termini di scenario. Gli scenari sono stati opportunamente ipotizzati al fine di esplorare le conseguenze di un miglioramento della gestione dei rifiuti nel contesto in cui si sta effettuando l’intervento. Gli indicatori economici, espressi in termini monetari, stimano i costi e i ricavi che caratterizzano un dato scenario. Per quanto riguarda gli indicatori sociali ed ambientali sono stati definiti tramite una scala qualitativa che varia da 0 a 4, dove 0 indica il risultato peggiore e 4 è il migliore. La valutazione in termini qualitativi, basata sull’expert judgement, è stata un espediente metodologico a cui si è fatto riferimento per ovviare alla impossibilità di derivare tutte le informazioni quantitative di natura ambientale e le informazioni di tipo sociale che sarebbero state necessarie per la definizione di un assessment scheme completamente quantitativo. Di fatto le risorse disponibili e le già ricordate difficoltà di reperire dati sul campo, oltre che il grado di attendibilità scarso dei dati disponibili, hanno fatto propendere per questa opzione metodologica, del resto ampiamente considerata in molti ambiti valutativi e di risk assessment. I vantaggi ottenuti con questa procedura qualitativa che utilizza esperti, superano di gran lunga i limiti offerti da procedure di assessment soggettive che comunque ovviano ai problemi della incompletezza, della unidimensionalità o della inattendibilità dei dati. Tali vantaggi non devono considerare solo il grado di realismo nella valutazione, ma devono anche considerare i vantaggi offerti dalla possibilità di supportare in modo completo il processo decisionale in pieno dialogo con la stakeholder community. Inoltre, è fondamentale sottolineare che gli scenari proposti, rappresentando future soluzioni tecniche, con differenti implicazioni sulle dimensioni economica, ambientale e sociale, difficilmente possono essere basati su dati e proiezioni precise, e pertanto sarebbe inutile applicare modelli o strumenti complessi per ottenere un risultato che preciso e definitivo non può essere6. Infatti, l’analisi di scenario, su cui si basa questo lavoro di ricerca e lo strumento sviluppato, ha l’obiettivo di consentire una valutazione delle possibili reazioni che possono manifestarsi come conseguenza all’introduzione di una modifica nelle modalità di gestione in un sistema6. In particolare, nella presente ricerca, la valutazione riguarda gli impatti degli scenari di gestione dei rifiuti sulle dimensioni ambientale, economica e sociale. L’applicazione di tale strumento multidimensionale di supporto alle decisioni sarà illustrata nei capitoli 4 e 5.
Il Capitolo 4 riporta l’applicazione dello strumento multidimensionale di supporto alle decisioni, qui sviluppato, al sistema di gestione dei rifiuti nella città di Zavidovici (Bosnia-Erzegovina). L’analisi è stata effettuata nel centro urbano delle città, a maggiore densità abitativa, dove vivono circa 16.000
6 Millennium Ecosystem Assessment (MA), Ecosystem and Human Well-being: Synthesis (2005). Island Press, Washington DC.
xiii
Abstract _____________________________________________________________________________________________
abitanti. Nello specifico è stato analizzato l’attuale inefficiente sistema di gestione dei rifiuti e di conseguenza sono state effettuate differenti proposte tecniche migliorative, descritte in altrettanti scenari. I nuovi schemi di gestione dei rifiuti considerati, propongono una graduale riduzione dell’impatto ambientale, aumentando gradualmente il grado di valorizzazione e recupero dei rifiuti. Per ciascun scenario è stata effettuata la valutazione delle dimensioni economica, ambientale e sociale in accordo alle indicazioni fornite nel capitolo 3. Quindi è stato possibile definire le influenze e gli impatti che ciascuno scenario considerato ha sulle 3 dimensioni. Infine, è stato realizzato un confronto globale tra gli scenari analizzati, valutando separatamente la dimensione economica, ambientale e sociale. Per la dimensione economica è stato considerato l’indice relativo al costo mensile della gestione dei rifiuti per abitante, mentre per la dimensione ambientale e sociale sono state considerate le medie dei punteggi delle categorie costituenti le due dimensioni (4 categorie per la dimensione ambientale e 4 per quella sociale). Tale confronto si è reso necessario al fine di evidenziare le qualità di ciascun scenario e quindi di mettere in condizione i decisori finali locali di poter scegliere lo scenario ottimale considerando le loro necessità.
Il Capitolo 5 riporta l’applicazione dello strumento multidimensionale di supporto alle decisioni al sistema di gestione dei rifiuti nella città di Maxixe (Mozambico). L’analisi è stata effettuata nel quartiere Chambone, appartenente al distretto di Maxixe, dell’omonima città di Maxixe, dove vivono circa 21.000 abitanti, in un ambiente che ha prettamente caratteristiche urbane. A tale contesto è stata applicata la stessa procedura operativa (Capitolo 3) utilizzata per la città di Zavidovici considerando però un insieme di scenari diverso rispetto a quello della citta bosniaca.
Conclusioni L’obiettivo principale del presente lavoro di ricerca è stato quello di sviluppare uno strumento multidimensionale di supporto alle decisioni, basato sull’analisi di scenario e su uno scoring system misto (qualitativo e quantitativo) finalizzato a garantire la sostenibilità della gestione dei rifiuti nei paesi a risorse limitate. Nello specifico il sistema di valutazione considera le implicazioni e gli impatti economici, sociali e ambientali di scenari che propongono soluzioni tecniche per migliorare la gestione dei rifiuti. Lo strumento decisionale è stato applicato e validato prendendo in considerazione due casi di studio (due realtà urbane di piccole dimensioni in Bosnia-Erzegovina e in Mozambico), al fine di comprendere punti di forza e limiti della metodologia sviluppata e quindi la sua replicabilità in altri contesti.
Le principali conclusioni emerse dal presente lavoro di ricerca sono le seguenti:
- lo strumento multidimensionale di supporto alle decisione (IAS) qui sviluppato consente di effettuare valutazioni senza essere vincolati alla necessità di grandi quantità di dati specifici e di qualità elevata, come spesso accade per molti strumenti a supporto delle decisionali più comunemente utilizzati;
- lo strumento proposto è basato sull’analisi di scenario, ovverosia un approccio metodologico
che permette di capire e valutare i possibili cambiamenti in uno specifico sistema in conseguenza della scelta di uno specifico set di opzioni di intervento finalizzate a migliorare la gestione dei rifiuti nei paesi a risorse limitate;
xiv
Abstract _____________________________________________________________________________________________
- lo strumento decisionale (IAS) permette di effettuare la valutazione comparativa di scenari sulla base delle implicazioni che le opzioni di gestione hanno rispetto alle 3 principali dimensioni della sostenibilità (economica, sociale ed ambientale), consentendo quindi una valutazione più integrata (olistica) rispetto a molti degli strumenti attualmente in uso che invece, nella maggior parte dei casi, considerano una singola dimensione;
- lo scoring system che lo strumento decisionale (IAS) utilizza è di facile interpretazione anche per i non addetti ai lavori. Nello specifico la dimensione sociale ed ambientale esprimono i risultati finali su una scala di valori adimensionali compresa tra 0 e 4, dove 0 indica il risultato peggiore e 4 il migliore;
- per la valutazione della dimensione economica i risultati sono espressi in termini quantitativi
utilizzando unità monetarie. La valutazione economica si è avvalsa di dati quantitativi raccolti in loco, pertanto i risultati finali hanno una buona accuratezza e significatività;
- per la valutazione delle dimensioni sociale ad ambientale si è fatto riferimento ad uno scoring
system qualitativo che parte dalla opinione di esperti (expert judgement). La valutazione soggettiva dell’esperto è considerata un valido e spesso indispensabile strumento per la comprensione della dinamica di sistemi complessi oggetto di interventi di gestione. In quanto basate su giudizi soggettivi le valutazioni qualitative relative alle dimensioni sociale e ambientale sono o possono essere gravate da una quota di incertezza anche grande. Quindi, la significatività della valutazione finale può essere seriamente vincolata dal giudizio espresso e dalle abilità della persona incaricata alla valutazione;
- l’utilizzo di questo strumento (IAS) richiede un’adeguata conoscenza del contesto analizzato,
pertanto richiede sopralluoghi sul campo, al fine di poter comprendere i fattori e le dinamiche del sistema analizzato e, allo stesso tempo, raccogliere dati ed informazioni in merito alla gestione dei rifiuti ed ai principali attori coinvolti. Questa attività può rappresentare un vincolo in quanto richiede tempo e risorse;
- l’applicazione dello IAS deve essere effettuata da persone che hanno una buona conoscenza
sia in materia di gestione dei rifiuti e dei relativi processi e tecnologie utilizzate per il loro trattamento, sia che possano comprendere le dinamiche e le relazioni che intercorrono fra gli elementi che compongono il sistema analizzato nelle sue dimensioni economiche, sociali e ambientali. L’aspetto della multidisciplinarità è molto importante al fine di ottenere risultati attendibili e significativi, e quindi può rappresentare un vicolo nell’applicazione del metodo e nella valutazione degli scenari;
- lo strumento decisionale permette di effettuare una valutazione comparativa della
sostenibilità degli scenari analizzati, senza tuttavia porre vincoli assoluti al peso delle diverse componenti coinvolte nell’assessment. E’ infatti affidato non solo al valutatore ma anche agli altri membri della stakeholder community il compito di stabilire i pesi relativi delle varie componenti valutate in funzione dei contenti e degli obiettivi;
- l’applicazione dello IAS a casi di studio in Bosnia-Erzegovina e Mozambico, ha evidenziato un’ottima adattabilità dello strumento sviluppato ad entrambe i contesti, che presentano
xv
Abstract _____________________________________________________________________________________________
caratteristiche ambientali e socio-economiche sostanzialmente diverse, questo testimonia a favore della possibilità di implementare questo strumento in altri contesti;
- le sostanziali differenze che presentano i due casi di studio analizzati (differenti pratiche di
gestione dei rifiuti, differenti abilità tecniche, differente conoscenza e sensibilità verso le problematiche causate dai rifiuti, differenti stili di vita, abitudini e tradizione, e differenti risorse economiche), implicano il fatto che le conclusioni della valutazione non possono che essere sito-specifiche anche se alcune delle soluzioni tecniche per migliorare la gestione dei rifiuti ipotizzate sono le stesse nei due siti
- lo strumento IAS può essere anche utilizzato successivamente all’implementazione di uno
degli scenari proposti, con l’obiettivo di ripetere la stessa analisi a distanza di tempo e quindi valutare la effettiva sostenibilità dello scenario adottato (follow-up).
xvi

Ringraziamenti
Il primo ringraziamento va al Prof. Carlo Collivignarelli che mi ha permesso di affrontare il percorso di dottorato e di approfondire le mie conoscenze professionali. Grazie all’Ing. Mentore Vaccari a al dott. Gianni Gilioli che mi hanno seguito e supportato durante tutto il percorso di ricerca. Un grazie a tutti i colleghi e amici dell’ufficio che mi hanno sopportato, soprattutto negli ultimi mesi di scrittura tesi. Un grazie particolare va all’amico “Prof” Rondi che durante le cene di casa Cetamb ha sempre condiviso le mie paranoie mentali in merito al lavoro di ricerca e alla scrittura tesi. Vorrei ringraziare inoltre lo staff di CeLIM e di ADL a Zavidovici per l’importante supporto logistico durante le missioni in Mozambico e in Bosnia.

Introduction _____________________________________________________________________________________________
Introduction Waste management in low and middle income countries is a rather complex issue and is often faced with little attention by the involved stakeholders, such as the executive staff, the municipality, the citizens, and so on. In particular, waste management has often received secondary attention compared to the problems linked to drinking water access, health care services and food access, as also clear by the objectives of the Millennium Development Goals (MDGs)7. Nevertheless, waste and waste management have a strong impact on the environment and human health. Daily, approximately 1,200,0008 tons of waste is produced in low and middle income countries and just the 20%9 is formally collected. The uncontrolled waste open dumping everywhere rather than its uncontrolled open burning are the main types of waste management daily practiced in low and middle income countries, leading to a strong air, water and soil pollution, which drastically reduces the quality of life and the human well-being. The attention to the waste management problem has increased towards the end of the 90s, as a consequence of the high failure ratio achieved by the cooperation project implementations, which were mainly based on economic and technical aspects, instead of a sustainable holistic approach10 11. In 2015, the Sustainable Development Goals (SDGs)12 launch confirms the proper waste management as a priority, and effectively integrates the previous targets reported in the Millennium Development Goals (MDGs), with the final aim to strongly disseminate the sustainable development. As already mentioned, the design and the implementation of technologies and technical solutions for waste collection, disposal and recovery have always been challenging, and still they are, even due to the poor use of tools and methodologies to support the decision making process for waste management in low and middle income countries. Over the past 10 years, different decision-making tools have been developed in order to choose the most appropriate technology, according to the different set of faced problems, even if they have been mainly applied in developed countries, where is rather easy to obtain good quality data and information. Often, even if the use of decision supporting tools is feasible in low and middle income countries, the obtained results are not always understandable by local stakeholders. Moreover, it is important to note that most of the tools used to support the decision making process study and analyze a single dimension per time, failing to fulfill the sustainability concept, which is based on the integrated assessment of economic, environmental and social dimensions. All these limits, in addition to the lack of attention against the waste management, have always hindered the choice of the most appropriate and sustainable waste management technologies and solutions. Therefore, the development of a multi-dimensional tool to support the decision making process is necessary in order to fill this gap. In particular, the tool
7 MDGs: Millennium Development Goals (http://www.un.org/millenniumgoals/) 8 Hoornweg, D., Bhada-Tata, P. (2012). What a waste. A Global Review of Solid Waste Management. Washington, DC: World Bank. 9 Scheinberg, A., Wilson, D.C., Rodic, L. (2010). Solid Waste Management in the World’s Cities. Earthscan for UN-Habitat, London, UK. 10 Schübeler, P., Wehrle, K., Christen, J. (1996). Conceptual Framework for Municipal Solid Waste in Low-Income Countries. SKAT, St. Gallen, Switzerland. UMP/SDC Collaborative Programme on Municipal Solid Waste Management in Developing Countries, Urban Management Programme (UMP) working paper series no. 9. Available online at: http://www.worldbank.org/urban/solid_wm/erm/CWG%20folder/conceptualframework.pdf. (Accessed: 26/09/2014). 11 Van de Klundert, A., Anschütz, J. (2001). Integrated Sustainable Waste Management – The concept. Waste, Gouda, The Netherlands. 12 SDGs: Sustainable Development Goals (http://www.un.org/en/development/desa/news/sustainable/sdgs-post2015.html)
1
Introduction _____________________________________________________________________________________________
developed in this research, which is named Integrated Assessment Scheme (IAS), simultaneously evaluates the economic, environmental and social dimensions in order to satisfy the sustainability concept as concerns the waste management in low and middle income countries. Indeed, the main objective of this research was to develop an integrated assessment strategy to support the decision making process, in order to promote a sustainable waste management in low and middle income countries. In particular, a multi-dimensional tool was developed to evaluate and compare different waste management solutions and their changes and implications into the economic, social and environmental dimensions. Moreover, this assessment scheme was also elaborated in order to provide easy understandable results, even for those people who are not properly trained as concerns all the aspects linked to the waste management. The ease and the clarity are the two elements that characterize this tool in terms of outputs (i.e. the way to present the results) for the decision makers. The integrated assessment scheme was implemented in two different contexts (Bosnia-Herzegovina and Mozambique), which have required a research phase in the field in order to collect data, verify the feasibility of the methodological solution developed and its further applicability. The field experience allowed the interaction with the stakeholders community in both the analyzed contexts, where the proposed technical solutions to improve the waste management were discussed. The work is organized as follow. Chapter 1 shows the waste management evolution during the time and the attention and interest changes as concerns this issue, from the past to nowadays. The Chapter presents how the waste management was transformed into the integrated sustainable waste management, thanks to the introduction of the sustainability concept, where the economic, environmental and social dimensions have to be simultaneously considered. In particular, the attention to the waste management issues in low and middle income countries increased at the end of the 90s, due to the high ratio of failure of many international cooperation projects. Consequently, and for these reasons, at the end of the 90s the concept of integrated sustainable waste management was born and officially disseminated in the field of the international cooperation.
Chapter 2 presents the different decision support tools developed in the field of waste management, pointing out their evolution over time since the 60s, which at the same time was influenced by the technical novelties introduced to improve the waste management systems. In particular, this Chapter reports a review carried out on the decision-making supporting tools implemented on waste management case studies in low and middle income countries. The review has shown a poor use of decision making supporting tools, especially as concerns the multi-dimensional evaluations. It is worth to point out that the use of these tools is not spread due to the complexity of their implementation, as well as the high amount of data and information required, which often are also not available or reliable in low and middle income countries. Despite these constraints, it clearly appears the need to develop a multi-dimensional tool to support the decision making process in waste management, especially in challenging areas as low and middle income countries. Chapter 3 describes the multi-dimensional tool, named Integrated Assessment Scheme (IAS), developed during this research. The tool is based on an assessment procedure that takes into account the three dimensions representing the pillars of the sustainability concept: the economic, environmental and social dimensions. The evaluation system has a hierarchical structure, where each
2
Introduction _____________________________________________________________________________________________
dimension is divided into different categories, which are further composed by specific indicators. This tool is useful for evaluating different waste management schemes, which are designed into different scenarios. The scenarios were appropriately hypothesized in order to analyze and understand the consequences caused by a waste management improvement into the investigated context. The economic indicators are expressed in monetary terms, are calculated by means of estimation costs and revenues entailed into the designed scenario, and mainly depend on the type of the technical waste management solution adopted. On the contrary, the social and environmental indicators are qualitative and are defined by a qualitative value scale, from 0 to 4, where 0 is the worst result and 4 the best one. This qualitative evaluation is based on the expert judgment, a methodological expedient which is used to be independent by the need to define all the quantitative environmental and social information, which would have been necessary in order to completely define a quantitative assessment scheme. Nevertheless, the field data collection difficulties and their low reliability, especially in low and middle income countries, have suggested the use of this methodological approach, which is, anyway, widely considered into the risk assessment field. The advantages obtained with this qualitative procedure, which employs experts, far exceed the limits provided by the subjective assessment procedures and allow to overcome the low or absent data reliability. These advantages do not have to just consider the realism degree of the assessment, but should also consider the achievable benefits, fully supporting the decision-making process through an open dialogue with the stakeholder community. It is important to underline that each designed and proposed scenario represents future technical solutions, which will entail different influences, actions and reactions on the economic, social and environmental dimensions of the considered context. These scenarios are rarely based on precise data, therefore it would be useless the implementation of complex tools or models in order to obtain accurate results, which could not be precise13. Indeed, the scenario analysis, which the present research work is based on, is aimed at carrying out an evaluation about possible changes, actions and reactions entailed as a consequence of the introduction of waste management novelties in a specific context. In particular, in this research work, the assessment concerns the impact of the waste management scenarios on the economic, environmental and social dimensions. Chapter 4 and 5 will show the integrated assessment scheme implementation into 2 different contexts. Chapter 4 presents the integrated assessment scheme (IAS) application in Zavidovici city (Bosnia and Herzegovina), in order to improve its waste management. The analysis was performed in the urban city center, where about 16,000 inhabitants live. In particular, the current waste management scheme was analyzed from the economic, social and environmental points of view and, then, different technical proposals were designed in order to improve it. The new waste management schemes propose a gradual reduction of the environmental impact towards a gradual enhancement of the waste collection, recovery and disposal ratio. For each scenario, the evaluation of the economic, environmental and social dimensions was carried out according to the guidelines provided in Chapter 3. Therefore, the scenario impacts were defined for the 3 considered dimensions. Finally, an overall scenario comparison was carried out, analyzing separately the economic, environmental and social dimensions. The monthly per-capita waste management cost is the considered indicator for the economic dimension comparison, while the average values of the scores
13 Millennium Ecosystem Assessment (MA), Ecosystem and Human Well-being: Synthesis (2005). Island Press, Washington DC.
3
Introduction _____________________________________________________________________________________________
calculated for the categories, which compose the environmental and social dimensions, represent the values used for the scenario comparison concerning these two dimensions. This comparison was useful in order to highlight the scenario qualities and allow local stakeholders to choose the most suitable scenario according to their basic needs. Chapter 5 presents the IAS application in Maxixe city (Mozambique), in order to improve its waste management scheme. The analysis was carried out in the Chambone neighborhood, which is an urban context belonging to Maxixe city, where approximately 21,000 inhabitants live. In this context, the same operating procedure (Chapter 3) used for Zavidovici city has been applied, obviously considering a different scenario set compared to the Bosnian context.
4

Integrated Sustainable Waste Management in Developing Countries _____________________________________________________________________________________________
Chapter 1. Integrated Sustainable Waste Management in Developing Countries
Abstract Waste management in developing countries has always represented a big challenge to overcome. The main consequences due to the waste mismanagement concern environmental pollution and its related direct or indirect risks that could severely harm human health. Since the Middle Ages, people made efforts to solve the issues caused by the absence of waste management. Step by step, the attention to this problem increased until nowadays, especially in developed countries, where is possible to use a set of sophisticated different technologies and approaches for the waste treatment. In particular, an evolution concerning the way of thinking at the waste management can be observed. At the beginning, single treatment options were employed, just to treat one specific item, until in the 70s the Integrated Solid Waste Management (ISWM) concept was developed, which consists in a global way to manage waste, where more technical treatment options interact together, driven by the necessity to reduce the environmental pollution and the related risks for human health. Despite the succession of all these novelties in the field of the waste management, in the recent past, a lot of humanitarian projects that failed in developing countries were recorded. The main problem of these failures was likely the approach, too much technical and similar at the one applied in developed countries (e.g. sophisticated technologies that were difficult to maintain from the economic point of view, so when the project supervision and financing support stopped, the technologies were abounded by the local stakeholders/beneficiaries). In the early 90s, European members in charge of international cooperation recognized this problem, and in the later years founded a new approach to face and support waste management in developing countries. This new approach was based on the Sustainability concept, hence, Integrated Solid Waste Management changed in Integrated Sustainable Waste Management, while maintaining the same acronym: ISWM. This Chapter presents a brief overview on the waste management issues in developing countries, and reported at the same time the evolution of the waste management way of thinking along the past history, from the Middle Ages to nowadays.
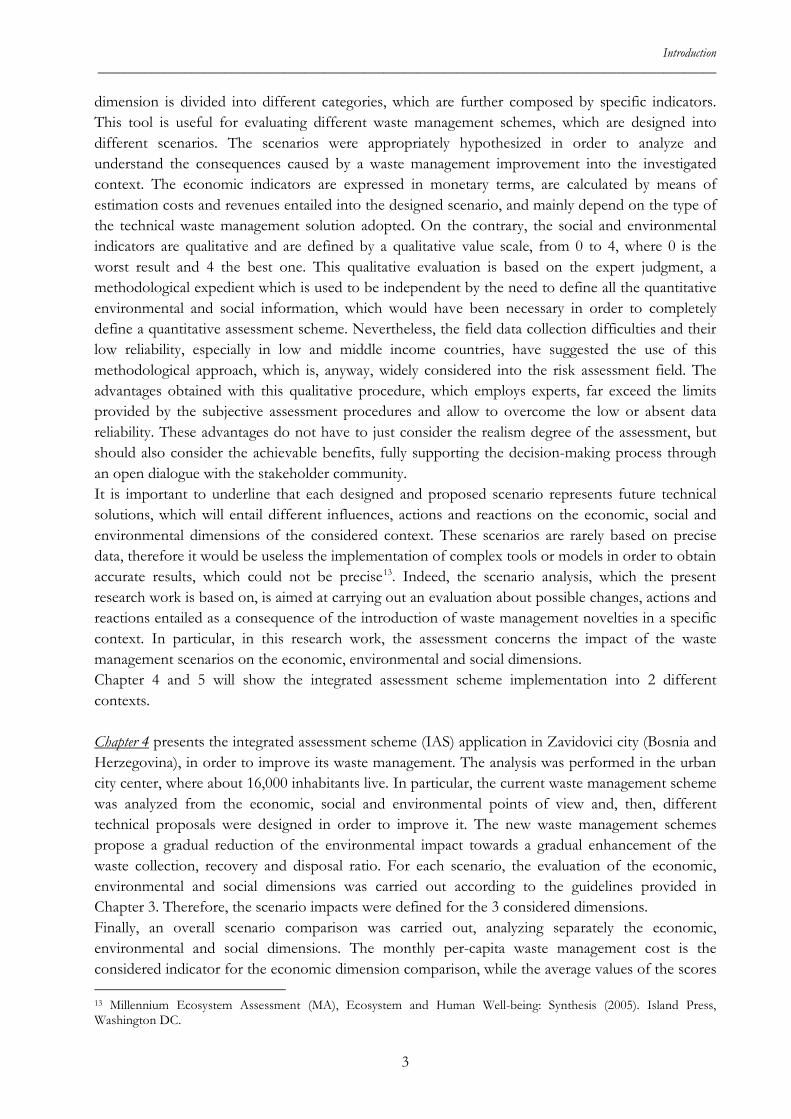
1.1 The municipal solid waste issue in Developing Countries (DCs) It is widely known that Municipal Solid Waste Management (MSWM) in developing countries represents a big issue for all the stakeholders (e.g. the population, administrative bodies, private enterprises, Non-Governmental Organizations - NGOs, Community Based Organizations - CBOs) involved in it [1-4], and especially for the managers and service providers who are in charge of guaranteeing waste collection and disposal. In the last 20 years, MSW generation increased rapidly [5], mainly due to the fast population growing and the intensive people migration from the rural areas to the city [1], looking for better living conditions (since cities generally offer more public services than rural areas), putting waste management system into serious difficulties as a first consequence. As pointed out in Table 1.1, waste production in 2025 will double compared to the current estimations and this is mainly due to the effect of the enhancement of the economic markets and the expansion of industrialization sector. Indeed, step by step, these two elements are improving the living standards, even if the fast population growing rate is likely the most influent factor concerning the total amount of waste generated. Table 1.1 shows how the income level has a strong
5
Integrated Sustainable Waste Management in Developing Countries _____________________________________________________________________________________________
influence on the amount of waste produced as aforementioned (Annexe 1 reports country classification according to income).
Table 1.1 MSW generation by income [5]
Region
Year 2012 Projection for 2025
Urban Population
[millions]
Urban Waste Generation Projected population Projected Urban Waste
Per capita [kg/capita/day]
Total [tons/day]
Total population [millions]
Urban population [millions]
Per capita [kg/capita/day]
Total [tons/day]
Lower Income 343 0.6 204,802 1,637 676 0.86 584,272
Lower Middle Income
1,293 0.78 1,012,321 4,010 2,080 1.3 2,618,804
Upper Middle Income
572 1.16 665,586 888 619 1.6 987,039
High Income 774 2.13 1,649,547 1,112 912 2.1 1,879,590
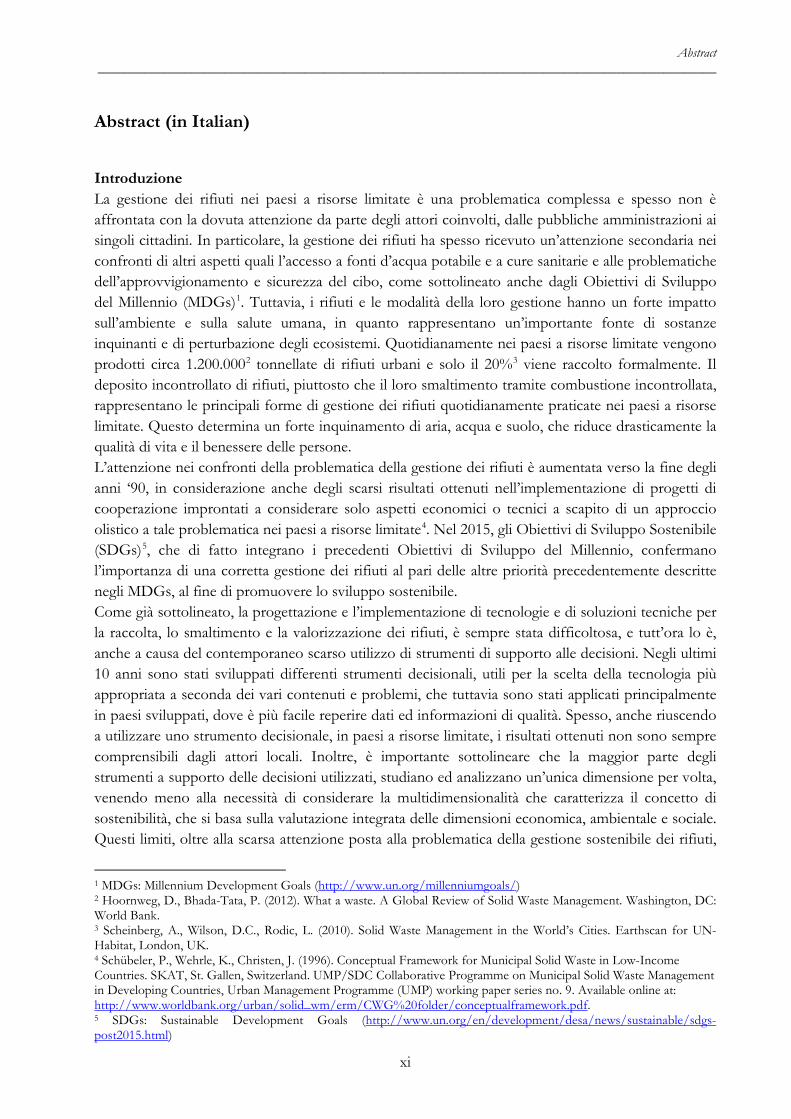
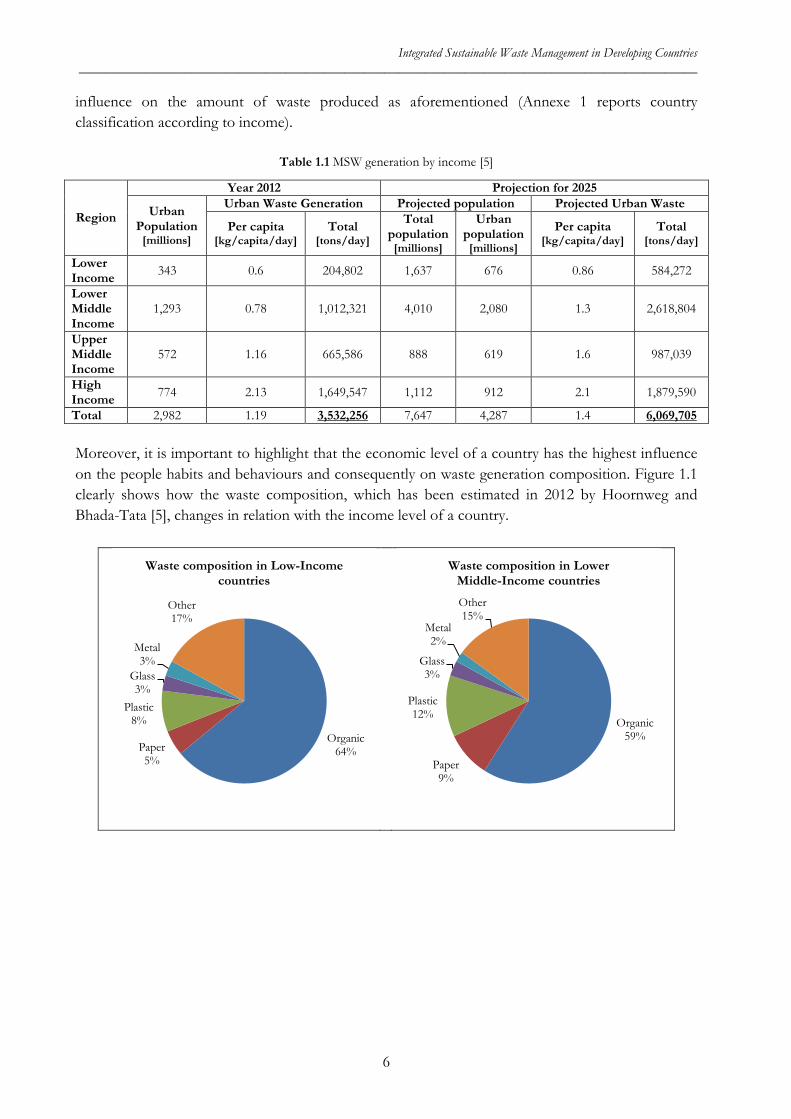
Total 2,982 1.19 3,532,256 7,647 4,287 1.4 6,069,705 Moreover, it is important to highlight that the economic level of a country has the highest influence on the people habits and behaviours and consequently on waste generation composition. Figure 1.1 clearly shows how the waste composition, which has been estimated in 2012 by Hoornweg and Bhada-Tata [5], changes in relation with the income level of a country.
Organic64%Paper
5%
Plastic 8%
Glass 3%
Metal 3%
Other 17%
Waste composition in Low-Income countries
Organic59%
Paper9%
Plastic 12%
Glass 3%
Metal 2%
Other 15%
Waste composition in Lower Middle-Income countries
6
Integrated Sustainable Waste Management in Developing Countries _____________________________________________________________________________________________
Figure 1.1 Waste composition by income level [5]
Italy and many other developed countries represent the historic examples of countries that, just in 50 years since the early 60s, have rapidly changed their living standards, due to the enhancement of the industrial and economic sectors, changing at the same time the waste composition. In particular, an organic waste reduction was observed, jointly with an increase of packaging waste (e.g. nowadays people buy much more pre-cooked food than in the past, determining an increase of packaging waste instead of the organic fraction). Table 1.2 and 1.3 show the global waste composition estimations, distributed by different income levels, in 2012 and 2025 respectively.
Table 1.2 Type of waste composition by Income level (2012) [5]
2012 Estimates [%] Income Level Organic Paper Plastic Glass Metal Other Low Income 64 5 8 3 3 17 Lower Middle Income 59 9 12 3 2 15 Upper Middle Income 54 14 11 5 3 13 High Income 28 31 11 7 6 17
Table 1.3 Type of waste composition by Income level (2025) [5]
2025 Estimates [%] Income Level Organic Paper Plastic Glass Metal Other Low Income 62 6 9 3 3 17 Lower Middle Income 55 10 13 4 3 15 Upper Middle Income 50 15 12 4 4 15 High Income 28 30 11 7 6 18
Waste composition reported in Table 1.2 and 1.3 shows a slightly decreasing trend as concerns the organic waste fraction and a slightly increasing trend concerning the packaging wastes, especially considering the low and middle income countries. It is worth to note that both trends are slight and slow, due to the fact that the estimation projections for 2025 are strictly close in terms of time to the 2012 estimations. In fact, this period of time is not long enough to entail a stronger and effective change in people habits and behaviors able to influence waste composition. As initially mentioned, MSW management is a big challenge to face in developing countries, in particular it is a problem that meets low attentions and poor efforts by local authorities, governments and all the other stakeholders [6], although the upcoming consequences have a strong
Organic54%
Paper14%
Plastic 11%
Glass 5%
Metal 3%
Other 13%
Waste composition in Upper Middle-Income countries
Organic28%
Paper31%
Plastic 11%
Glass 7%
Metal 6%
Other 17%
Waste composition in High-Income countries
7
Integrated Sustainable Waste Management in Developing Countries _____________________________________________________________________________________________
negative sound in the cities and on the citizens, from environmental and human health points of view. There are lot of factors that lead to waste mismanagement [7-11], such as:
- lack of awareness about the environmental and health damages caused by an inadequate waste management;
- lack of environmental laws; - lack of sound on technical and administrative knowledge; - lack of money and funds to invest in new structures, vehicles and buildings; - lack of organizational competencies; - lack of specialized technicians and workers; - corruptions; - armed conflicts; - natural disasters (e.g. earthquake, tsunami, etc.).
Another important constraint that could hamper the waste management activities is represented by the lack of standard definitions of Municipal Solid Waste, formally recognized by all the stakeholders, or in other words a clear answer at the following question [12]: “What is Municipal Solid Waste?”. Indeed, the definition of Municipal Solid Waste (MSW) can differ country by county [12]. Mainly, MSWs could be defined as wastes generated by household and similar wastes generated by commercial and industrial premises, by institutions like public offices, schools, hospitals, prisons, by public spaces, with the exception of wastes generated by industrial processes and hazardous wastes [12]. In some cities Construction and Demolition (C&D) wastes are considered MSW. Anyway, unlike the general definition aforementioned, in many developing country cities, the MSW is also composed by hazardous wastes like electrical and electronic equipment and by healthcare wastes (infectious wastes, sharps and needles) [13]. Thus, the knowledge of the waste composition and the type of wastes considered MSW is crucial in order to make the right considerations and address the proper management, as best as possible. The consequences to all the constraints that severely hinder the MSW management are represented by environmental and health issues that directly or indirectly entail serious health risks to the people, either to the workers involved in the waste management or the nearby inhabitants [14]. Generally, the people feel the waste just as visual pollution, source of bad odors, or just simply a physic obstacle that does not allow the transfer in that way. So, people in developing countries principally consider the waste just a “thing” that annoys their five senses, without perceiving fully and clearly the direct and indirect risks of waste pollution at which they are undergone. Cointreau [14] proposed a list of the most common injury issues caused by the inadequate waste management, divided them into two categories:
- A) Occupational Health and Injury Issues: o Back and joint injuries from lifting heavy waste-filled containers and driving heavy
landfill and loading equipment; o Respiratory illness from ingesting particulates, bio-aerosols, and volatile organics
during waste collection, and from working in smoky and dusty conditions at open dumps;
o Infections from direct contact with contaminated material, dog and rodent bites, or eating of waste-fed animals;
o Puncture wounds leading to tetanus, hepatitis, and HIV infection; o Injuries at dumps due to surface subsidence, underground fires, and slides;
8
Integrated Sustainable Waste Management in Developing Countries _____________________________________________________________________________________________
o Headaches and nausea from anoxic conditions where disposal sites have high methane, carbon dioxide, and carbon monoxide concentrations;
o Lead poisoning from burning of materials with lead-containing batteries, paints, and solders.
- B) Environmental Health and Injury Issues o Contaminated leachate and surface runoff from land disposal facilities affecting
down gradient ground and surface water quality; o Methane and carbon dioxide air emissions from land disposal facilities adding to
global warming, and subsequently vector-borne disease abundance and pathogen survival;
o Volatile organic compounds in air emissions and inconclusive evidence on altered cancer incidence, birth defects, and infants mortality, as well as psychological stress for those living near solid waste incinerators or inadequately controlled land disposal facilities;
o Animals feeding on solid waste providing a food chain path for transmitting animal and human diseases;
o Uncontrolled wastes retaining water and clogged drains, thus leading to stagnant waters which encourage mosquito vector abundance;
o Uncontrolled wastes providing food and breeding sites for insect, bird and rodent disease vectors.
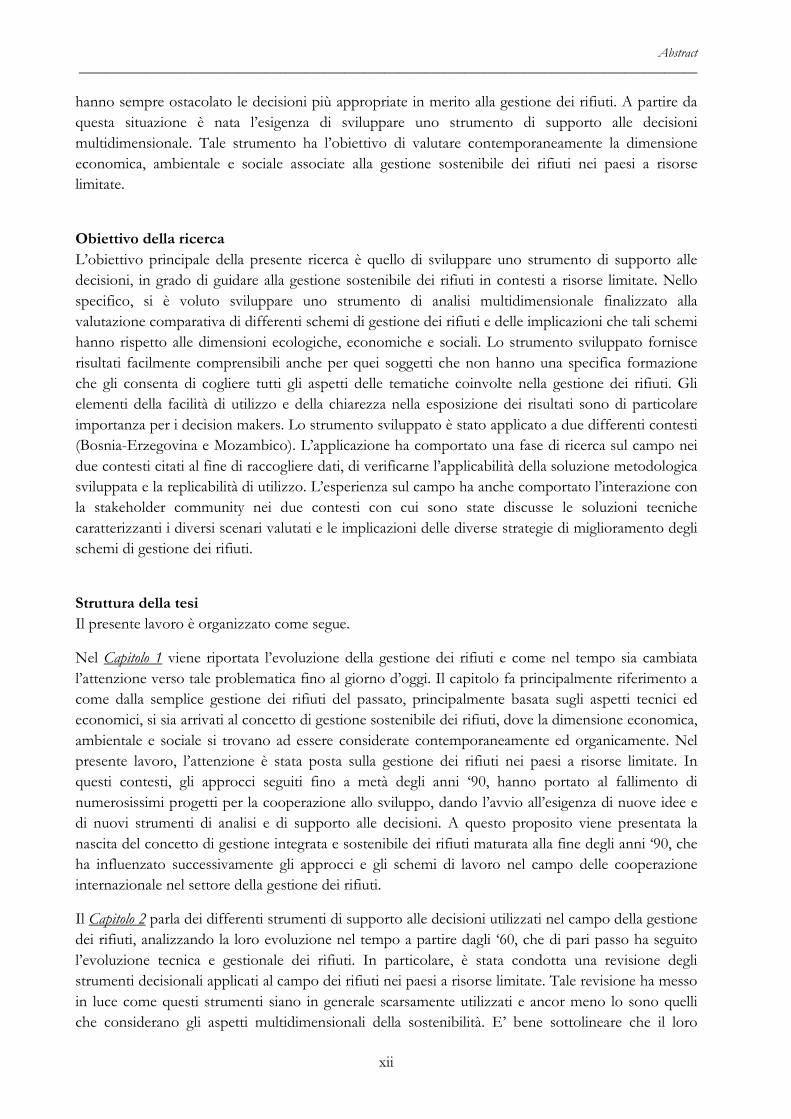
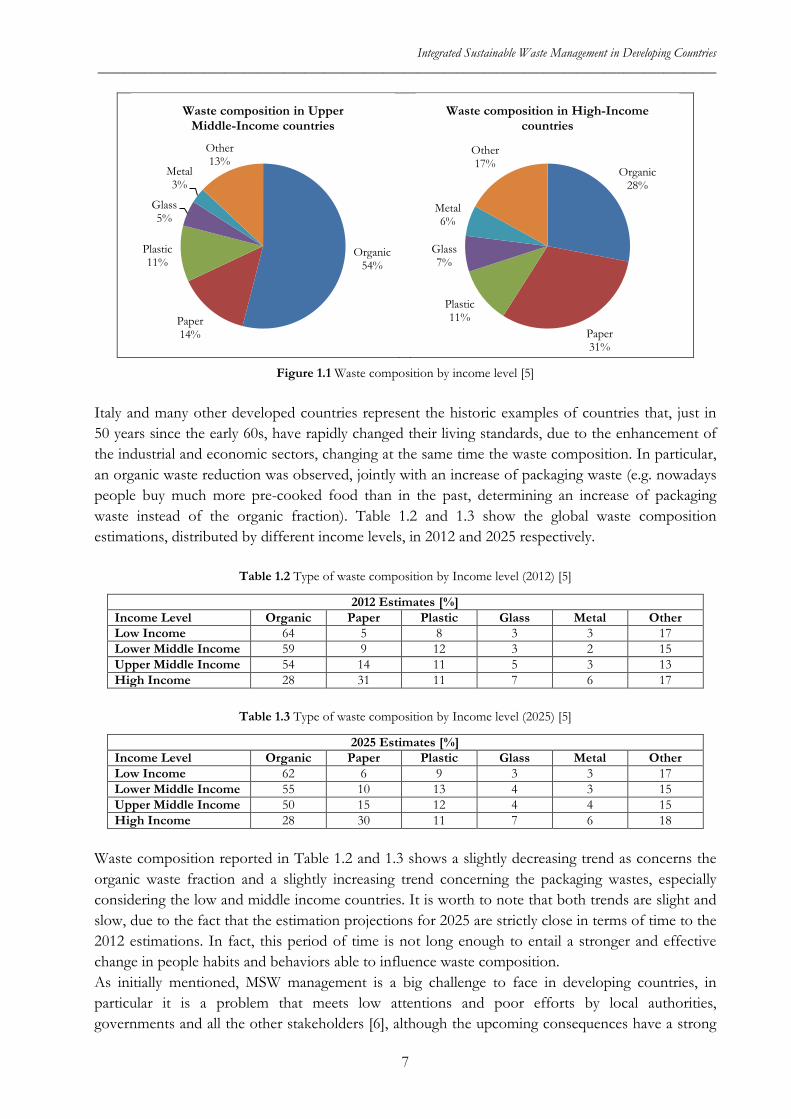
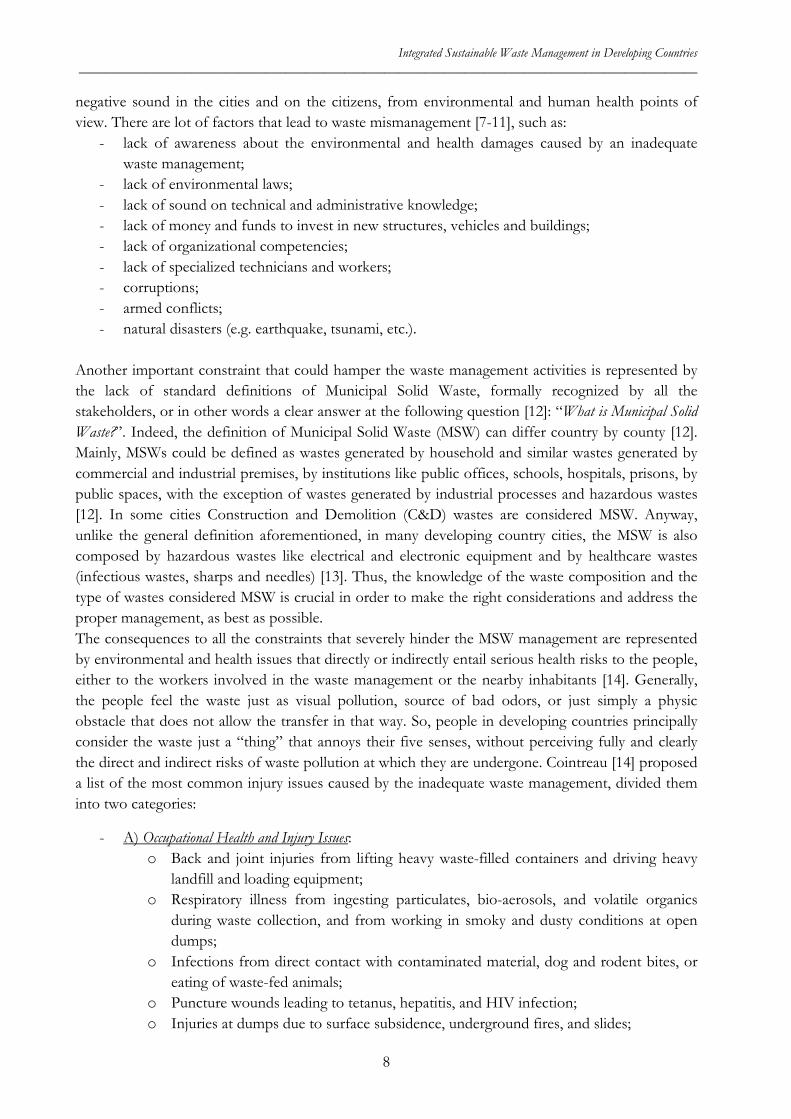
Figure 1.2 shows how the inappropriate waste management can threaten human health, highlighting some of the main risks already mentioned in the above list, and which people could be exposed to.
Figure 1.2 Routes of exposure to hazards caused by open dumping [15]
It is important to point out that the human risks could be directly or indirectly. People who formally (e.g. municipality’s workers with recognized contracts) or informally (e.g. scavengers) work in close contact with the waste are the most vulnerable to injuries, diseases or illnesses especially considering
9
Integrated Sustainable Waste Management in Developing Countries _____________________________________________________________________________________________
the proximity to wastes and the consequent quickness at which they can meet the involved risks. Inhabitants, in most of the cases, are subjected to the indirect effects deriving from the waste mismanagement and bad disposal practices, such as drinking contaminated water or cultivating fruits and vegetables in polluted soil using at the same time contaminated water for watering plants. Anyway, citizens have not the perception and enough awareness about all these risks associated with the waste mismanagement. Consequently, they are not able to solicit and demand the improvement of the waste management to the local authorities, in charge to provide the service of waste collection and disposal. Moreover, the inappropriate way, which citizens dispose their household waste with, cannot bring them to the consciousness of claiming their basic rights and needs to live in a safe place, from the human health point of view. As reported in this first paragraph, MSW and waste management in developing countries need more efforts, in order to guarantee safe living places, without health risks for people. Although in the last 20 years developed countries addressed much more attentions on this issue, with the aim of improving the proper waste management enhancing the awareness and knowledge of the local people, even providing appropriate technologies, buildings and equipment, developing countries are still far away from adequate living standards.
1.2 The Integrated Sustainable Waste Management (ISWM) approaches
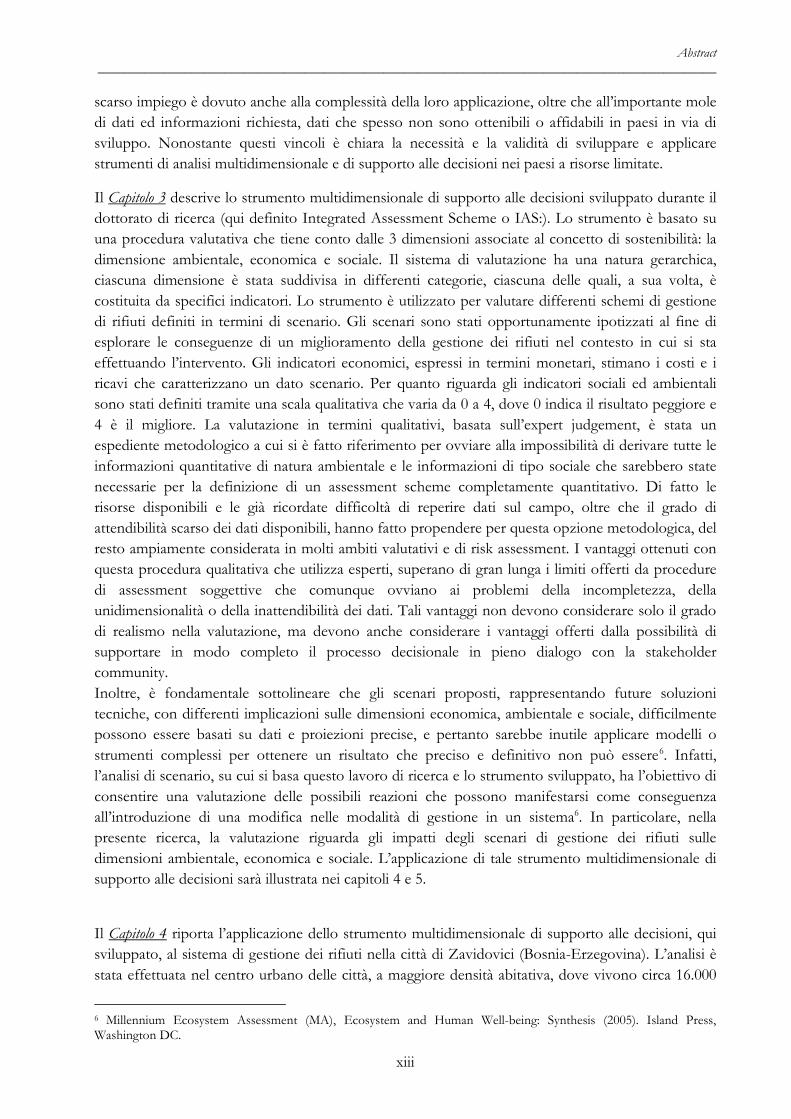
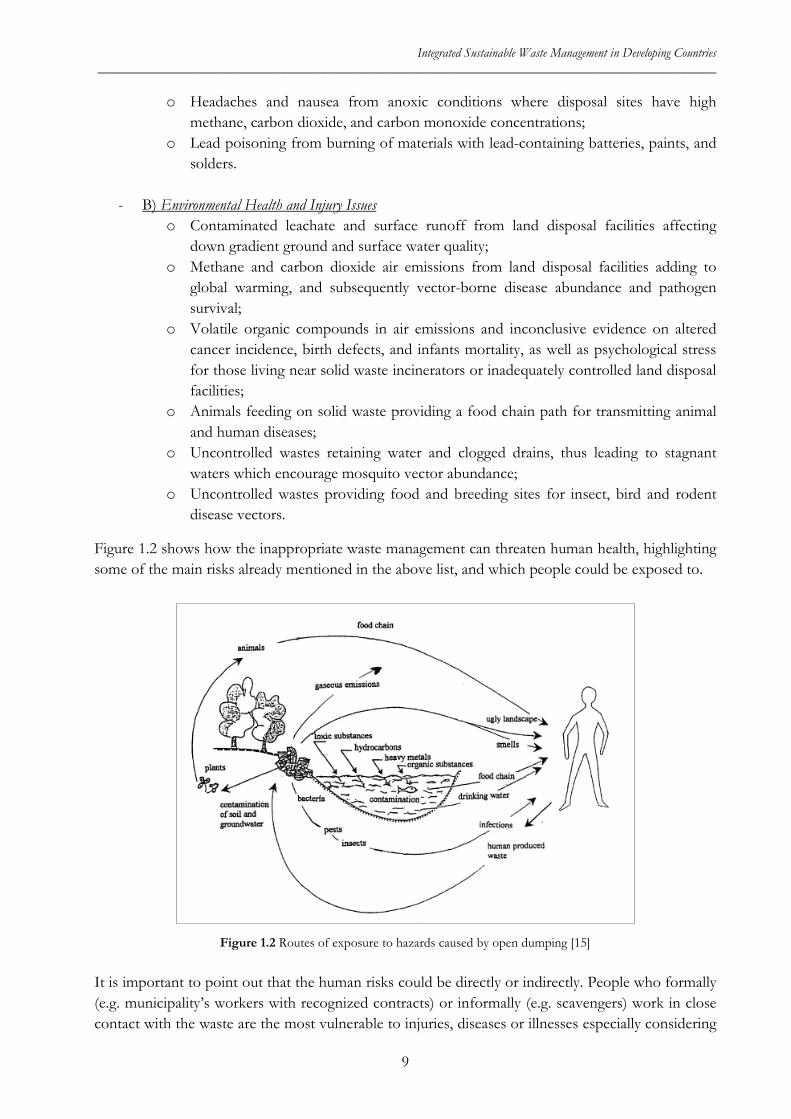
1.2.1 Municipal Solid Waste Management: the Historical evolution Integrated Sustainable Waste Management (ISWM) is a rather recent approach to appropriately manage MSW, for both developed and developing countries [16]. This new concept of waste management represents the last evolution of the way to face and solve the problems caused by the waste generation and its mismanagement, which have repeatedly and continuously been improved during the past history, since 1000 [17]. In 2007, Wilson [17] reported an interesting study about the evolution of people waste perceptions and the concept of waste management, pointing out the main ‘drivers’ that have featured the way of thinking and acting, per each historic period. During the Middle Ages (1000-1800), there was not any sort of waste management, and all the people were far away from the knowledge and awareness about it. In the cities, streets were covered with a smelly and unhealthy mix of household waste, human and animal excreta, exposing the citizens to serious risks (Figure 1.3).
Figure 1.3 Examples of waste mismanagement in the Middle Ages
10
Integrated Sustainable Waste Management in Developing Countries _____________________________________________________________________________________________
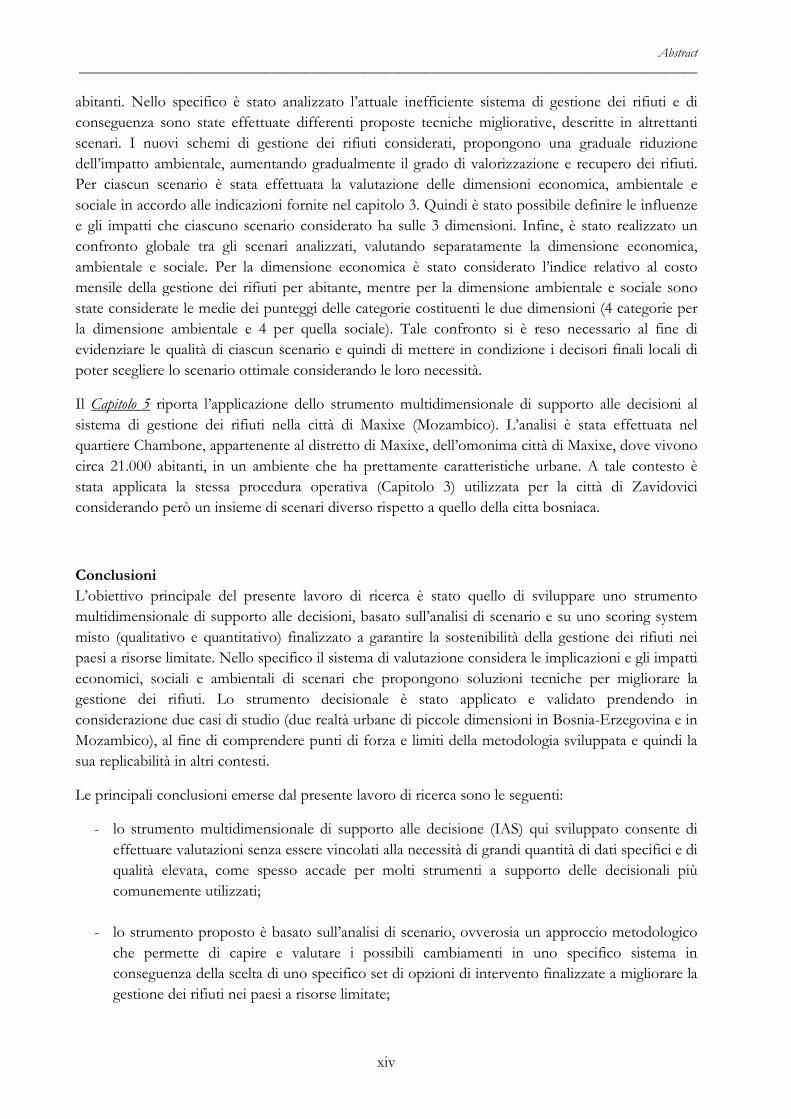
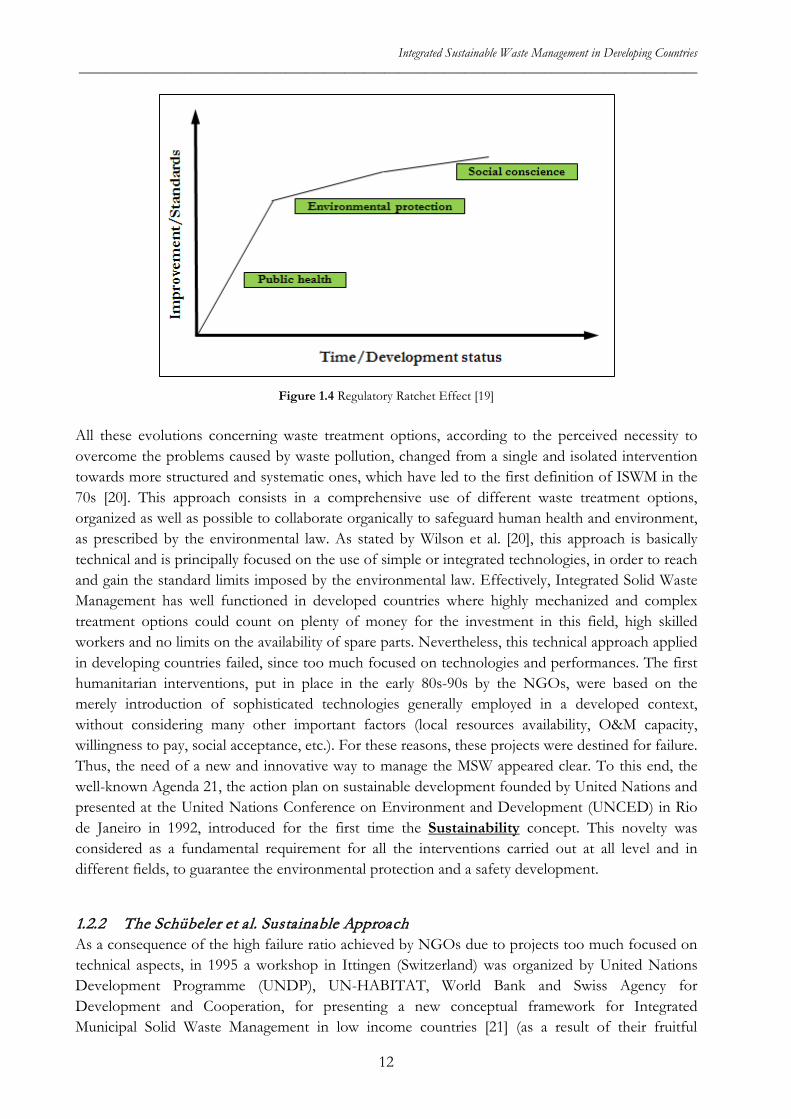
Even if the history remembers some sporadic attempt to remove the waste from the streets, the main problem that people had at that time, especially the poorest, was the daily meal, and how to have it, just like it is happening in these days in developing countries. Nevertheless, the high poverty and the need to save and earn money were essential for the survival. Consequently the waste value became the first driver. Indeed, people before to throw away some items tried to repair them, and at the same time to collect saleable waste with the aim to earn money. Then, during 1800-1850, some formal activities tied at the waste management were registered in London, driven by the value of waste in a more systematically way than in the past. Thanks to the industrial revolution and the rapid urban expansion, the demand of bricks for the building construction increased. At this point, the municipal waste became more valuable, because it was composed by recyclable material with the potential reuse in the bricks production “factories”. Fifty years later, between 1850-1900, a new driver, the public health, was born. In 1848, in England, the first public health Act was enacted, thanks to the Sanitation Commission that recognized the linkages between infectious diseases such as cholera and the absence of proper sanitation conditions. This new law required to put the household waste in an dedicated place that would have been later emptied by the local authorities, in charge of the collection and disposal service. Luckily, at the same time, even other countries were developing safety interventions in order to reduce health risks, especially infectious diseases. Even in the subsequent 70 years, the public health still remained the main driver, which determined the first and full interest to manage the waste that the history had never seen before, following this principle: “getting the waste out from underfoot”. Anyway, during this period, new drivers were born, such as technological innovation and resources scarcity that entail recycling activities. However, the applied solutions for waste disposal, such as uncontrolled dumping or burning with energy recovery, were not environmental friendly, since these treatments produce a huge environmental pollution. This approach can easily be compared to the current situation in most of developing countries, where the main solution to get away the waste is the disposal in open dumps [18] (uncontrolled dump, without any collection system for the emissions), or sometimes, and in the best cases, engineered or sanitary landfills [18] (controlled waste disposal, with the aim to collect gaseous and liquid emissions). Finally, starting by 1970, the environmental protection became another new driver that entailed the introduction of waste management policy necessary to address waste disposal solution for the environmental and human health safeguard. Figure 1.4 represents a Philip Rushbrook14 personal reflection that perfectly explains the evolution of the waste management interest. The first driver is the public health, which rapidly and intensely brings to an improved standard, then, reached safety health conditions, the improvement is subsequently influenced by the environmental protection, even if less rapidly and for a longer period of time than public health. Finally the social conscience represents the driver that completes the path to gain an integrated waste management system, but its influence requires much more time to impose changes than public health.
14 Head of Public Service Implementation Team, UK Government.
11
Integrated Sustainable Waste Management in Developing Countries _____________________________________________________________________________________________
Figure 1.4 Regulatory Ratchet Effect [19]
All these evolutions concerning waste treatment options, according to the perceived necessity to overcome the problems caused by waste pollution, changed from a single and isolated intervention towards more structured and systematic ones, which have led to the first definition of ISWM in the 70s [20]. This approach consists in a comprehensive use of different waste treatment options, organized as well as possible to collaborate organically to safeguard human health and environment, as prescribed by the environmental law. As stated by Wilson et al. [20], this approach is basically technical and is principally focused on the use of simple or integrated technologies, in order to reach and gain the standard limits imposed by the environmental law. Effectively, Integrated Solid Waste Management has well functioned in developed countries where highly mechanized and complex treatment options could count on plenty of money for the investment in this field, high skilled workers and no limits on the availability of spare parts. Nevertheless, this technical approach applied in developing countries failed, since too much focused on technologies and performances. The first humanitarian interventions, put in place in the early 80s-90s by the NGOs, were based on the merely introduction of sophisticated technologies generally employed in a developed context, without considering many other important factors (local resources availability, O&M capacity, willingness to pay, social acceptance, etc.). For these reasons, these projects were destined for failure. Thus, the need of a new and innovative way to manage the MSW appeared clear. To this end, the well-known Agenda 21, the action plan on sustainable development founded by United Nations and presented at the United Nations Conference on Environment and Development (UNCED) in Rio de Janeiro in 1992, introduced for the first time the Sustainability concept. This novelty was considered as a fundamental requirement for all the interventions carried out at all level and in different fields, to guarantee the environmental protection and a safety development.
1.2.2 The Schübeler et al. Sustainable Approach As a consequence of the high failure ratio achieved by NGOs due to projects too much focused on technical aspects, in 1995 a workshop in Ittingen (Switzerland) was organized by United Nations Development Programme (UNDP), UN-HABITAT, World Bank and Swiss Agency for Development and Cooperation, for presenting a new conceptual framework for Integrated Municipal Solid Waste Management in low income countries [21] (as a result of their fruitful
12
Integrated Sustainable Waste Management in Developing Countries _____________________________________________________________________________________________
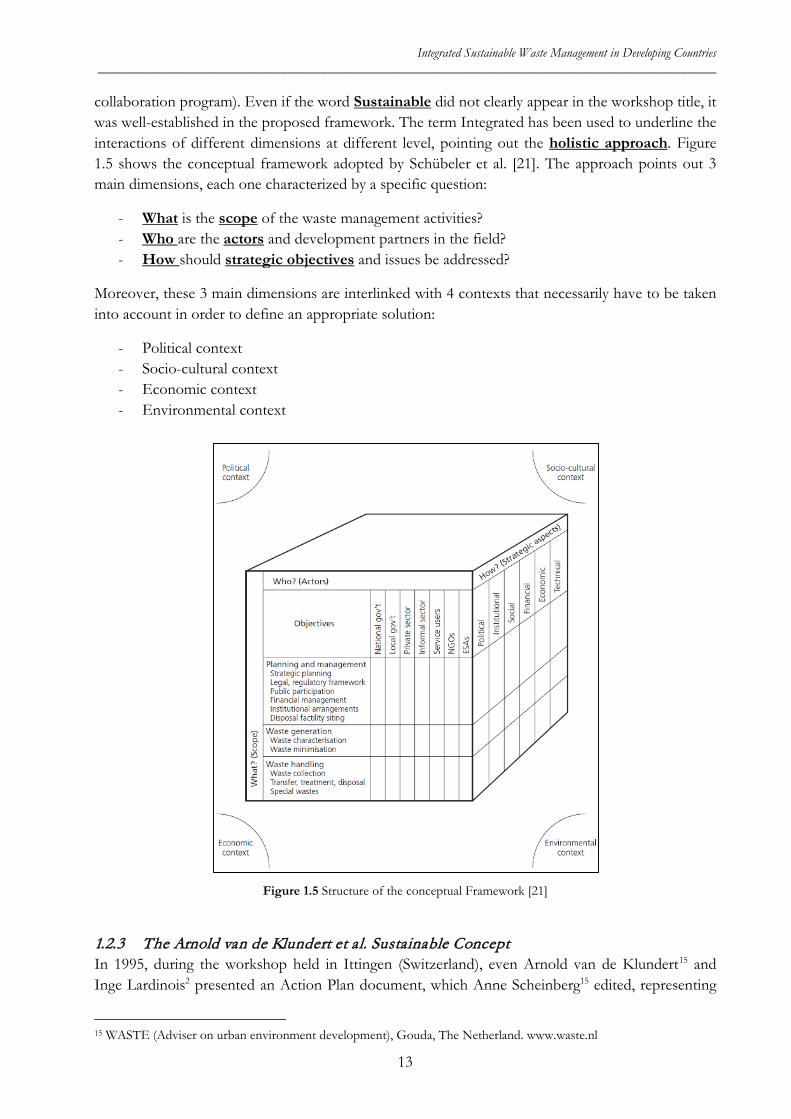
collaboration program). Even if the word Sustainable did not clearly appear in the workshop title, it was well-established in the proposed framework. The term Integrated has been used to underline the interactions of different dimensions at different level, pointing out the holistic approach. Figure 1.5 shows the conceptual framework adopted by Schübeler et al. [21]. The approach points out 3 main dimensions, each one characterized by a specific question:
- What is the scope of the waste management activities? - Who are the actors and development partners in the field? - How should strategic objectives and issues be addressed?
Moreover, these 3 main dimensions are interlinked with 4 contexts that necessarily have to be taken into account in order to define an appropriate solution:
- Political context - Socio-cultural context - Economic context - Environmental context
Figure 1.5 Structure of the conceptual Framework [21]
1.2.3 The Arnold van de Klundert et al. Sustainable Concept In 1995, during the workshop held in Ittingen (Switzerland), even Arnold van de Klundert15 and Inge Lardinois2 presented an Action Plan document, which Anne Scheinberg15 edited, representing
15 WASTE (Adviser on urban environment development), Gouda, The Netherland. www.waste.nl
13
Integrated Sustainable Waste Management in Developing Countries _____________________________________________________________________________________________
the first step towards the Integrated Sustainable Waste Management concept [16]. One year later, in 1996, Arnold van de Klundert founded the Urban Waste Expertise Programme (UWEP), a six-year course with the aim to develop a clear framework regarding Integrated Sustainable Waste Management, based on the experiences achieved on the field lesson learnt in developing countries. The working paper proposed a set of tools in order to allow the decision-makers to understand the problems first, and then looking for the solutions concerning the waste management system. The Integrated Sustainable Waste Management concept is based on 4 basic principles [16]:
- Equity: all citizens entitled to an appropriate waste management system for environmental health reason;
- Effectiveness: the waste management model applied will lead to safety remove all wastes; - Efficiency: the management of all wastes is done by maximising the benefits, minimising
the costs and optimising the use of resources, taking into account equity, effectiveness and sustainability;
- Sustainability: the waste management system is appropriate to the local conditions and feasible from a technical, environmental, social, economic, financial, institutional and political perspective. It can maintain itself over the time without exhausting resources upon which it depends on.
Upon these core principles, 3 main dimensions were set up, contributing to structure the framework:
1- The stakeholders involved into the waste management, representing people or organizations with interests in the waste management. For instance:
a. Local authorities b. Environmental associations c. Schools d. Citizens e. Donors f. Private sector g. Informal sector (waste pickers; itinerants waste buyers; h. Waste dealers i. Waste wholesalers j. Recycling enterprises k. End-user industries l. etc.
2- The practical and technical elements of the waste system. This dimension is mainly composed by the material flow (from waste generation to waste disposal) and the related city legislation that defines the waste treatment option and who is in charge to manage it. Figure 1.6 explains the elements of the waste system.
14
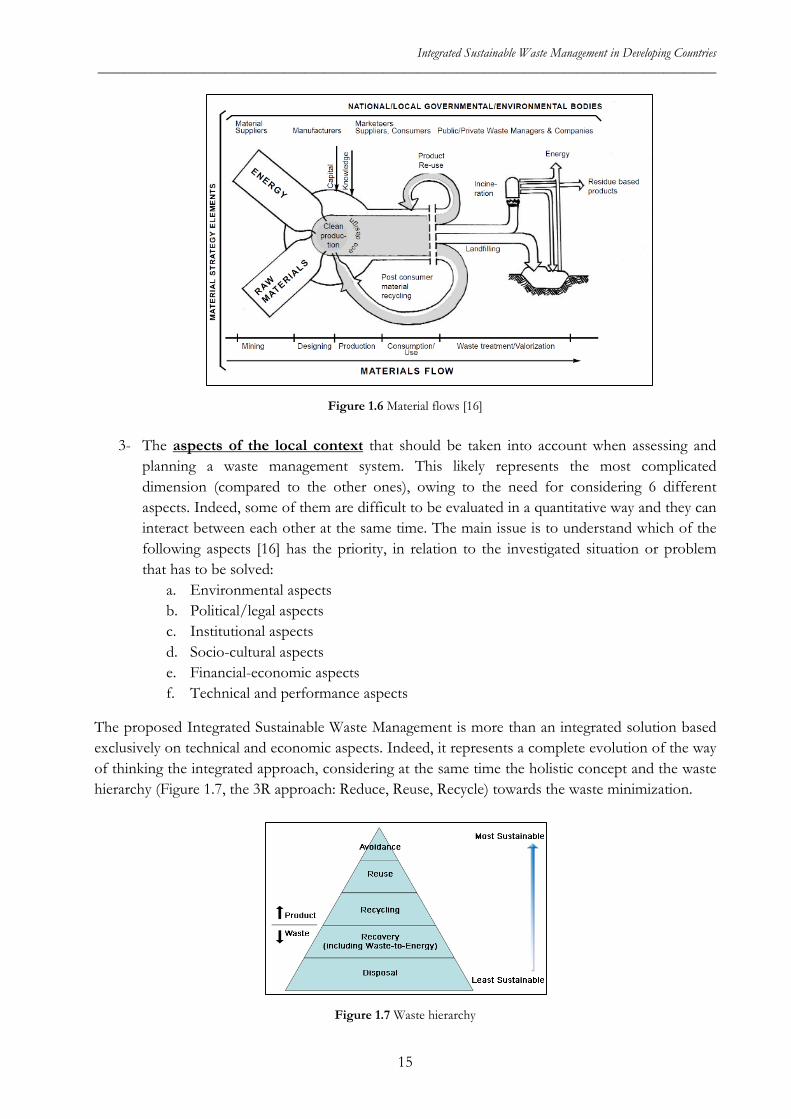
Integrated Sustainable Waste Management in Developing Countries _____________________________________________________________________________________________
Figure 1.6 Material flows [16]
3- The aspects of the local context that should be taken into account when assessing and
planning a waste management system. This likely represents the most complicated dimension (compared to the other ones), owing to the need for considering 6 different aspects. Indeed, some of them are difficult to be evaluated in a quantitative way and they can interact between each other at the same time. The main issue is to understand which of the following aspects [16] has the priority, in relation to the investigated situation or problem that has to be solved:
a. Environmental aspects b. Political/legal aspects c. Institutional aspects d. Socio-cultural aspects e. Financial-economic aspects f. Technical and performance aspects
The proposed Integrated Sustainable Waste Management is more than an integrated solution based exclusively on technical and economic aspects. Indeed, it represents a complete evolution of the way of thinking the integrated approach, considering at the same time the holistic concept and the waste hierarchy (Figure 1.7, the 3R approach: Reduce, Reuse, Recycle) towards the waste minimization.
Figure 1.7 Waste hierarchy
15
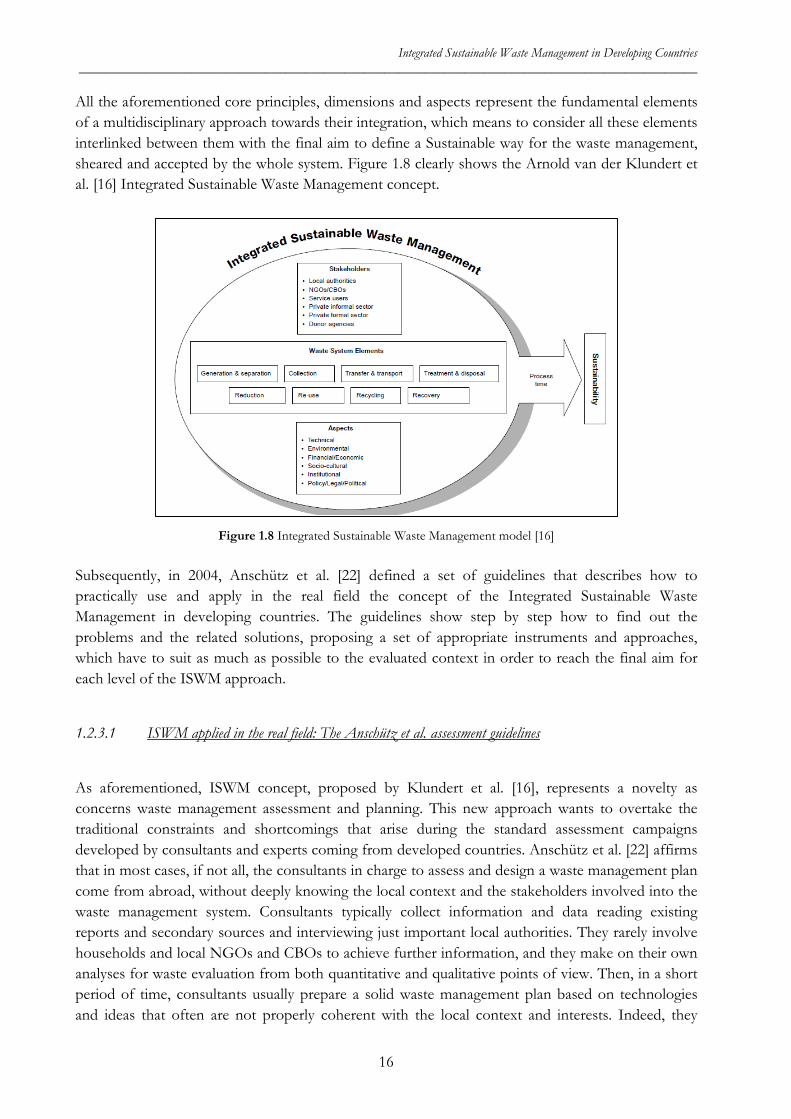
Integrated Sustainable Waste Management in Developing Countries _____________________________________________________________________________________________
All the aforementioned core principles, dimensions and aspects represent the fundamental elements of a multidisciplinary approach towards their integration, which means to consider all these elements interlinked between them with the final aim to define a Sustainable way for the waste management, sheared and accepted by the whole system. Figure 1.8 clearly shows the Arnold van der Klundert et al. [16] Integrated Sustainable Waste Management concept.
Figure 1.8 Integrated Sustainable Waste Management model [16]
Subsequently, in 2004, Anschütz et al. [22] defined a set of guidelines that describes how to practically use and apply in the real field the concept of the Integrated Sustainable Waste Management in developing countries. The guidelines show step by step how to find out the problems and the related solutions, proposing a set of appropriate instruments and approaches, which have to suit as much as possible to the evaluated context in order to reach the final aim for each level of the ISWM approach.
1.2.3.1 ISWM applied in the real field: The Anschütz et al. assessment guidelines
As aforementioned, ISWM concept, proposed by Klundert et al. [16], represents a novelty as concerns waste management assessment and planning. This new approach wants to overtake the traditional constraints and shortcomings that arise during the standard assessment campaigns developed by consultants and experts coming from developed countries. Anschütz et al. [22] affirms that in most cases, if not all, the consultants in charge to assess and design a waste management plan come from abroad, without deeply knowing the local context and the stakeholders involved into the waste management system. Consultants typically collect information and data reading existing reports and secondary sources and interviewing just important local authorities. They rarely involve households and local NGOs and CBOs to achieve further information, and they make on their own analyses for waste evaluation from both quantitative and qualitative points of view. Then, in a short period of time, consultants usually prepare a solid waste management plan based on technologies and ideas that often are not properly coherent with the local context and interests. Indeed, they
16
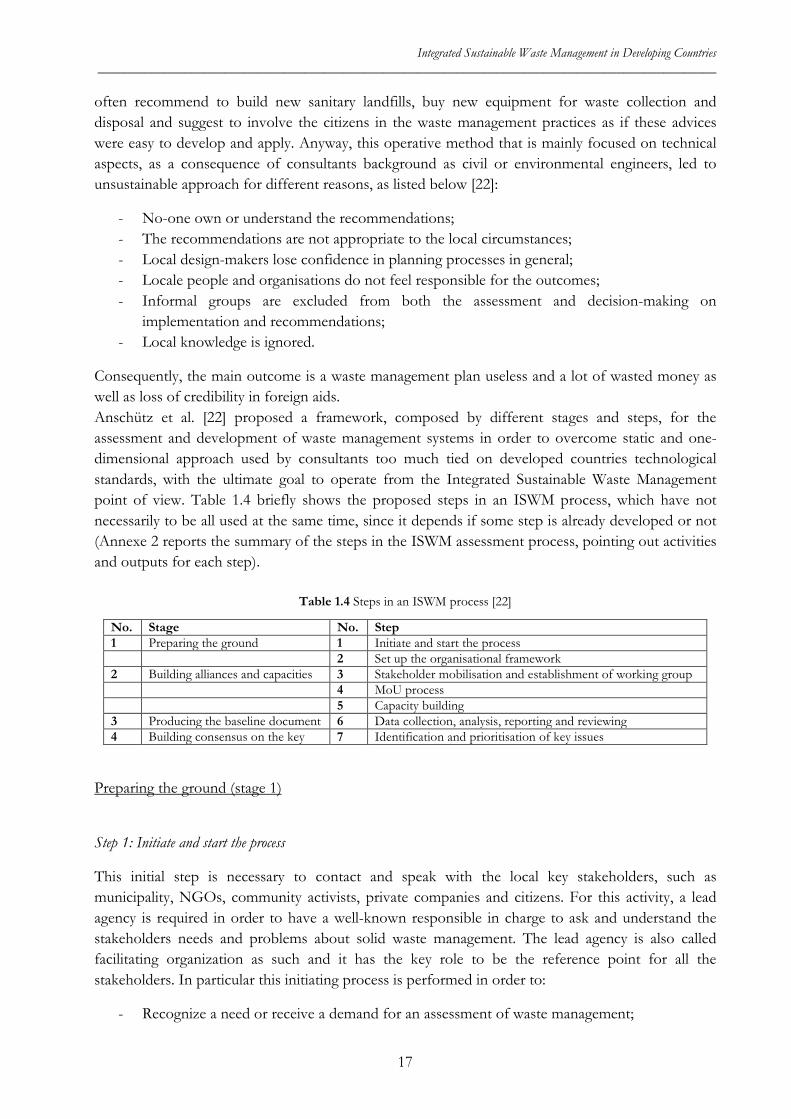
Integrated Sustainable Waste Management in Developing Countries _____________________________________________________________________________________________
often recommend to build new sanitary landfills, buy new equipment for waste collection and disposal and suggest to involve the citizens in the waste management practices as if these advices were easy to develop and apply. Anyway, this operative method that is mainly focused on technical aspects, as a consequence of consultants background as civil or environmental engineers, led to unsustainable approach for different reasons, as listed below [22]:
- No-one own or understand the recommendations; - The recommendations are not appropriate to the local circumstances; - Local design-makers lose confidence in planning processes in general; - Locale people and organisations do not feel responsible for the outcomes; - Informal groups are excluded from both the assessment and decision-making on
implementation and recommendations; - Local knowledge is ignored.
Consequently, the main outcome is a waste management plan useless and a lot of wasted money as well as loss of credibility in foreign aids. Anschütz et al. [22] proposed a framework, composed by different stages and steps, for the assessment and development of waste management systems in order to overcome static and one-dimensional approach used by consultants too much tied on developed countries technological standards, with the ultimate goal to operate from the Integrated Sustainable Waste Management point of view. Table 1.4 briefly shows the proposed steps in an ISWM process, which have not necessarily to be all used at the same time, since it depends if some step is already developed or not (Annexe 2 reports the summary of the steps in the ISWM assessment process, pointing out activities and outputs for each step).
Table 1.4 Steps in an ISWM process [22]
No. Stage No. Step 1 Preparing the ground 1 Initiate and start the process 2 Set up the organisational framework 2 Building alliances and capacities 3 Stakeholder mobilisation and establishment of working group 4 MoU process 5 Capacity building 3 Producing the baseline document 6 Data collection, analysis, reporting and reviewing 4 Building consensus on the key 7 Identification and prioritisation of key issues
Preparing the ground (stage 1)
Step 1: Initiate and start the process
This initial step is necessary to contact and speak with the local key stakeholders, such as municipality, NGOs, community activists, private companies and citizens. For this activity, a lead agency is required in order to have a well-known responsible in charge to ask and understand the stakeholders needs and problems about solid waste management. The lead agency is also called facilitating organization as such and it has the key role to be the reference point for all the stakeholders. In particular this initiating process is performed in order to:
- Recognize a need or receive a demand for an assessment of waste management;
17
Integrated Sustainable Waste Management in Developing Countries _____________________________________________________________________________________________
- Decide to use ISWM for this assessment; - Establish contacts with the city and local stakeholders; - Make the need or demand widely known in the locality.
This step is very important in order to establish a first mutual trust relationship with the local stakeholders, present the framework of the ISWM and understand the basic needs. The workshop organization is a warmly suggested option to achieve all these information.
Step 2: Set up the organizational framework
Consequently, at the first brainstorming step, the facilitation organization is in charge to define an organizational framework in order to support the ISWM assessment process that consists in:
- Designating or hiring working space; - Recruiting and selecting an ISWM city coordinator; - Starting up activities of the ISWM city coordinator; - Developing a work plan and a budget; - Dividing tasks within the facilitating organization; - Identifying and formulating the need for specialist advice or consulting; - Setting up a monitoring and evaluation framework; - Establishing administrative procedures (reporting, financial, procedures, etc.); - Organising visits to the city and meetings with local stakeholders.
In this step, the ISWM city coordinator is an essential element, representing a precious support for the operations and activities development. The internal relationships and communications with the municipality and its different department is one of the most important role that the city coordinator have to play during all the phases of the ISWM assessment.
Building alliances and capacities (stage 2)
Step 3: Stakeholder mobilization and establishment of working group
The working group identification and establishment is another important task that the facilitating organization has to carry out. The working group is composed by different stakeholders selected by the facilitating organization. This operation is more than a simple team composition, indeed the main goal is to mobilize the selected stakeholders into the ISWM assessment process, making them feel as the main subjects of the assessment process. In particular the stakeholder mobilization is important in order to:
- Open permanent channels of communication between the facilitating organization and the local stakeholders with the aim to easily exchange information and feedback concerning the on-going activities;
- Build into the assessment process self-correcting mechanisms.
18
Integrated Sustainable Waste Management in Developing Countries _____________________________________________________________________________________________
The working groups are chosen in an appropriate way using the Stakeholder Analysis (SA) process as decision tool. It is important to perform this analysis in order to understand and provide a complete personal profile of each actor. Moreover, with the SA, it is possible to determine the stakeholder interests and influences on waste management and on the other stakeholders. Annexe 3 reports a summary of different techniques and presentation approaches for the stakeholder analyses considering different topics, suggested by Anschütz et al. [22]. The working group interest and motivation concerning the ISWM activities need to be continuously stimulated and kept stable in order to maintain the established proper working conditions and respect for the main duties. However, this is one of the most difficult task, much more complicated than stakeholders selection, which the facilitating organization has to carry out.
Step 4: MoU process
Step 4 describes all the operations that led to the signature of the Memorandum of Understanding (MoU) by the key stakeholders involved into the Integrated Sustainable Waste Management assessment process. In particular the MoU represents a written agreement, between all the considered parties, that the signatory stakeholders undertake to respect the duties defined in the working plan. This agreement could be formal or informal recognized by the city, it depends country by country, but it is very important in order to clearly establish roles, commitments and responsibilities of each signatory stakeholder.
Step 5: Capacity building
Capacity building represents an important activity in order to evaluate and consequently train the stakeholders involved into the ISWM assessment process. This step is fundamental in order to strength the stakeholders skills and increase their experience, with the final aim to define a strong stakeholder participation in the different activities provided by the working plan, continuously supporting the assessment process. Generally, capacity building consists in:
- Identifying the missing skills and capacities; - Identifying the specific capacity building for each stakeholders; - Making a plan to provide training and supplementing existing skills; - Conducting the trainings; - Evaluating the effectiveness, re-visiting the previous mentioned needs analysis and beginning
the cycle again.
It is suggested to train different types of people, such as politicians, decision makers, municipal technical staff, NGO staff, owners or employees of recycling enterprises, etc.
19
Integrated Sustainable Waste Management in Developing Countries _____________________________________________________________________________________________
Producing the baseline document (stage 3)
Step 6: Data collection, analysis, reporting and reviewing
The baseline document describes the current status and practices of the waste management system of the surveyed city. The baseline document is based on the analysis and reviewing of the collected data and information concerning the 3 main dimensions that compose the ISWM framework: stakeholder, waste system elements and sustainability aspects. The main activities of this step are organized by the facilitating organization and consist in:
- Developing a research plan, in consultation with key stakeholders; - Training of stakeholders as data collectors and analysts; - Collecting and analyzing data; - Repeating visits to the field for the verification of data or resolution of things which are not
clear or accurate; - Preparing of the draft baseline report; - Socializing the baseline: organizing presentation, verifying details and gathering feedback
from stakeholders; - Incorporating results of socialization into final report; - Presenting and disseminating the report to stakeholders and technical or professional adviser
political authorities, etc.
During this step, an intensive analysis campaign is usually performed in order to understand and quantify not only the waste system elements (waste quantity, waste composition, density, performance of the system, recycling, reuse, recovery, flow waste, flow of material, etc.) but even the sustainability aspects (legal, political and policy aspects, environmental and health implications aspects, social and cultural aspects, financial and economic aspects, institutional and organizational aspects). There are a lot of methods and techniques that could and should be used for each evaluated element and aspect. When feasible, it is even suggested to involve the stakeholders in these activities in order to increase their participation, since the method is based on participatory approach. Annexes 4, 5, 6 and 7 show all the methods and techniques suggested and tested in the field by Anschütz et al. [22].
Building consensus on the key (stage 4)
Step 7: Identification and prioritization of key issues
The baseline document, which reports the qualitative and quantitative status of the city waste management system, is the source of the key issues and lacks that have to be faced. The answers at the problems are represented by concrete actions , but even, and in most of the cases above all, by the acceptance from the stakeholders involved in the ISWM of the city. Indeed, the stakeholder acceptance represents the first and main sustainable aspect, since if the issues and solutions elaborated during step 6 are not understood or for a strange and unknown reason do not satisfy the local stakeholders expectation, actions become useless. Gained this first result, it is necessary to
20
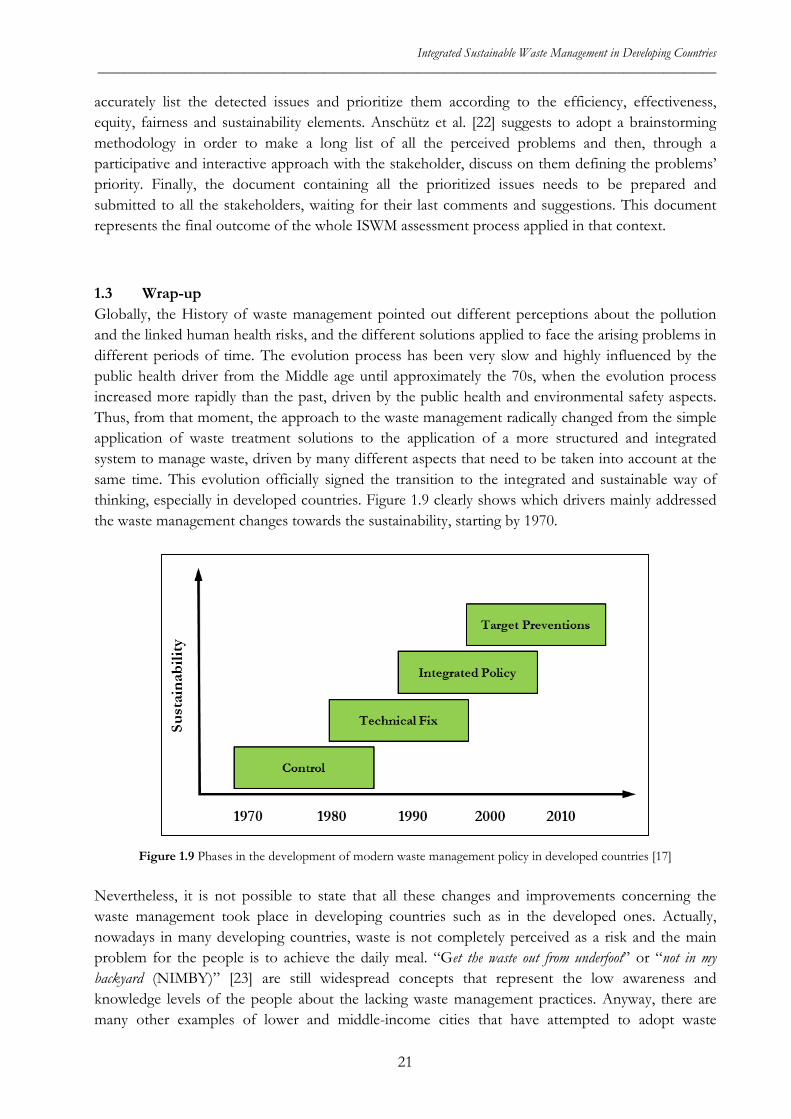
Integrated Sustainable Waste Management in Developing Countries _____________________________________________________________________________________________
accurately list the detected issues and prioritize them according to the efficiency, effectiveness, equity, fairness and sustainability elements. Anschütz et al. [22] suggests to adopt a brainstorming methodology in order to make a long list of all the perceived problems and then, through a participative and interactive approach with the stakeholder, discuss on them defining the problems’ priority. Finally, the document containing all the prioritized issues needs to be prepared and submitted to all the stakeholders, waiting for their last comments and suggestions. This document represents the final outcome of the whole ISWM assessment process applied in that context.
1.3 Wrap-up Globally, the History of waste management pointed out different perceptions about the pollution and the linked human health risks, and the different solutions applied to face the arising problems in different periods of time. The evolution process has been very slow and highly influenced by the public health driver from the Middle age until approximately the 70s, when the evolution process increased more rapidly than the past, driven by the public health and environmental safety aspects. Thus, from that moment, the approach to the waste management radically changed from the simple application of waste treatment solutions to the application of a more structured and integrated system to manage waste, driven by many different aspects that need to be taken into account at the same time. This evolution officially signed the transition to the integrated and sustainable way of thinking, especially in developed countries. Figure 1.9 clearly shows which drivers mainly addressed the waste management changes towards the sustainability, starting by 1970.
Figure 1.9 Phases in the development of modern waste management policy in developed countries [17]
Nevertheless, it is not possible to state that all these changes and improvements concerning the waste management took place in developing countries such as in the developed ones. Actually, nowadays in many developing countries, waste is not completely perceived as a risk and the main problem for the people is to achieve the daily meal. “Get the waste out from underfoot” or “not in my backyard (NIMBY)” [23] are still widespread concepts that represent the low awareness and knowledge levels of the people about the lacking waste management practices. Anyway, there are many other examples of lower and middle-income cities that have attempted to adopt waste
21
Integrated Sustainable Waste Management in Developing Countries _____________________________________________________________________________________________
management systems like the developed ones, but that did not be a success due to several other problems, as reported in Paragraph 1.1. The high failure ratio of the humanitarian aid projects in developing countries, registered at the beginning of 90s, contributed to make aware the European members involved in the international cooperation, as technical consultants, university researchers or NGOs, that the traditional working approach used till that moment was wrong. The main recognized problem was the employment of too much technical notions and concepts, typically used in developed countries but inappropriate for those contexts. Obviously, the solutions exported from the developed world were extremely expensive to maintain, requiring high skilled workers, which developing countries could not provide. Thus, Schübeler et al. first and Arnold van de Klundert et al. later faced this improper working methodology, developing the concept of the Integrated Sustainable Waste Management to apply in developing countries. This is an holistic approach, based on the sustainability of 3 key aspects: economic, environmental and social. Moreover, another key point that drives this approach is the waste hierarchy in order to enhance the 3R theory (Reduce, Reuse, Recycle) towards waste zero. Basically the ISWM tries to define interconnections and functional ties between the technical solution and the main key aspects, with the aim to find the most suitable solution for a specific context. Crucial is the focus that was paid to the involved stakeholders, clarifying at first who is a stakeholder and who is not, enhancing the interests and the attentions for the social aspects. For example, in the last 10 years, several studies and debates about the informal waste collectors took place [24-29], finding out their significant contribute in the waste management sector from economic and environmental points of view. Indeed, their non-recognized work (informal) allows to reduce the costs of waste management service provided by local administrations, to reduce the amount of waste disposed of in landfills and at the same time to enhance the recycling trade, perfectly in line with the sustainability concepts. Therefore, the new way of thinking about waste management has allowed to recognize these important resources, for whom interesting studies were even carried out by several researchers trying to figure out a solution to formally recognize this informal sector [30-32]. The guidelines proposed by Anschütz et al. [22] pointed out the importance of a deeper and well done assessment in the context of the future interventions, proving a set of methodologies and tools to evaluate all the dimensions and aspects that compose an existing waste management system, in order to define in which way and how much the potential mismanagement weights on the whole system. Nevertheless, besides data and information that are possible to gather through the assessment (that still requires an intensive work), it would be essential to already hold waste management data and information (total amount of waste generated, daily per-capita waste production, waste composition, percentage of the area covered by the waste collection service, numbers or percentage of the informal waste pickers, type of technologies used for the waste treatment, etc.) of other comparable developing countries, as a background reference in order to previously and accurately address the intervention and the assessment. In the last 10 years, several studies were specifically addressed in this direction, in order to understand the waste management characteristics and the factors, determinants and drivers that influenced it [1, 17, 23, 33-38], and hence to improve the lacking systems towards sustainable models and integrated management. Finally, it can be highlighted as the integrated approach represents an adaptive and elastic model that is possible to adopt in each context, in order to define the best suitable solution for a specific context. As confirmation of the importance of this last fundamental concept, it is worth to report the two following statements available from the scientific literature:
22
Integrated Sustainable Waste Management in Developing Countries _____________________________________________________________________________________________
- “However, unlike the hierarchy, ISWM does not define the best system, as there is no universal best system. In reality, ISWM is a theoretical, optimal outcome, a framework form which new systems can be designed and implemented and existing ones can be optimized” [23].
- “A basic recommendation is that there are no universally right or wrong answers. Rather, solutions need to be developed locally and tailored specifically to local needs and conditions” [20].
References
[1] Guerrero, L.A., Maas, G., Hogland, W. (2013). Solid waste management challenges for cities in developing countries. Waste Management, 33 (1), 220-232.
[2] Shafqat, A., Noor, S., Fatima, M. (2014). Practices and challenges of municipal solid waste management in Bahawalpur city, Pakistan. Journal of Sustainability Science and Management, 9 (1), 90-98.
[3] Desta, H., Worku, H., Fetene, A. (2014). Assessment of the contemporary municipal solid waste management in urban environment: The case of Addis Ababa, Ethiopia. Journal of Environmental Science and Technology, 7 (2), 107-122.
[4] Abraham Lingan, B., Poyyamoli, G. (2014). A study on current status of municipal solid waste management practices in Cuddalore municipality, India. World Applied Sciences Journal, 31 (6), 1096-1103.
[5] Hoornweg, D., Bhada-Tata, P. (2012). What a waste. A Global Review of Solid Waste Management. Washington, DC: World Bank.
[6] Di Bella, V., Vaccari, M. (2014). Constraints for solid waste management in Somaliland. Proceedings of Institution of Civil Engineers: Waste and Resource Management, 167 (2), 62-71.
[7] Zurbügg, C., Schertenleib, R. (1998). Main problems and Issues of Municipal Solid Waste Management in Developing countries, with Emphasis on Problem Related to Disposal by Landfill. Available online at: http://www.eawag.ch/forschung/sandec/publikationen/swm/dl/Zurbruegg_1998_Landfill.pdf (Accessed: 22/09/2014).
[8] Zurbügg, C., Schertenleib, R. (2002). Urban Solid Waste Management in Low-Income Countries of Asia. How to Cope with the Garbage Crisis. Available online at: http://www.eawag.ch/forschung/sandec/publikationen/swm/dl/Zurbruegg_2003_Crisis.pdf (Accessed: 22/09/2014).
[9] Oteng-Ababio, M. (2011). Missing links in solid waste management in the Greater Accra Metropolitan Area in Ghana. GeoJournal, 76 (5), 551-560.
[10] Obirih-Opareh, N., Post, J. (2002). Quality assessment of public and private modes of solid waste collection in Accra, Ghana. Habitat International, 26 (1), 95-112.
23
Integrated Sustainable Waste Management in Developing Countries _____________________________________________________________________________________________
[11] Abu Qdais, H.A. (2007). Techno-economic assessment of municipal solid waste management in Jordan. Waste Management, 27 (11), 1666-1672.
[12] Scheinberg, A., Wilson, D.C., Rodic, L. (2010). Solid Waste Management in the World’s Cities. Earthscan for UN-Habitat, London, UK.
[13] UNEP. (2013). Global Environmental Alert Service (GEAS). Available online at: http://na.unep.net/geas/getUNEPPageWithArticleIDScript.php?article_id=105 (Accessed 22/09/2014).
[14] Cointreau, S. (2006). Occupational and Environmental Health Issues of Solid Waste Management. The World Bank, Washington, D.C.
[15] Oeltzschner H, Mutz D (1996). Guidelines for an Appropriate Management of Domestic Sanitary Landfill Sites, 2nd edition. GTZ: Eschborn, Germany.
[16] Van de Klundert, A., Anschütz, J. (2001). Integrated Sustainable Waste Management – The concept. Waste, Gouda, The Netherlands.
[17] Wilson, D.C. (2007). Development drivers for waste management. Waste Management and Research, 25 (3), 198-207.
[18] Rushbrook, P., Pugh, M. (1999). Solid Waste Landfills in middle and Lower-income Countries. A Technical Guide to Planning, Design and Operation. World Bank, Washington, DC, USA. Available on-line at: http://www-wds.worldbank.org/external/default/WDSContentServer/WDSP/IB/2002/12/06/000094946_02112104104987/Rendered/PDF/multi0page.pdf (Accessed: 26/09/2014).
[19] Rushbrook, P. Cycle of seminars: World of Waste - research, reflection and realism. University of Brescia, Italy (13-15 January 2014).
[20] Wilson, D.C., Velis, C.A., Rodic, L. (2013). Integrated sustainable waste management in developing countries. Proceedings of Institution of Civil Engineers: Waste and Resource Management 166 (2), 52-68.
[21] Schübeler, P., Wehrle, K., Christen, J. (1996). Conceptual Framework for Municipal Solid Waste in Low-Income Countries. SKAT, St. Gallen, Switzerland. UMP/SDC Collaborative Programme on Municipal Solid Waste Management in Developing Countries, Urban Management Programme (UMP) working paper series no. 9. Available online at: http://www.worldbank.org/urban/solid_wm/erm/CWG%20folder/conceptualframework.pdf (Accessed: 26/09/2014).
[22] Anschütz, J., Ijgosse, J., Scheinberg, A. (2004). Putting Integrated Sustainable Waste Management Into Practice: Using the ISWM Assessment Methodology as Applied in the UWEP Plus Programme (2001-2003). Waste, Gouda, The Netherlands.
[23] Marshall, R.E., Farahbakhsh, K. (2013). Systems approaches to integrated solid waste management in developing countries. Waste Management, 33 (4), 988-1003.
24
Integrated Sustainable Waste Management in Developing Countries _____________________________________________________________________________________________
[24] Linzner, R., Lange, U. (2013). Role and size of informal sector in waste management – a review. Waste and Resource Management, 166, 69–83.
[25] Masood, M., Barlow, C.Y. (2013). Framework for integration of informal waste management sector with the formal sector in Pakistan. Waste Management and Research, 31 (19), 93–105.
[26] Sembiring, E., Nitivattananon, V. (2010). Sustainable solid waste management towards an inclusive society: Integration of the informal sector. Resources, Conservation and Recycling, 54, 802–809.
[27] Oguntoyinbo, O.O. (2012). Informal waste management system in Nigeria and barriers to an inclusive modern waste management system: A review. Public Health, 126, 441–447.
[28] Wilson, D.C., Velis, C., Cheeseman, C. (2006). Role of informal sector recycling in waste management in developing countries. Habitat International, 30, 797–808.
[29] Ezeah, C., Fazakerley, J.A., Roberts, C.L. (2013). Emerging trends in informal sector recycling in developing and transition countries. Waste Management, 33, 2509–2519.
[30] Aparcana, S., Salhofer, S. (2013). Development of a social impact assessment methodology for recycling systems in low-income countries. International Journal of Life Cycle Assessment, 18 (5), 1106-1115.
[31] Aparcana, S., Salhofer, S. (2013). Application of a methodology for the social life cycle assessment of recycling systems in low income countries: Three Peruvian case studies. International Journal of Life Cycle Assessment, 18 (5), 1116-1128.
[32] Velis, C.A., Wilson, D.C., Rocca, O., Smith, S.R., Mavropoulos, A., Cheeseman, C.R. (2012). An analytical framework and tool (“InteRa”) for integrating the informal recycling sector in waste and resources management system in developing countries. Waste Management and Research, 30 (9), 43–66.
[33] Abu Qdais, H.A. (2007). Techno-economic assessment of municipal solid waste management in Jordan. Waste Management, 27 (11), 1666-1672.
[34] Mrayyan, B., Hamdi, M.R. (2006). Management approaches to integrated solid waste in industrialized zones in Jordan: A case of Zarqa City. Waste Management, 26 (2), 195-205.
[35] Sim, N.M., Wilson, D.C., Velis, C.A., Smith, S.R. (2013). Waste management and recycling in the former Soviet Union: The City of Bishkek, Kyrgyz Republic (Kyrgyzstan). Waste Management and Research, 31 (10 SUPPL.), 106-125.
[36] Suttibak, S., Nitivattananon, V. (2008). Assessment of factors influencing the performance of solid waste recycling programs. Resources, Conservation and Recycling, 53 (1-2), 45-56.
[37] Zurbrügg, C., Gfrerer, M., Ashadi, H., Brenner, W., Küper, D. (2012). Determinants of sustainability in solid waste management - The Gianyar Waste Recovery Project in Indonesia. Waste Management, 32 (11), 2126-2133.
25
Integrated Sustainable Waste Management in Developing Countries _____________________________________________________________________________________________
[38] Wilson, D.C., Rodic, L., Scheinberg, A., Velis, C.A., Alabaster, G. (2012). Comparative analysis of solid waste management in 20 cities. Waste Management and Research, 30 (3), 237-254.
26
Multidimensional Assessment Methods for Solid Waste Management systems _____________________________________________________________________________________________
Chapter 2. Multidimensional Assessment Methods for Solid Waste Management systems
Abstract Assessment methods are necessary tools for the evaluation of solid waste management systems. There are a lot of different assessment tools/methods/approaches that allow evaluating many different aspects characterizing a waste management system, such as technical, environmental, economic, social, institutional and organizational aspects. In the 70s, the assessment tools were born, as the solid waste management systems. Indeed at simple waste management systems corresponded simple evaluation approaches/methods. Then, step by step, with the introduction of integrated and sustainable waste management concepts, other more sophisticated evaluation tools were implemented, in particular as concern developed countries. The first sporadic implementations of evaluation methods in developing countries approximately date back to the second half of the 90s. However, during this period, the integrated sustainable waste management concept was not yet born and, hence, the rare performed evaluations took into account just one dimension. Although in developing countries the concept of ISWM was later introduced, the use of assessment tools is still lacking. In particular, the solid waste management system evaluations based simultaneously on economic, environmental and social dimensions are pretty rare, consequently hampering the sustainability concept. This Chapter initially provides a brief overview of the main tools used for the evaluation of solid waste management systems and then their evolution over time, from their birth to the present. In addition, the Chapter presents a case studies’ review concerning multi-dimensional analysis for waste management systems, highlighting the lack of attention in this direction and the necessity of a greater commitment to the implementation and development of new assessment tools and methods.
2.1 Solid Waste Management Assessment tools Assessment methods represent the main tools used by decision makers in order to support waste management [1, 2]. Since 60s, these assessment tools are widely used in developed countries [3], whereas in developing countries their use is not yet widespread and in some contexts is still lacking, as stated by Zurbrügg et al. [2]. Municipal solid waste management systems are complex to evaluate, especially because there are subsystems such as landfills, Waste To Energy plants (WTE), Anaerobic Digestion plants (AD), composting facilities and Material Recovery Facilities (MRF) interlinked and mutually dependent among them, even considering stakeholders and all the other aspects that compose the systems. Obviously, in most of the cases, in developing countries, there are not so complex systems, since they entail a systematic well-functioning integration with all the considered treatment options. There are a lot of different types of tools/methods, usually classified according to specific dimension, area, aspect and field of interest which have to be investigated. In particular, it is possible to evaluate a single process unit, the whole process chain, process performances, material cycles, mass flows, costs, environmental pollution, social acceptance, etc.. Anyway, environmental, economic and social aspects represent the main domains which the tools are usually classified by. This basic division is widely recognized because essentially represents the concept of sustainability
27
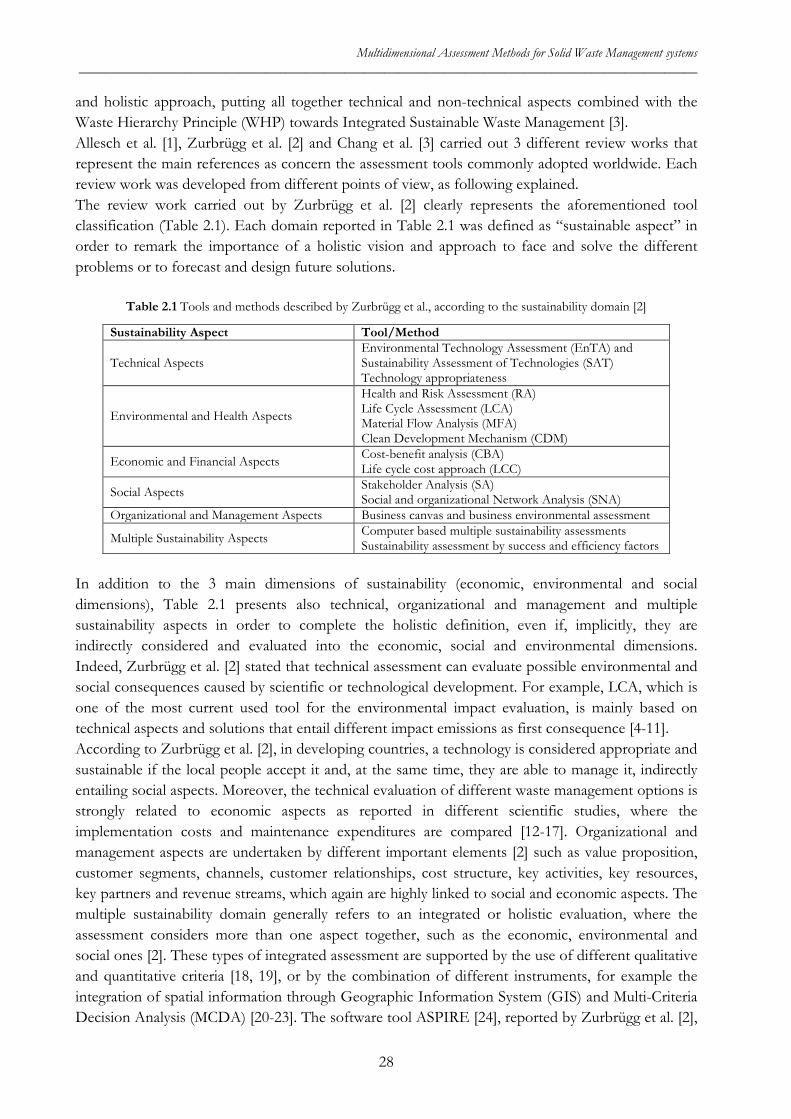
Multidimensional Assessment Methods for Solid Waste Management systems _____________________________________________________________________________________________
and holistic approach, putting all together technical and non-technical aspects combined with the Waste Hierarchy Principle (WHP) towards Integrated Sustainable Waste Management [3]. Allesch et al. [1], Zurbrügg et al. [2] and Chang et al. [3] carried out 3 different review works that represent the main references as concern the assessment tools commonly adopted worldwide. Each review work was developed from different points of view, as following explained. The review work carried out by Zurbrügg et al. [2] clearly represents the aforementioned tool classification (Table 2.1). Each domain reported in Table 2.1 was defined as “sustainable aspect” in order to remark the importance of a holistic vision and approach to face and solve the different problems or to forecast and design future solutions.
Table 2.1 Tools and methods described by Zurbrügg et al., according to the sustainability domain [2]
Sustainability Aspect Tool/Method
Technical Aspects Environmental Technology Assessment (EnTA) and Sustainability Assessment of Technologies (SAT) Technology appropriateness
Environmental and Health Aspects
Health and Risk Assessment (RA) Life Cycle Assessment (LCA) Material Flow Analysis (MFA) Clean Development Mechanism (CDM)
Economic and Financial Aspects Cost-benefit analysis (CBA) Life cycle cost approach (LCC)
Social Aspects Stakeholder Analysis (SA) Social and organizational Network Analysis (SNA)
Organizational and Management Aspects Business canvas and business environmental assessment
Multiple Sustainability Aspects Computer based multiple sustainability assessments Sustainability assessment by success and efficiency factors
In addition to the 3 main dimensions of sustainability (economic, environmental and social dimensions), Table 2.1 presents also technical, organizational and management and multiple sustainability aspects in order to complete the holistic definition, even if, implicitly, they are indirectly considered and evaluated into the economic, social and environmental dimensions. Indeed, Zurbrügg et al. [2] stated that technical assessment can evaluate possible environmental and social consequences caused by scientific or technological development. For example, LCA, which is one of the most current used tool for the environmental impact evaluation, is mainly based on technical aspects and solutions that entail different impact emissions as first consequence [4-11]. According to Zurbrügg et al. [2], in developing countries, a technology is considered appropriate and sustainable if the local people accept it and, at the same time, they are able to manage it, indirectly entailing social aspects. Moreover, the technical evaluation of different waste management options is strongly related to economic aspects as reported in different scientific studies, where the implementation costs and maintenance expenditures are compared [12-17]. Organizational and management aspects are undertaken by different important elements [2] such as value proposition, customer segments, channels, customer relationships, cost structure, key activities, key resources, key partners and revenue streams, which again are highly linked to social and economic aspects. The multiple sustainability domain generally refers to an integrated or holistic evaluation, where the assessment considers more than one aspect together, such as the economic, environmental and social ones [2]. These types of integrated assessment are supported by the use of different qualitative and quantitative criteria [18, 19], or by the combination of different instruments, for example the integration of spatial information through Geographic Information System (GIS) and Multi-Criteria Decision Analysis (MCDA) [20-23]. The software tool ASPIRE [24], reported by Zurbrügg et al. [2],
28
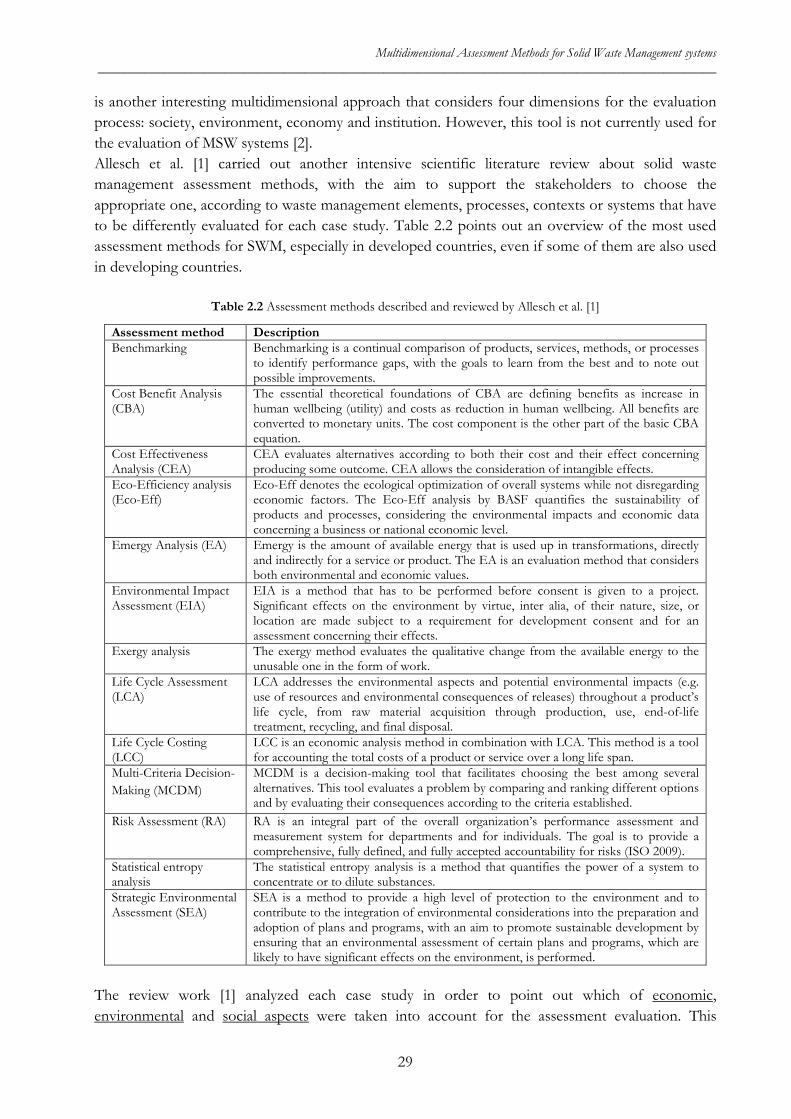
Multidimensional Assessment Methods for Solid Waste Management systems _____________________________________________________________________________________________
is another interesting multidimensional approach that considers four dimensions for the evaluation process: society, environment, economy and institution. However, this tool is not currently used for the evaluation of MSW systems [2]. Allesch et al. [1] carried out another intensive scientific literature review about solid waste management assessment methods, with the aim to support the stakeholders to choose the appropriate one, according to waste management elements, processes, contexts or systems that have to be differently evaluated for each case study. Table 2.2 points out an overview of the most used assessment methods for SWM, especially in developed countries, even if some of them are also used in developing countries.
Table 2.2 Assessment methods described and reviewed by Allesch et al. [1]
Assessment method Description Benchmarking Benchmarking is a continual comparison of products, services, methods, or processes
to identify performance gaps, with the goals to learn from the best and to note out possible improvements.
Cost Benefit Analysis (CBA)
The essential theoretical foundations of CBA are defining benefits as increase in human wellbeing (utility) and costs as reduction in human wellbeing. All benefits are converted to monetary units. The cost component is the other part of the basic CBA equation.
Cost Effectiveness Analysis (CEA)
CEA evaluates alternatives according to both their cost and their effect concerning producing some outcome. CEA allows the consideration of intangible effects.
Eco-Efficiency analysis (Eco-Eff)
Eco-Eff denotes the ecological optimization of overall systems while not disregarding economic factors. The Eco-Eff analysis by BASF quantifies the sustainability of products and processes, considering the environmental impacts and economic data concerning a business or national economic level.
Emergy Analysis (EA) Emergy is the amount of available energy that is used up in transformations, directly and indirectly for a service or product. The EA is an evaluation method that considers both environmental and economic values.
Environmental Impact Assessment (EIA)
EIA is a method that has to be performed before consent is given to a project. Significant effects on the environment by virtue, inter alia, of their nature, size, or location are made subject to a requirement for development consent and for an assessment concerning their effects.
Exergy analysis The exergy method evaluates the qualitative change from the available energy to the unusable one in the form of work.
Life Cycle Assessment (LCA)
LCA addresses the environmental aspects and potential environmental impacts (e.g. use of resources and environmental consequences of releases) throughout a product’s life cycle, from raw material acquisition through production, use, end-of-life treatment, recycling, and final disposal.
Life Cycle Costing (LCC)
LCC is an economic analysis method in combination with LCA. This method is a tool for accounting the total costs of a product or service over a long life span.
Multi-Criteria Decision-Making (MCDM)
MCDM is a decision-making tool that facilitates choosing the best among several alternatives. This tool evaluates a problem by comparing and ranking different options and by evaluating their consequences according to the criteria established.
Risk Assessment (RA) RA is an integral part of the overall organization’s performance assessment and measurement system for departments and for individuals. The goal is to provide a comprehensive, fully defined, and fully accepted accountability for risks (ISO 2009).
Statistical entropy analysis
The statistical entropy analysis is a method that quantifies the power of a system to concentrate or to dilute substances.
Strategic Environmental Assessment (SEA)
SEA is a method to provide a high level of protection to the environment and to contribute to the integration of environmental considerations into the preparation and adoption of plans and programs, with an aim to promote sustainable development by ensuring that an environmental assessment of certain plans and programs, which are likely to have significant effects on the environment, is performed.
The review work [1] analyzed each case study in order to point out which of economic, environmental and social aspects were taken into account for the assessment evaluation. This
29
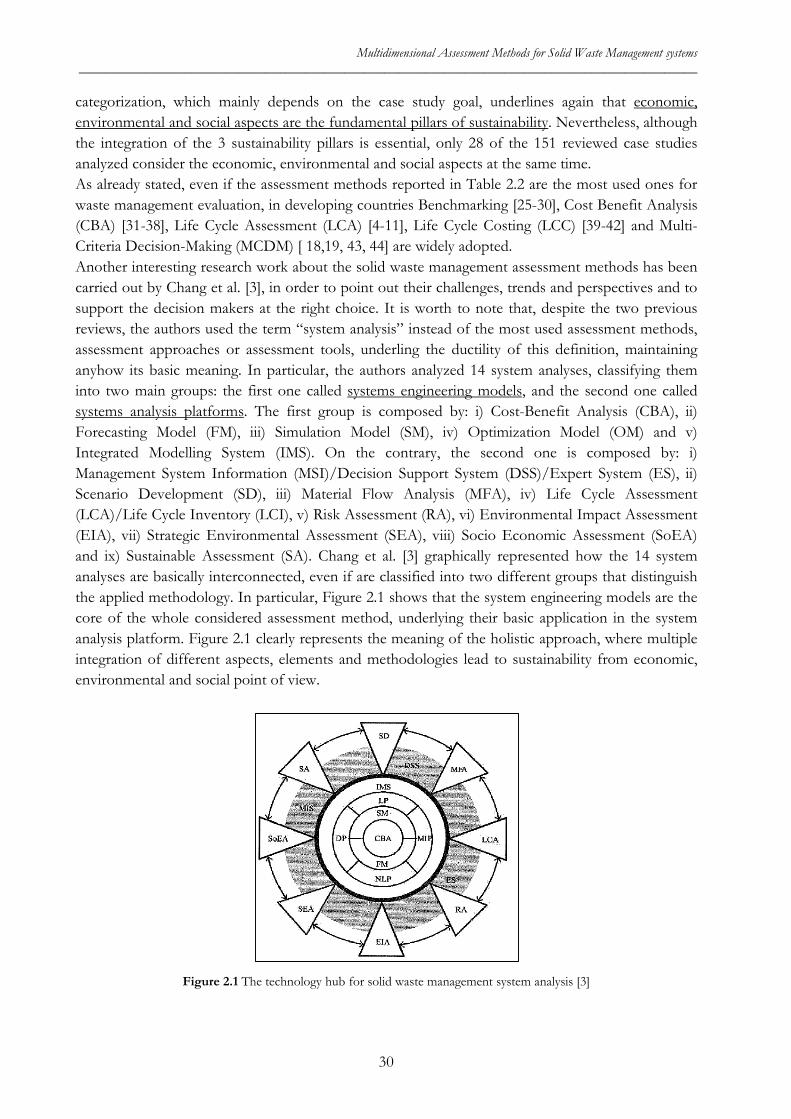
Multidimensional Assessment Methods for Solid Waste Management systems _____________________________________________________________________________________________
categorization, which mainly depends on the case study goal, underlines again that economic, environmental and social aspects are the fundamental pillars of sustainability. Nevertheless, although the integration of the 3 sustainability pillars is essential, only 28 of the 151 reviewed case studies analyzed consider the economic, environmental and social aspects at the same time. As already stated, even if the assessment methods reported in Table 2.2 are the most used ones for waste management evaluation, in developing countries Benchmarking [25-30], Cost Benefit Analysis (CBA) [31-38], Life Cycle Assessment (LCA) [4-11], Life Cycle Costing (LCC) [39-42] and Multi-Criteria Decision-Making (MCDM) [ 18,19, 43, 44] are widely adopted. Another interesting research work about the solid waste management assessment methods has been carried out by Chang et al. [3], in order to point out their challenges, trends and perspectives and to support the decision makers at the right choice. It is worth to note that, despite the two previous reviews, the authors used the term “system analysis” instead of the most used assessment methods, assessment approaches or assessment tools, underling the ductility of this definition, maintaining anyhow its basic meaning. In particular, the authors analyzed 14 system analyses, classifying them into two main groups: the first one called systems engineering models, and the second one called systems analysis platforms. The first group is composed by: i) Cost-Benefit Analysis (CBA), ii) Forecasting Model (FM), iii) Simulation Model (SM), iv) Optimization Model (OM) and v) Integrated Modelling System (IMS). On the contrary, the second one is composed by: i) Management System Information (MSI)/Decision Support System (DSS)/Expert System (ES), ii) Scenario Development (SD), iii) Material Flow Analysis (MFA), iv) Life Cycle Assessment (LCA)/Life Cycle Inventory (LCI), v) Risk Assessment (RA), vi) Environmental Impact Assessment (EIA), vii) Strategic Environmental Assessment (SEA), viii) Socio Economic Assessment (SoEA) and ix) Sustainable Assessment (SA). Chang et al. [3] graphically represented how the 14 system analyses are basically interconnected, even if are classified into two different groups that distinguish the applied methodology. In particular, Figure 2.1 shows that the system engineering models are the core of the whole considered assessment method, underlying their basic application in the system analysis platform. Figure 2.1 clearly represents the meaning of the holistic approach, where multiple integration of different aspects, elements and methodologies lead to sustainability from economic, environmental and social point of view.
Figure 2.1 The technology hub for solid waste management system analysis [3]
30
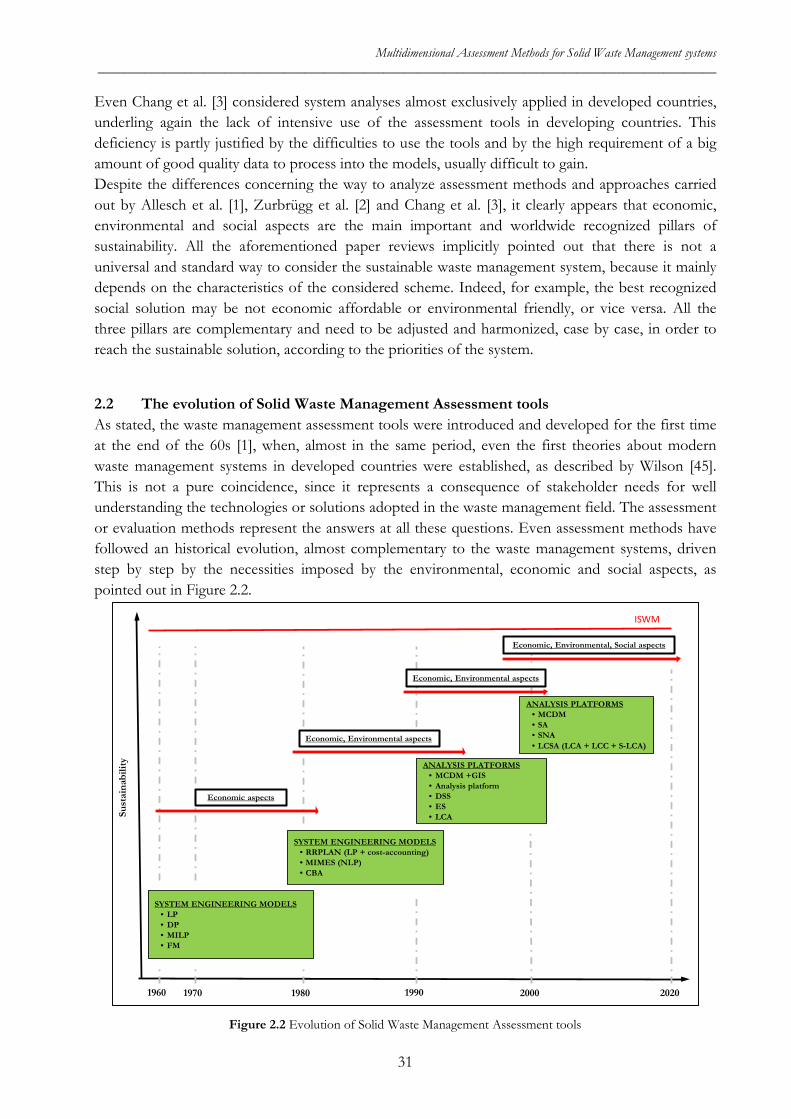
Multidimensional Assessment Methods for Solid Waste Management systems _____________________________________________________________________________________________
Even Chang et al. [3] considered system analyses almost exclusively applied in developed countries, underling again the lack of intensive use of the assessment tools in developing countries. This deficiency is partly justified by the difficulties to use the tools and by the high requirement of a big amount of good quality data to process into the models, usually difficult to gain. Despite the differences concerning the way to analyze assessment methods and approaches carried out by Allesch et al. [1], Zurbrügg et al. [2] and Chang et al. [3], it clearly appears that economic, environmental and social aspects are the main important and worldwide recognized pillars of sustainability. All the aforementioned paper reviews implicitly pointed out that there is not a universal and standard way to consider the sustainable waste management system, because it mainly depends on the characteristics of the considered scheme. Indeed, for example, the best recognized social solution may be not economic affordable or environmental friendly, or vice versa. All the three pillars are complementary and need to be adjusted and harmonized, case by case, in order to reach the sustainable solution, according to the priorities of the system.
2.2 The evolution of Solid Waste Management Assessment tools As stated, the waste management assessment tools were introduced and developed for the first time at the end of the 60s [1], when, almost in the same period, even the first theories about modern waste management systems in developed countries were established, as described by Wilson [45]. This is not a pure coincidence, since it represents a consequence of stakeholder needs for well understanding the technologies or solutions adopted in the waste management field. The assessment or evaluation methods represent the answers at all these questions. Even assessment methods have followed an historical evolution, almost complementary to the waste management systems, driven step by step by the necessities imposed by the environmental, economic and social aspects, as pointed out in Figure 2.2.
Figure 2.2 Evolution of Solid Waste Management Assessment tools
SYSTEM ENGINEERING MODELS• LP• DP• MILP• FM
Sust
aina
bilit
y
1970 1980 20001990
ANALYSIS PLATFORMS• MCDM +GIS• Analysis platform• DSS• ES• LCA
ANALYSIS PLATFORMS• MCDM• SA• SNA• LCSA (LCA + LCC + S-LCA)
1960 2020
SYSTEM ENGINEERING MODELS • RRPLAN (LP + cost-accounting)• MIMES (NLP)• CBA
ISWM
Economic aspects
Economic, Environmental aspects
Economic, Environmental, Social aspects
Economic, Environmental aspects
31
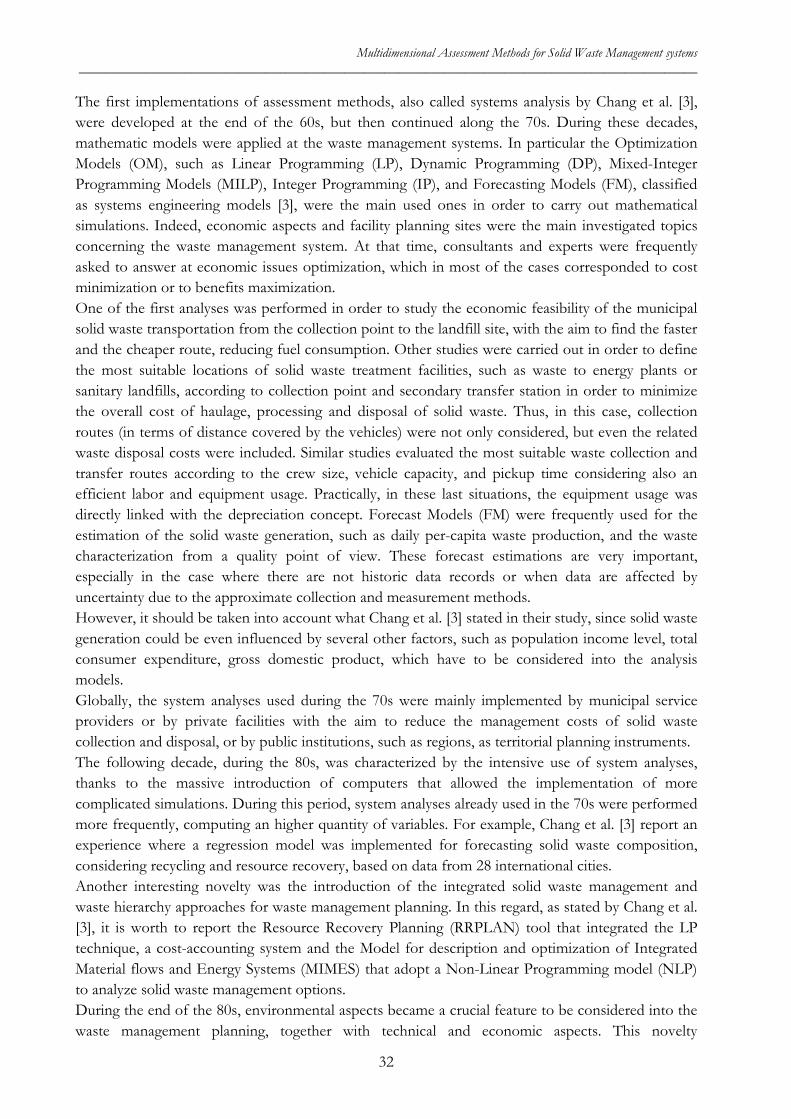
Multidimensional Assessment Methods for Solid Waste Management systems _____________________________________________________________________________________________
The first implementations of assessment methods, also called systems analysis by Chang et al. [3], were developed at the end of the 60s, but then continued along the 70s. During these decades, mathematic models were applied at the waste management systems. In particular the Optimization Models (OM), such as Linear Programming (LP), Dynamic Programming (DP), Mixed-Integer Programming Models (MILP), Integer Programming (IP), and Forecasting Models (FM), classified as systems engineering models [3], were the main used ones in order to carry out mathematical simulations. Indeed, economic aspects and facility planning sites were the main investigated topics concerning the waste management system. At that time, consultants and experts were frequently asked to answer at economic issues optimization, which in most of the cases corresponded to cost minimization or to benefits maximization. One of the first analyses was performed in order to study the economic feasibility of the municipal solid waste transportation from the collection point to the landfill site, with the aim to find the faster and the cheaper route, reducing fuel consumption. Other studies were carried out in order to define the most suitable locations of solid waste treatment facilities, such as waste to energy plants or sanitary landfills, according to collection point and secondary transfer station in order to minimize the overall cost of haulage, processing and disposal of solid waste. Thus, in this case, collection routes (in terms of distance covered by the vehicles) were not only considered, but even the related waste disposal costs were included. Similar studies evaluated the most suitable waste collection and transfer routes according to the crew size, vehicle capacity, and pickup time considering also an efficient labor and equipment usage. Practically, in these last situations, the equipment usage was directly linked with the depreciation concept. Forecast Models (FM) were frequently used for the estimation of the solid waste generation, such as daily per-capita waste production, and the waste characterization from a quality point of view. These forecast estimations are very important, especially in the case where there are not historic data records or when data are affected by uncertainty due to the approximate collection and measurement methods. However, it should be taken into account what Chang et al. [3] stated in their study, since solid waste generation could be even influenced by several other factors, such as population income level, total consumer expenditure, gross domestic product, which have to be considered into the analysis models. Globally, the system analyses used during the 70s were mainly implemented by municipal service providers or by private facilities with the aim to reduce the management costs of solid waste collection and disposal, or by public institutions, such as regions, as territorial planning instruments. The following decade, during the 80s, was characterized by the intensive use of system analyses, thanks to the massive introduction of computers that allowed the implementation of more complicated simulations. During this period, system analyses already used in the 70s were performed more frequently, computing an higher quantity of variables. For example, Chang et al. [3] report an experience where a regression model was implemented for forecasting solid waste composition, considering recycling and resource recovery, based on data from 28 international cities. Another interesting novelty was the introduction of the integrated solid waste management and waste hierarchy approaches for waste management planning. In this regard, as stated by Chang et al. [3], it is worth to report the Resource Recovery Planning (RRPLAN) tool that integrated the LP technique, a cost-accounting system and the Model for description and optimization of Integrated Material flows and Energy Systems (MIMES) that adopt a Non-Linear Programming model (NLP) to analyze solid waste management options. During the end of the 80s, environmental aspects became a crucial feature to be considered into the waste management planning, together with technical and economic aspects. This novelty
32
Multidimensional Assessment Methods for Solid Waste Management systems _____________________________________________________________________________________________
represented another step towards the Integrated Sustainable Waste Management, and the main driver of this change was the control and the safeguard of the environment, as stated by Wilson [45]. In particular, at that time, leachate from landfill and gaseous emissions from incinerator were deeply taken into account in order to comply with the new regulations. These environmental aspects were strictly linked to the quality of life, quantified from an economic point of view. In this regard, the Cost Benefit Analysis (CBA) was the model used to quantify the economic and environmental aspects in a combined way. Indeed, CBA is a technique to assess the positive and negative economic effects of a project or policy in which all relevant impacts are measured especially in monetary values. In particular, CBA was applied in order to assess benefits and costs, defined as an increase or a decrease of human well-being respectively. At the end of the 80s, CBA models were not so well implemented because it was quite difficult to define an economic value of goods without a real market value. The 80s were mainly characterized by techno-economic evaluations, especially considering different solid waste management solutions developed to reach a common goal. The environmental evaluation concept was introduced just at the end of the 80s, but was much linked to economic aspects and less to environmental impacts. During the 90s, the environmental drivers toward sustainability became one of the main aspects taken into account concerning the evaluation of different solutions to face the solid waste management issues. In this period, recycling activities, material separation, resource recovery, and curbside collection were the main investigated topics, especially from environmental and economic points of view, unlike vehicles routing and landfill siting evaluated exclusively from techno-economic point of view during the 70s and 80s [3]. It is worth to underline that technical aspects are one of the most important elements to take into account, considering that the use of waste treatment technologies represents the core of the SWM, although, actually, technical aspects are usually and implicitly considered into the economic and environmental ones. In this decade, system analyses like OM models were still used, being the evaluation methods core, and deeply implemented, computing much more data and variables compared to the past. Chang et al. [3] report an OM implementation in order to evaluate and schedule a given set of recycling measures to achieve least-cost landfilling with extended lifetime. Another example of OM use was the evaluation of the recycling rate in the most economically option. During the 90s, with the introduction of the ISWM concept, which considers more than one aspect compared to the previous waste management system approach, more complex instruments allowing the analysis of different aspects at the same time were needed. In fact, this period has also to be remembered for the first implementation of the integrated analyses. For example, the recycling facilities siting and the collection vehicles routing, together with the help of the Geographic Information System (GIS), were studied in order to define the most economic and environmental friendly feasible solution. Following this evolution, the Multi-Criteria Decision Making (MCDM) system was born, in order to support the decision makers with the numerous aspects and variables that should be considered for one solution. MCDM belong to the Integrated Modelling System (MIS) category that could work coupling together FM and OM. Besides the MIS, other integrated assessment methods were developed such as Decision Supporting System (DSS) and Expert System (ES) that were defined as system analysis platforms. Chang et al. [3] define the DDS a computer-based information system designed to affect and improve the process of decision making. DDS is composed by 3 parts: i) an interactive graphic display capacity for managing the interface between the decision makers and the system, ii) a Data Management System (DMS), iii) a Model Base Management System (MBMS),
33
Multidimensional Assessment Methods for Solid Waste Management systems _____________________________________________________________________________________________
which aggregates different models, such as OM, FM and simulation models. ES is defined as a computer program designed to report the advice of human experts [3]. It is composed by 3 elements: i) a knowledge base, ii) an inference engine that applies built-in rules to the knowledge base to draw conclusions, iii) a user interface that enables the user to ask questions and understand the answers. Anyway, despite the high implementation of new assessment methods during the 90s, this decade is especially remembered for the development of the Life Cycle Analysis (LCA). LCA is an important assessment tool used for the calculation of the environmental impact caused by any service or good production chain, considering waste collection systems rather than landfill or waste to energy plant as waste disposal methods. Chang et al. [3] state that LCA method represents an evolution from the system engineering models to the system assessment tools. The use of LCA became intensive at the end of the 90s, when important environmental laws, such as the Integrated Pollution Prevention Control (IPPC) and the Best Available Techniques Not Entailing Excessive Cost (BATNEEC) were enacted. The introduction and implementation of LCA allowed carrying out the Environmental Impact Assessment (EIA), an important strategy required by the Directive 85/337/EFC (Europe) before building waste treatment facilities such as landfills and waste to energy plants. At the same time, as a further consequence, the Risk Assessment (RA) model was also introduced in order to examine various issues related to toxic substance emission. Moreover, the possibility to really quantify the environmental pollution with these new tools brought to an easier and more correct use of the CBA, especially as concerns the calculation of tangible and intangible costs and benefits determined by a specific waste management technology. At the end of the 90s, a strong evolution on the use of the assessment methods was registered. In particular, one of the most observed interesting aspects was the increased attention and consideration to the environmental aspects, with some sporadic attempts to take into account social aspects in terms of toxic substance emissions. The 2000s represent the period in which the novelties discovered and implemented at the end of the 90s were more intensively used and improved. In particular, as stated by Chang et al. [3], the integrated evaluation approach began to consider other different aspects and variables, such as social aspects, social interactions, social responses and policy concerns. Indeed, during this decade, Stakeholder Analysis (SA), Stakeholder Network Analysis (SNA) and Social Life Cycle Analysis (SLCA) were developed in order to evaluate the stakeholders influence into a system which they belong to. Moreover, these instruments could be used to understand the stakeholder opinions about a project or a technical solution that is going to be implemented into the investigated area of interest (e.g., understand the citizen opinions about the landfill construction close to their city). All these novelties have been important for the promotion and development of the good waste management practices towards sustainability, in order to minimize costs and environmental impacts and, meanwhile, maximizing social welfare and public health impacts generated by a particular solid waste management solution. An adequate balance between the 3 sustainability pillars (environmental, economic and social) is required and the use of integrated or multiple dimension evaluation tools represents the solution at this crucial requirement.
34
Multidimensional Assessment Methods for Solid Waste Management systems _____________________________________________________________________________________________
2.3 Multidimensional assessment methods for SWM: an overview in developing countries
The assessment methods/tools are widely used for the evaluation of solutions and technologies implemented in the solid waste management field, especially in developed countries where the evaluation approaches were born and used since the 70s, at the early beginning of new waste management practices. As reported in the paragraph 2.2, the first tool implementations were used to study just one dimension (economic aspect), without taking into account the other ones. Obviously, this represented a sort of constraint towards a complete study of the considered technology or solution. Then, in the 90s, with the introduction of the ISWM concept, the evaluation studies were focused on different aspects/dimensions, considering them separately, until the 2000s when these started to be considered all together, as acceptance and recognition of the sustainability theory. Despite the rapid evolution and massive use of assessment methods in developed countries, in developing countries these evaluation methods were firstly implemented just at the end of the 90s, and exclusively for the assessment of single dimensions. In particular technical and economic dimensions [13-17] were the most considered ones in the first evaluation studies, because the lack of money for technology implementation has always been considered the main problem of low and middle income countries. Then, technical aspects were investigated together with economic aspects since different technologies have different costs. These first studies represent the first attempts to understand the problems and find new solutions concerning the solid waste management. Despite the efforts, this new strategy was not enough to implement the cheapest solution, which in some cases could be not accepted or not possible to manage due to the lack of skilled workers, difficulties to find spare parts, lack of a good organization team to manage all the system or could be not environmental friendly. Thus, for all these reasons, it is fundamental to implement a multidimensional approach to reach the sustainability of a system. Nevertheless, the review work carried out by Allesch et al. [1] reports just 28 case studies out of 151, about waste management in developed countries, where the assessment analyses were performed considering all together economic, environmental and social aspects. Obviously, this lack of case studies in developed countries does not favor in-depth analyses in developing countries, consequently defining serious constraints toward the sustainability. A scientific literature research was performed in order to confirm this lack, looking for municipal solid waste management multidimensional analyses of case studies in developing countries. Keywords like “sustainability”, “waste management”, “integrated waste management”, “developing countries”, “multidimensional tools”, “assessment methods” and “combined methods” were differently arranged and used each time for each search run. Then, after an accurate analysis of the first achieved results, 19 case studies were chosen as reported in Table 2.3. All the case studies have a strong connection with waste management and multidimensional analyses, especially as concerns economic, environmental and social aspects. In particular, 6 case studies out of 19 consider just two of the three sustainability dimensions. All the case studies take directly into account solid waste management, except in two cases. In the first one, waste disposal practices were considered as one of the water pollution issues into the whole water quality assessment investigation, and, in the second one, a study about general undesirable facilities represented by landfills, waste storage sites or composting facilities was performed.
35
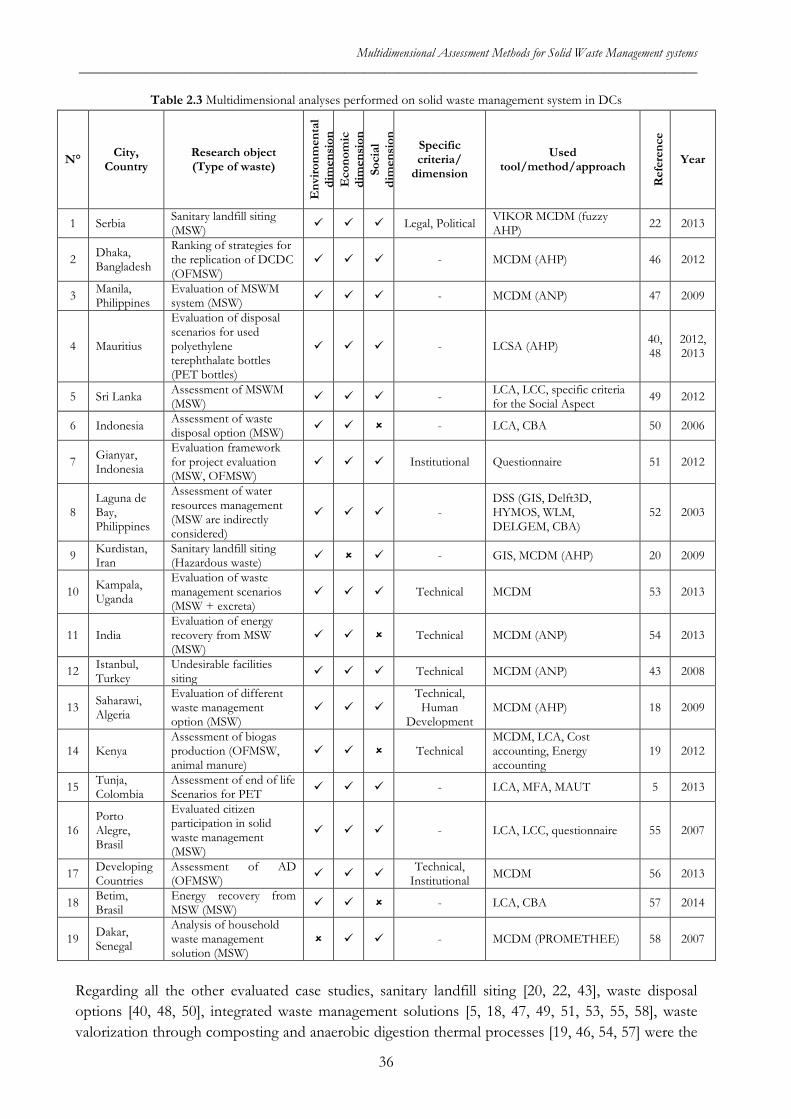
Multidimensional Assessment Methods for Solid Waste Management systems _____________________________________________________________________________________________
Table 2.3 Multidimensional analyses performed on solid waste management system in DCs
N° City, Country
Research object (Type of waste)
Env
ironm
enta
l di
men
sion
E
cono
mic
di
men
sion
So
cial
di
men
sion
Specific criteria/
dimension
Used tool/method/approach
Ref
eren
ce
Year
1 Serbia Sanitary landfill siting (MSW) Legal, Political VIKOR MCDM (fuzzy
AHP) 22 2013
2 Dhaka, Bangladesh
Ranking of strategies for the replication of DCDC (OFMSW)
- MCDM (AHP) 46 2012
3 Manila, Philippines
Evaluation of MSWM system (MSW) - MCDM (ANP) 47 2009
4 Mauritius
Evaluation of disposal scenarios for used polyethylene terephthalate bottles (PET bottles)
- LCSA (AHP) 40, 48
2012, 2013
5 Sri Lanka Assessment of MSWM (MSW) - LCA, LCC, specific criteria
for the Social Aspect 49 2012
6 Indonesia Assessment of waste disposal option (MSW) - LCA, CBA 50 2006
7 Gianyar, Indonesia
Evaluation framework for project evaluation (MSW, OFMSW)
Institutional Questionnaire 51 2012
8 Laguna de Bay, Philippines
Assessment of water resources management (MSW are indirectly considered)
- DSS (GIS, Delft3D, HYMOS, WLM, DELGEM, CBA)
52 2003
9 Kurdistan, Iran
Sanitary landfill siting (Hazardous waste) - GIS, MCDM (AHP) 20 2009
10 Kampala, Uganda
Evaluation of waste management scenarios (MSW + excreta)
Technical MCDM 53 2013
11 India Evaluation of energy recovery from MSW (MSW)
Technical MCDM (ANP) 54 2013
12 Istanbul, Turkey
Undesirable facilities siting Technical MCDM (ANP) 43 2008
13 Saharawi, Algeria
Evaluation of different waste management option (MSW)
Technical,
Human Development
MCDM (AHP) 18 2009
14 Kenya Assessment of biogas production (OFMSW, animal manure)
Technical MCDM, LCA, Cost accounting, Energy accounting
19 2012
15 Tunja, Colombia
Assessment of end of life Scenarios for PET - LCA, MFA, MAUT 5 2013
16 Porto Alegre, Brasil
Evaluated citizen participation in solid waste management (MSW)
- LCA, LCC, questionnaire 55 2007
17 Developing Countries
Assessment of AD (OFMSW) Technical,
Institutional MCDM 56 2013
18 Betim, Brasil
Energy recovery from MSW (MSW) - LCA, CBA 57 2014
19 Dakar, Senegal
Analysis of household waste management solution (MSW)
- MCDM (PROMETHEE) 58 2007
Regarding all the other evaluated case studies, sanitary landfill siting [20, 22, 43], waste disposal options [40, 48, 50], integrated waste management solutions [5, 18, 47, 49, 51, 53, 55, 58], waste valorization through composting and anaerobic digestion thermal processes [19, 46, 54, 57] were the
36
Multidimensional Assessment Methods for Solid Waste Management systems _____________________________________________________________________________________________
main investigated topics, equally spread in South America, Africa and Asia. In this literature review, the case study publication year represents an important information that points out how little has been the attention towards developing countries until now, especially as concerns the sustainability. Table 2.3 shows that almost all the papers were published in the last 7 years, underlining a strong temporal correlation between the first definition of the Integrated Sustainability Waste Management concept [59] in developing countries, in 2001, and the consequent guidelines development, in 2004 [60]. Obviously, the ISWM has to be considered as the main driver that addressed, and which is still addressing, the researchers and experts interest into the multidimensional study, which could be performed using all the different tools introduced since the 70s. Table 2.3 points out that Multi-Criteria Decision Making (MCDM), also called Multi-Criteria Analysis (MCA), is the main tool used for the multidimensional evaluation of different case studies. Almost all the MCDM approaches were performed through the Analytic Hierarchy Process (AHP) or the Analytic Network Process (ANP) in order to carry out the pairwise comparison among all the considered criteria. ANP is a subset of the AHP. In particular, while AHP elements are considered to be independent among all the others, the ANP considers the interdependence between proposed criteria and alternatives. MCDM is the most used evaluation method, concerning these case studies, especially because permits to arrange different types of criteria, mixing qualitative and quantitative data, owing to the lack of reliable data and specific databases in developing countries. Moreover, MCDM allows involving the different waste management system stakeholders in the decision process. Garfi et al. [18] developed a MCA based on AHP, in order to evaluate different management solutions in Saharawi refugee camps (Algeria). The authors chosen four alternative collection and disposal solutions, characterized by different types of vehicles and different collection frequencies. All these solutions were evaluated comparing four criteria groups: i) environmental and technical aspects, ii) social aspects, iii) economic aspects and iv) Human Development Index (HDI)16. Each criterion was composed by sub-criteria, which were bestowed different dimensionless values at, from minus 2 (entailing strong negative influence on the alternatives) to plus 2 (strong positive influence), in order to perform the subsequent pairwise comparison and define the most suitable solution. Milosevic et al. [22] proposed a VIKOR17 MCDM analysis in order to choose a suitable location for a new solid waste landfill in Serbia. In this case study, the authors used a fuzzy analytic hierarchy process in order to determine the coefficients weight that should be attributed at each selected criterion. Hydrological, meteorological, spatial, socio-political and economic aspects were the reference criteria that, considered all together, completely satisfy the integrated sustainable requirement. In 2009, Tseng [47] carried out a MCDM analysis using the analytic network process and the Decision Making Trial and Evaluation Laboratory (DEMATEL) in order to compare different municipal solid waste management solutions in Metro Manila (Philippines). Tseng used 17 different criteria to analyze the waste management alternatives from economic, environmental and social points of view. In particular, the author used the ANP, in order to set priorities and trade-offs among goals and criteria, and DEMATEL, a mathematical computation method, in order to convert the relations between causes and effects of criteria into a visual structural model.
16 The Human Development Index (HDI) is a composite statistic of life expectancy, education, and income indices used to rank countries into four tiers of human development. 17 VIKOR is a type of Multi-Criteria Decision Making (MCDM).
37
Multidimensional Assessment Methods for Solid Waste Management systems _____________________________________________________________________________________________
Another interesting application of MCDM was implemented by Sharif et al. [20]. Authors proposed to integrate the analysis with spatial information through the use of GIS, in order to define a suitable place where to sit a hazardous waste landfill in Kurdistan Province (Iran). This analysis, which takes into account just environmental and social aspects, was divided in two parts: in the first one, a site screening was performed by means of GIS in order to eliminate unsuitable lands and, in the second one, MCDM analysis was implemented with the aim to find the most suitable landfill site according to defined criteria. As pointed out by the aforementioned case studies, the MCDM represents a single tool that allows the performance of an integrated analysis considering different aspects, with the possibility to use further tools, such as GIS that helps going in-depth into the assessment. Despite MCDM, Table 2.3 reports also sustainable methods able to integrate different tools/methods for evaluation purposes. Bortoleto et al. [55] evaluated the integrated solid waste management system in Porto Alegre (Brasil) mainly from the economic and environmental points of view, but even as concern social aspects studying how the citizen participation influences the waste management practices in the city. In particular, the Porto Alegre waste management was analyzed using the Life Cycle Analysis (LCA) (global warming potential, acidification potential and nutrient enrichment potential), as concern environmental aspects, and the Life Cycle Cost (LCC) assessment, to define economic aspects, for all the elements that compose the waste management system (ordinary collection, secondary collection, sorting, recycling, landfilling, etc.). Finally, questionnaires were administered to the citizens for the evaluation of their awareness level (about solid waste management) and the correct practices to perform it. The elaboration of these questionnaires allowed to understand how social aspects can influence the analyzed system. The Porto Alegre analysis does not compare any different solutions or alternative scenarios, but only provides an overview about the waste management system in the city, in order to take into account possible enhancing solutions able to reach a higher sustainability compared to the one of the analyzed situation. Almost in this same way, Menikpura et al. [49] performed an integrated evaluation of different alternatives for municipal solid waste management in Sri Lanka. As the previous case study, authors evaluated the environmental and economic aspects of different scenarios, implementing LCA and LCC respectively. As concerns the social dimension, three specific indicators were defined: i) land occupation, in other words the productive land wasted by the inadequate waste management, such as open dumps, ii) damage of human health, measured as Disability Adjusted Life Years (DALY18), which depends on waste management practices, and iii) employment opportunities, strongly related to the type of activities implemented in an integrated waste management system. Menikpura et al. [49] performed this evaluation in order to propose a sustainable framework and a practical guide for Sri Lanka policy makers. Aye et al. [50] and Leme et al. [57] evaluated alternative waste disposal options in Indonesia and energy recovery from MSW in Brazil respectively, but only from the economic and environmental points of view, using, in both the cases, LCA and CBA methods. In these two case studies, social aspects were probably not evaluated since assessments were carried out at national scale. Indeed, it is quite difficult to determine the social dimension linked to solid waste management practices in such a large scale, since usually social elements refer to a small or distinct group of people, and continuously change according to the specific context evaluated.
18 The disability-adjusted life year (DALY) is a measure of overall disease burden, expressed as the number of years lost due to ill-health, disability or early death
38
Multidimensional Assessment Methods for Solid Waste Management systems _____________________________________________________________________________________________
In 2012, Foolmaun et al. [40, 48] adopted a rather new method for the evaluation of four different scenarios as concerns the management of used PolyEthylene Terephthalate (PET) bottles in Mauritius. The authors implemented the Life Cycle Sustainable Assessment (LCSA) that derives from the LCA approach family. In particular, this tool performs an integrated sustainable assessment implementing LCA, LCC and Social Life Cycle Assessment (S-LCA), respectively for environmental, economic and social dimension evaluations. LCSA was fully implemented applying the AHP, in order to obtain one final result for each considered scenario. This new method appears to be extremely interesting, because allows performing a complete integrated analysis concerning the whole life cycle of the service or good production. Zurbrügg et al. [51] proposed a new tool, particularly useful for the evaluation of waste management projects in developing countries. A questionnaire-based assessment method was developed in order to analyze the “driver of success” or the “reason of failure”, considering five different aspects: i) technical functionality/appropriateness, ii) health and environmental impacts, iii) costs, finances and economics, iv) social aspects and v) organizational strength and institutional support. Each aspect was constituted by a set of questions, which the stakeholders have to answer at with the following possible scores: 0 (not applicable), 1 (no), 2 (rather no), 3 (rather yes), 4 (yes). This methodology can be applied at the end of a project, but even in an intermediate phase of the project development, for instance in order to assess and correct possible on-going problems. This type of tool provides a qualitative evaluation, but rapidly allows understanding factors of success or failure without implementing other types of tools, which may require a big amount of quantitative data. The presented review shows a big lack as concerns the use of multidimensional tools for a sustainable evaluation of solid waste management systems in developing countries. The first integrate sustainable evaluations performed in the last 7 years and the few case studies reported in the scientific literature prove that more efforts are required in order to reach and implement sustainable waste management systems in developing countries from economic, environmental and social points of view.
2.4 Wrap up The present Chapter has shown that the assessment tools/methods/approaches are widely used as concern the solid waste management systems, especially in developed countries, where, at the end 60s were born. Assessment methods became more and more sophisticated through the subsequent decades in order to computing a bigger and continuously increasing amount of data and information, according, at the same time, to waste management evolutions and requirements. Indeed, it is possible to say that as soon as a waste management system evolution was observed, an assessment method improvement was entailed. In particular, in the early 70s, the economic dimension was the main considered into the evaluation implementation, subsequently was the time of the environmental impact evaluation, and just in the 2000s, the social dimension and the multidimensional assessment became interesting for the university researcher and consultants involved in the waste management activities, towards the sustainability concept. As concern the developing countries, the first evaluations were implemented starting from the second half of the 90s. Then, in the 2000s, waste management system evaluations were applied more frequently than in the past, especially considering one dimension. In particular, techno-economic analysis, CBA, MCDM and LCA were the main implemented tools. Nevertheless, despite the introduction of the Integrated Sustainable Waste Management concept for developing countries during the 2000s, multidimensional evaluations were rarely registered, even according to the results
39
Multidimensional Assessment Methods for Solid Waste Management systems _____________________________________________________________________________________________
achieved in the paragraph 2.3, hampering the sustainability of waste management systems. This is the evidence that more efforts are required in order to increase the implementation of multidimensional assessment tools/approaches and consequently to reach a waste management sustainability.
References
[1] Allesch, A., Brunner, P.H. (2014). Assessment methods for solid waste management: A literature review. Waste Management and Research, 32 (6), 461-473.
[2] Zurbrügg, C., Caniato, M., Vaccari, M. (2014). How assessment methods can support solid waste management in developing countries - A critical review. Sustainability (Switzerland), 6 (2), 545-570.
[3] Chang, N.B., Pires, A., Martinho, G. (2011). Empowering systems analysis for solid waste management: Challenges, trends, and perspectives. Critical Reviews in Environmental Science and Technology, 41 (16), 1449-1530.
[4] Thanh, N.P., Matsui, Y. (2013). Assessment of potential impacts of municipal solid waste treatment alternatives by using life cycle approach: A case study in Vietnam. Environmental Monitoring and Assessment, 185 (10), 7993-8004.
[5] Rochat, D., Binder, C.R., Diaz, J., Jolliet, O. (2013). Combining material flow analysis, life cycle assessment, and multiattribute utility theory: Assessment of end-of-life scenarios for polyethylene terephthalate in Tunja, Colombia Journal of Industrial Ecology, 17 (5), 642-655.
[6] Zhao, Y., Wang, H.T., Lu, W.J., Damgaard, A., Christensen, T.H. (2009). Life-cycle assessment of the municipal solid waste management system in Hangzhou, China (EASEWASTE). Waste Management and Research, 27 (4), 399-406.
[7] Chi, Y., Dong, J., Tang, Y., Huang, Q., Ni, M. (2014). Life cycle assessment of municipal solid waste source-separated collection and integrated waste management systems in Hangzhou, China. Journal of Material Cycles and Waste Management, article in press.
[8] Abduli, M.A., Naghib, A., Yonesi, M., Akbari, A. (2011). Life cycle assessment (LCA) of solid waste management strategies in Tehran: Landfill and composting plus landfill. Environmental Monitoring and Assessment, 178 (1-4), 487-498.
[9] Özeler, D., Yetiş, Ü., Demirer, G.N. (2006). Life cycle assessment of municipal solid waste management methods: Ankara case study. Environment International, 32 (3), 405-411.
[10] Vossberg, C., Mason-Jones, K., Cohen, B.(2014). An energetic life cycle assessment of C&D waste and container glass recycling in Cape Town, South Africa. Resources, Conservation and Recycling, 88, 39-49.
[11] Menikpura, S.N.M., Sang-Arun, J., Bengtsson, M. (2013). Climate co-benefits of energy recovery from landfill gas in developing Asian cities: A case study in Bangkok. Waste Management and Research, 31 (10), 1002-1011.
40
Multidimensional Assessment Methods for Solid Waste Management systems _____________________________________________________________________________________________
[12] Amoo, O.M., Fagbenle, R.L. (2013). Renewable municipal solid waste pathways for energy generation and sustainable development in the Nigerian context. International Journal of Energy and Environmental Engineering, 4 (1), 1-17.
[13] Bergqvist, M.M., Wårdh, K.S., Das, A., Ahlgren, E.O. (2008). A techno-economic assessment of rice husk-based power generation in the Mekong River Delta of Vietnam. International Journal of Energy Research, 32 (12), 1136-1150.
[14] Abu Qdais, H.A. (2007). Techno-economic assessment of municipal solid waste management in Jordan. Waste Management, 27 (11), 1666-1672.
[15] Athanassiou, M., Zabaniotou, A.(2008). Techno-economic assessment of recycling practices of municipal solid wastes in Cyprus. Journal of Cleaner Production, 16 (14), 1474-1483.
[16] Vitali, F., Parmigiani, S., Vaccari, M., Collivignarelli, C. (2013). Agricultural waste as household fuel: Techno-economic assessment of a new rice-husk cook stove for developing countries. Waste Management, 33 (12), 2762-2770.
[17] Collivignarelli, C., Vaccari, M., Di Bella, V., Giardina, D. (2011). Techno-economic evaluation for the improvement of MSW collection in Somaliland and Puntland. Waste Management and Research, 29 (5), 521-531.
[18] Garfì, M., Tondelli, S., Bonoli, A. (2009). Multi-criteria decision analysis for waste management in Saharawi refugee camps. Waste Management, 29 (10), 2729-2739.
[19] Nzila, C., Dewulf, J., Spanjers, H., Tuigong, D., Kiriamiti, H., van Langenhove, H. (2012). Multi criteria sustainability assessment of biogas production in Kenya. Applied Energy, 93, 496-506.
[20] Sharifi, M., Hadidi, M., Vessali, E., Mosstafakhani, P., Taheri, K., Shahoie, S., Khodamoradpour, M. (2009). Integrating multi-criteria decision analysis for a GIS-based hazardous waste landfill sitting in Kurdistan Province, western Iran. Waste Management, 29 (10), 2740-2758.
[21] Gómez-Delgado, M., Tarantola, S. (2006). GLOBAL sensitivity analysis, GIS and multi-criteria evaluation for a sustainable planning of a hazardous waste disposal site in Spain. International Journal of Geographical Information Science, 20 (4), 449-466.
[22] Milosevic, I., Naunovic, Z. (2013). The application of a multi-parameter analysis in choosing the location of a new solid waste landfill in Serbia. Waste Management and Research, 31 (10), 1019-1027.
[23] Monprapussorn, S., Thaitakoo, D., Watts, D.J., Banomyong, R. (2009). Multi criteria decision analysis and geographic information system framework for hazardous waste transport sustainability. Journal of Applied Sciences, 9 (2), 268-277.
[24] ASPIRE. Available online: http://www.oasys-software.com/products/environmental/aspire.html (Accessed: 26/09/2014).
41
Multidimensional Assessment Methods for Solid Waste Management systems _____________________________________________________________________________________________
[25] Wilson, D.C., Rodic, L., Scheinberg, A., Velis, C.A., Alabaster, G. (2012). Comparative analysis of solid waste management in 20 cities. Waste Management and Research, 30 (3), 237-254.
[26] Vishwakarma, A., Kulshrestha, M., Kulshreshtha, M. (2012). Efficiency evaluation of municipal solid waste management utilities in the urban cities of the state of Madhya Pradesh, India, using stochastic frontier analysis. Benchmarking, 19 (3), 340-357.
[27] Diaz, R., Otoma, S. (2013). Constrained recycling: A framework to reduce landfilling in developing countries. Waste Management and Research, 31 (1), 23-29.
[28] Koushki, P.A., Al-Duaij, U., Al-Ghimlas, W. (2004). Collection and transportation cost of household solid waste in Kuwait. Waste Management, 24 (9), 957-964.
[29] Parthan, S.R., Milke, M.W., Wilson, D.C., Cocks, J.H. (2012). Cost estimation for solid waste management in industrialising regions - Precedents, problems and prospects. Waste Management, 32 (3), 584-594.
[30] Lavee, D., Nardiya, S. (2013). A cost evaluation method for transferring municipalities to solid waste source-separated system. Waste Management, 33 (5), 1064-1072.
[31] Diaz, R., Otoma, S. (2014). Cost-benefit analysis of waste reduction in developing countries: A simulation. Journal of Material Cycles and Waste Management, 16 (1), 108-114.
[32] Lohri, C.R., Camenzind, E.J., Zurbrügg, C. (2014). Financial sustainability in municipal solid waste management - Costs and revenues in Bahir Dar, Ethiopia. Waste Management, 34 (2), 542-552.
[33] Mollah, M.B. (2012). Design and cost benefit analysis of biogas plant using human and solid wastes as a load shedding backup for multi-storied buildings. Proceedings of the 2nd International Conference on the Developments in Renewable Energy Technology, ICDRET 2012, 72-76.
[34] Tin, A.M., Wise, D.L., Su, W.H., Reutergardh, L., Lee, S.K. (1995). Cost-benefit analysis of the municipal solid waste collection system in Yangon, Myanmar. Resources, Conservation and Recycling, 14 (2), 103-131.
[35] Rathi, S. (2006). Alternative approaches for better municipal solid waste management in Mumbai, India. Waste Management, 26 (10), 1192-1200.
[36] Couth, R., Trois, C. (2012). Cost effective waste management through composting in Africa. Waste Management, 32 (12), 2518-2525.
[37] Sundaravadivel, M., Vigneswaran, S. (2003). Strategies for waste management in small and medium towns of developing countries: A case study of India. Water Science and Technology, 47 (12), 277-283.
[38] Wang, H., He, J., Kim, Y., Kamata, T. (2014). Municipal solid waste management in rural areas and small counties: An economic analysis using contingent valuation to estimate willingness to pay for Yunnan, China. Waste Management and Research, 32 (8), 695-706.
42
Multidimensional Assessment Methods for Solid Waste Management systems _____________________________________________________________________________________________
[39] Afrane, G., Ntiamoah, A. (2012). Analysis of the life-cycle costs and environmental impacts of cooking fuels used in Ghana. Applied Energy, 98, 301-306.
[40] Foolmaun, R.K., Ramjeeawon, T. (2012). Comparative life cycle assessment and life cycle costing of four disposal scenarios for used polyethylene terephthalate bottles in Mauritius. Environmental Technology (United Kingdom), 33 (17), 2007-2018.
[41] Zhao, W., Huppes, G., van der Voet, E. (2011). Eco-efficiency for greenhouse gas emissions mitigation of municipal solid waste management: A case study of Tianjin, China. Waste Management, 31 (6), 1407-1415.
[42] Reich, M.C. (2005). Economic assessment of municipal waste management systems - Case studies using a combination of life cycle assessment (LCA) and life cycle costing (LCC). Journal of Cleaner Production, 13 (3), 253-263.
[43] Tuzkaya, G., Önüt, S., Tuzkaya, U.R., Gülsün, B. (2008). An analytic network process approach for locating undesirable facilities: An example from Istanbul, Turkey. Journal of Environmental Management, 88 (4), 970-983.
[44] Dursun, M., Karsak, E.E., Karadayi, M.A.(2011). Assessment of health-care waste treatment alternatives using fuzzy multi-criteria decision making approaches. Resources, Conservation and Recycling, 57, 98-107.
[45] Wilson, D.C. (2007). Development drivers for waste management. Waste Management and Research, 25 (3), 198-207.
[46] Yedla, S. (2012). Replication of urban innovations - Prioritization of strategies for the replication of Dhaka's community-based decentralized composting model. Waste Management and Research, 30 (1), 20-31.
[47] Tseng, M.L. (2009). Application of ANP and DEMATEL to evaluate the decision-making of municipal solid waste management in Metro Manila. Environmental Monitoring and Assessment, 156 (1-4), 181-197.
[48] Foolmaun, R.K., Ramjeawon, T. (2013). Life cycle sustainability assessments (LCSA) of four disposal scenarios for used polyethylene terephthalate (PET) bottles in Mauritius. Environment, Development and Sustainability, 15 (3), 783-806.
[49] Menikpura, S.N.M., Gheewala, S.H., Bonnet, S. (2012). Sustainability assessment of municipal solid waste management in Sri Lanka: Problems and prospects. Journal of Material Cycles and Waste Management, 14 (3), 181-192.
[50] Aye, L., Widjaya, E.R. (2006). Environmental and economic analyses of waste disposal options for traditional markets in Indonesia. Waste Management, 26 (10), 1180-1191.
[51] Zurbrügg, C., Gfrerer, M., Ashadi, H., Brenner, W., Küper, D. (2012). Determinants of sustainability in solid waste management - The Gianyar Waste Recovery Project in Indonesia. Waste Management, 32 (11), 2126-2133.
43
Multidimensional Assessment Methods for Solid Waste Management systems _____________________________________________________________________________________________
[52] Nauta, T.A., Bongco, A.E., Santos-Borja, A.C. (2003). Set-up of a decision support system to support sustainable development of the Laguna de Bay, Philippines. Marine Pollution Bulletin, 47 (1-6), 211-218.
[53] Oyoo, R., Leemans, R., Mol, A.P.J. (2013). The determination of an optimal waste management scenario for Kampala, Uganda. Waste Management and Research, 31 (12), 1203-1216.
[54] Nixon, J.D., Dey, P.K., Ghosh, S.K., Davies, P.A. (2013). Evaluation of options for energy recovery from municipal solid waste in India using the hierarchical analytical network process. Energy, 59, 215-223.
[55] Bortoleto, A.P., Hanaki, K. (2007). Report: Citizen participation as a part of integrated solid waste management: Porto Alegre case. Waste Management and Research, 25 (3), 276-282.
[56] Lohri, C.R., Rodić, L., Zurbrügg, C. (2013). Feasibility assessment tool for urban anaerobic digestion in developing countries. Journal of Environmental Management, 126, 122-131.
[57] Leme, M.M.V., Rocha, M.H., Lora, E.E.S., Venturini, O.J., Lopes, B.M., Ferreira, C.H. (2014). Techno-economic analysis and environmental impact assessment of energy recovery from Municipal Solid Waste (MSW) in Brazil. Resources, Conservation and Recycling, 87, 8-20.
[58] Kapepula, K.M., Colson, G., Sabri, K., Thonart, P. (2007). A multiple criteria analysis for household solid waste management in the urban community of Dakar. Waste Management, 27 (11), 1690-1705.
[59] van de Klundert, A., Anschütz, J. (2001). Integrated Sustainable Waste Management – The concept. Waste, Gouda, The Netherlands, ISBN 90-76639-02-7, Edited by A. Scheinberg.
[60] Anschütz, J., Ijgosse, J., Scheinberg, A. (2004). Putting Integrated Sustainable Waste Management Into Practice: Using the ISWM Assessment Methodology as Applied in the UWEP Plus Programme (2001-2003). Waste, Gouda, The Netherlands, ISSN 9076639051.
44
An Integrated Assessment Scheme for Solid Waste Management in Low and Middle-Income Countries _____________________________________________________________________________________________
Chapter 3. An Integrated Assessment Scheme for Solid Waste Management in Low and Middle-Income Countries
Abstract Despite the implementation of many different tools to support decision making in waste management, the multidimensional approaches, necessary to reach the systems sustainability, are rarely used especially in developing countries, where the concept of sustainable waste management is not still recognized and implemented. Nevertheless, even if the multidimensional evaluation seems to be necessary in order to carry out a comprehensive study about the considered waste management system, there are many constraints in its implementation in low and middle-income countries, where often it is very difficult to achieve reliable data and information required by the approach. Even in the case in which it is possible to implement sophisticated multidimensional evaluations, the final data could not be well understood by the local stakeholders, who are not aware about waste management and its quantitative evaluation. Thus, a multidimensional approach easy to implement and that shows clear and understandable data is required in order to achieve an integrated sustainable waste management in developing countries. The present Chapter presents the proposal of a new Integrated Assessment Scheme (IAS) to support decision making in waste management in developing countries, from an economic, social and environmental points of view.
3.1 The need of an Integrated Assessment Scheme (IAS) The evaluation of municipal solid waste management in developing countries is fundamental in order to define the most suitable technology or solution for the local context. Indeed, it is crucial to outline an appropriate sustainable solution, which could be different case by case, in order to meet the economic, environmental and social requirements of the investigated waste management system. All the stakeholders involved into the system should always be considered, as even highlight by the ISWM concept [1]. Nevertheless, although some experts and researchers performed theories and studies concerning sustainable waste management evaluation [2-5], the scientific literature shows a big gap as concerns the implementation of evaluation methods or assessment tools, especially considering the multidimensional approach (as already reported in Chapter 2). In particular, the assessment tools are mainly used by university researchers, experts and consultants involved in the waste management field as pointed out by the developed countries experiences. Therefore, the lack or even complete absence of evaluation approaches in low and middle-income countries is likely due to the poor engagement and interest of these subjects in such field. Moreover, the high amount of data required by the tools represents another big constraint in their implementation, especially because in developing countries it is very difficult to access to data and information, also for the people that live in such contexts. Life Cycle Analysis (LCA) is a current example of this gap, as concerns the high data quality required in order to perform the system analysis. However, when it is not possible to find necessary data, it is suggested to not perform an analysis based on presumed data, because those could not be system specific. Consequently, the achieved results could not be reliable, confirming the statement that says “Garbage In, Garbage Out (GIGO)” [6]. In other words,
45
An Integrated Assessment Scheme for Solid Waste Management in Low and Middle-Income Countries _____________________________________________________________________________________________
the model will not compute reliable results if reliable data are not used at the beginning of the process. Concerning the environmental impact evaluation, even if required data are available and reliable to obtain good results, it is not sure that the achieved outcomes will be understandable by stakeholders in developing countries. This is due to several reasons, such as the stakeholders lack of knowledge concerning the environmental impact quantification or there is an absence of laws and limits necessary for a comparison with the obtained results. The economic aspects are the most understood in developing countries, because people are usually in close contact with money, with which they measure and define their living standards. Nevertheless, the technological aspects, which are strictly undergone and hidden by the total amount of money, are rarely taken into account, especially because the stakeholders have not knowledge and are not aware about the possible technologies and solutions that could be used for the solid waste management. Therefore, it clearly appears that just making an economic evaluation is not enough to define a sustainable solution. As reported in Chapter 2, the social aspects are the last link in the evaluation chain, indeed they are rarely taken into account, if not in the last years, but with low interest, determining big constraints in the evaluation implementation. Overall, as aforementioned, the SWM assessment method/approach implementations in developing countries are rarely applied, and in the few cases in which they are used, encounter several constraints as concern their implementation way (e.g. lack of data availability, difficulties concerning data interpretation, etc.). Therefore, it is reasonable to understand the almost absence of multidimensional evaluation application, since currently there are too much constraints that severely hamper the sustainable implementation. At the same time and with the same importance, it is recognized the need to overcome this big gap toward the sustainable waste management. The proposal of a new Integrated Assessment Scheme (IAS) was developed by the author during the PhD course, in order to support the decision making in waste management in low and middle income countries, following the sustainability concept during all the research steps. This new assessment scheme was developed to investigate, design and propose new solutions in order to enhance the waste management schemes directly in the field, in low and middle-income countries. In particular the assessment scheme is based on 3 important requirements: i) to implement and satisfy the Integrated Sustainable Waste Management concept analyzing economic, social and environmental dimensions, ii) to simplify the conventional supporting decision making methods in order to suggest understandable solutions even for the stakeholders, who are usually poorly aware about solid waste management practices and their interlinked issues, thus addressing their decisions as best as possible, iii) to apply the “scenario” theory to forecast possible future actions and relationships. Indeed, it has to be considered that clear and understandable data do not necessarily correspond to results with specific units of measure (e.g., kgCO2/ton of waste, MJ/ton of waste, etc.), which apparently seem to be easier to interpret. Numbers with definite units of measure are often more difficult to understand, or are even not comparable with law limits or other similar results. The key point is that results should be able to explain what is good and what is not, what is better and what is worse. The proposed approach allows to address the interest of the stakeholders for a solution rather than another one, without presenting too much specific data or results, which could be difficult to obtain, not reliable or not understood. The IAS is very useful when a waste management system has to be improved and consequently it is necessary to design and present several possible scenario solutions. The assessment scheme will provide easy and comparable results for different analyzed scenarios, giving at the stakeholders the possibility to choose which one is more suitable, based on their specific requirements. Moreover, the
46
An Integrated Assessment Scheme for Solid Waste Management in Low and Middle-Income Countries _____________________________________________________________________________________________
scenarios comparison allows defining the best solution according to the environmental, economic and social dimensions. This new Integrated Assessment Scheme requires to be performed by people who well know waste management theories, practices, technologies and solutions, in order to be aware and able to recognize where the problem is, how to collect data and information and how to design suitable solutions. These people need to have a technical background studies or direct field experiences with waste management. Anyway these requirements have not to be seen as a constraint of the assessment scheme procedure, but a resource or a starting point in order to implement a well done analysis and achieve suitable results. Finally, the ISWM concept has to be considered in order to perform the waste management system analysis, based on the three sustainability pillars. In order to perform a waste management system evaluation with the IAS, it is necessary to understand the current waste management practices of the investigated system, and know as much as possible the stakeholders involved into the system. Then, it is possible to design and propose different scenario solutions, which will be finally evaluated according to the IAS rating score that will present in the paragraph 3.3. The IAS has been elaborated in order to be easily applicable and replicable in other different contexts in low and middle income countries, even if the achieved results are site specific, consequently similar scenarios, evaluated in different countries, are not comparable.
3.2 The scenario analysis The scenario analysis is typically used when people deal with future developments, concerning different fields and topics, and their interlinked uncertainties that should be defined, even if it is very difficult, if not impossible, to forecast certain future actions and reactions. According to [7], scenario are defined as a “plausible and often simplified descriptions of how the future may develop based on a coherent and internally consistent set of assumptions about key driving forces, their relationships and their implications”. The scenario development and analysis allow to assess and understand changes that might be expected to shape the considered context and its elements from different points of view. Therefore, it is very useful to support the decision making process and the strategic planning, especially in low and middle income countries in order to address the decision makers towards the most suitable decision according to their requirements. In particular, different scenario are usually developed and analyzed in order to provide a set of possible solutions, each one characterized by different assumptions and driving forces. Obviously, much more complex is the considered scenario and much many will be the uncertainties tied to the future implications, relationships and circumstances. This research work is based on the definition and the analysis of scenario, through the IAS use, which considers different waste management scheme options. In particular, at the beginning, for both the case studies investigated, the waste management systems were analyzed using the IAS, according to the real characteristics of both of them at the moment of the field evaluation. The low performances registered for both the waste management schemes have suggested their improvement in order to enhance the quality of the considered contexts. Therefore, new scenarios describing improved waste management solutions were designed and then evaluated using the IAS, according to the scenario concept. In this way, possible future trends, actions and reactions caused by the development of a new waste management solution were evaluated in order to support the decision making of the local stakeholders, taking into account the economic, social and environmental dimensions.
47
An Integrated Assessment Scheme for Solid Waste Management in Low and Middle-Income Countries _____________________________________________________________________________________________
3.3 Scenario Rating System The proposed Integrated Assessment Scheme is composed by 3 dimensions: economic, social and environmental. Each dimension is defined by a set of specific indicators, which have to be evaluated in order to determine the final value of each dimension for each proposed scenario. It is worth to underline that this evaluation process is based on the scenario concept, as well as the expert judgment process [7a]. The expert judgment represents a process that takes advantage of specialized knowledge and experience to inform some management or decision-making need, especially as concern complex problems or situations. In particular, the specialized knowledge could derive from scientific training or from long-term experience with a particular topic, and, at the same time, can combine together formal and informal kinds of deep knowledge. The expert judgment is very useful in cases where empirical evidence is lacking or insufficient, as the case of the low and middle income country contexts, where the reliable and accessible information and data are very low or negligible. Therefore, the expert judgment is used to make decisions about complex problems with technical components, because scientific information must be translated into forms that are meaningful and relevant to a decision-making context. The economic dimension is composed by a set of 4 different indicators, calculated according to coherent technical and economic real field data and hypothesis, which report the scenario costs, expressed in monetary term. Moreover, the economic indicators are not grouped together because each one has a different measurement unit, which refers to different characteristics linked to the technical solution adopted in a scenario. The 4 indicators provide a complete overview about the possible costs that have to be faced choosing a scenario rather than the other ones, according to the decision makers’ needs and requirements. In particular, the economic indicators were not defined using dimensionless values because, anyhow, the monetary measurement is well understandable by the local stakeholders in low and middle income countries. The social and environmental dimensions are evaluated through the analysis of their respective set of qualitative indicators, at which dimensionless values categorized on a 0-4 scale have to be bestowed, according to the rating system proposed for each one. In particular, four different types of rating systems are defined in order to fit as much as possible the definition of each indicator. The defined rating systems are called: i) level, ii) level + criteria, iii) positive contribution and iv) level of interference. The first one, called “level”, is a rating system that allows to carry out a qualitative measure of the considered indicator, according to different levels of magnitude expressed by different adverbs (e.g. very high, high, relatively high, moderate, low and very low). In particular, these adverbs are linked to a noun, subject or descriptive element that characterizes the considered indicator and helps to define the final qualitative measure. For example “the number of workers is very high” or “the number of workers is very low” are two descriptions of the rating system of the “number of employees” indicator, where the word “number” represents the descriptive element of the indicator and the linked adverb describes the magnitude level. The second one, called “level + criteria”, has the same characteristic of the “level” rating system, but with an additional part called “criteria”. Even this rating system allows to carry out a qualitative measure of the considered indicator. In particular, the evaluation is based on different levels of magnitude, expressed by different adverbs (e.g. very high, high, relatively high, moderate, low and very low), and at the same time by the introduction of a criteria that allows to better specify the description of the rating system. For example “the worker salary is very low and poorly satisfies the minimum living standards components” or “the organic soil pollution is very low and the plants/enterprises have implemented all the waste management improvements” are two descriptions
48
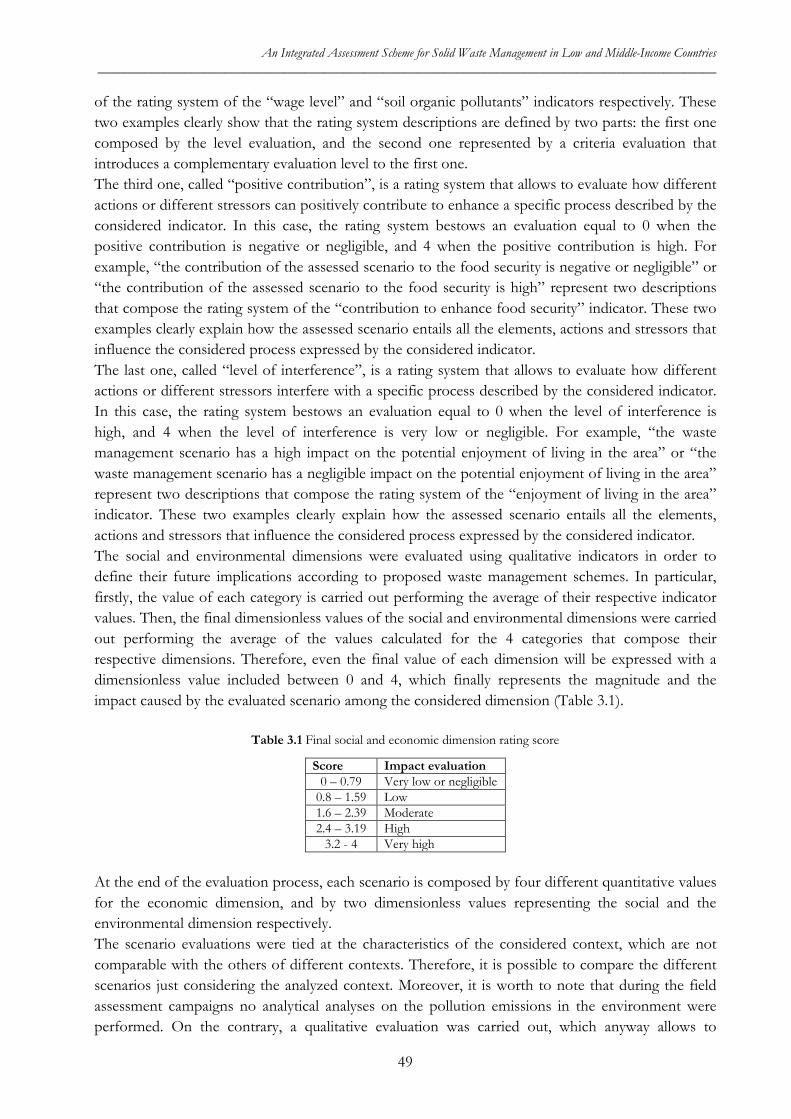
An Integrated Assessment Scheme for Solid Waste Management in Low and Middle-Income Countries _____________________________________________________________________________________________
of the rating system of the “wage level” and “soil organic pollutants” indicators respectively. These two examples clearly show that the rating system descriptions are defined by two parts: the first one composed by the level evaluation, and the second one represented by a criteria evaluation that introduces a complementary evaluation level to the first one. The third one, called “positive contribution”, is a rating system that allows to evaluate how different actions or different stressors can positively contribute to enhance a specific process described by the considered indicator. In this case, the rating system bestows an evaluation equal to 0 when the positive contribution is negative or negligible, and 4 when the positive contribution is high. For example, “the contribution of the assessed scenario to the food security is negative or negligible” or “the contribution of the assessed scenario to the food security is high” represent two descriptions that compose the rating system of the “contribution to enhance food security” indicator. These two examples clearly explain how the assessed scenario entails all the elements, actions and stressors that influence the considered process expressed by the considered indicator. The last one, called “level of interference”, is a rating system that allows to evaluate how different actions or different stressors interfere with a specific process described by the considered indicator. In this case, the rating system bestows an evaluation equal to 0 when the level of interference is high, and 4 when the level of interference is very low or negligible. For example, “the waste management scenario has a high impact on the potential enjoyment of living in the area” or “the waste management scenario has a negligible impact on the potential enjoyment of living in the area” represent two descriptions that compose the rating system of the “enjoyment of living in the area” indicator. These two examples clearly explain how the assessed scenario entails all the elements, actions and stressors that influence the considered process expressed by the considered indicator. The social and environmental dimensions were evaluated using qualitative indicators in order to define their future implications according to proposed waste management schemes. In particular, firstly, the value of each category is carried out performing the average of their respective indicator values. Then, the final dimensionless values of the social and environmental dimensions were carried out performing the average of the values calculated for the 4 categories that compose their respective dimensions. Therefore, even the final value of each dimension will be expressed with a dimensionless value included between 0 and 4, which finally represents the magnitude and the impact caused by the evaluated scenario among the considered dimension (Table 3.1).
Table 3.1 Final social and economic dimension rating score
Score Impact evaluation 0 – 0.79 Very low or negligible
0.8 – 1.59 Low 1.6 – 2.39 Moderate 2.4 – 3.19 High
3.2 - 4 Very high At the end of the evaluation process, each scenario is composed by four different quantitative values for the economic dimension, and by two dimensionless values representing the social and the environmental dimension respectively. The scenario evaluations were tied at the characteristics of the considered context, which are not comparable with the others of different contexts. Therefore, it is possible to compare the different scenarios just considering the analyzed context. Moreover, it is worth to note that during the field assessment campaigns no analytical analyses on the pollution emissions in the environment were performed. On the contrary, a qualitative evaluation was carried out, which anyway allows to
49
An Integrated Assessment Scheme for Solid Waste Management in Low and Middle-Income Countries _____________________________________________________________________________________________
effectively understand the current situation, and at the same time to define coherent hypotheses about the future emission trends/evolutions. Consequently, the potential relationships among different dimensions can be determined, according to the considered waste management technology. Using this IAS, stakeholders and/or decision makers will have a global overview on the different solutions, which means to have the possibility to choose the most suitable one after a clear evaluation of the pros and cons of each scenario. The cheapest solutions could not be the most socially accepted or the most environmental friendly, and vice versa. Therefore, stakeholders have to choose based on the priorities and requirements of the local context. Finally, it is worth to underline that the IAS approach, which is mainly qualitative, does not preclude the further and consequently use of quantitative methods or approaches.
3.4 Integrated Assessment Scheme dimensions description In the following paragraphs the IAS dimensions will be described in detail, in order to give a complete overview on the IAS and all the necessary clarifications also allowing its further use by other experts and practitioners involved in the waste management sector.
3.4.1 Economic dimension Cost-Benefit Analysis (CBA) and Life Cycle Costing (LCC) are the main used methods for the economic evaluation of municipal solid waste management systems in developing countries. CBA [8-15] is applied in order to evaluate benefits and direct and indirect costs of municipal solid waste management systems. In particular, with this method it is also possible to quantify in monetary terms costs and benefits that derive from social and environmental dimensions entailed with the waste management. LCC [16-19] belongs to the life cycle analysis family, and sometimes, in the last 5 years, has been used in order to perform economic analysis about solid waste management schemes in developing countries. Due to its recent development even in developed countries, LCC is not yet so spread in developing countries, as the CBA is. In particular, LCC performs a sort of enlarged CBA, inasmuch the analysis does not exclusively consider just the waste management system scheme, but also all the boundary system that is indirectly interlinked with the waste management practices. For example, considering a door to door waste collection system, the LCC also performs the analysis on the costs about the plastic bins production, which is indirectly linked with the waste management system. Indeed, this evaluation tool considers the whole life cycle of goods and services production, and can be compared to the Life Cycle Analysis (LCA) used for the environmental impact assessment. Nevertheless, these two evaluation methods perform deep and complex analyses on the waste management systems, requiring the availability of a big amount of data and information that, as already stated, are often difficult to collect in developing countries. Moreover, the quantification of non-tangible costs and benefits linked to the environmental and social dimensions cannot be so understandable for the local stakeholders in developing countries. Therefore, in order to overcome these drawbacks, a simple cost-accounting was developed to easily present understandable results, concerning all the costs and revenues that could arise from the considered waste management scheme. In this way the local stakeholders can really feel what the costs and benefits are physically linked to. Direct costs, general and indirect costs, maintenance costs and fixed costs are the main items considered and calculated for each proposed solutions in order to define the 4 indicators that describe, for each scenario, the economic dimension: initial investment cost, total waste management cost,
50
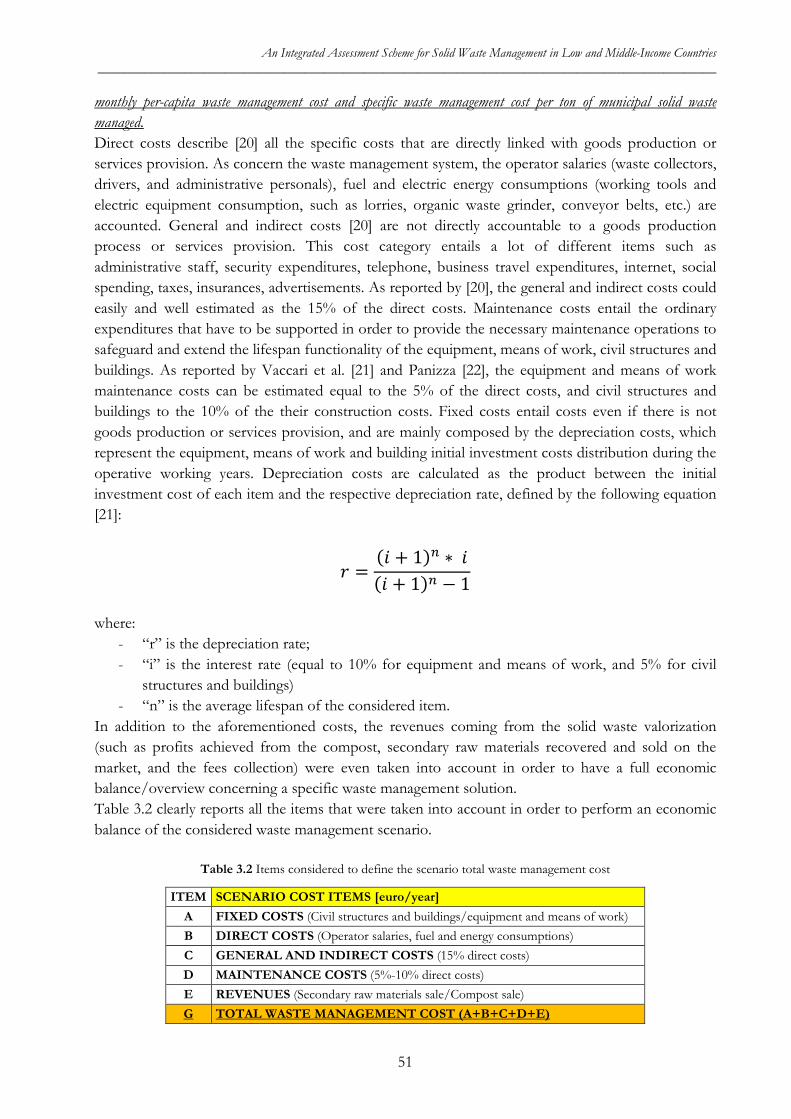
An Integrated Assessment Scheme for Solid Waste Management in Low and Middle-Income Countries _____________________________________________________________________________________________
monthly per-capita waste management cost and specific waste management cost per ton of municipal solid waste managed. Direct costs describe [20] all the specific costs that are directly linked with goods production or services provision. As concern the waste management system, the operator salaries (waste collectors, drivers, and administrative personals), fuel and electric energy consumptions (working tools and electric equipment consumption, such as lorries, organic waste grinder, conveyor belts, etc.) are accounted. General and indirect costs [20] are not directly accountable to a goods production process or services provision. This cost category entails a lot of different items such as administrative staff, security expenditures, telephone, business travel expenditures, internet, social spending, taxes, insurances, advertisements. As reported by [20], the general and indirect costs could easily and well estimated as the 15% of the direct costs. Maintenance costs entail the ordinary expenditures that have to be supported in order to provide the necessary maintenance operations to safeguard and extend the lifespan functionality of the equipment, means of work, civil structures and buildings. As reported by Vaccari et al. [21] and Panizza [22], the equipment and means of work maintenance costs can be estimated equal to the 5% of the direct costs, and civil structures and buildings to the 10% of the their construction costs. Fixed costs entail costs even if there is not goods production or services provision, and are mainly composed by the depreciation costs, which represent the equipment, means of work and building initial investment costs distribution during the operative working years. Depreciation costs are calculated as the product between the initial investment cost of each item and the respective depreciation rate, defined by the following equation [21]:
𝑟𝑟 =(𝑖𝑖 + 1)𝑛𝑛 ∗ 𝑖𝑖(𝑖𝑖 + 1)𝑛𝑛 − 1
where:
- “r” is the depreciation rate; - “i” is the interest rate (equal to 10% for equipment and means of work, and 5% for civil
structures and buildings) - “n” is the average lifespan of the considered item.
In addition to the aforementioned costs, the revenues coming from the solid waste valorization (such as profits achieved from the compost, secondary raw materials recovered and sold on the market, and the fees collection) were even taken into account in order to have a full economic balance/overview concerning a specific waste management solution. Table 3.2 clearly reports all the items that were taken into account in order to perform an economic balance of the considered waste management scenario.
Table 3.2 Items considered to define the scenario total waste management cost
ITEM SCENARIO COST ITEMS [euro/year] A FIXED COSTS (Civil structures and buildings/equipment and means of work) B DIRECT COSTS (Operator salaries, fuel and energy consumptions) C GENERAL AND INDIRECT COSTS (15% direct costs) D MAINTENANCE COSTS (5%-10% direct costs) E REVENUES (Secondary raw materials sale/Compost sale) G TOTAL WASTE MANAGEMENT COST (A+B+C+D+E)
51
An Integrated Assessment Scheme for Solid Waste Management in Low and Middle-Income Countries _____________________________________________________________________________________________
It is worth to note that for a clear understanding of the economic aspects of the considered solution it would be better to divide the waste management scheme in different sub-schemes, such as waste collection system, waste recovery (paper, plastic, organic, etc.) and all the other sub-schemes according to the adopted waste management solution. Then, for each one, it would be suitable to define a separated economic overview, especially to avoid data mixes and omissions or possible calculation mistakes, using per each sub-scheme the accounting method suggested in Table 3.2. Then, all these item costs and revenues were used in order to define the final 4 indicators.
3.4.1.1 Initial investment cost Initial investment cost represents the initial total amount of money necessary to buy all the equipment and staff and to build civil structures and buildings for goods productions and/or services provision. Therefore, rakes, spades, lorries, shovel loaders, street containers/bins, door to door domestic bins, land for building constructions, composting plants, sorting plants, incinerators and so on, represent the main specific items that have to be considered into the initial investment cost in order to set up a waste management solution. This indicator is expressed in term of amount of money: euro [€].
3.4.1.2 Total waste management cost The total waste management cost is calculated as the sum of the whole costs and revenues items, except for the expected amount of the waste management collection fees, as point out in table 3.2. This exception was made since, in many case studies, the local municipality does not provide a fee payment system, or more frequently the fee payment system exists but the people do not pay it because the waste management service is considered inadequate. In particular this indicator gives a global overview about the waste management costs as concern the whole waste management operations, such as waste collection, composting process, waste sorting process, and so on. The measurement unit of this indicator is [€/year].
3.4.1.3 Monthly per-capita waste management cost The monthly per-capita waste management cost is calculated as the total waste management cost divided by the number of the citizens covered by the waste management system for each month. This indicator is important in order to have an overview about waste management costs distribution on the covered or presumed covered area, and to make a comparison with the monthly per-capita waste management fee defined by the municipality. Therefore, it is possible to state if the fee applied by the municipality can cover the expenditures of waste management system or not, trying eventually to adequate it. This indicator is quite crucial for most of the municipalities in developing countries, because they are afraid to lose the political consensus, increasing the taxes at the citizens. Unfortunately, what the municipalities usually ignore is the possibility to reinforce their political consensus providing a better waste management service at the local community. The measurement unit of this indicator is [€/month/inhabitant].
3.4.1.4 Waste management cost per metric ton of managed waste The specific waste management cost per metric ton of municipal solid waste managed is calculated as the total waste management cost divided by the metric tons of managed municipal solid waste in a
52
An Integrated Assessment Scheme for Solid Waste Management in Low and Middle-Income Countries _____________________________________________________________________________________________
specific scenario. This indicator is specifically linked to the adopted waste management strategies and technologies. So, in this way, it is possible to underline the real economic value of a specific set of technologies selected in a proposed scenario. The measurement unit of this indicator is [€/metric ton of treated waste].
3.4.2 Social dimension Social dimension has constantly received poor attention as concerns the evaluation of solid waste management systems in developed countries, and consequently even less in developing countries. As stated by Wilson [23], technical, economic and environmental aspects were always come before the social dimension. In fact, this aspect was not deeply studied during the past, but started to be considered and evaluated from 2005. However, studies and theories about social capital [24] were firstly developed approximately since the first half of the 80s, but just in developed countries. As aforementioned in Chapter 1 and 2, the interest and awareness concerning the social dimension linked to solid waste management was developed and enhanced after the definition of the Integrated Sustainable Waste Management (ISWM) in developing countries [1, 2]. Consequently, starting from 2005, new approaches for the evaluation of the social dimension were implemented. In particular Social Impact Assessment (SIA) and Social Life Cycle Analysis (S-LCA) represent the new strategies that were originated by already existing tools/methods such as Environmental Impact Assessment (EIA) and Life Cycle Assessment (LCA) for the environmental impact evaluation. The social capital evaluation has been applied in different fields, due to its broad definition composed by various social aspects that can influence different economic, political and social phenomena [24]. However, in the waste management field, this evaluation method was poorly considered. The scientific literature reports three main social capital definitions, as following reported:
- James Coleman theory [24], named “The functional Approach” states that "Social Capital is not a single entity but a variety of different entities, with two elements in common: they all consist of some aspect of social aspect of social structure, and they facilitate certain actions of actors, whether persons or corporate actors, within the structure. The function identified by the concept of “social capital” is the value of these aspects of social structure to actors as resources that they can use to achieve their interest”. In particular for Coleman [24], obligations and expectations, trust, information, norms and penalties, relational authorities, social organization and social network are the main items that compose the social capital theory.
- Pierre Bourdieu theory [24] states that “Social Capital is defined by the aggregate of actual and potential resources which are linked to the possession of a durable network of more or less institutionalized relationships of mutual acquaintance or recognition; or in other word, linked to the belonging to a group, and defined as agents who are not only endowed with common proprieties, but are also united by permanent and useful connections”
- Robert Putnam theory [24] named “The rise of Social Capital” states that “Social capital is featured by social organization as network, norms, and social trust that facilitate coordination and cooperation for mutual benefits”.
53
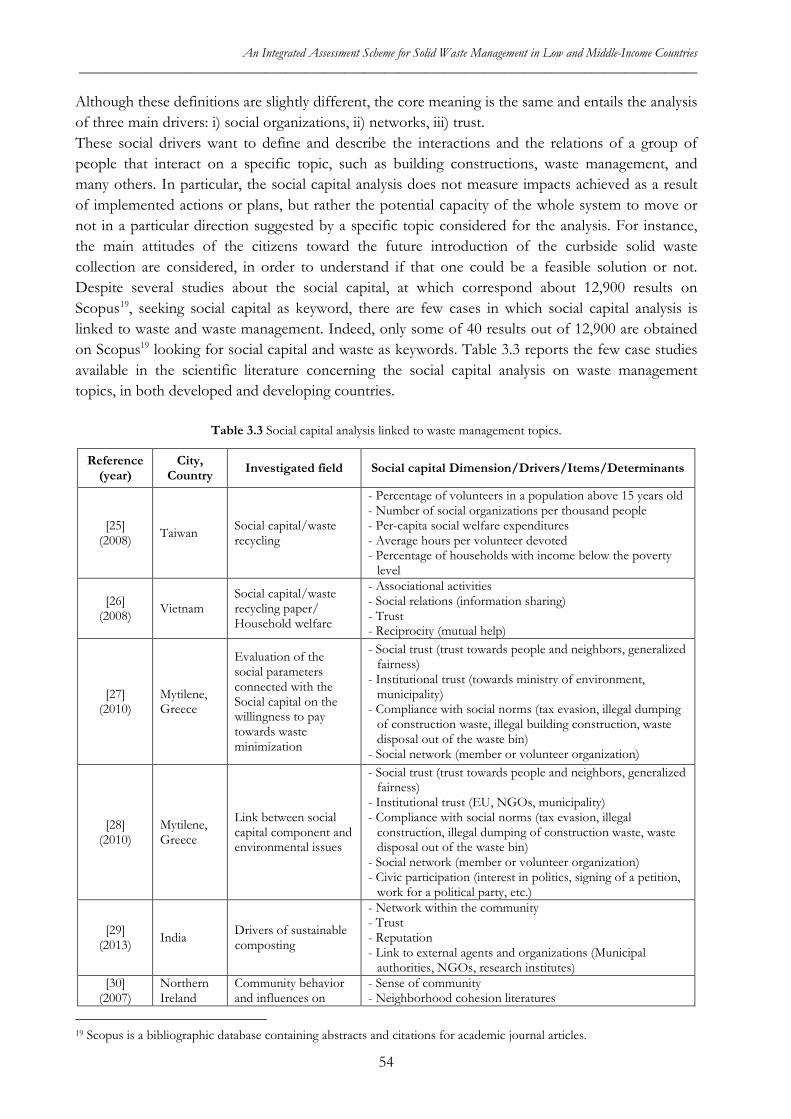
An Integrated Assessment Scheme for Solid Waste Management in Low and Middle-Income Countries _____________________________________________________________________________________________
Although these definitions are slightly different, the core meaning is the same and entails the analysis of three main drivers: i) social organizations, ii) networks, iii) trust. These social drivers want to define and describe the interactions and the relations of a group of people that interact on a specific topic, such as building constructions, waste management, and many others. In particular, the social capital analysis does not measure impacts achieved as a result of implemented actions or plans, but rather the potential capacity of the whole system to move or not in a particular direction suggested by a specific topic considered for the analysis. For instance, the main attitudes of the citizens toward the future introduction of the curbside solid waste collection are considered, in order to understand if that one could be a feasible solution or not. Despite several studies about the social capital, at which correspond about 12,900 results on Scopus19, seeking social capital as keyword, there are few cases in which social capital analysis is linked to waste and waste management. Indeed, only some of 40 results out of 12,900 are obtained on Scopus19 looking for social capital and waste as keywords. Table 3.3 reports the few case studies available in the scientific literature concerning the social capital analysis on waste management topics, in both developed and developing countries.
Table 3.3 Social capital analysis linked to waste management topics.
Reference (year)
City, Country Investigated field Social capital Dimension/Drivers/Items/Determinants
[25] (2008) Taiwan Social capital/waste
recycling
- Percentage of volunteers in a population above 15 years old - Number of social organizations per thousand people - Per-capita social welfare expenditures - Average hours per volunteer devoted - Percentage of households with income below the poverty
level
[26] (2008) Vietnam
Social capital/waste recycling paper/ Household welfare
- Associational activities - Social relations (information sharing) - Trust - Reciprocity (mutual help)
[27] (2010)
Mytilene, Greece
Evaluation of the social parameters connected with the Social capital on the willingness to pay towards waste minimization
- Social trust (trust towards people and neighbors, generalized fairness)
- Institutional trust (towards ministry of environment, municipality)
- Compliance with social norms (tax evasion, illegal dumping of construction waste, illegal building construction, waste disposal out of the waste bin)
- Social network (member or volunteer organization)
[28] (2010)
Mytilene, Greece
Link between social capital component and environmental issues
- Social trust (trust towards people and neighbors, generalized fairness)
- Institutional trust (EU, NGOs, municipality) - Compliance with social norms (tax evasion, illegal
construction, illegal dumping of construction waste, waste disposal out of the waste bin)
- Social network (member or volunteer organization) - Civic participation (interest in politics, signing of a petition,
work for a political party, etc.)
[29] (2013) India Drivers of sustainable
composting
- Network within the community - Trust - Reputation - Link to external agents and organizations (Municipal
authorities, NGOs, research institutes) [30]
(2007) Northern Ireland
Community behavior and influences on
- Sense of community - Neighborhood cohesion literatures
19 Scopus is a bibliographic database containing abstracts and citations for academic journal articles.
54
An Integrated Assessment Scheme for Solid Waste Management in Low and Middle-Income Countries _____________________________________________________________________________________________
curbside waste collection
- Level of community trust - Level of community interdependence - Level of community connection - Level of community solidarity
[31, 32, 33] (2004,
2007, 2002)
Developing Countries
Measuring Social Capital (Waste management and other different topics)
- Groups and Networks - Trust and Solidarity - Collective action and cooperation - Information and communication - Social cohesion and Inclusion - Empowerment and political action
Table 3.3 points out that all social capital analyses about solid waste management were approximately carried out in the last 10 years, underlying the little interest about the social dimension interlinked with the waste sector. In particular, in the most cases reported in Table 3.3, social organizations, networks and trust were the typical three main drivers used to analyze the case study. Globally, all the case studies implemented the social capital analysis using questionnaires specifically tailored on the groups of people, stakeholders and contexts. In particular, questionnaires were divided in two main parts: the first one in order to collect specific personal data and information about the interviewed people (e.g., age, gender, etc.); as concerns the second one, each question was evaluated through a Likert scale (e.g. 1-5, or 1-10) in order to define a total score at which corresponds the final evaluation. However, in some cases, authors performed a statistical analysis to understand how data and information collected in the first group of questions can influence the results achieved with the second group of questions. In this way, it has been possible to calculate the final social capital value. The social capital analysis wants to understand the habits, attitudes, behaviors, roles and networks between different groups of stakeholders, such as citizens, institutions, NGOs, CBOs, and so on. This analysis takes into account the specific context, specific events, circumstances and strategies that are happening in a certain moment, or future proposals to implement in that context, highlighting consequently possible positive or negative influences into the involved stakeholders. In particular, regarding the waste management practices, people who believe important to separate wastes and carry out the waste separation, people who do not indiscriminately dump wastes along the streets and people who comply with norms and pay regularly the taxes, represent all together crucial behaviors and attitudes that enhance the social capital, pointing out the trust in the institutions, civic and social participation in the community. Social Impact Assessment (SIA) [34] and Social Life Cycle Analysis (SLCA) [35] are two quite new tools/methods used for the evaluation of the social dimension. In particular, their use and implementation takes place from the Environmental Impact Assessment (EIA) and Life Cycle Assessment (LCA) approaches used for the evaluation of the environmental dimension, especially linked to the waste management technologies. The SIA is a methodology used to evaluate the social effects produced by the implementation of infrastructures, projects and many other types of interventions, such as waste management practices. Moreover, SIA could be used to assess or estimate the social consequences that are likely to be followed by specific policy actions, including programs and the adoption of new policies, and specific government actions [34]. This methodology considers different categories/social impact assessment variables, as reported in Table 3.4. Obviously, these variables are only intended to provide a starting point for the social assessor.
55
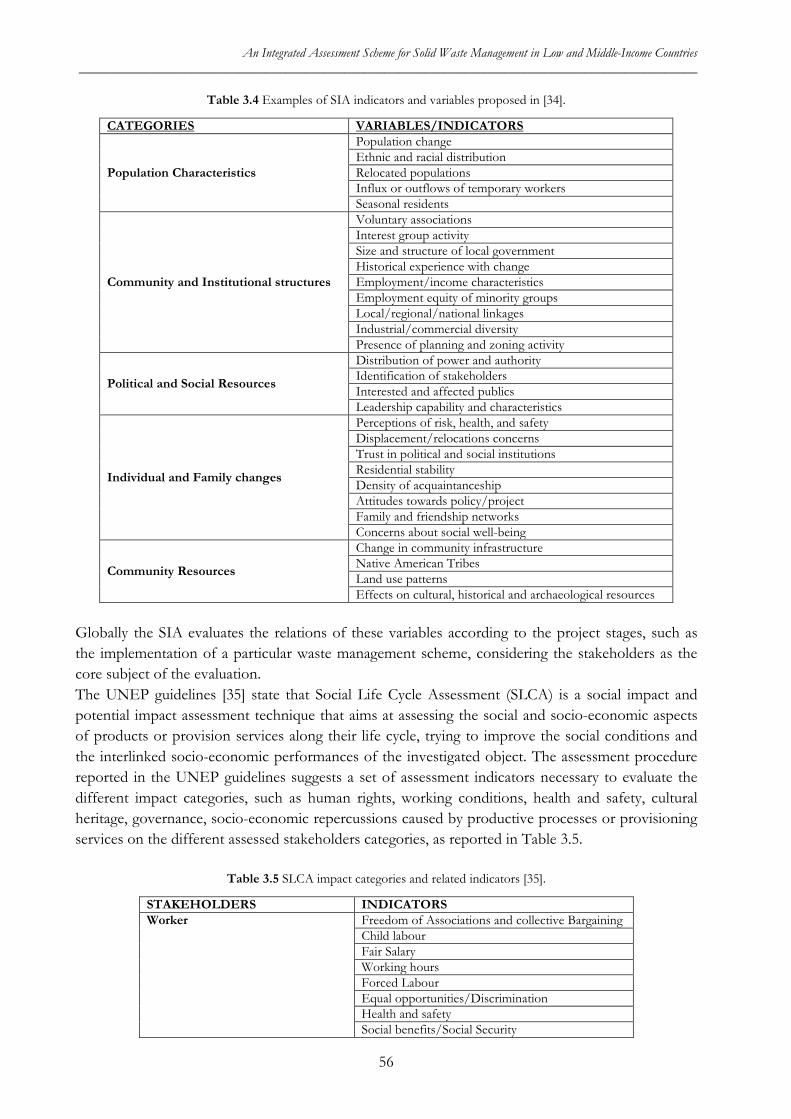
An Integrated Assessment Scheme for Solid Waste Management in Low and Middle-Income Countries _____________________________________________________________________________________________
Table 3.4 Examples of SIA indicators and variables proposed in [34].
CATEGORIES VARIABLES/INDICATORS
Population Characteristics
Population change Ethnic and racial distribution Relocated populations Influx or outflows of temporary workers Seasonal residents
Community and Institutional structures
Voluntary associations Interest group activity Size and structure of local government Historical experience with change Employment/income characteristics Employment equity of minority groups Local/regional/national linkages Industrial/commercial diversity Presence of planning and zoning activity
Political and Social Resources
Distribution of power and authority Identification of stakeholders Interested and affected publics Leadership capability and characteristics
Individual and Family changes
Perceptions of risk, health, and safety Displacement/relocations concerns Trust in political and social institutions Residential stability Density of acquaintanceship Attitudes towards policy/project Family and friendship networks Concerns about social well-being
Community Resources
Change in community infrastructure Native American Tribes Land use patterns Effects on cultural, historical and archaeological resources
Globally the SIA evaluates the relations of these variables according to the project stages, such as the implementation of a particular waste management scheme, considering the stakeholders as the core subject of the evaluation. The UNEP guidelines [35] state that Social Life Cycle Assessment (SLCA) is a social impact and potential impact assessment technique that aims at assessing the social and socio-economic aspects of products or provision services along their life cycle, trying to improve the social conditions and the interlinked socio-economic performances of the investigated object. The assessment procedure reported in the UNEP guidelines suggests a set of assessment indicators necessary to evaluate the different impact categories, such as human rights, working conditions, health and safety, cultural heritage, governance, socio-economic repercussions caused by productive processes or provisioning services on the different assessed stakeholders categories, as reported in Table 3.5.
Table 3.5 SLCA impact categories and related indicators [35].
STAKEHOLDERS INDICATORS Worker Freedom of Associations and collective Bargaining
Child labour Fair Salary Working hours Forced Labour Equal opportunities/Discrimination Health and safety Social benefits/Social Security
56
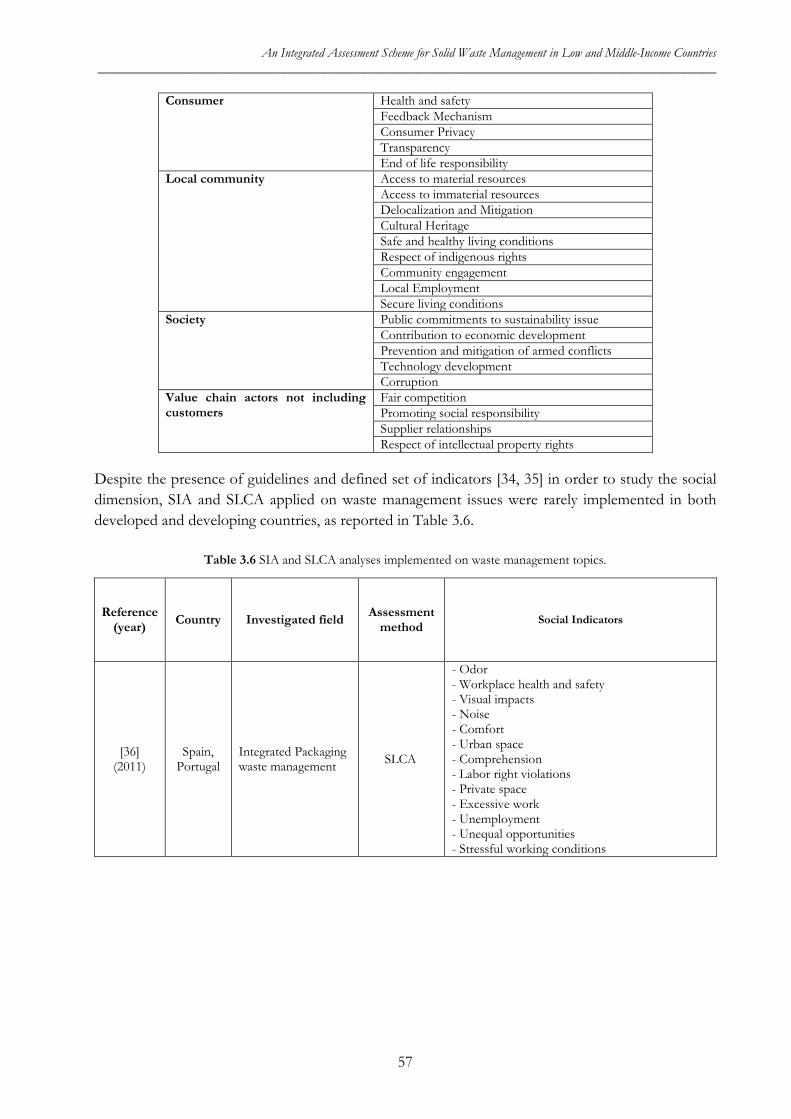
An Integrated Assessment Scheme for Solid Waste Management in Low and Middle-Income Countries _____________________________________________________________________________________________
Consumer Health and safety Feedback Mechanism Consumer Privacy Transparency End of life responsibility
Local community Access to material resources Access to immaterial resources Delocalization and Mitigation Cultural Heritage Safe and healthy living conditions Respect of indigenous rights Community engagement Local Employment Secure living conditions
Society Public commitments to sustainability issue Contribution to economic development Prevention and mitigation of armed conflicts Technology development Corruption
Value chain actors not including customers
Fair competition Promoting social responsibility Supplier relationships Respect of intellectual property rights
Despite the presence of guidelines and defined set of indicators [34, 35] in order to study the social dimension, SIA and SLCA applied on waste management issues were rarely implemented in both developed and developing countries, as reported in Table 3.6.
Table 3.6 SIA and SLCA analyses implemented on waste management topics.
Reference (year) Country Investigated field Assessment
method Social Indicators
[36] (2011)
Spain, Portugal
Integrated Packaging waste management SLCA
- Odor - Workplace health and safety - Visual impacts - Noise - Comfort - Urban space - Comprehension - Labor right violations - Private space - Excessive work - Unemployment - Unequal opportunities - Stressful working conditions
57
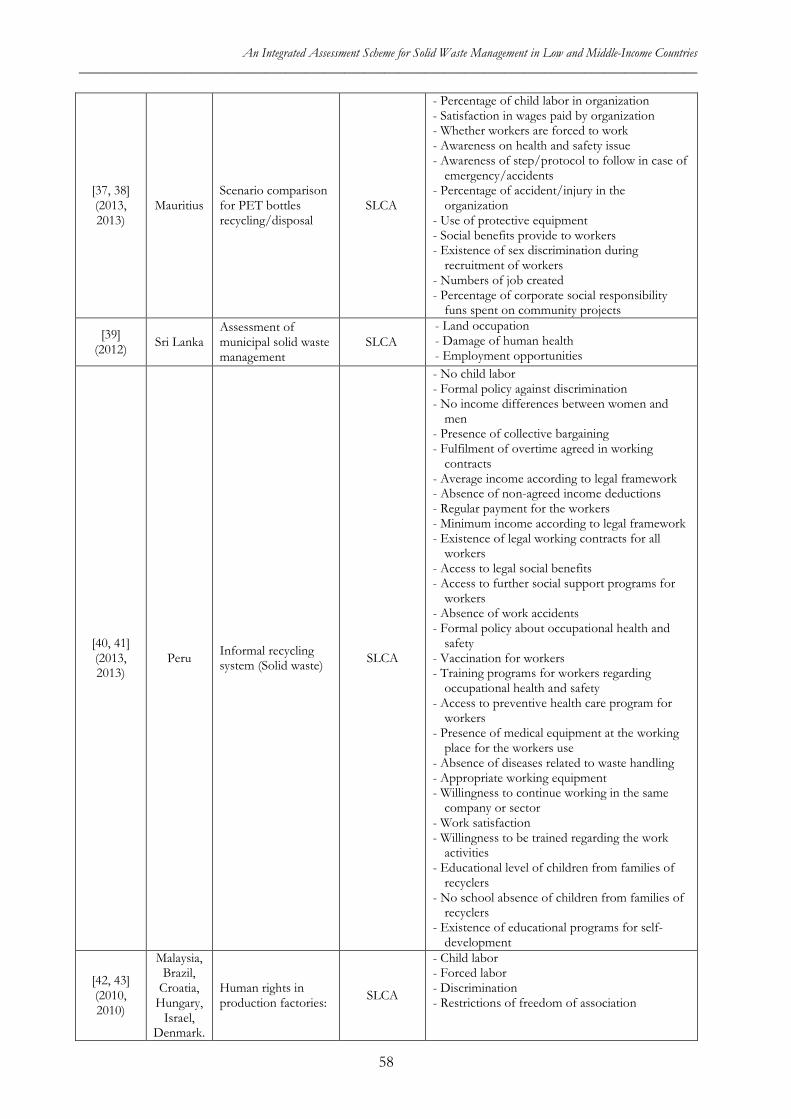
An Integrated Assessment Scheme for Solid Waste Management in Low and Middle-Income Countries _____________________________________________________________________________________________
[37, 38] (2013, 2013)
Mauritius Scenario comparison for PET bottles recycling/disposal
SLCA
- Percentage of child labor in organization - Satisfaction in wages paid by organization - Whether workers are forced to work - Awareness on health and safety issue - Awareness of step/protocol to follow in case of
emergency/accidents - Percentage of accident/injury in the
organization - Use of protective equipment - Social benefits provide to workers - Existence of sex discrimination during
recruitment of workers - Numbers of job created - Percentage of corporate social responsibility
funs spent on community projects
[39] (2012) Sri Lanka
Assessment of municipal solid waste management
SLCA - Land occupation - Damage of human health - Employment opportunities
[40, 41] (2013, 2013)
Peru Informal recycling system (Solid waste) SLCA
- No child labor - Formal policy against discrimination - No income differences between women and
men - Presence of collective bargaining - Fulfilment of overtime agreed in working
contracts - Average income according to legal framework - Absence of non-agreed income deductions - Regular payment for the workers - Minimum income according to legal framework - Existence of legal working contracts for all
workers - Access to legal social benefits - Access to further social support programs for
workers - Absence of work accidents - Formal policy about occupational health and
safety - Vaccination for workers - Training programs for workers regarding
occupational health and safety - Access to preventive health care program for
workers - Presence of medical equipment at the working
place for the workers use - Absence of diseases related to waste handling - Appropriate working equipment - Willingness to continue working in the same
company or sector - Work satisfaction - Willingness to be trained regarding the work
activities - Educational level of children from families of
recyclers - No school absence of children from families of
recyclers - Existence of educational programs for self-
development
[42, 43] (2010, 2010)
Malaysia, Brazil,
Croatia, Hungary,
Israel, Denmark.
Human rights in production factories: SLCA
- Child labor - Forced labor - Discrimination - Restrictions of freedom of association
58
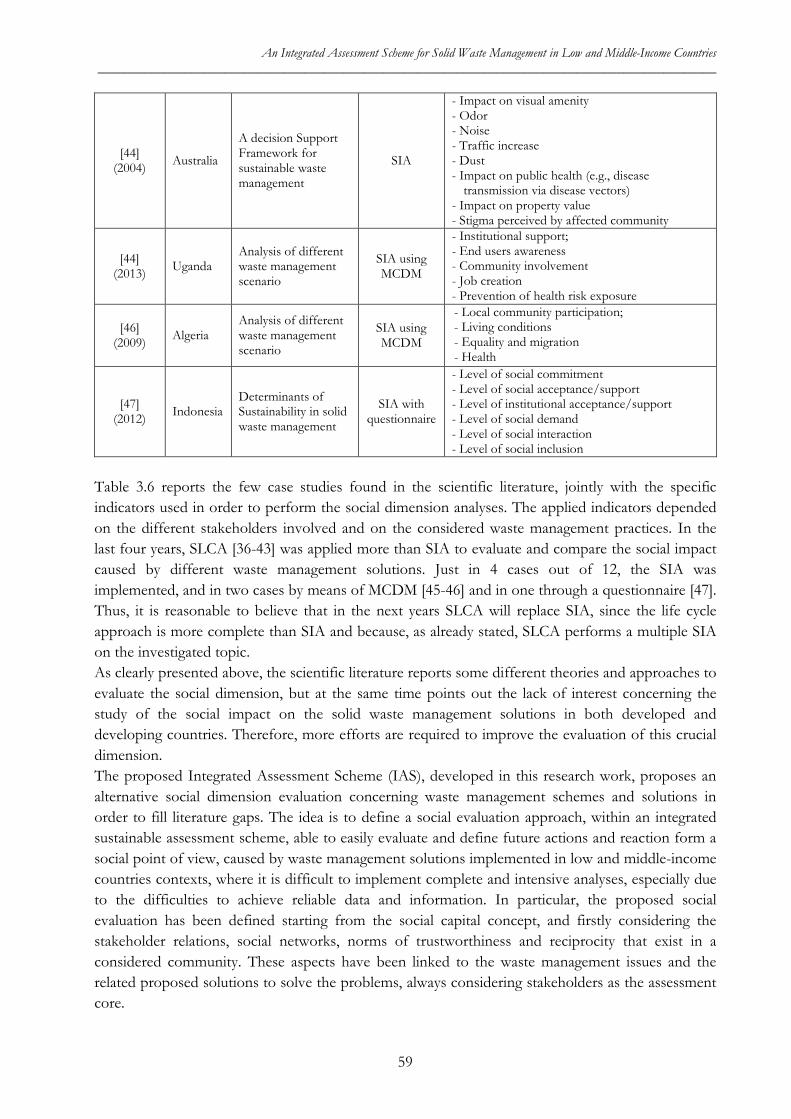
An Integrated Assessment Scheme for Solid Waste Management in Low and Middle-Income Countries _____________________________________________________________________________________________
[44] (2004) Australia
A decision Support Framework for sustainable waste management
SIA
- Impact on visual amenity - Odor - Noise - Traffic increase - Dust - Impact on public health (e.g., disease
transmission via disease vectors) - Impact on property value - Stigma perceived by affected community
[44] (2013) Uganda
Analysis of different waste management scenario
SIA using MCDM
- Institutional support; - End users awareness - Community involvement - Job creation - Prevention of health risk exposure
[46] (2009) Algeria
Analysis of different waste management scenario
SIA using MCDM
- Local community participation; - Living conditions - Equality and migration - Health
[47] (2012) Indonesia
Determinants of Sustainability in solid waste management
SIA with questionnaire
- Level of social commitment - Level of social acceptance/support - Level of institutional acceptance/support - Level of social demand - Level of social interaction - Level of social inclusion
Table 3.6 reports the few case studies found in the scientific literature, jointly with the specific indicators used in order to perform the social dimension analyses. The applied indicators depended on the different stakeholders involved and on the considered waste management practices. In the last four years, SLCA [36-43] was applied more than SIA to evaluate and compare the social impact caused by different waste management solutions. Just in 4 cases out of 12, the SIA was implemented, and in two cases by means of MCDM [45-46] and in one through a questionnaire [47]. Thus, it is reasonable to believe that in the next years SLCA will replace SIA, since the life cycle approach is more complete than SIA and because, as already stated, SLCA performs a multiple SIA on the investigated topic. As clearly presented above, the scientific literature reports some different theories and approaches to evaluate the social dimension, but at the same time points out the lack of interest concerning the study of the social impact on the solid waste management solutions in both developed and developing countries. Therefore, more efforts are required to improve the evaluation of this crucial dimension. The proposed Integrated Assessment Scheme (IAS), developed in this research work, proposes an alternative social dimension evaluation concerning waste management schemes and solutions in order to fill literature gaps. The idea is to define a social evaluation approach, within an integrated sustainable assessment scheme, able to easily evaluate and define future actions and reaction form a social point of view, caused by waste management solutions implemented in low and middle-income countries contexts, where it is difficult to implement complete and intensive analyses, especially due to the difficulties to achieve reliable data and information. In particular, the proposed social evaluation has been defined starting from the social capital concept, and firstly considering the stakeholder relations, social networks, norms of trustworthiness and reciprocity that exist in a considered community. These aspects have been linked to the waste management issues and the related proposed solutions to solve the problems, always considering stakeholders as the assessment core.
59
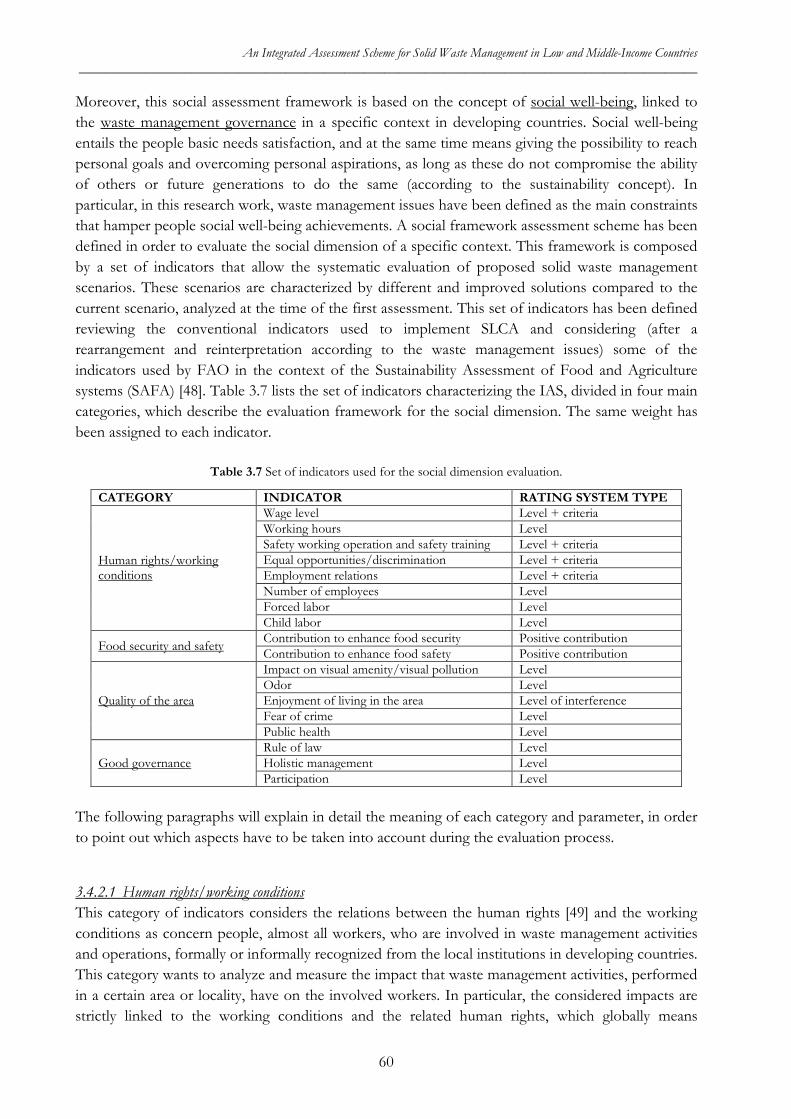
An Integrated Assessment Scheme for Solid Waste Management in Low and Middle-Income Countries _____________________________________________________________________________________________
Moreover, this social assessment framework is based on the concept of social well-being, linked to the waste management governance in a specific context in developing countries. Social well-being entails the people basic needs satisfaction, and at the same time means giving the possibility to reach personal goals and overcoming personal aspirations, as long as these do not compromise the ability of others or future generations to do the same (according to the sustainability concept). In particular, in this research work, waste management issues have been defined as the main constraints that hamper people social well-being achievements. A social framework assessment scheme has been defined in order to evaluate the social dimension of a specific context. This framework is composed by a set of indicators that allow the systematic evaluation of proposed solid waste management scenarios. These scenarios are characterized by different and improved solutions compared to the current scenario, analyzed at the time of the first assessment. This set of indicators has been defined reviewing the conventional indicators used to implement SLCA and considering (after a rearrangement and reinterpretation according to the waste management issues) some of the indicators used by FAO in the context of the Sustainability Assessment of Food and Agriculture systems (SAFA) [48]. Table 3.7 lists the set of indicators characterizing the IAS, divided in four main categories, which describe the evaluation framework for the social dimension. The same weight has been assigned to each indicator.
Table 3.7 Set of indicators used for the social dimension evaluation.
CATEGORY INDICATOR RATING SYSTEM TYPE
Human rights/working conditions
Wage level Level + criteria Working hours Level Safety working operation and safety training Level + criteria Equal opportunities/discrimination Level + criteria Employment relations Level + criteria Number of employees Level Forced labor Level Child labor Level
Food security and safety Contribution to enhance food security Positive contribution Contribution to enhance food safety Positive contribution
Quality of the area
Impact on visual amenity/visual pollution Level Odor Level Enjoyment of living in the area Level of interference Fear of crime Level Public health Level
Good governance Rule of law Level Holistic management Level Participation Level
The following paragraphs will explain in detail the meaning of each category and parameter, in order to point out which aspects have to be taken into account during the evaluation process.
3.4.2.1 Human rights/working conditions This category of indicators considers the relations between the human rights [49] and the working conditions as concern people, almost all workers, who are involved in waste management activities and operations, formally or informally recognized from the local institutions in developing countries. This category wants to analyze and measure the impact that waste management activities, performed in a certain area or locality, have on the involved workers. In particular, the considered impacts are strictly linked to the working conditions and the related human rights, which globally means
60
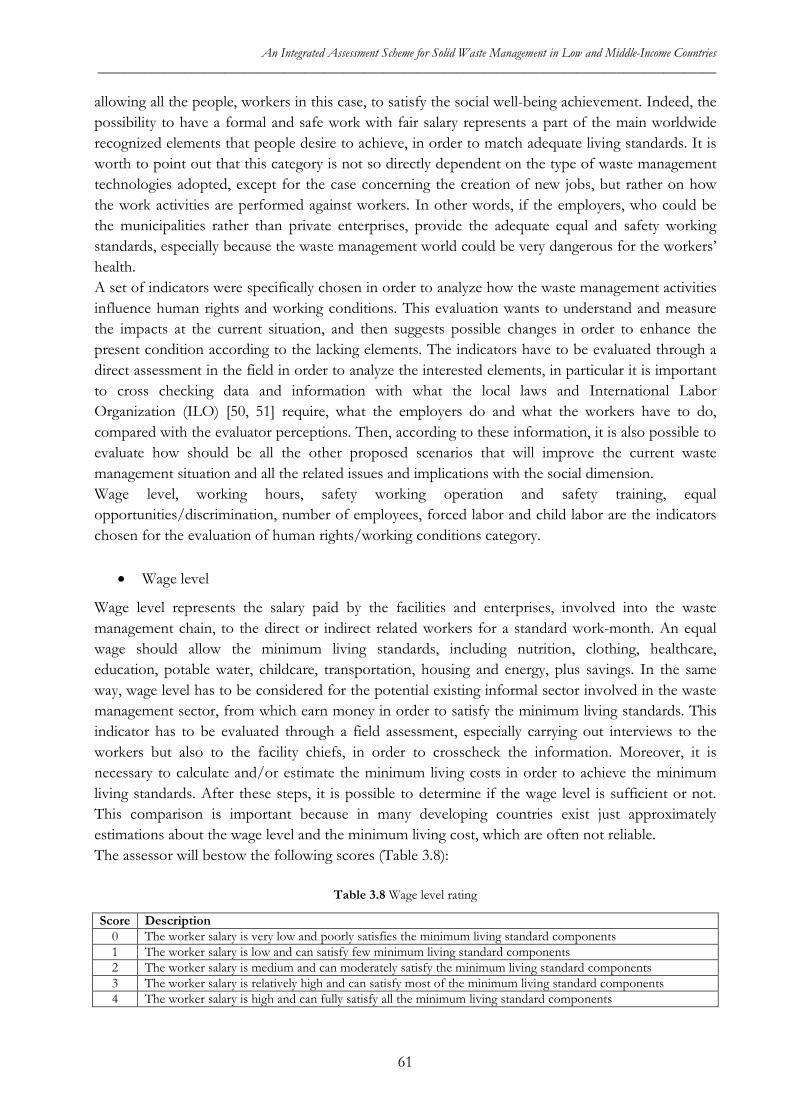
An Integrated Assessment Scheme for Solid Waste Management in Low and Middle-Income Countries _____________________________________________________________________________________________
allowing all the people, workers in this case, to satisfy the social well-being achievement. Indeed, the possibility to have a formal and safe work with fair salary represents a part of the main worldwide recognized elements that people desire to achieve, in order to match adequate living standards. It is worth to point out that this category is not so directly dependent on the type of waste management technologies adopted, except for the case concerning the creation of new jobs, but rather on how the work activities are performed against workers. In other words, if the employers, who could be the municipalities rather than private enterprises, provide the adequate equal and safety working standards, especially because the waste management world could be very dangerous for the workers’ health. A set of indicators were specifically chosen in order to analyze how the waste management activities influence human rights and working conditions. This evaluation wants to understand and measure the impacts at the current situation, and then suggests possible changes in order to enhance the present condition according to the lacking elements. The indicators have to be evaluated through a direct assessment in the field in order to analyze the interested elements, in particular it is important to cross checking data and information with what the local laws and International Labor Organization (ILO) [50, 51] require, what the employers do and what the workers have to do, compared with the evaluator perceptions. Then, according to these information, it is also possible to evaluate how should be all the other proposed scenarios that will improve the current waste management situation and all the related issues and implications with the social dimension. Wage level, working hours, safety working operation and safety training, equal opportunities/discrimination, number of employees, forced labor and child labor are the indicators chosen for the evaluation of human rights/working conditions category.
• Wage level
Wage level represents the salary paid by the facilities and enterprises, involved into the waste management chain, to the direct or indirect related workers for a standard work-month. An equal wage should allow the minimum living standards, including nutrition, clothing, healthcare, education, potable water, childcare, transportation, housing and energy, plus savings. In the same way, wage level has to be considered for the potential existing informal sector involved in the waste management sector, from which earn money in order to satisfy the minimum living standards. This indicator has to be evaluated through a field assessment, especially carrying out interviews to the workers but also to the facility chiefs, in order to crosscheck the information. Moreover, it is necessary to calculate and/or estimate the minimum living costs in order to achieve the minimum living standards. After these steps, it is possible to determine if the wage level is sufficient or not. This comparison is important because in many developing countries exist just approximately estimations about the wage level and the minimum living cost, which are often not reliable. The assessor will bestow the following scores (Table 3.8):
Table 3.8 Wage level rating
Score Description 0 The worker salary is very low and poorly satisfies the minimum living standard components 1 The worker salary is low and can satisfy few minimum living standard components 2 The worker salary is medium and can moderately satisfy the minimum living standard components 3 The worker salary is relatively high and can satisfy most of the minimum living standard components 4 The worker salary is high and can fully satisfy all the minimum living standard components
61
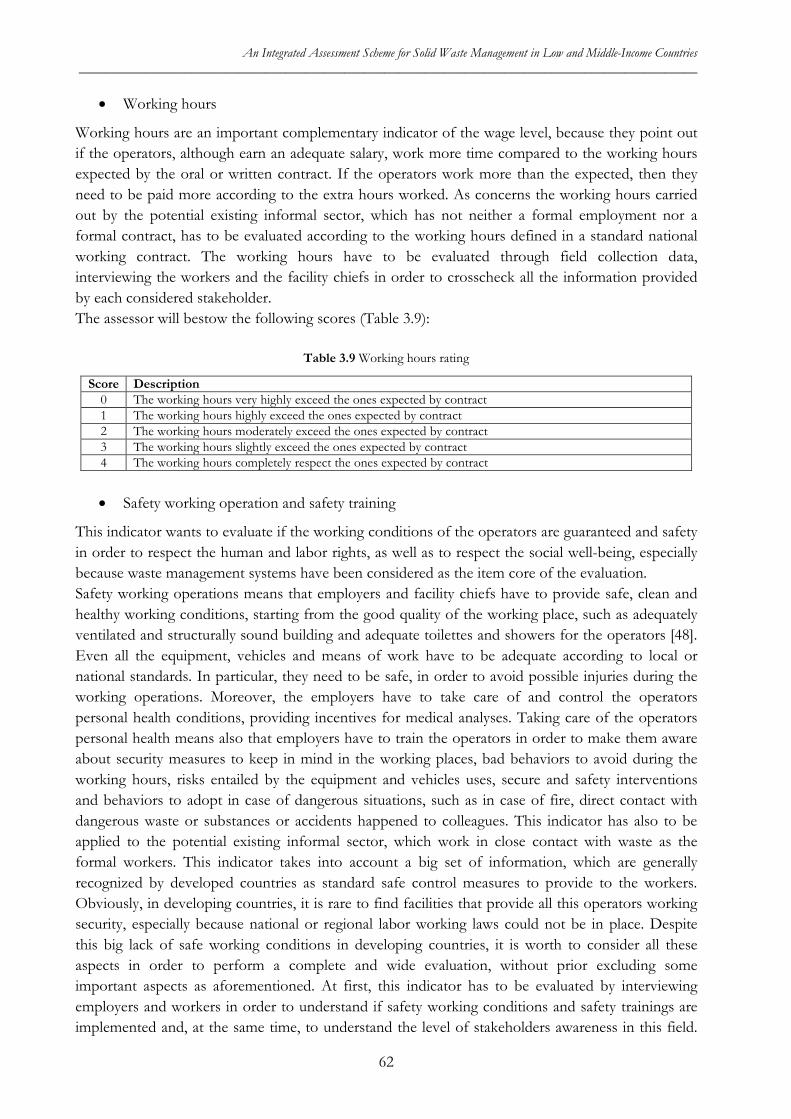
An Integrated Assessment Scheme for Solid Waste Management in Low and Middle-Income Countries _____________________________________________________________________________________________
• Working hours
Working hours are an important complementary indicator of the wage level, because they point out if the operators, although earn an adequate salary, work more time compared to the working hours expected by the oral or written contract. If the operators work more than the expected, then they need to be paid more according to the extra hours worked. As concerns the working hours carried out by the potential existing informal sector, which has not neither a formal employment nor a formal contract, has to be evaluated according to the working hours defined in a standard national working contract. The working hours have to be evaluated through field collection data, interviewing the workers and the facility chiefs in order to crosscheck all the information provided by each considered stakeholder. The assessor will bestow the following scores (Table 3.9):
Table 3.9 Working hours rating
Score Description 0 The working hours very highly exceed the ones expected by contract 1 The working hours highly exceed the ones expected by contract 2 The working hours moderately exceed the ones expected by contract 3 The working hours slightly exceed the ones expected by contract 4 The working hours completely respect the ones expected by contract
• Safety working operation and safety training
This indicator wants to evaluate if the working conditions of the operators are guaranteed and safety in order to respect the human and labor rights, as well as to respect the social well-being, especially because waste management systems have been considered as the item core of the evaluation. Safety working operations means that employers and facility chiefs have to provide safe, clean and healthy working conditions, starting from the good quality of the working place, such as adequately ventilated and structurally sound building and adequate toilettes and showers for the operators [48]. Even all the equipment, vehicles and means of work have to be adequate according to local or national standards. In particular, they need to be safe, in order to avoid possible injuries during the working operations. Moreover, the employers have to take care of and control the operators personal health conditions, providing incentives for medical analyses. Taking care of the operators personal health means also that employers have to train the operators in order to make them aware about security measures to keep in mind in the working places, bad behaviors to avoid during the working hours, risks entailed by the equipment and vehicles uses, secure and safety interventions and behaviors to adopt in case of dangerous situations, such as in case of fire, direct contact with dangerous waste or substances or accidents happened to colleagues. This indicator has also to be applied to the potential existing informal sector, which work in close contact with waste as the formal workers. This indicator takes into account a big set of information, which are generally recognized by developed countries as standard safe control measures to provide to the workers. Obviously, in developing countries, it is rare to find facilities that provide all this operators working security, especially because national or regional labor working laws could not be in place. Despite this big lack of safe working conditions in developing countries, it is worth to consider all these aspects in order to perform a complete and wide evaluation, without prior excluding some important aspects as aforementioned. At first, this indicator has to be evaluated by interviewing employers and workers in order to understand if safety working conditions and safety trainings are implemented and, at the same time, to understand the level of stakeholders awareness in this field.
62
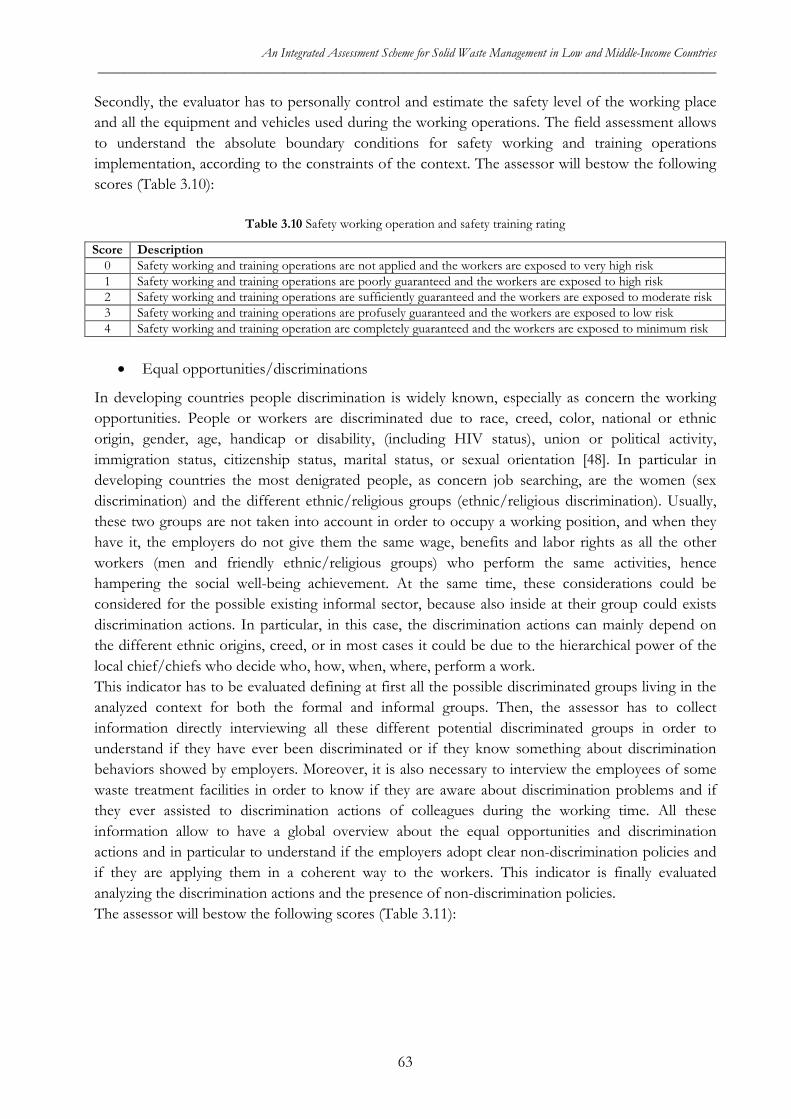
An Integrated Assessment Scheme for Solid Waste Management in Low and Middle-Income Countries _____________________________________________________________________________________________
Secondly, the evaluator has to personally control and estimate the safety level of the working place and all the equipment and vehicles used during the working operations. The field assessment allows to understand the absolute boundary conditions for safety working and training operations implementation, according to the constraints of the context. The assessor will bestow the following scores (Table 3.10):
Table 3.10 Safety working operation and safety training rating
Score Description 0 Safety working and training operations are not applied and the workers are exposed to very high risk 1 Safety working and training operations are poorly guaranteed and the workers are exposed to high risk 2 Safety working and training operations are sufficiently guaranteed and the workers are exposed to moderate risk 3 Safety working and training operations are profusely guaranteed and the workers are exposed to low risk 4 Safety working and training operation are completely guaranteed and the workers are exposed to minimum risk
• Equal opportunities/discriminations
In developing countries people discrimination is widely known, especially as concern the working opportunities. People or workers are discriminated due to race, creed, color, national or ethnic origin, gender, age, handicap or disability, (including HIV status), union or political activity, immigration status, citizenship status, marital status, or sexual orientation [48]. In particular in developing countries the most denigrated people, as concern job searching, are the women (sex discrimination) and the different ethnic/religious groups (ethnic/religious discrimination). Usually, these two groups are not taken into account in order to occupy a working position, and when they have it, the employers do not give them the same wage, benefits and labor rights as all the other workers (men and friendly ethnic/religious groups) who perform the same activities, hence hampering the social well-being achievement. At the same time, these considerations could be considered for the possible existing informal sector, because also inside at their group could exists discrimination actions. In particular, in this case, the discrimination actions can mainly depend on the different ethnic origins, creed, or in most cases it could be due to the hierarchical power of the local chief/chiefs who decide who, how, when, where, perform a work. This indicator has to be evaluated defining at first all the possible discriminated groups living in the analyzed context for both the formal and informal groups. Then, the assessor has to collect information directly interviewing all these different potential discriminated groups in order to understand if they have ever been discriminated or if they know something about discrimination behaviors showed by employers. Moreover, it is also necessary to interview the employees of some waste treatment facilities in order to know if they are aware about discrimination problems and if they ever assisted to discrimination actions of colleagues during the working time. All these information allow to have a global overview about the equal opportunities and discrimination actions and in particular to understand if the employers adopt clear non-discrimination policies and if they are applying them in a coherent way to the workers. This indicator is finally evaluated analyzing the discrimination actions and the presence of non-discrimination policies. The assessor will bestow the following scores (Table 3.11):
63
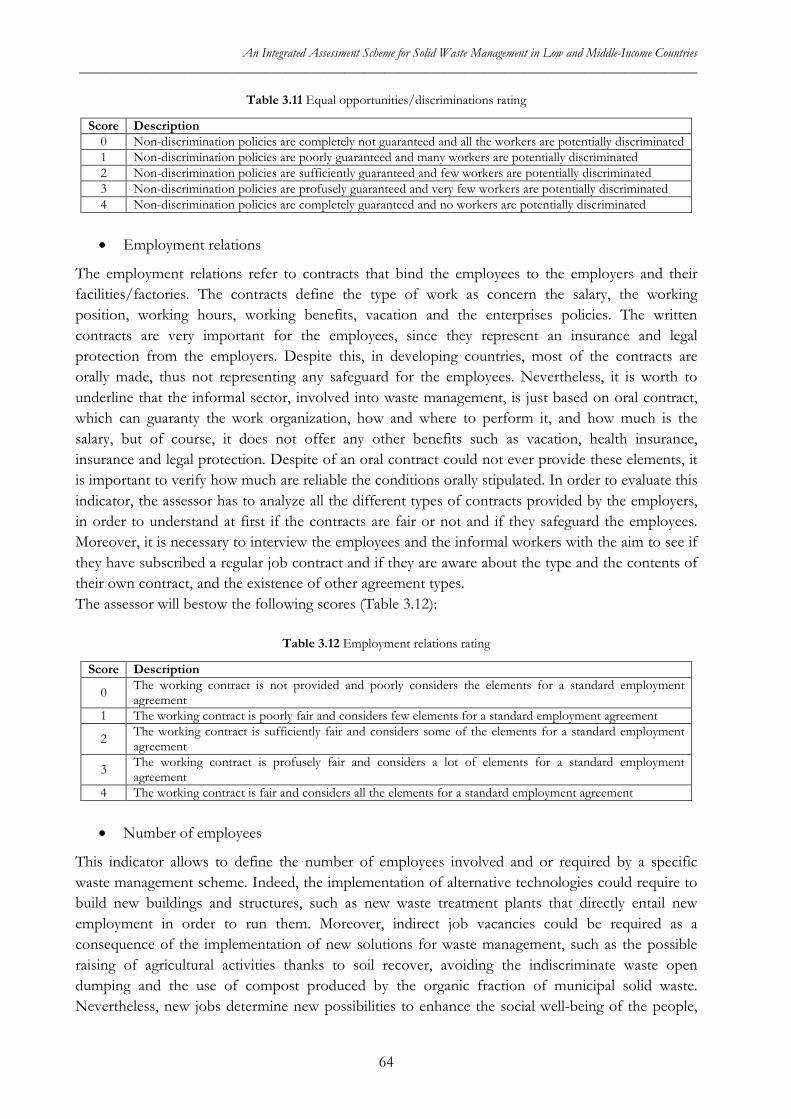
An Integrated Assessment Scheme for Solid Waste Management in Low and Middle-Income Countries _____________________________________________________________________________________________
Table 3.11 Equal opportunities/discriminations rating
Score Description 0 Non-discrimination policies are completely not guaranteed and all the workers are potentially discriminated 1 Non-discrimination policies are poorly guaranteed and many workers are potentially discriminated 2 Non-discrimination policies are sufficiently guaranteed and few workers are potentially discriminated 3 Non-discrimination policies are profusely guaranteed and very few workers are potentially discriminated 4 Non-discrimination policies are completely guaranteed and no workers are potentially discriminated
• Employment relations
The employment relations refer to contracts that bind the employees to the employers and their facilities/factories. The contracts define the type of work as concern the salary, the working position, working hours, working benefits, vacation and the enterprises policies. The written contracts are very important for the employees, since they represent an insurance and legal protection from the employers. Despite this, in developing countries, most of the contracts are orally made, thus not representing any safeguard for the employees. Nevertheless, it is worth to underline that the informal sector, involved into waste management, is just based on oral contract, which can guaranty the work organization, how and where to perform it, and how much is the salary, but of course, it does not offer any other benefits such as vacation, health insurance, insurance and legal protection. Despite of an oral contract could not ever provide these elements, it is important to verify how much are reliable the conditions orally stipulated. In order to evaluate this indicator, the assessor has to analyze all the different types of contracts provided by the employers, in order to understand at first if the contracts are fair or not and if they safeguard the employees. Moreover, it is necessary to interview the employees and the informal workers with the aim to see if they have subscribed a regular job contract and if they are aware about the type and the contents of their own contract, and the existence of other agreement types. The assessor will bestow the following scores (Table 3.12):
Table 3.12 Employment relations rating
Score Description
0 The working contract is not provided and poorly considers the elements for a standard employment agreement
1 The working contract is poorly fair and considers few elements for a standard employment agreement
2 The working contract is sufficiently fair and considers some of the elements for a standard employment agreement
3 The working contract is profusely fair and considers a lot of elements for a standard employment agreement
4 The working contract is fair and considers all the elements for a standard employment agreement
• Number of employees
This indicator allows to define the number of employees involved and or required by a specific waste management scheme. Indeed, the implementation of alternative technologies could require to build new buildings and structures, such as new waste treatment plants that directly entail new employment in order to run them. Moreover, indirect job vacancies could be required as a consequence of the implementation of new solutions for waste management, such as the possible raising of agricultural activities thanks to soil recover, avoiding the indiscriminate waste open dumping and the use of compost produced by the organic fraction of municipal solid waste. Nevertheless, new jobs determine new possibilities to enhance the social well-being of the people,
64
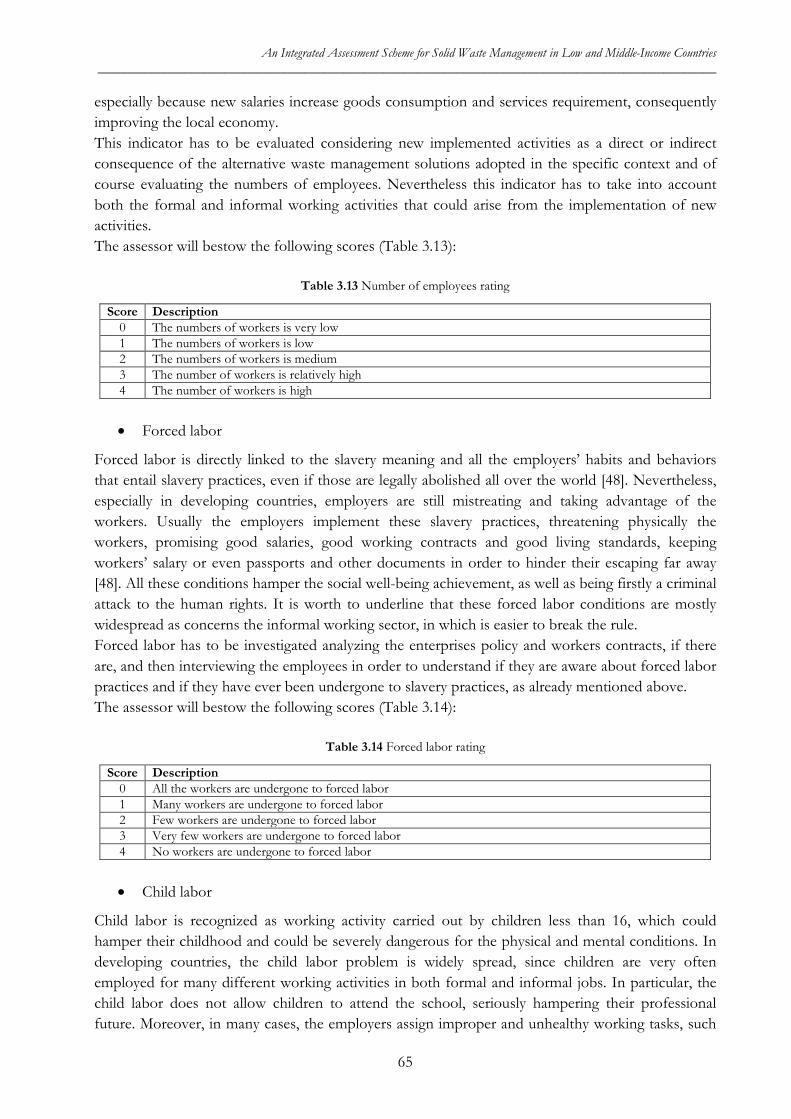
An Integrated Assessment Scheme for Solid Waste Management in Low and Middle-Income Countries _____________________________________________________________________________________________
especially because new salaries increase goods consumption and services requirement, consequently improving the local economy. This indicator has to be evaluated considering new implemented activities as a direct or indirect consequence of the alternative waste management solutions adopted in the specific context and of course evaluating the numbers of employees. Nevertheless this indicator has to take into account both the formal and informal working activities that could arise from the implementation of new activities. The assessor will bestow the following scores (Table 3.13):
Table 3.13 Number of employees rating
Score Description 0 The numbers of workers is very low 1 The numbers of workers is low 2 The numbers of workers is medium 3 The number of workers is relatively high 4 The number of workers is high
• Forced labor
Forced labor is directly linked to the slavery meaning and all the employers’ habits and behaviors that entail slavery practices, even if those are legally abolished all over the world [48]. Nevertheless, especially in developing countries, employers are still mistreating and taking advantage of the workers. Usually the employers implement these slavery practices, threatening physically the workers, promising good salaries, good working contracts and good living standards, keeping workers’ salary or even passports and other documents in order to hinder their escaping far away [48]. All these conditions hamper the social well-being achievement, as well as being firstly a criminal attack to the human rights. It is worth to underline that these forced labor conditions are mostly widespread as concerns the informal working sector, in which is easier to break the rule. Forced labor has to be investigated analyzing the enterprises policy and workers contracts, if there are, and then interviewing the employees in order to understand if they are aware about forced labor practices and if they have ever been undergone to slavery practices, as already mentioned above. The assessor will bestow the following scores (Table 3.14):
Table 3.14 Forced labor rating
Score Description 0 All the workers are undergone to forced labor 1 Many workers are undergone to forced labor 2 Few workers are undergone to forced labor 3 Very few workers are undergone to forced labor 4 No workers are undergone to forced labor
• Child labor
Child labor is recognized as working activity carried out by children less than 16, which could hamper their childhood and could be severely dangerous for the physical and mental conditions. In developing countries, the child labor problem is widely spread, since children are very often employed for many different working activities in both formal and informal jobs. In particular, the child labor does not allow children to attend the school, seriously hampering their professional future. Moreover, in many cases, the employers assign improper and unhealthy working tasks, such
65
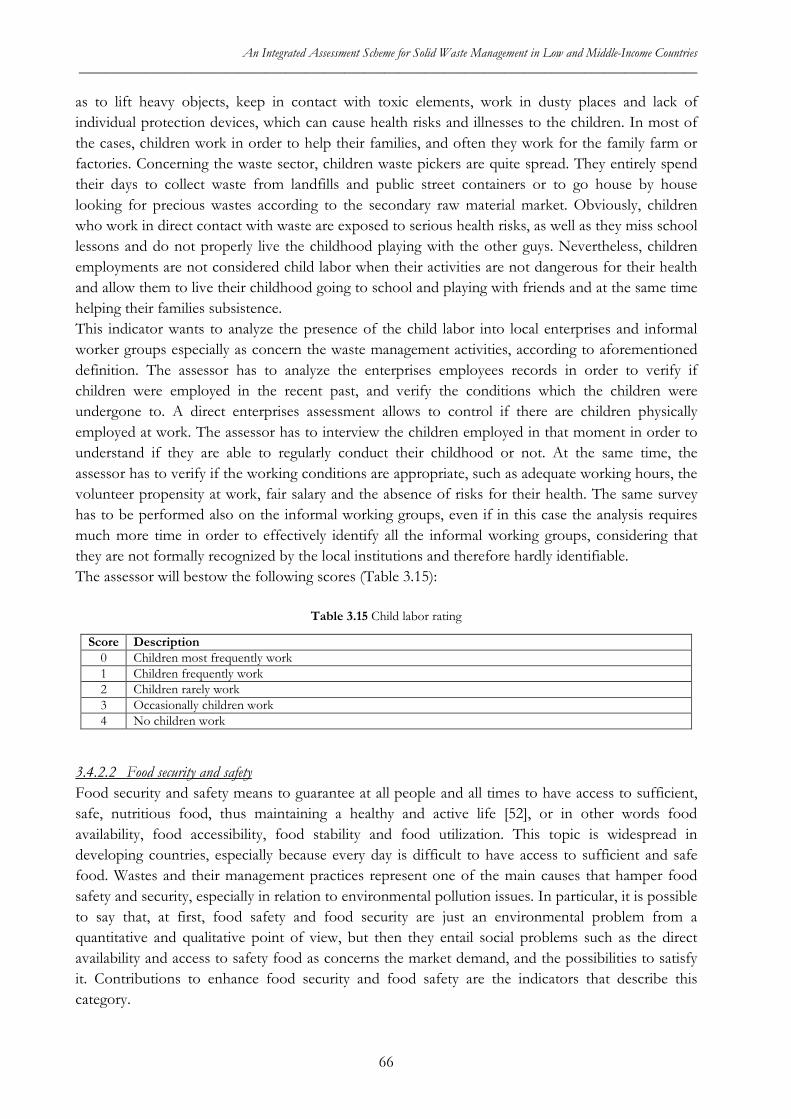
An Integrated Assessment Scheme for Solid Waste Management in Low and Middle-Income Countries _____________________________________________________________________________________________
as to lift heavy objects, keep in contact with toxic elements, work in dusty places and lack of individual protection devices, which can cause health risks and illnesses to the children. In most of the cases, children work in order to help their families, and often they work for the family farm or factories. Concerning the waste sector, children waste pickers are quite spread. They entirely spend their days to collect waste from landfills and public street containers or to go house by house looking for precious wastes according to the secondary raw material market. Obviously, children who work in direct contact with waste are exposed to serious health risks, as well as they miss school lessons and do not properly live the childhood playing with the other guys. Nevertheless, children employments are not considered child labor when their activities are not dangerous for their health and allow them to live their childhood going to school and playing with friends and at the same time helping their families subsistence. This indicator wants to analyze the presence of the child labor into local enterprises and informal worker groups especially as concern the waste management activities, according to aforementioned definition. The assessor has to analyze the enterprises employees records in order to verify if children were employed in the recent past, and verify the conditions which the children were undergone to. A direct enterprises assessment allows to control if there are children physically employed at work. The assessor has to interview the children employed in that moment in order to understand if they are able to regularly conduct their childhood or not. At the same time, the assessor has to verify if the working conditions are appropriate, such as adequate working hours, the volunteer propensity at work, fair salary and the absence of risks for their health. The same survey has to be performed also on the informal working groups, even if in this case the analysis requires much more time in order to effectively identify all the informal working groups, considering that they are not formally recognized by the local institutions and therefore hardly identifiable. The assessor will bestow the following scores (Table 3.15):
Table 3.15 Child labor rating
Score Description 0 Children most frequently work 1 Children frequently work 2 Children rarely work 3 Occasionally children work 4 No children work
3.4.2.2 Food security and safety Food security and safety means to guarantee at all people and all times to have access to sufficient, safe, nutritious food, thus maintaining a healthy and active life [52], or in other words food availability, food accessibility, food stability and food utilization. This topic is widespread in developing countries, especially because every day is difficult to have access to sufficient and safe food. Wastes and their management practices represent one of the main causes that hamper food safety and security, especially in relation to environmental pollution issues. In particular, it is possible to say that, at first, food safety and food security are just an environmental problem from a quantitative and qualitative point of view, but then they entail social problems such as the direct availability and access to safety food as concerns the market demand, and the possibilities to satisfy it. Contributions to enhance food security and food safety are the indicators that describe this category.
66
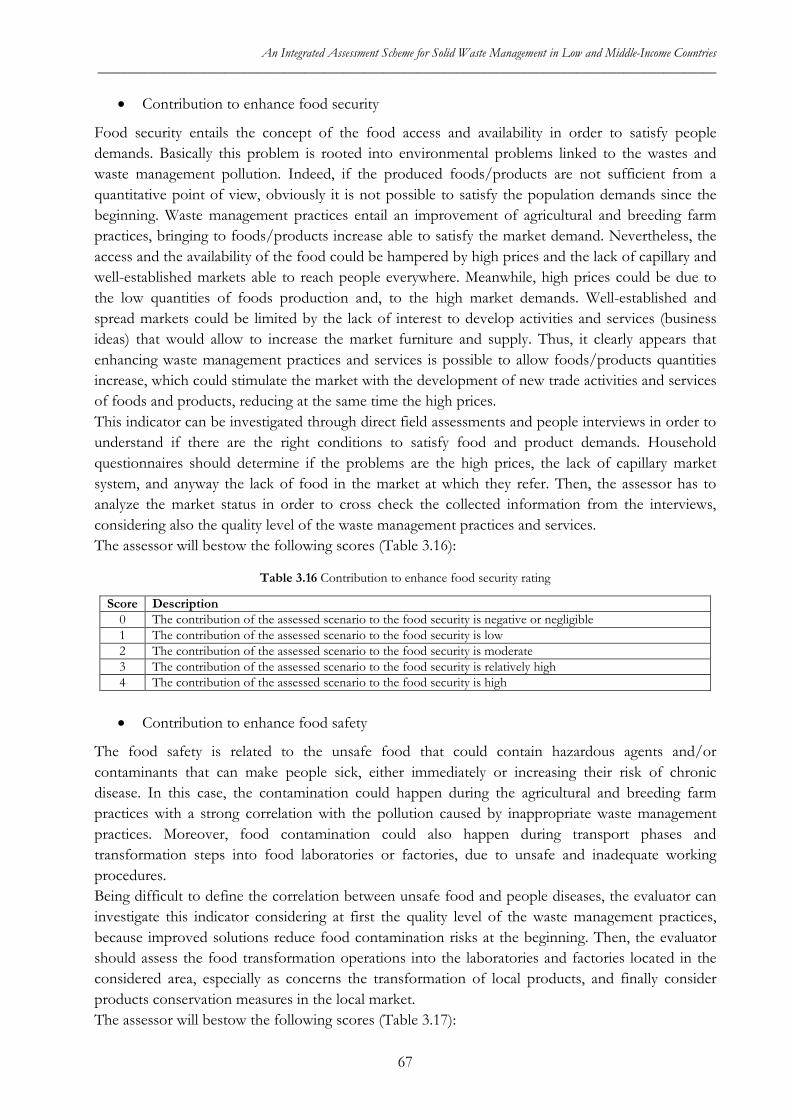
An Integrated Assessment Scheme for Solid Waste Management in Low and Middle-Income Countries _____________________________________________________________________________________________
• Contribution to enhance food security
Food security entails the concept of the food access and availability in order to satisfy people demands. Basically this problem is rooted into environmental problems linked to the wastes and waste management pollution. Indeed, if the produced foods/products are not sufficient from a quantitative point of view, obviously it is not possible to satisfy the population demands since the beginning. Waste management practices entail an improvement of agricultural and breeding farm practices, bringing to foods/products increase able to satisfy the market demand. Nevertheless, the access and the availability of the food could be hampered by high prices and the lack of capillary and well-established markets able to reach people everywhere. Meanwhile, high prices could be due to the low quantities of foods production and, to the high market demands. Well-established and spread markets could be limited by the lack of interest to develop activities and services (business ideas) that would allow to increase the market furniture and supply. Thus, it clearly appears that enhancing waste management practices and services is possible to allow foods/products quantities increase, which could stimulate the market with the development of new trade activities and services of foods and products, reducing at the same time the high prices. This indicator can be investigated through direct field assessments and people interviews in order to understand if there are the right conditions to satisfy food and product demands. Household questionnaires should determine if the problems are the high prices, the lack of capillary market system, and anyway the lack of food in the market at which they refer. Then, the assessor has to analyze the market status in order to cross check the collected information from the interviews, considering also the quality level of the waste management practices and services. The assessor will bestow the following scores (Table 3.16):
Table 3.16 Contribution to enhance food security rating
Score Description 0 The contribution of the assessed scenario to the food security is negative or negligible 1 The contribution of the assessed scenario to the food security is low 2 The contribution of the assessed scenario to the food security is moderate 3 The contribution of the assessed scenario to the food security is relatively high 4 The contribution of the assessed scenario to the food security is high
• Contribution to enhance food safety
The food safety is related to the unsafe food that could contain hazardous agents and/or contaminants that can make people sick, either immediately or increasing their risk of chronic disease. In this case, the contamination could happen during the agricultural and breeding farm practices with a strong correlation with the pollution caused by inappropriate waste management practices. Moreover, food contamination could also happen during transport phases and transformation steps into food laboratories or factories, due to unsafe and inadequate working procedures. Being difficult to define the correlation between unsafe food and people diseases, the evaluator can investigate this indicator considering at first the quality level of the waste management practices, because improved solutions reduce food contamination risks at the beginning. Then, the evaluator should assess the food transformation operations into the laboratories and factories located in the considered area, especially as concerns the transformation of local products, and finally consider products conservation measures in the local market. The assessor will bestow the following scores (Table 3.17):
67
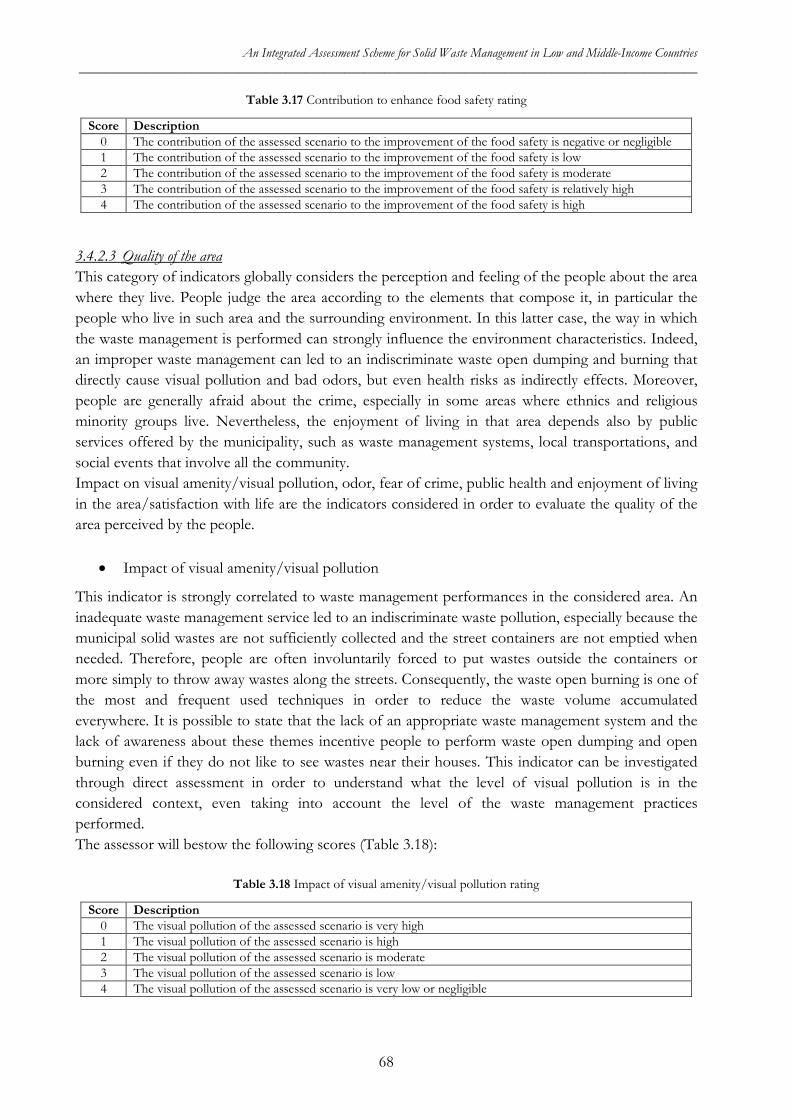
An Integrated Assessment Scheme for Solid Waste Management in Low and Middle-Income Countries _____________________________________________________________________________________________
Table 3.17 Contribution to enhance food safety rating
Score Description 0 The contribution of the assessed scenario to the improvement of the food safety is negative or negligible 1 The contribution of the assessed scenario to the improvement of the food safety is low 2 The contribution of the assessed scenario to the improvement of the food safety is moderate 3 The contribution of the assessed scenario to the improvement of the food safety is relatively high 4 The contribution of the assessed scenario to the improvement of the food safety is high
3.4.2.3 Quality of the area This category of indicators globally considers the perception and feeling of the people about the area where they live. People judge the area according to the elements that compose it, in particular the people who live in such area and the surrounding environment. In this latter case, the way in which the waste management is performed can strongly influence the environment characteristics. Indeed, an improper waste management can led to an indiscriminate waste open dumping and burning that directly cause visual pollution and bad odors, but even health risks as indirectly effects. Moreover, people are generally afraid about the crime, especially in some areas where ethnics and religious minority groups live. Nevertheless, the enjoyment of living in that area depends also by public services offered by the municipality, such as waste management systems, local transportations, and social events that involve all the community. Impact on visual amenity/visual pollution, odor, fear of crime, public health and enjoyment of living in the area/satisfaction with life are the indicators considered in order to evaluate the quality of the area perceived by the people.
• Impact of visual amenity/visual pollution
This indicator is strongly correlated to waste management performances in the considered area. An inadequate waste management service led to an indiscriminate waste pollution, especially because the municipal solid wastes are not sufficiently collected and the street containers are not emptied when needed. Therefore, people are often involuntarily forced to put wastes outside the containers or more simply to throw away wastes along the streets. Consequently, the waste open burning is one of the most and frequent used techniques in order to reduce the waste volume accumulated everywhere. It is possible to state that the lack of an appropriate waste management system and the lack of awareness about these themes incentive people to perform waste open dumping and open burning even if they do not like to see wastes near their houses. This indicator can be investigated through direct assessment in order to understand what the level of visual pollution is in the considered context, even taking into account the level of the waste management practices performed. The assessor will bestow the following scores (Table 3.18):
Table 3.18 Impact of visual amenity/visual pollution rating
Score Description 0 The visual pollution of the assessed scenario is very high 1 The visual pollution of the assessed scenario is high 2 The visual pollution of the assessed scenario is moderate 3 The visual pollution of the assessed scenario is low 4 The visual pollution of the assessed scenario is very low or negligible
68
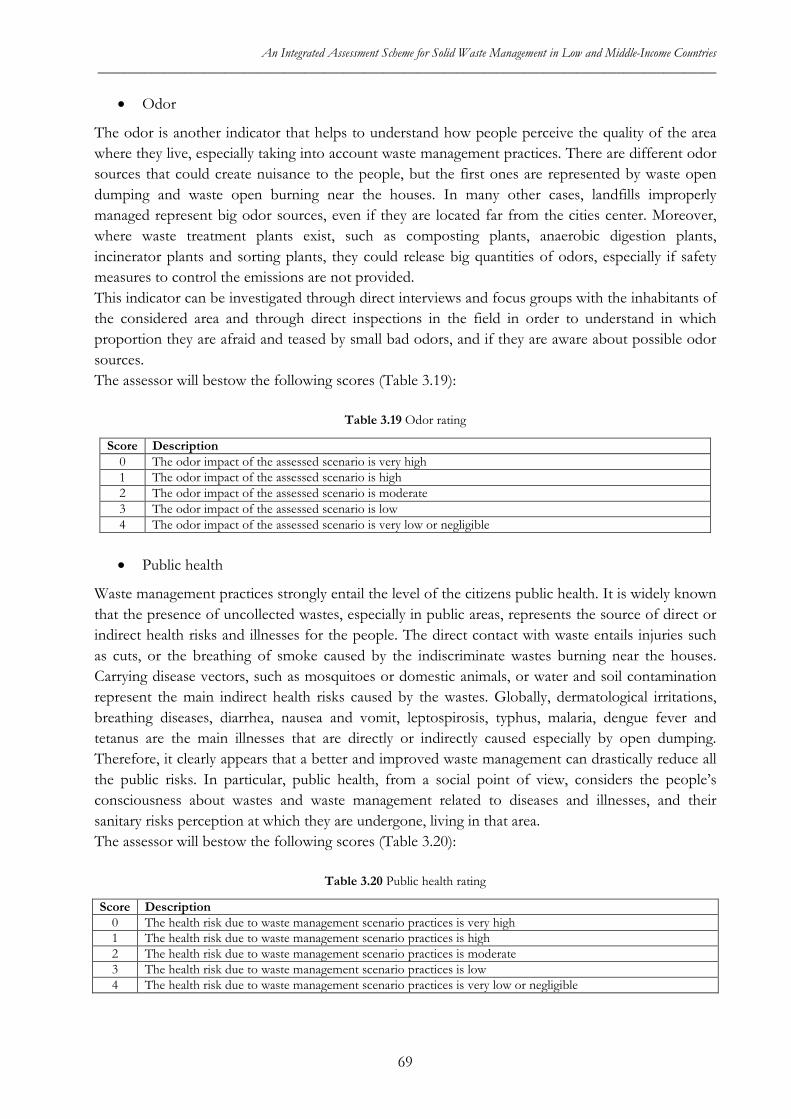
An Integrated Assessment Scheme for Solid Waste Management in Low and Middle-Income Countries _____________________________________________________________________________________________
• Odor
The odor is another indicator that helps to understand how people perceive the quality of the area where they live, especially taking into account waste management practices. There are different odor sources that could create nuisance to the people, but the first ones are represented by waste open dumping and waste open burning near the houses. In many other cases, landfills improperly managed represent big odor sources, even if they are located far from the cities center. Moreover, where waste treatment plants exist, such as composting plants, anaerobic digestion plants, incinerator plants and sorting plants, they could release big quantities of odors, especially if safety measures to control the emissions are not provided. This indicator can be investigated through direct interviews and focus groups with the inhabitants of the considered area and through direct inspections in the field in order to understand in which proportion they are afraid and teased by small bad odors, and if they are aware about possible odor sources. The assessor will bestow the following scores (Table 3.19):
Table 3.19 Odor rating
Score Description 0 The odor impact of the assessed scenario is very high 1 The odor impact of the assessed scenario is high 2 The odor impact of the assessed scenario is moderate 3 The odor impact of the assessed scenario is low 4 The odor impact of the assessed scenario is very low or negligible
• Public health
Waste management practices strongly entail the level of the citizens public health. It is widely known that the presence of uncollected wastes, especially in public areas, represents the source of direct or indirect health risks and illnesses for the people. The direct contact with waste entails injuries such as cuts, or the breathing of smoke caused by the indiscriminate wastes burning near the houses. Carrying disease vectors, such as mosquitoes or domestic animals, or water and soil contamination represent the main indirect health risks caused by the wastes. Globally, dermatological irritations, breathing diseases, diarrhea, nausea and vomit, leptospirosis, typhus, malaria, dengue fever and tetanus are the main illnesses that are directly or indirectly caused especially by open dumping. Therefore, it clearly appears that a better and improved waste management can drastically reduce all the public risks. In particular, public health, from a social point of view, considers the people’s consciousness about wastes and waste management related to diseases and illnesses, and their sanitary risks perception at which they are undergone, living in that area. The assessor will bestow the following scores (Table 3.20):
Table 3.20 Public health rating
Score Description 0 The health risk due to waste management scenario practices is very high 1 The health risk due to waste management scenario practices is high 2 The health risk due to waste management scenario practices is moderate 3 The health risk due to waste management scenario practices is low 4 The health risk due to waste management scenario practices is very low or negligible
69
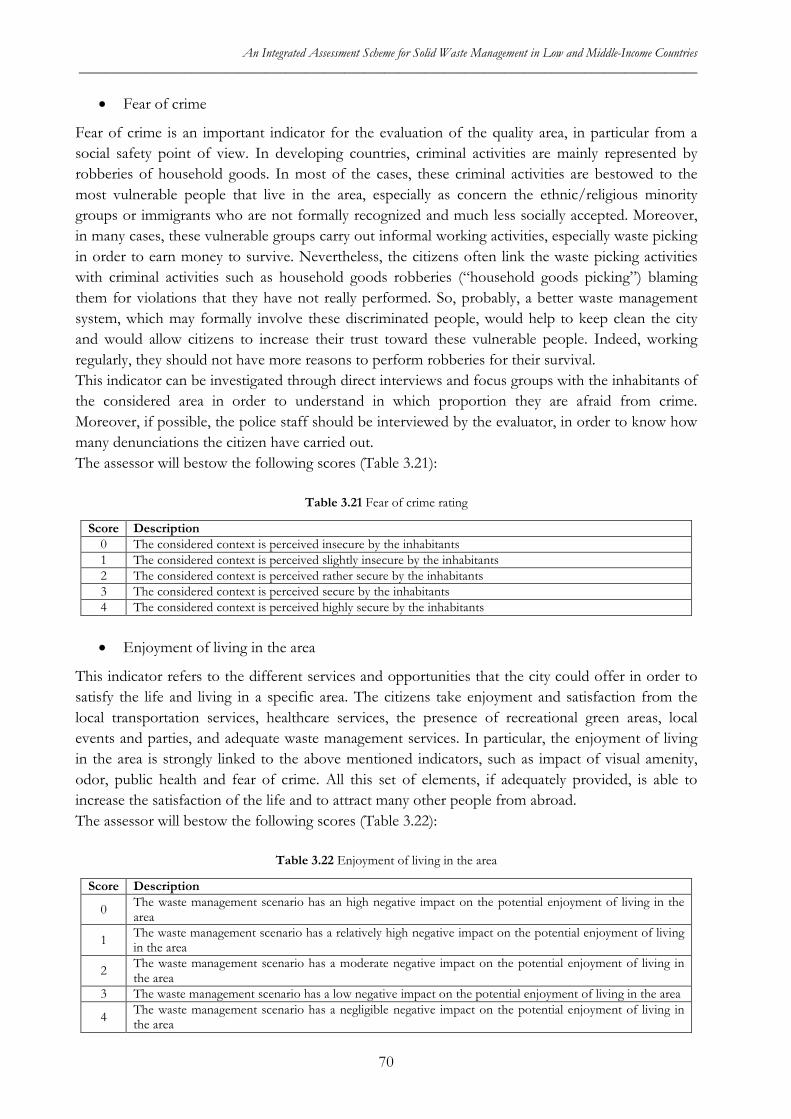
An Integrated Assessment Scheme for Solid Waste Management in Low and Middle-Income Countries _____________________________________________________________________________________________
• Fear of crime
Fear of crime is an important indicator for the evaluation of the quality area, in particular from a social safety point of view. In developing countries, criminal activities are mainly represented by robberies of household goods. In most of the cases, these criminal activities are bestowed to the most vulnerable people that live in the area, especially as concern the ethnic/religious minority groups or immigrants who are not formally recognized and much less socially accepted. Moreover, in many cases, these vulnerable groups carry out informal working activities, especially waste picking in order to earn money to survive. Nevertheless, the citizens often link the waste picking activities with criminal activities such as household goods robberies (“household goods picking”) blaming them for violations that they have not really performed. So, probably, a better waste management system, which may formally involve these discriminated people, would help to keep clean the city and would allow citizens to increase their trust toward these vulnerable people. Indeed, working regularly, they should not have more reasons to perform robberies for their survival. This indicator can be investigated through direct interviews and focus groups with the inhabitants of the considered area in order to understand in which proportion they are afraid from crime. Moreover, if possible, the police staff should be interviewed by the evaluator, in order to know how many denunciations the citizen have carried out. The assessor will bestow the following scores (Table 3.21):
Table 3.21 Fear of crime rating
Score Description 0 The considered context is perceived insecure by the inhabitants 1 The considered context is perceived slightly insecure by the inhabitants 2 The considered context is perceived rather secure by the inhabitants 3 The considered context is perceived secure by the inhabitants 4 The considered context is perceived highly secure by the inhabitants
• Enjoyment of living in the area
This indicator refers to the different services and opportunities that the city could offer in order to satisfy the life and living in a specific area. The citizens take enjoyment and satisfaction from the local transportation services, healthcare services, the presence of recreational green areas, local events and parties, and adequate waste management services. In particular, the enjoyment of living in the area is strongly linked to the above mentioned indicators, such as impact of visual amenity, odor, public health and fear of crime. All this set of elements, if adequately provided, is able to increase the satisfaction of the life and to attract many other people from abroad. The assessor will bestow the following scores (Table 3.22):
Table 3.22 Enjoyment of living in the area
Score Description
0 The waste management scenario has an high negative impact on the potential enjoyment of living in the area
1 The waste management scenario has a relatively high negative impact on the potential enjoyment of living in the area
2 The waste management scenario has a moderate negative impact on the potential enjoyment of living in the area
3 The waste management scenario has a low negative impact on the potential enjoyment of living in the area
4 The waste management scenario has a negligible negative impact on the potential enjoyment of living in the area
70
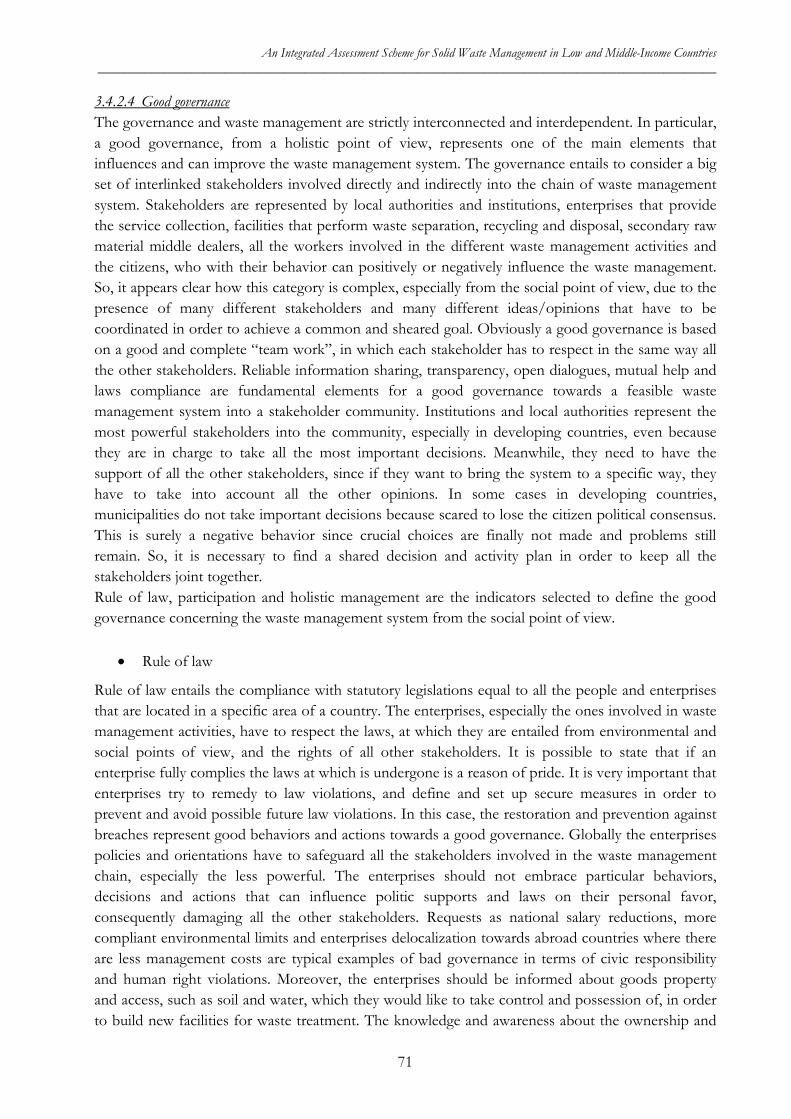
An Integrated Assessment Scheme for Solid Waste Management in Low and Middle-Income Countries _____________________________________________________________________________________________
3.4.2.4 Good governance The governance and waste management are strictly interconnected and interdependent. In particular, a good governance, from a holistic point of view, represents one of the main elements that influences and can improve the waste management system. The governance entails to consider a big set of interlinked stakeholders involved directly and indirectly into the chain of waste management system. Stakeholders are represented by local authorities and institutions, enterprises that provide the service collection, facilities that perform waste separation, recycling and disposal, secondary raw material middle dealers, all the workers involved in the different waste management activities and the citizens, who with their behavior can positively or negatively influence the waste management. So, it appears clear how this category is complex, especially from the social point of view, due to the presence of many different stakeholders and many different ideas/opinions that have to be coordinated in order to achieve a common and sheared goal. Obviously a good governance is based on a good and complete “team work”, in which each stakeholder has to respect in the same way all the other stakeholders. Reliable information sharing, transparency, open dialogues, mutual help and laws compliance are fundamental elements for a good governance towards a feasible waste management system into a stakeholder community. Institutions and local authorities represent the most powerful stakeholders into the community, especially in developing countries, even because they are in charge to take all the most important decisions. Meanwhile, they need to have the support of all the other stakeholders, since if they want to bring the system to a specific way, they have to take into account all the other opinions. In some cases in developing countries, municipalities do not take important decisions because scared to lose the citizen political consensus. This is surely a negative behavior since crucial choices are finally not made and problems still remain. So, it is necessary to find a shared decision and activity plan in order to keep all the stakeholders joint together. Rule of law, participation and holistic management are the indicators selected to define the good governance concerning the waste management system from the social point of view.
• Rule of law
Rule of law entails the compliance with statutory legislations equal to all the people and enterprises that are located in a specific area of a country. The enterprises, especially the ones involved in waste management activities, have to respect the laws, at which they are entailed from environmental and social points of view, and the rights of all other stakeholders. It is possible to state that if an enterprise fully complies the laws at which is undergone is a reason of pride. It is very important that enterprises try to remedy to law violations, and define and set up secure measures in order to prevent and avoid possible future law violations. In this case, the restoration and prevention against breaches represent good behaviors and actions towards a good governance. Globally the enterprises policies and orientations have to safeguard all the stakeholders involved in the waste management chain, especially the less powerful. The enterprises should not embrace particular behaviors, decisions and actions that can influence politic supports and laws on their personal favor, consequently damaging all the other stakeholders. Requests as national salary reductions, more compliant environmental limits and enterprises delocalization towards abroad countries where there are less management costs are typical examples of bad governance in terms of civic responsibility and human right violations. Moreover, the enterprises should be informed about goods property and access, such as soil and water, which they would like to take control and possession of, in order to build new facilities for waste treatment. The knowledge and awareness about the ownership and
71
An Integrated Assessment Scheme for Solid Waste Management in Low and Middle-Income Countries _____________________________________________________________________________________________
the access of the interest goods are important in order to avoid possible laws and human rights violations concerning the goods acquisition process, if feasible. Nevertheless, the enterprises should be aware about the importance of some public goods that confer life satisfaction and enjoyment to the people for living in that area. Therefore, the enterprises should not decide on their own about the goods acquisition according to their business ideas. This indicator can be investigated reviewing documents, agenda, contracts and official records in order to understand at which laws the enterprises are undergone, if the enterprises have been legally challenged over a dispute of social and environmental laws and rights and if the enterprises can prove the ownership about their presumed goods. Moreover, the presence of an action plan necessary to respond to possible laws and rights violations should be assessed, as well as the records of remedy and restoration actions. It is important to understand if some managerial members of the enterprises belong to lobby that can influence laws, regulations and international human rights codes. Beside all these documents review, the assessor has to organize focus groups with workers and citizens in order to find supplementary information, or useful ideas, to consider during document reviewing processes. The assessor will bestow the following scores (Table 3.23):
Table 3.23 Rule of law rating
Score Description 0 The enterprises/plants do not respect the prescriptions at which they are undergone 1 The enterprises/plants respect few prescriptions at which they are undergone 2 The enterprises/plants moderately respect the prescriptions at which they are undergone 3 The enterprises/plants respect a lot of the prescriptions at which they are undergone 4 The enterprises/plants fully respect all the prescriptions at which they are undergone
• Participation
Globally, participation entails stakeholders involvement into the chain of goods production or services provisioning, such as waste management. At first, enterprises need to identify all the stakeholders, also those that are not able to claim their rights, and which are involved into the waste management system. Then, they need to engage the stakeholders in order to create a sort of systematic “working team” in which each subject has a precise role in order to achieve a common joined and shared goal, such as to reach a high ratio of separate waste collection. In particular, a clear description of the waste management process is necessary in order to appropriately define which stakeholders have to be engaged. Obviously, different constraints could hamper the stakeholders engagement owing to different barriers that could entail knowledge/information, financial, physical, geographical, cultural, religious, linguistic/communication aspects. The enterprises have to identify these possible barriers and implement properly solutions in order to overcome them and enhance the establishment of the “working team”. An effective participation of the engaged stakeholders allows to have open dialogues and mutual opinion exchanges that are useful to obtain positive or negative feedbacks, thus allowing the improvement of the whole management system, in which the stakeholders are involved. Nevertheless, conflicts of interests may arise in a system in which stakeholders have different opinions and points of view. For this reason, it is necessary to take care of it through a collaborative and participative approach that has to be carried out with equity, respect and mutual understanding among all the stakeholders. Conflicts resolutions are necessary in order to share the same points of view and go together toward the final
72
An Integrated Assessment Scheme for Solid Waste Management in Low and Middle-Income Countries _____________________________________________________________________________________________
goals. It is worth to underline that the stakeholders engagement and participation are based on the confidence and trust within the whole considered system. This indicator can be investigated analyzing if the enterprises have identified which are the possible stakeholders that have to be considered and which are the engaged stakeholders according to the identified ones. The assessor has to determine if the engaged stakeholders effectively participate into the whole system, sharing information and opinions, especially during scheduled meetings among all the stakeholders. Moreover the evaluator has to understand if the enterprises are able to propose feasible solutions in order to overcome possible stakeholders engagement barriers and solve possible stakeholders conflicts. The assessor will bestow the following scores (Table 3.24):
Table 3.24 Participation rating
Score Description 0 The stakeholders engagement is very low or negligible 1 The stakeholders engagement is low 2 The stakeholders engagement is moderate 3 The stakeholders engagement is high 4 The stakeholders engagement is very high
• Holistic management
The holistic management is a quite new theory developed just after the definition of the sustainability concept. Indeed, considering the waste management field, the holistic view arises after the definition of the Integrated Sustainable Waste Management concept. The holistic management considers fundamental to take into account the three main pillars of sustainability: economic, environmental and social dimensions linked to good governance elements. The enterprises should consider all together and at the same time these dimensions in order to carry out a successful management toward sustainability. In particular, the enterprises have to define waste management plans in order to program and schedule all the activities, both in short and long time, with the final aim to reach the expected performances, especially considering all the sustainable dimensions compared to all the stakeholders involved. Moreover, the enterprises should implement a cost accounting in order to define in monetary terms their management costs and the externalities costs due to the environmental and social impacts, which give even an idea about the enterprise performance. For example, enterprises involved in waste management field, considering waste treatment plants such as composting plants, landfills or incinerators should present cost accounting in order to clearly show the performance plants. This should be done as concern environmental and social impacts, since these are the main effects which all the stakeholders are worried of, especially because they are afraid about the waste process emissions. This indicator can be investigated reviewing enterprises documents and boards, looking for sustainable management plans developed according to the sustainability concept, or anyhow evidences that the enterprises are trying to improve the plants or processes performances. Moreover, the evaluator has to look for cost accounting plans or however the evidence that the enterprises are collecting and analyzing data in order to evaluate their performance from the economic, environmental and social points of view. The assessor will bestow the following scores (Table 3.26):
73
An Integrated Assessment Scheme for Solid Waste Management in Low and Middle-Income Countries _____________________________________________________________________________________________
Table 3.26 Holistic management rating
Score Description 0 The level of fulfillment of the sustainability elements is very low 1 The level of fulfillment of the sustainability elements is low 2 The level of fulfillment of the sustainability elements is moderate 3 The level of fulfillment of the sustainability elements is high 4 The level of fulfillment of the sustainability elements is very high
3.4.3 Environmental dimension In the last 30 years the environmental dimension has received a lot of attentions, especially as concern the dangerous impacts that could severely hamper the environment and its related elements, which together compose an ecosystem [23]. Human activities, such as productive processes and inappropriate behaviors, are the main causes of environmental impacts. It is widely recognized that waste management has a strong impact on the environment. If properly carried out, waste management can have a positive impact on the environment, since it decreases the amount of waste pollution, but conversely, if not well provided, waste management can represent one of the major sources of the environmental pollution. Globally the environmental impact caused by waste management technology is evaluated using specific tools and approaches, such as LCA or EIA [53-57], which are very useful in order to quantify the different impacts on water, soil and air. However, these assessment methods are usually not so easy to implement in developing countries due to the lack of available and reliable data. Nevertheless, these tools assess only the direct environmental impact without taking into account the indirect effects on the ecosystem, such as soil fertility and restoration, food safety and security, and public health issues [48]. The IAS scheme allow to define the assumption of the future implications caused by the waste management option on the environment according to the indicators proposed in Table 3.27.
Table 3.27 List of environmental indicators.
CATEGORY INDICATOR RATING SYSTEM TYPE
Provisioning services Food and fiber Positive contribution Ornamental resources Positive contribution Fresh water Level of interference
Air quality
GHGs emission Level + criteria Non GHGs aeriform emission Level + criteria Air quality regulation Level of interference Climate regulation Level of interference
Water quality
Organic pollutants Level + criteria Inorganic pollutants Level + criteria Microbiological pollutants Level + criteria Water cycling and regulation Level of interference Water purification and nutrient cycling Level of interference Water borne pest and diseases Level of interference
Soil quality
Organic pollutants Level + criteria Inorganic pollutants Level + criteria Erosion regulation Positive contribution Nutrient cycling and Soil formation Positive contribution Soil borne pest and diseases Level of interference
The following paragraphs will explain in detail the meaning of each indicator in order to point out which aspects have to be taken into account during the evaluation process.
74
An Integrated Assessment Scheme for Solid Waste Management in Low and Middle-Income Countries _____________________________________________________________________________________________
3.3.3.1 Provisioning ecosystem services This category of indicators wants to define the quality of the considered ecosystem as concerns the basic and natural products provided. [58]. In particular provisioning services entail the analysis of the food and fiber, ornamental resources and fresh water provisioning, according to the level and quality of the waste management service provided in the considered area.
• Food and fiber
This indicator represents a provision service that entails the ecosystem ability and capacity to provide food and fiber respecting the principles of the food safety and food security. This provision service is strongly influenced by wastes and waste mismanagement, which could represent air, soil and water pollution sources, consequently hampering the natural ability of the ecosystem to provide food and fiber through agricultural, farming and fishing activities and the natural fiber production. It clearly appears that better are the waste management options and less are the impacts on the environment, and consequently better are the food safety and security, especially in developing countries where waste and food are strongly interlinked. This indicator can be investigated through direct field assessments, in which the assessor has to evaluate the agricultural, breeding farm and fishing practices, in order to understand their healthy level, especially from a quantitative point of view. Meanwhile, even the areas that should be improved as concerns the physical presence of wastes should be monitored in order to understand approximately, what is the real potential of agricultural and breeding farm production. Obviously, the assessor also has to take into account the wastes and waste management practices because they have strong influences on agricultural and breeding farm activities as concerns the pollution effects on water and air, since better waste management practices entail less environmental pollution. The assessor will bestow the following scores (Table 3.28):
Table 3.28 Contribution to enhance food and fiber rating
Score Description 0 The contribution of the assessed scenario to the food and fiber provisioning level is negative or negligible 1 The contribution of the assessed scenario to the food and fiber provisioning level is low 2 The contribution of the assessed scenario to the food and fiber provisioning level is moderate 3 The contribution of the assessed scenario to the food and fiber provisioning level is relatively high 4 The contribution of the assessed scenario to the food and fiber provisioning level is high
• Ornamental resources
This indicator represents a provisioning service that entails the abilities and the properties of the ecosystem to naturally provide trees, vegetables, flowers and clean water sources such as rivers, lakes, or waterfalls, which all together constitute the environmental friendly “green areas”. Obviously, this ability could be severely hampered by indiscriminate waste dumping and burning. This indicator is important especially because allows to increase the quality of the area where the people live, enhancing at the same time the people satisfaction to live there. Urban parks, gardens and clean water sources are the main examples of ornamental resources in a considered context, especially as the next step of the waste management improvements, which contributes to enhance the quality and the comfort of those zones as well as reducing soil erosion problems, increasing the biodiversity, enhancing the natural barriers against the air pollution and reducing the global warming potential. So, just the improvement of waste management practices and the cleaning of dirty and damaged areas will enhance environmental quality.
75
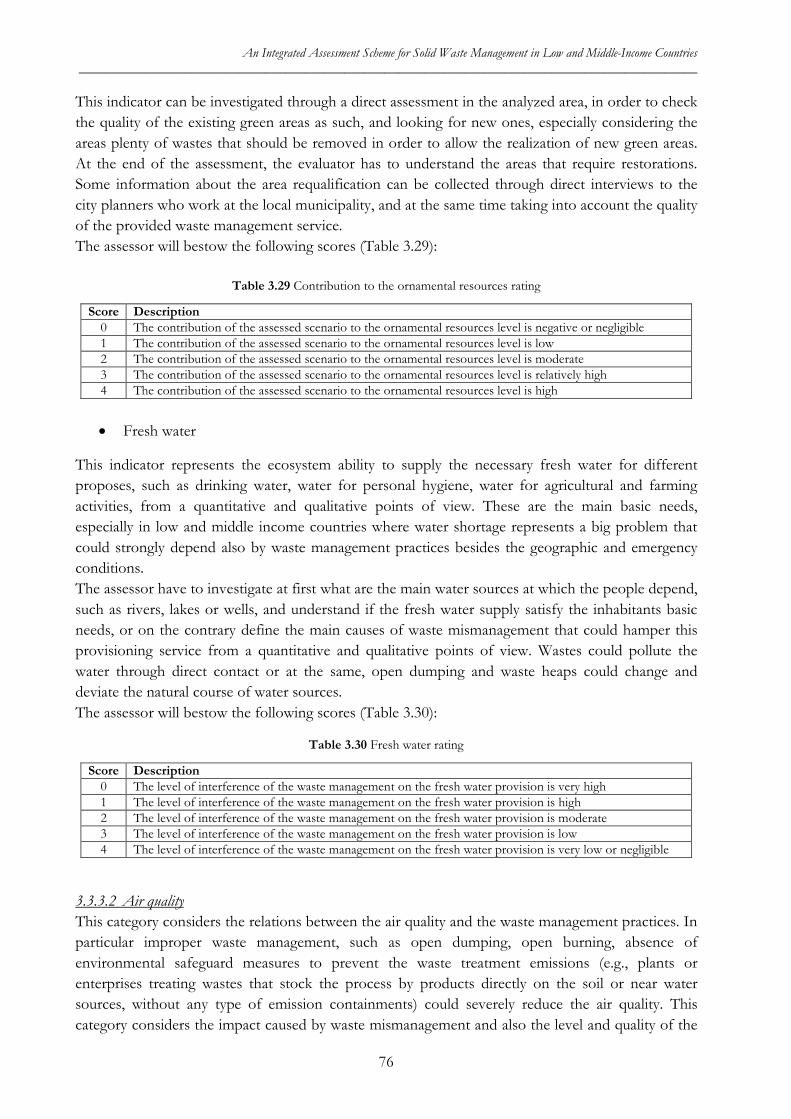
An Integrated Assessment Scheme for Solid Waste Management in Low and Middle-Income Countries _____________________________________________________________________________________________
This indicator can be investigated through a direct assessment in the analyzed area, in order to check the quality of the existing green areas as such, and looking for new ones, especially considering the areas plenty of wastes that should be removed in order to allow the realization of new green areas. At the end of the assessment, the evaluator has to understand the areas that require restorations. Some information about the area requalification can be collected through direct interviews to the city planners who work at the local municipality, and at the same time taking into account the quality of the provided waste management service. The assessor will bestow the following scores (Table 3.29):
Table 3.29 Contribution to the ornamental resources rating
Score Description 0 The contribution of the assessed scenario to the ornamental resources level is negative or negligible 1 The contribution of the assessed scenario to the ornamental resources level is low 2 The contribution of the assessed scenario to the ornamental resources level is moderate 3 The contribution of the assessed scenario to the ornamental resources level is relatively high 4 The contribution of the assessed scenario to the ornamental resources level is high
• Fresh water
This indicator represents the ecosystem ability to supply the necessary fresh water for different proposes, such as drinking water, water for personal hygiene, water for agricultural and farming activities, from a quantitative and qualitative points of view. These are the main basic needs, especially in low and middle income countries where water shortage represents a big problem that could strongly depend also by waste management practices besides the geographic and emergency conditions. The assessor have to investigate at first what are the main water sources at which the people depend, such as rivers, lakes or wells, and understand if the fresh water supply satisfy the inhabitants basic needs, or on the contrary define the main causes of waste mismanagement that could hamper this provisioning service from a quantitative and qualitative points of view. Wastes could pollute the water through direct contact or at the same, open dumping and waste heaps could change and deviate the natural course of water sources. The assessor will bestow the following scores (Table 3.30):
Table 3.30 Fresh water rating
Score Description 0 The level of interference of the waste management on the fresh water provision is very high 1 The level of interference of the waste management on the fresh water provision is high 2 The level of interference of the waste management on the fresh water provision is moderate 3 The level of interference of the waste management on the fresh water provision is low 4 The level of interference of the waste management on the fresh water provision is very low or negligible
3.3.3.2 Air quality This category considers the relations between the air quality and the waste management practices. In particular improper waste management, such as open dumping, open burning, absence of environmental safeguard measures to prevent the waste treatment emissions (e.g., plants or enterprises treating wastes that stock the process by products directly on the soil or near water sources, without any type of emission containments) could severely reduce the air quality. This category considers the impact caused by waste mismanagement and also the level and quality of the
76
An Integrated Assessment Scheme for Solid Waste Management in Low and Middle-Income Countries _____________________________________________________________________________________________
regulation services of the ecosystem that naturally can mitigate and restore the air pollutions. GHGs emission, non GHGs emission, air quality regulation, climate regulation are the indicators used to globally define the air quality.
• GHGs emission
This indicator is strongly linked to waste management activities, because obviously wastes represent one of the main sources of GHG emissions, such as methane (CH4), carbon dioxide (CO2) and nitrous oxide (N2O). The absence or the inappropriateness of waste management contribute to increase the negative environmental impact, especially considering developing countries, where there is a big lack of awareness and knowledge about this topic and the waste management is not considered a priority like the availability of food and water. The quantification of the GHG would be useful to understand the considered waste management scheme performance in order to provide all the necessary improvements, if required. However, this is quite a constraint in developing countries since it is difficult to find companies able to perform LCA or that involve experts and consultants to carry out LCA evaluation. The implementation of an LCA is one of the best way to define the environmental impact, but in developing countries it is almost impossible to perform this type of analysis, due to the lack of available and reliable data, especially in a short period of time. This indicator can be directly evaluated if, luckily, enterprises have carried out a GHG emissions study that provides a global overview of the considered waste management system environmental performance. Nevertheless, an indirect and qualitative way to estimate the GHG represents an efficient alternative evaluation method. In other words, the evaluator has to take into account all the useful improvement activities and practices carried out or that could be carried out by the enterprises in order to reduce the GHG, such as the use of new lorries for the waste collection that are more environmental friendly, the improvement of the composting processes through the water use reduction, the compaction and covering operations for the wastes disposed in landfills, and so on. This indirect method entails the knowledge of the waste management scheme that has to be improved, considering all the possible feasible interventions that could be done. The assessor will bestow the following scores (Table 3.31):
Table 3.31 GHGs emission rating
Score Description
0 The GHGs emission associated to the assessed scenario is very high and the plants/enterprises have not implemented any improvement to their waste management practices in order to reduce GHG emissions
1 The GHGs emission associated to the assessed scenario is high and the plants/enterprises have implemented very few improvements to their waste management practices in order to reduce GHG emissions
2 The GHGs emission associated to the assessed scenario is moderate and the plants/enterprises have implemented few improvements to their waste management practices in order to reduce GHG emissions
3 The GHGs emission associated to the assessed scenario is low and the plants/enterprises have implemented a lot of improvements to their waste management practices in order to reduce GHG emissions
4 The GHGs emission associated to the assessed scenario is very low or absent and the plants/enterprises have implemented all the improvements to their waste management practices in order to reduce GHG emissions
• Non GHGs aeriform emission
This indicator represents the complement of the GHGs aeriform emission as concern the air pollution due to non-greenhouse gases released by wastes and waste management practices. This indicator takes into account air contaminants such as bacteria, fungi, sound, smell, thermal pollution,
77
An Integrated Assessment Scheme for Solid Waste Management in Low and Middle-Income Countries _____________________________________________________________________________________________
sulfuric and nitrous oxides, volatile organic compounds, particulate matter, ammonia, smoke, ozone-depleting substances (e.g. chlorofluorocarbons), and metal gasses [48]. All of these pollutant substances are easily generated by wastes and waste treatment processes, especially when they are not properly managed and anyhow the enterprises or plants do not have adequate safety devices and equipment to prevent the indiscriminate free emissions of the substances. If not properly managed, incinerators and landfills represent some of the main air pollution sources, especially considering developing countries where there are little or no attentions about the processes and their emissions, which in many cases are not under the law controls. Moreover, also wastes dumped or burned along the streets and leave there without any form of collection represent a source of air pollution. This indicator should be evaluated trough the definition of emission points and sources and then quantified by specific measurement processes, according to a specific monitoring plan. Nevertheless, in developing countries, there are not a deep awareness and knowledge about the type of emissions, and the related sources, measurements and laws, especially because in most of the cases they are simply not in place. Therefore, even in this case, the evaluator should personally assess enterprises and plants looking for possible emission sources and related safety measures of control, and waste management schemes improvements, in order to understand what is the current situation, what the enterprises or plants have done and what should have be done in order to reduce air pollution. The assessor will bestow the following scores (Table 3.32):
Table 3.32 Non GHGs aeriform emission rating
Score Description
0 The non GHGs emission associated to the assessed scenario is very high and the plants/enterprises have not implemented any improvement to their waste management practices in order to reduce GHG emissions
1 The non GHGs emission associated to the assessed scenario is high and the plants/enterprises have implemented very few improvements to their waste management practices in order to reduce GHG emissions
2 The non GHGs emission associated to the assessed scenario is moderate and the plants/enterprises have implemented few improvements to their waste management practices in order to reduce GHG emissions
3 The non GHGs emission associated to the assessed scenario is low and the plants/enterprises have implemented a lot of improvements to their waste management practices in order to reduce GHG emissions
4 The non GHGs emission associated to the assessed scenario is very low or absent and the plants/enterprises have implemented all the improvements to their waste management practices in order to reduce GHG emissions
• Air quality regulation
This indicator represents a regulation service and entails the abilities and the properties of the ecosystem to naturally influence, mitigate and purify the air pollution according to ecosystem characteristics. In particular, the ecosystem can contribute to regulate and mitigate non GHG emissions in order to have a cleaner and more breathable air, and consequently improving the living standards. Trees, green areas, forests have a big mitigation power as concerns the air quality. Nevertheless, wastes and waste mismanagement represent a big issue for this ecosystem capacity, because, besides causing air pollution, can strongly hamper the natural vegetative reproduction, reducing consequently air quality regulation. Therefore, the assessor has to take into account the waste management practices level, the overbuilding ratio, the presence of large spaces impoverished by dumped and burned wastes and the presence of green areas/trees. In particular, this latter one mainly contributes to the air quality purification and mitigation.
78

An Integrated Assessment Scheme for Solid Waste Management in Low and Middle-Income Countries _____________________________________________________________________________________________
The assessor will bestow the following scores (Table 3.33):
Table 3.33 Air quality regulation rating
Score Description 0 The level of interference and influence of the waste management on the air quality regulation is very high 1 The level of interference and influence of the waste management on the air quality regulation is high 2 The level of interference and influence of the waste management on the air quality regulation is moderate 3 The level of interference and influence of the waste management on the air quality regulation is low
4 The level of interference and influence of the waste management on the air quality regulation is negligible or positive effects are expected
• Climate regulation
This indicator represents a regulation service and entails the ability and the properties of the ecosystem to naturally influence and mitigate the climate changes from local (e.g., heat island) to regional and global scale. Among the climate regulation services, the most important is how an ecosystem can contribute to regulate and mitigate GHG emissions in order to regulate principally the global warming potential and the rainfall. Even in this case, trees, green areas, forests and natural vegetation have a high CO2 reduction power. Nevertheless, the wastes and waste mismanagement represent a big issue for this ecosystem capacity, because, besides causing GHG emissions, can strongly hamper the natural vegetative reproduction, reducing consequently the climate regulation. Therefore the assessor has to take into account the waste management practices level, overbuilding ratio, the presence of large spaces impoverished by dumped and burned wastes and the presence of green areas/trees besides that have one of the main contribute as concern the climate regulation. The assessor will bestow the following scores (Table 3.34):
Table 3.34 Climate regulation rating
Score Description 0 The level of interference and influence of the waste management on the climate regulation is very high 1 The level of interference and influence of the waste management on the climate regulation is high 2 The level of interference and influence of the waste management on the climate regulation is moderate 3 The level of interference and influence of the waste management on the climate regulation is low
4 The level of interference and influence of the waste management on the climate regulation is negligible or positive effects are expected
3.3.3.3 Water quality This category takes into account the water polluted by wastes and inappropriate waste management practices, as well as the excessive squandering of high water volumes in productive processes, which consequently can contaminate the water. Inappropriate waste management can represent a big source of water pollution, such as wastes dumped along the streets, big municipal open dumps (uncontrolled landfills), composting plants that can release high amounts of leachate, sorting plants that could use water to wash some kind of wastes and consequently contaminate it, and so on. Moreover this category also takes into account different regulation services that allow to naturally control the water sphere, considering all the constraints caused by wastes and waste mismanagement practices. Organic pollutants, inorganic pollutants, microbiological pollutants, water cycling and regulation, water purification and nutrient cycling, water born pest and diseases are the indicators that describe the water quality category.
79
An Integrated Assessment Scheme for Solid Waste Management in Low and Middle-Income Countries _____________________________________________________________________________________________
• Organic pollutants
This indicator considers the organic water pollution caused by the waste and waste mismanagement practices. Volatile organic compounds, nutrient, carbon compounds, persistent organic pollutants, hydrocarbons represent the main organic pollutants released by wastes, which can deteriorate the water quality. Wastes open dumping and burning, uncontrolled and inefficient waste treatment processes can lead to an indiscriminate water pollution. This indicator should be evaluated trough the analysis of the waste management chain and the consequent definition of the emission points and sources, and then quantifying them by specific measurement processes, according to specific monitoring plans, in order to verify its feasibility and compliance. Nevertheless, in developing countries, there is not a deep awareness and knowledge about the emissions, and the related sources, measurements and laws, especially because in most of the cases they are simply not in place. Therefore, even in this case, the evaluator should personally assess the enterprises and plants looking for possible emission sources and related safety measures of control, and waste management schemes improvements, in order to understand what the water pollution magnitude is. The assessor will bestow the following scores (Table 3.35):
Table 3.35 Water organic pollutants rating
Score Description
0 The organic water pollution associated to the assessed scenario is very high and the plants/enterprises have not implemented any waste management improvements
1 The organic water pollution associated to the assessed scenario is high and the plants/enterprises have implemented very few waste management improvements
2 The organic water pollution associated to the assessed scenario is moderate and the plants/enterprises have implemented few waste management improvements
3 The organic water pollution associated to the assessed scenario is low and the plants/enterprises have implemented a lot of waste management improvements
4 The organic water pollution associated to the assessed scenario is very low or negligible and the plants/enterprises have implemented all the waste management improvements
• Inorganic pollutants
This indicator considers the inorganic water pollution caused by the waste and waste mismanagement practices. Metals, ammonia, industrial by-products, are the main inorganic pollutants released by wastes that can deteriorate the water quality. Waste open dumping and burning, uncontrolled and inefficient waste treatment processes can lead to an indiscriminate water pollution. This indicator should be evaluated trough the analysis of the waste management chain and the consequent definition of emission points and sources, and then quantifying them by specific measurement processes, according to specific monitoring plans, in order to verify its feasibility and compliance. Nevertheless, in developing countries, there is not a deep awareness and knowledge about the emissions, and the related sources, measurements and laws, especially because in most of the cases they are simply not in place. Therefore, even in this case, the evaluator should personally assess the enterprises and plants looking for possible emission sources and related safety measures of control, and waste management schemes improvements, in order to understand what the water pollution magnitude is. The assessor will bestow the following scores (Table 3.36):
80
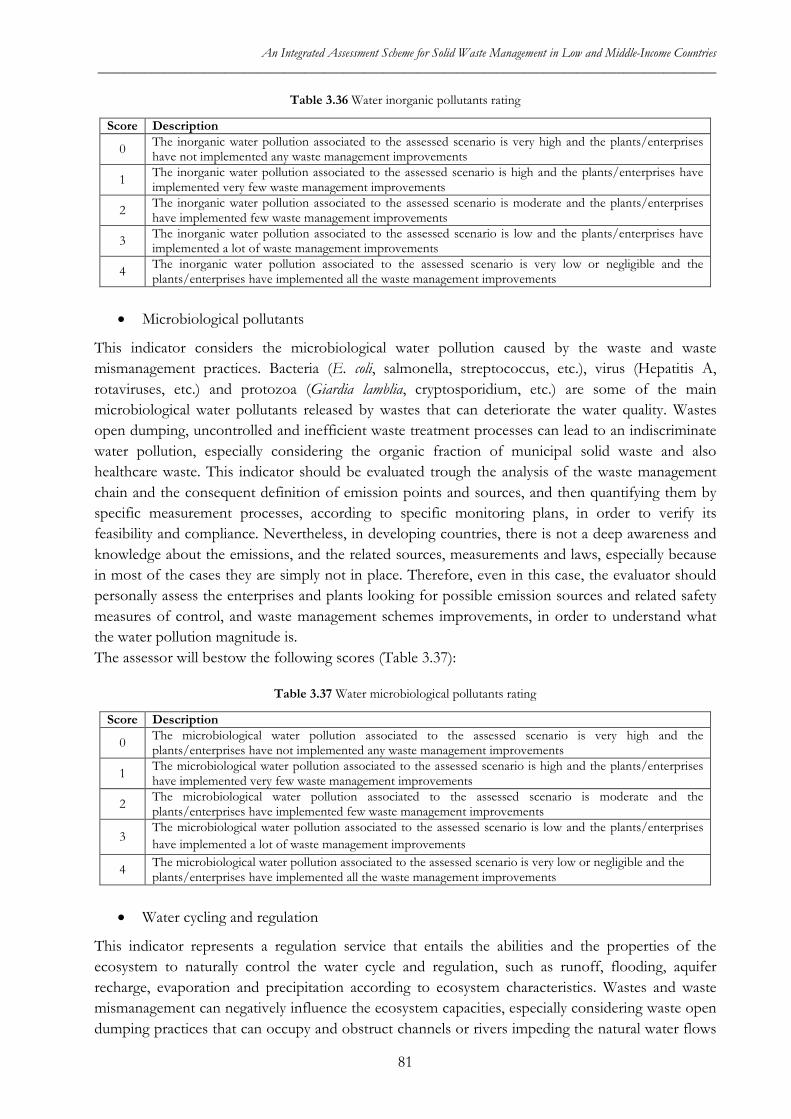
An Integrated Assessment Scheme for Solid Waste Management in Low and Middle-Income Countries _____________________________________________________________________________________________
Table 3.36 Water inorganic pollutants rating
Score Description
0 The inorganic water pollution associated to the assessed scenario is very high and the plants/enterprises have not implemented any waste management improvements
1 The inorganic water pollution associated to the assessed scenario is high and the plants/enterprises have implemented very few waste management improvements
2 The inorganic water pollution associated to the assessed scenario is moderate and the plants/enterprises have implemented few waste management improvements
3 The inorganic water pollution associated to the assessed scenario is low and the plants/enterprises have implemented a lot of waste management improvements
4 The inorganic water pollution associated to the assessed scenario is very low or negligible and the plants/enterprises have implemented all the waste management improvements
• Microbiological pollutants
This indicator considers the microbiological water pollution caused by the waste and waste mismanagement practices. Bacteria (E. coli, salmonella, streptococcus, etc.), virus (Hepatitis A, rotaviruses, etc.) and protozoa (Giardia lamblia, cryptosporidium, etc.) are some of the main microbiological water pollutants released by wastes that can deteriorate the water quality. Wastes open dumping, uncontrolled and inefficient waste treatment processes can lead to an indiscriminate water pollution, especially considering the organic fraction of municipal solid waste and also healthcare waste. This indicator should be evaluated trough the analysis of the waste management chain and the consequent definition of emission points and sources, and then quantifying them by specific measurement processes, according to specific monitoring plans, in order to verify its feasibility and compliance. Nevertheless, in developing countries, there is not a deep awareness and knowledge about the emissions, and the related sources, measurements and laws, especially because in most of the cases they are simply not in place. Therefore, even in this case, the evaluator should personally assess the enterprises and plants looking for possible emission sources and related safety measures of control, and waste management schemes improvements, in order to understand what the water pollution magnitude is. The assessor will bestow the following scores (Table 3.37):
Table 3.37 Water microbiological pollutants rating
Score Description
0 The microbiological water pollution associated to the assessed scenario is very high and the plants/enterprises have not implemented any waste management improvements
1 The microbiological water pollution associated to the assessed scenario is high and the plants/enterprises have implemented very few waste management improvements
2 The microbiological water pollution associated to the assessed scenario is moderate and the plants/enterprises have implemented few waste management improvements
3 The microbiological water pollution associated to the assessed scenario is low and the plants/enterprises have implemented a lot of waste management improvements
4 The microbiological water pollution associated to the assessed scenario is very low or negligible and the plants/enterprises have implemented all the waste management improvements
• Water cycling and regulation
This indicator represents a regulation service that entails the abilities and the properties of the ecosystem to naturally control the water cycle and regulation, such as runoff, flooding, aquifer recharge, evaporation and precipitation according to ecosystem characteristics. Wastes and waste mismanagement can negatively influence the ecosystem capacities, especially considering waste open dumping practices that can occupy and obstruct channels or rivers impeding the natural water flows
81
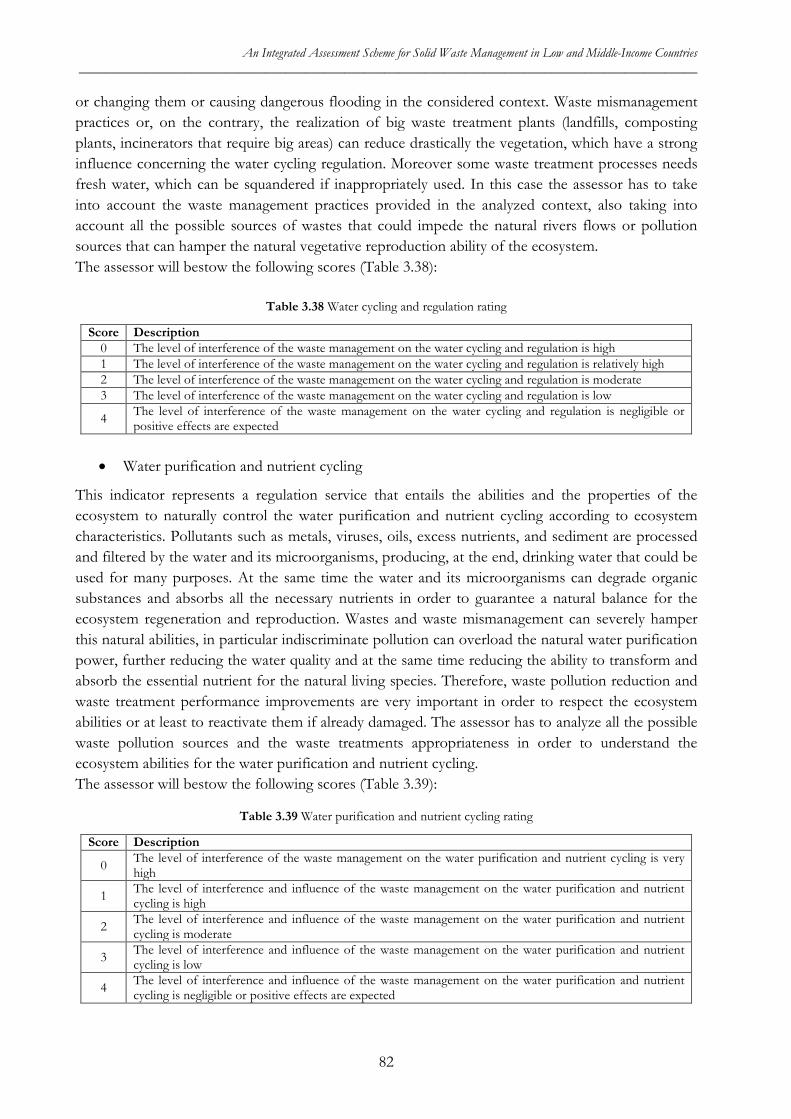
An Integrated Assessment Scheme for Solid Waste Management in Low and Middle-Income Countries _____________________________________________________________________________________________
or changing them or causing dangerous flooding in the considered context. Waste mismanagement practices or, on the contrary, the realization of big waste treatment plants (landfills, composting plants, incinerators that require big areas) can reduce drastically the vegetation, which have a strong influence concerning the water cycling regulation. Moreover some waste treatment processes needs fresh water, which can be squandered if inappropriately used. In this case the assessor has to take into account the waste management practices provided in the analyzed context, also taking into account all the possible sources of wastes that could impede the natural rivers flows or pollution sources that can hamper the natural vegetative reproduction ability of the ecosystem. The assessor will bestow the following scores (Table 3.38):
Table 3.38 Water cycling and regulation rating
Score Description 0 The level of interference of the waste management on the water cycling and regulation is high 1 The level of interference of the waste management on the water cycling and regulation is relatively high 2 The level of interference of the waste management on the water cycling and regulation is moderate 3 The level of interference of the waste management on the water cycling and regulation is low
4 The level of interference of the waste management on the water cycling and regulation is negligible or positive effects are expected
• Water purification and nutrient cycling
This indicator represents a regulation service that entails the abilities and the properties of the ecosystem to naturally control the water purification and nutrient cycling according to ecosystem characteristics. Pollutants such as metals, viruses, oils, excess nutrients, and sediment are processed and filtered by the water and its microorganisms, producing, at the end, drinking water that could be used for many purposes. At the same time the water and its microorganisms can degrade organic substances and absorbs all the necessary nutrients in order to guarantee a natural balance for the ecosystem regeneration and reproduction. Wastes and waste mismanagement can severely hamper this natural abilities, in particular indiscriminate pollution can overload the natural water purification power, further reducing the water quality and at the same time reducing the ability to transform and absorb the essential nutrient for the natural living species. Therefore, waste pollution reduction and waste treatment performance improvements are very important in order to respect the ecosystem abilities or at least to reactivate them if already damaged. The assessor has to analyze all the possible waste pollution sources and the waste treatments appropriateness in order to understand the ecosystem abilities for the water purification and nutrient cycling. The assessor will bestow the following scores (Table 3.39):
Table 3.39 Water purification and nutrient cycling rating
Score Description
0 The level of interference of the waste management on the water purification and nutrient cycling is very high
1 The level of interference and influence of the waste management on the water purification and nutrient cycling is high
2 The level of interference and influence of the waste management on the water purification and nutrient cycling is moderate
3 The level of interference and influence of the waste management on the water purification and nutrient cycling is low
4 The level of interference and influence of the waste management on the water purification and nutrient cycling is negligible or positive effects are expected
82
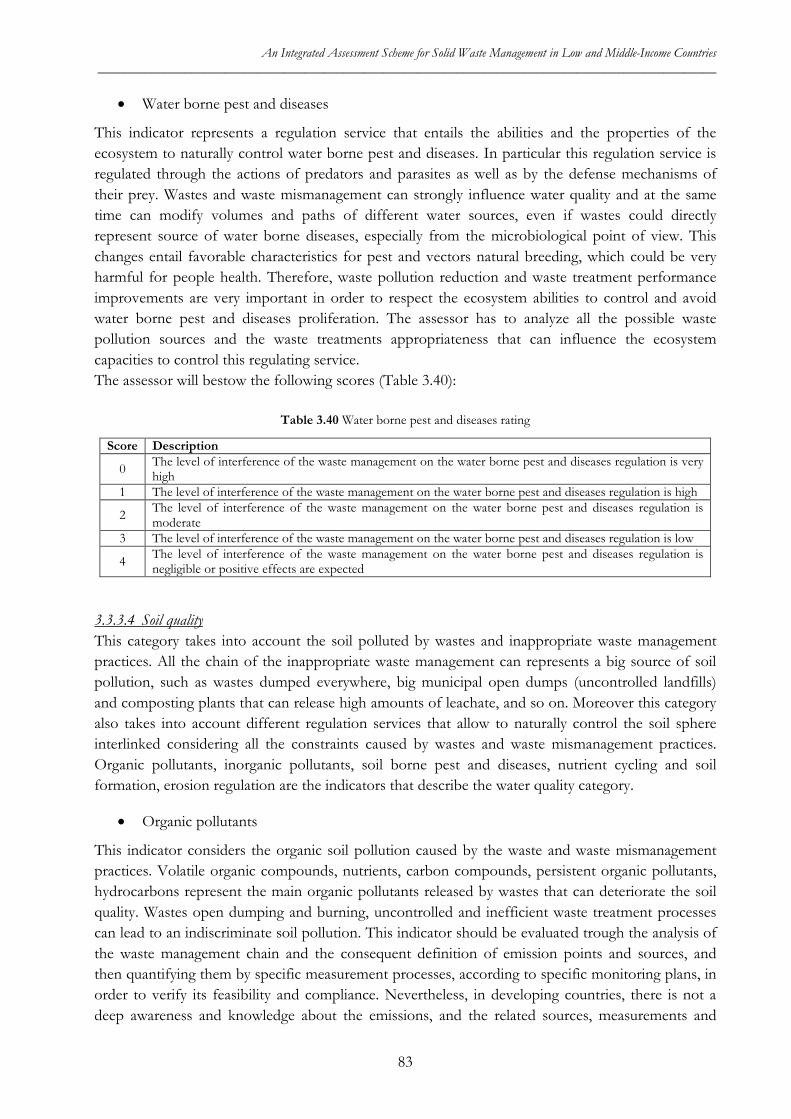
An Integrated Assessment Scheme for Solid Waste Management in Low and Middle-Income Countries _____________________________________________________________________________________________
• Water borne pest and diseases
This indicator represents a regulation service that entails the abilities and the properties of the ecosystem to naturally control water borne pest and diseases. In particular this regulation service is regulated through the actions of predators and parasites as well as by the defense mechanisms of their prey. Wastes and waste mismanagement can strongly influence water quality and at the same time can modify volumes and paths of different water sources, even if wastes could directly represent source of water borne diseases, especially from the microbiological point of view. This changes entail favorable characteristics for pest and vectors natural breeding, which could be very harmful for people health. Therefore, waste pollution reduction and waste treatment performance improvements are very important in order to respect the ecosystem abilities to control and avoid water borne pest and diseases proliferation. The assessor has to analyze all the possible waste pollution sources and the waste treatments appropriateness that can influence the ecosystem capacities to control this regulating service. The assessor will bestow the following scores (Table 3.40):
Table 3.40 Water borne pest and diseases rating
Score Description
0 The level of interference of the waste management on the water borne pest and diseases regulation is very high
1 The level of interference of the waste management on the water borne pest and diseases regulation is high
2 The level of interference of the waste management on the water borne pest and diseases regulation is moderate
3 The level of interference of the waste management on the water borne pest and diseases regulation is low
4 The level of interference of the waste management on the water borne pest and diseases regulation is negligible or positive effects are expected
3.3.3.4 Soil quality This category takes into account the soil polluted by wastes and inappropriate waste management practices. All the chain of the inappropriate waste management can represents a big source of soil pollution, such as wastes dumped everywhere, big municipal open dumps (uncontrolled landfills) and composting plants that can release high amounts of leachate, and so on. Moreover this category also takes into account different regulation services that allow to naturally control the soil sphere interlinked considering all the constraints caused by wastes and waste mismanagement practices. Organic pollutants, inorganic pollutants, soil borne pest and diseases, nutrient cycling and soil formation, erosion regulation are the indicators that describe the water quality category.
• Organic pollutants
This indicator considers the organic soil pollution caused by the waste and waste mismanagement practices. Volatile organic compounds, nutrients, carbon compounds, persistent organic pollutants, hydrocarbons represent the main organic pollutants released by wastes that can deteriorate the soil quality. Wastes open dumping and burning, uncontrolled and inefficient waste treatment processes can lead to an indiscriminate soil pollution. This indicator should be evaluated trough the analysis of the waste management chain and the consequent definition of emission points and sources, and then quantifying them by specific measurement processes, according to specific monitoring plans, in order to verify its feasibility and compliance. Nevertheless, in developing countries, there is not a deep awareness and knowledge about the emissions, and the related sources, measurements and
83
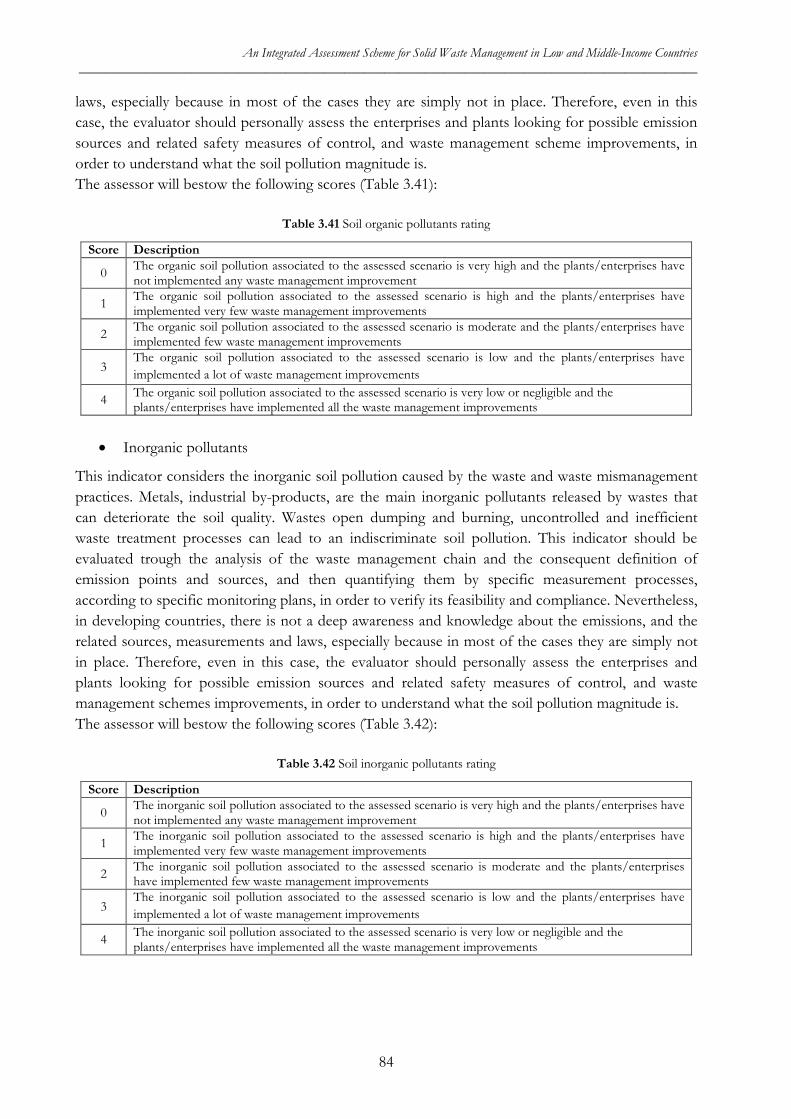
An Integrated Assessment Scheme for Solid Waste Management in Low and Middle-Income Countries _____________________________________________________________________________________________
laws, especially because in most of the cases they are simply not in place. Therefore, even in this case, the evaluator should personally assess the enterprises and plants looking for possible emission sources and related safety measures of control, and waste management scheme improvements, in order to understand what the soil pollution magnitude is. The assessor will bestow the following scores (Table 3.41):
Table 3.41 Soil organic pollutants rating
Score Description
0 The organic soil pollution associated to the assessed scenario is very high and the plants/enterprises have not implemented any waste management improvement
1 The organic soil pollution associated to the assessed scenario is high and the plants/enterprises have implemented very few waste management improvements
2 The organic soil pollution associated to the assessed scenario is moderate and the plants/enterprises have implemented few waste management improvements
3 The organic soil pollution associated to the assessed scenario is low and the plants/enterprises have implemented a lot of waste management improvements
4 The organic soil pollution associated to the assessed scenario is very low or negligible and the plants/enterprises have implemented all the waste management improvements
• Inorganic pollutants
This indicator considers the inorganic soil pollution caused by the waste and waste mismanagement practices. Metals, industrial by-products, are the main inorganic pollutants released by wastes that can deteriorate the soil quality. Wastes open dumping and burning, uncontrolled and inefficient waste treatment processes can lead to an indiscriminate soil pollution. This indicator should be evaluated trough the analysis of the waste management chain and the consequent definition of emission points and sources, and then quantifying them by specific measurement processes, according to specific monitoring plans, in order to verify its feasibility and compliance. Nevertheless, in developing countries, there is not a deep awareness and knowledge about the emissions, and the related sources, measurements and laws, especially because in most of the cases they are simply not in place. Therefore, even in this case, the evaluator should personally assess the enterprises and plants looking for possible emission sources and related safety measures of control, and waste management schemes improvements, in order to understand what the soil pollution magnitude is. The assessor will bestow the following scores (Table 3.42):
Table 3.42 Soil inorganic pollutants rating
Score Description
0 The inorganic soil pollution associated to the assessed scenario is very high and the plants/enterprises have not implemented any waste management improvement
1 The inorganic soil pollution associated to the assessed scenario is high and the plants/enterprises have implemented very few waste management improvements
2 The inorganic soil pollution associated to the assessed scenario is moderate and the plants/enterprises have implemented few waste management improvements
3 The inorganic soil pollution associated to the assessed scenario is low and the plants/enterprises have implemented a lot of waste management improvements
4 The inorganic soil pollution associated to the assessed scenario is very low or negligible and the plants/enterprises have implemented all the waste management improvements
84
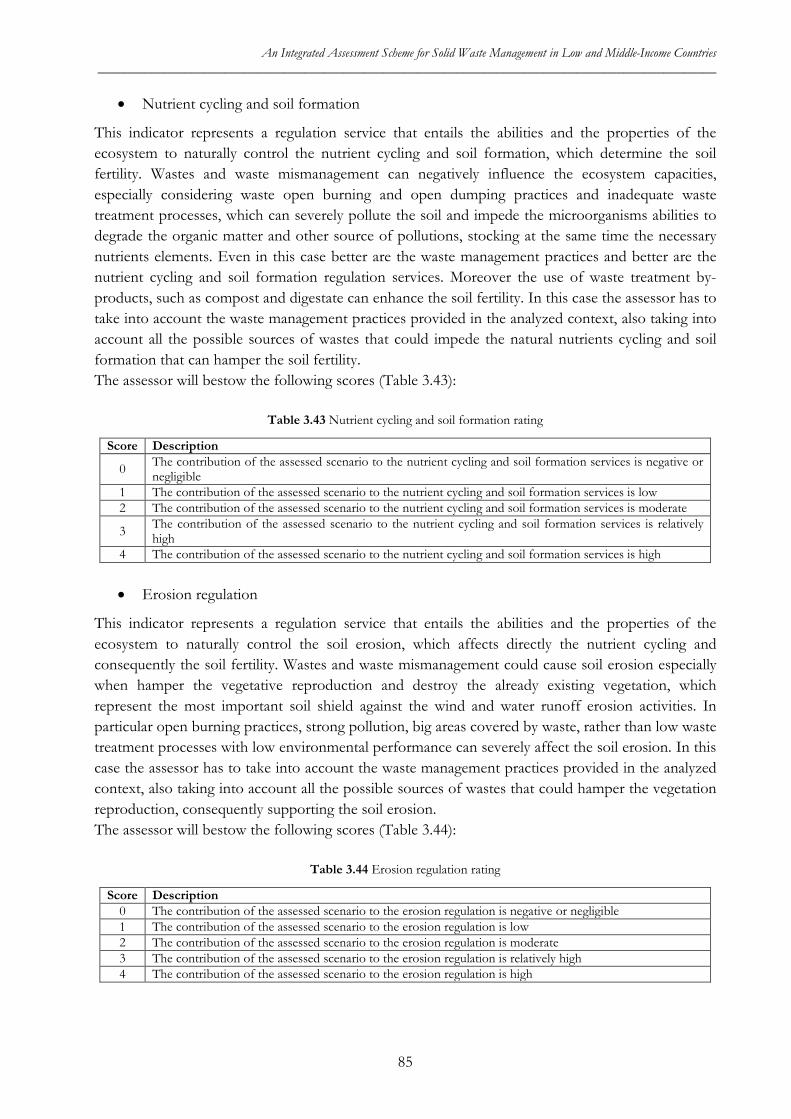
An Integrated Assessment Scheme for Solid Waste Management in Low and Middle-Income Countries _____________________________________________________________________________________________
• Nutrient cycling and soil formation
This indicator represents a regulation service that entails the abilities and the properties of the ecosystem to naturally control the nutrient cycling and soil formation, which determine the soil fertility. Wastes and waste mismanagement can negatively influence the ecosystem capacities, especially considering waste open burning and open dumping practices and inadequate waste treatment processes, which can severely pollute the soil and impede the microorganisms abilities to degrade the organic matter and other source of pollutions, stocking at the same time the necessary nutrients elements. Even in this case better are the waste management practices and better are the nutrient cycling and soil formation regulation services. Moreover the use of waste treatment by-products, such as compost and digestate can enhance the soil fertility. In this case the assessor has to take into account the waste management practices provided in the analyzed context, also taking into account all the possible sources of wastes that could impede the natural nutrients cycling and soil formation that can hamper the soil fertility. The assessor will bestow the following scores (Table 3.43):
Table 3.43 Nutrient cycling and soil formation rating
Score Description
0 The contribution of the assessed scenario to the nutrient cycling and soil formation services is negative or negligible
1 The contribution of the assessed scenario to the nutrient cycling and soil formation services is low 2 The contribution of the assessed scenario to the nutrient cycling and soil formation services is moderate
3 The contribution of the assessed scenario to the nutrient cycling and soil formation services is relatively high
4 The contribution of the assessed scenario to the nutrient cycling and soil formation services is high
• Erosion regulation
This indicator represents a regulation service that entails the abilities and the properties of the ecosystem to naturally control the soil erosion, which affects directly the nutrient cycling and consequently the soil fertility. Wastes and waste mismanagement could cause soil erosion especially when hamper the vegetative reproduction and destroy the already existing vegetation, which represent the most important soil shield against the wind and water runoff erosion activities. In particular open burning practices, strong pollution, big areas covered by waste, rather than low waste treatment processes with low environmental performance can severely affect the soil erosion. In this case the assessor has to take into account the waste management practices provided in the analyzed context, also taking into account all the possible sources of wastes that could hamper the vegetation reproduction, consequently supporting the soil erosion. The assessor will bestow the following scores (Table 3.44):
Table 3.44 Erosion regulation rating
Score Description 0 The contribution of the assessed scenario to the erosion regulation is negative or negligible 1 The contribution of the assessed scenario to the erosion regulation is low 2 The contribution of the assessed scenario to the erosion regulation is moderate 3 The contribution of the assessed scenario to the erosion regulation is relatively high 4 The contribution of the assessed scenario to the erosion regulation is high
85
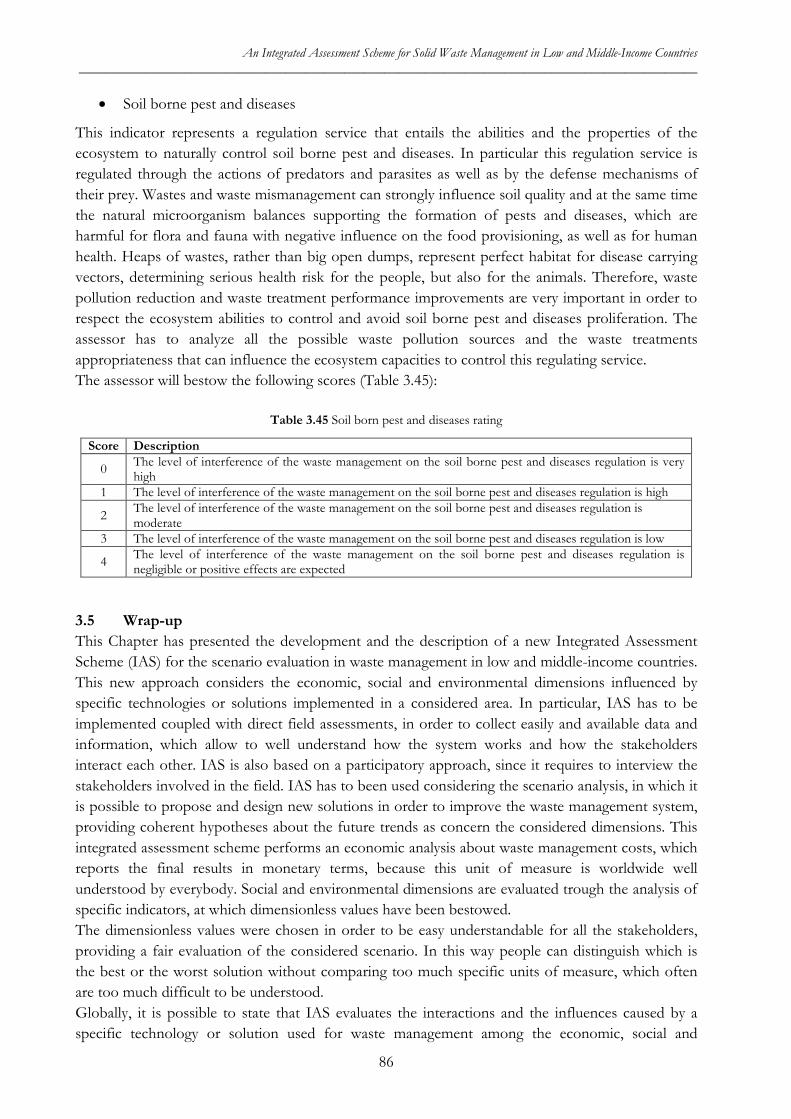
An Integrated Assessment Scheme for Solid Waste Management in Low and Middle-Income Countries _____________________________________________________________________________________________
• Soil borne pest and diseases
This indicator represents a regulation service that entails the abilities and the properties of the ecosystem to naturally control soil borne pest and diseases. In particular this regulation service is regulated through the actions of predators and parasites as well as by the defense mechanisms of their prey. Wastes and waste mismanagement can strongly influence soil quality and at the same time the natural microorganism balances supporting the formation of pests and diseases, which are harmful for flora and fauna with negative influence on the food provisioning, as well as for human health. Heaps of wastes, rather than big open dumps, represent perfect habitat for disease carrying vectors, determining serious health risk for the people, but also for the animals. Therefore, waste pollution reduction and waste treatment performance improvements are very important in order to respect the ecosystem abilities to control and avoid soil borne pest and diseases proliferation. The assessor has to analyze all the possible waste pollution sources and the waste treatments appropriateness that can influence the ecosystem capacities to control this regulating service. The assessor will bestow the following scores (Table 3.45):
Table 3.45 Soil born pest and diseases rating
Score Description
0 The level of interference of the waste management on the soil borne pest and diseases regulation is very high
1 The level of interference of the waste management on the soil borne pest and diseases regulation is high
2 The level of interference of the waste management on the soil borne pest and diseases regulation is moderate
3 The level of interference of the waste management on the soil borne pest and diseases regulation is low
4 The level of interference of the waste management on the soil borne pest and diseases regulation is negligible or positive effects are expected
3.5 Wrap-up This Chapter has presented the development and the description of a new Integrated Assessment Scheme (IAS) for the scenario evaluation in waste management in low and middle-income countries. This new approach considers the economic, social and environmental dimensions influenced by specific technologies or solutions implemented in a considered area. In particular, IAS has to be implemented coupled with direct field assessments, in order to collect easily and available data and information, which allow to well understand how the system works and how the stakeholders interact each other. IAS is also based on a participatory approach, since it requires to interview the stakeholders involved in the field. IAS has to been used considering the scenario analysis, in which it is possible to propose and design new solutions in order to improve the waste management system, providing coherent hypotheses about the future trends as concern the considered dimensions. This integrated assessment scheme performs an economic analysis about waste management costs, which reports the final results in monetary terms, because this unit of measure is worldwide well understood by everybody. Social and environmental dimensions are evaluated trough the analysis of specific indicators, at which dimensionless values have been bestowed. The dimensionless values were chosen in order to be easy understandable for all the stakeholders, providing a fair evaluation of the considered scenario. In this way people can distinguish which is the best or the worst solution without comparing too much specific units of measure, which often are too much difficult to be understood. Globally, it is possible to state that IAS evaluates the interactions and the influences caused by a specific technology or solution used for waste management among the economic, social and
86
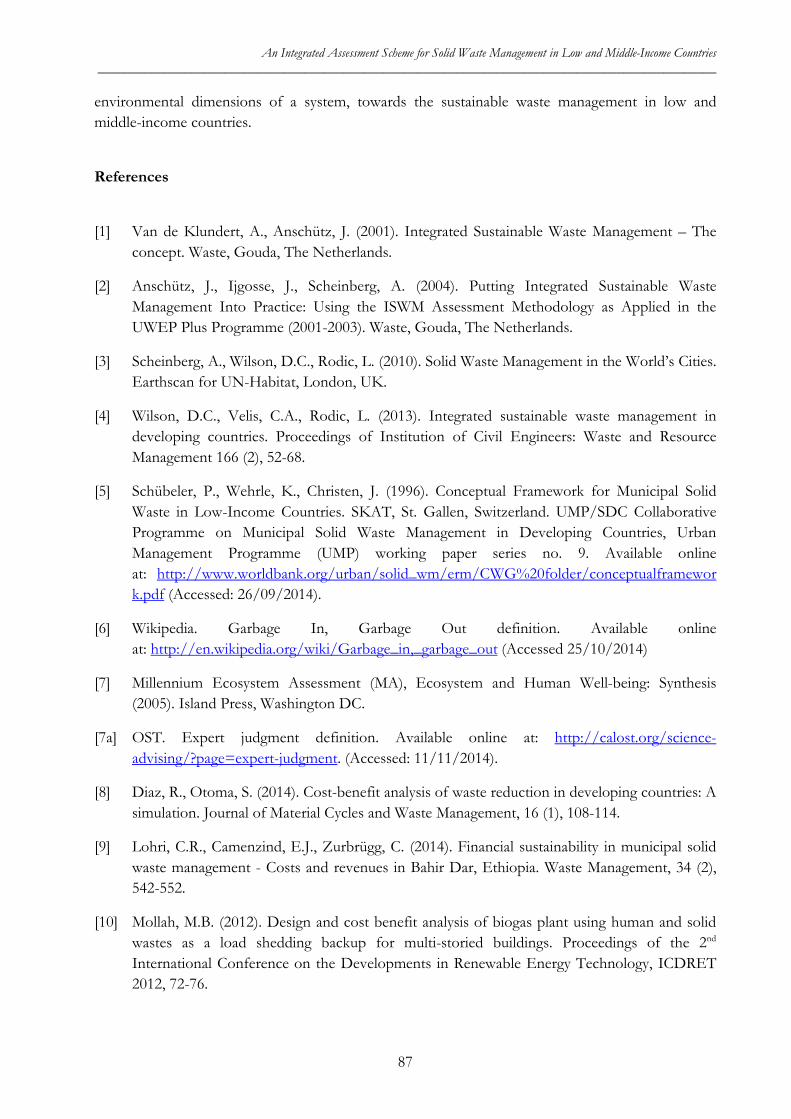
An Integrated Assessment Scheme for Solid Waste Management in Low and Middle-Income Countries _____________________________________________________________________________________________
environmental dimensions of a system, towards the sustainable waste management in low and middle-income countries.
References
[1] Van de Klundert, A., Anschütz, J. (2001). Integrated Sustainable Waste Management – The concept. Waste, Gouda, The Netherlands.
[2] Anschütz, J., Ijgosse, J., Scheinberg, A. (2004). Putting Integrated Sustainable Waste Management Into Practice: Using the ISWM Assessment Methodology as Applied in the UWEP Plus Programme (2001-2003). Waste, Gouda, The Netherlands.
[3] Scheinberg, A., Wilson, D.C., Rodic, L. (2010). Solid Waste Management in the World’s Cities. Earthscan for UN-Habitat, London, UK.
[4] Wilson, D.C., Velis, C.A., Rodic, L. (2013). Integrated sustainable waste management in developing countries. Proceedings of Institution of Civil Engineers: Waste and Resource Management 166 (2), 52-68.
[5] Schübeler, P., Wehrle, K., Christen, J. (1996). Conceptual Framework for Municipal Solid Waste in Low-Income Countries. SKAT, St. Gallen, Switzerland. UMP/SDC Collaborative Programme on Municipal Solid Waste Management in Developing Countries, Urban Management Programme (UMP) working paper series no. 9. Available online at: http://www.worldbank.org/urban/solid_wm/erm/CWG%20folder/conceptualframework.pdf (Accessed: 26/09/2014).
[6] Wikipedia. Garbage In, Garbage Out definition. Available online at: http://en.wikipedia.org/wiki/Garbage_in,_garbage_out (Accessed 25/10/2014)
[7] Millennium Ecosystem Assessment (MA), Ecosystem and Human Well-being: Synthesis (2005). Island Press, Washington DC.
[7a] OST. Expert judgment definition. Available online at: http://calost.org/science-advising/?page=expert-judgment. (Accessed: 11/11/2014).
[8] Diaz, R., Otoma, S. (2014). Cost-benefit analysis of waste reduction in developing countries: A simulation. Journal of Material Cycles and Waste Management, 16 (1), 108-114.
[9] Lohri, C.R., Camenzind, E.J., Zurbrügg, C. (2014). Financial sustainability in municipal solid waste management - Costs and revenues in Bahir Dar, Ethiopia. Waste Management, 34 (2), 542-552.
[10] Mollah, M.B. (2012). Design and cost benefit analysis of biogas plant using human and solid wastes as a load shedding backup for multi-storied buildings. Proceedings of the 2nd International Conference on the Developments in Renewable Energy Technology, ICDRET 2012, 72-76.
87
An Integrated Assessment Scheme for Solid Waste Management in Low and Middle-Income Countries _____________________________________________________________________________________________
[11] Tin, A.M., Wise, D.L., Su, W.H., Reutergardh, L., Lee, S.K. (1995). Cost-benefit analysis of the municipal solid waste collection system in Yangon, Myanmar. Resources, Conservation and Recycling, 14 (2), 103-131.
[12] Rathi, S. (2006). Alternative approaches for better municipal solid waste management in Mumbai, India. Waste Management, 26 (10), 1192-1200.
[13] Couth, R., Trois, C. (2012). Cost effective waste management through composting in Africa. Waste Management, 32 (12), 2518-2525.
[14] Sundaravadivel, M., Vigneswaran, S. (2003). Strategies for waste management in small and medium towns of developing countries: A case study of India. Water Science and Technology, 47 (12), 277-283.
[15] Wang, H., He, J., Kim, Y., Kamata, T. (2014). Municipal solid waste management in rural areas and small counties: An economic analysis using contingent valuation to estimate willingness to pay for Yunnan, China. Waste Management and Research, 32 (8), 695-706.
[16] Afrane, G., Ntiamoah, A. (2012). Analysis of the life-cycle costs and environmental impacts of cooking fuels used in Ghana. Applied Energy, 98, 301-306.
[17] Foolmaun, R.K., Ramjeeawon, T. (2012). Comparative life cycle assessment and life cycle costing of four disposal scenarios for used polyethylene terephthalate bottles in Mauritius. Environmental Technology (United Kingdom), 33 (17), 2007-2018.
[18] Zhao, W., Huppes, G., van der Voet, E. (2011). Eco-efficiency for greenhouse gas emissions mitigation of municipal solid waste management: A case study of Tianjin, China. Waste Management, 31 (6), 1407-1415.
[19] Reich, M.C. (2005). Economic assessment of municipal waste management systems - Case studies using a combination of life cycle assessment (LCA) and life cycle costing (LCC).
[20] Linee guida per la redazione del piano finanziario e per l’elaborazione delle tariffe (2013). Il sole24ore. Available online at: http://www.ilsole24ore.com/pdf2010/SoleOnLine5/_Oggetti_Correlati/Documenti/Norme%20e%20Tributi/2013/03/Linee_guida_TARES_.pdf (Accessed: 28/10/2014).
[21] Vaccari, M., Di Bella, V., Vitali, F., Collivignarelli, C. (2012). From mixed to separate collection of solid waste: Benefits for the town of Zavidovići (Bosnia and Herzegovina). Waste Management, 33 (2), 277-286.
[22] Panizza, A. (A.Y. 2004/2005). Alternative per la raccolta dei rifiuti solidi e la bonifica dei siti di scarico illegali nel territorio di Zavidovici (Bosnia e Erzegovina). Master thesis dissertation, University of Brescia, Italy.
[23] Wilson, D.C. (2007). Development drivers for waste management. Waste Management and Research, 25 (3), 198-207.
[24] Poder, T.G. (2011). What is really Social Capital? A Critical Review. American Sociologist, 42 (4), 341-367.
88
An Integrated Assessment Scheme for Solid Waste Management in Low and Middle-Income Countries _____________________________________________________________________________________________
[25] Tsai, T.H. (2008). The impact of social capital on regional waste recycling. Sustainable Development, 16 (1), 44-55.
[26] Van Ha, N., Kant, S., Maclaren, V. (2008). The contribution of social capital to household welfare in a paper-recycling craft village in Vietnam. The Journal of Environment and Development, 13 (4), 371-399.
[27] Jones, N., Evangelinos, K., Halvadakis, C.P., Iosifides, T., Sophoulis, C.M. (2010). Social factors influencing perceptions and willingness to pay for a market-based policy aiming on solid waste management. Resources, Conservation and Recycling, 54 (9), 533-540.
[28] Jones, N. (2010). Environmental activation of citizens in the context of policy agenda formation and the influence of social capital. Social Science Journal, 47 (1), 121-136.
[29] Zurbrügg, C., Rothenberger, S. (2013). Determinants of resilience in community-led waste management. Proceedings of Institution of Civil Engineers: Waste and Resource Management, 166 (2), 93-100.
[30] Kurz, T., Linden, M., Sheehy, N. (2007). Attitudinal and community influences on participation in new curbside recycling initiatives in Northern Ireland. Environment and Behavior, 39 (3), 367-391.
[31] Grootaert, C., Narayan, D., Jones, V.H., Woolcock, M. (2004). Measuring Social Capital. An integrated questionnaire. World Bank working paper, n° 18.
[32] Jones, V.-H., Woolcock, M. (2007). Using mixed Methods to assess Social Capital in Low Income Countries: A practical guide. Brooks World Poverty Institute. The University of Manchester. ISBN 978-1-906518-11-0.
[33] Grootaert, C., Van Bastelaer, T. (2002). Understanding and measuring Social Capital. A Multidisciplinary Tool for Practitioners. The World Bank. ISBN 0-8213-5068-4.
[34] Interorganizational Committee on Guidelines and Principles for Social Impact Assessment. (1994). Guidelines and Principles for Social Impact Assessment. Available online at: http://www.nmfs.noaa.gov/sfa/social_impact_guide.htm. (Accessed: 28/10/2014).
[35] UNEP (2009). Guidelines For Social Life Cycle Assessment of Products. Available online at: http://www.unep.fr/shared/publications/pdf/DTIx1164xPA-guidelines_sLCA.pdf. (Accessed: 28/10/2014).
[36] Lehmann, A., Russi, D., Bala, A., Finkbeiner, M., Fullana-i-Palmer, P. (2011). Integration of social aspects in decision support, based on life cycle thinking. Sustainability, 3 (4), 562-577.
[37] Foolmaun, R.K., Ramjeeawon, T. (2013). Comparative life cycle assessment and social life cycle assessment of used polyethylene terephthalate (PET) bottles in Mauritius. International Journal of Life Cycle Assessment, 18 (1), 155-171.
[38] Foolmaun, R.K., Ramjeawon, T. (2013). Life cycle sustainability assessments (LCSA) of four disposal scenarios for used polyethylene terephthalate (PET) bottles in Mauritius. Environment, Development and Sustainability, 15 (3), 783-806.
89
An Integrated Assessment Scheme for Solid Waste Management in Low and Middle-Income Countries _____________________________________________________________________________________________
[39] Menikpura, S.N.M., Gheewala, S.H., Bonnet, S. (2012). Sustainability assessment of municipal solid waste management in Sri Lanka: Problems and prospects. Journal of Material Cycles and Waste Management, 14 (3), 181-192.
[40] Aparcana, S., Salhofer, S. (2013). Development of a social impact assessment methodology for recycling systems in low-income countries. International Journal of Life Cycle Assessment, 18 (5), 1106-1115.
[41] Aparcana, S., Salhofer, S. (2013). Application of a methodology for the social life cycle assessment of recycling systems in low income countries: Three Peruvian case studies. International Journal of Life Cycle Assessment, 18 (5), 1116-1128.
[42] Dreyer, L.C., Hauschild, M.Z., Schierbeck, J. (2010). Characterisation of social impacts in LCA: Part 1: Development of indicators for labour rights. International Journal of Life Cycle Assessment, 15 (3), 247-259.
[43] Dreyer, L.C., Hauschild, M.Z., Schierbeck, J. (2010). Characterisation of social impacts in LCA. Part 2: Implementation in six company case studies. International Journal of Life Cycle Assessment, 15 (4), 385-402.
[44] Kijak, R., Moy, D. (2004). A decision support framework for sustainable waste management. Journal of Industrial Ecology, 8 (3), 33-50.
[45] Oyoo, R., Leemans, R., Mol, A.P.J. (2013). The determination of an optimal waste management scenario for Kampala, Uganda. Waste Management and Research, 31 (12), 1203-1216.
[46] Garfì, M., Tondelli, S., Bonoli, A. (2009). Multi-criteria decision analysis for waste management in Saharawi refugee camps. Waste Management, 29 (10), 2729-2739.
[47] Zurbrügg, C., Gfrerer, M., Ashadi, H., Brenner, W., Küper, D. (2012). Determinants of sustainability in solid waste management - The Gianyar Waste Recovery Project in Indonesia. Waste Management, 32 (11), 2126-2133.
[48] FAO (2013). Sustainability Assessment of Food and Agriculture systems (SAFA). Available online at: http://www.fao.org/fileadmin/templates/nr/sustainability_pathways/docs/SAFA_Guidelines_Final_122013.pdf. (Accessed: 28/10/2014).
[49] UN. Universal declaration of human rights. Available on line at: http://www.un.org/en/documents/udhr/. (Accessed: 28/10/2014).
[50] ILO core conventions. Available online at: www.labourstart.org/rights. (Accessed: 28/10/2014).
[51] ILO. Labor standards. Available online at: http://www.ilo.org/global/standards/lang--en/index.htm. (Accessed: 28/10/2014).
[52] World Health Organization (2013). Definition of food safety and food security. Available online at: http://www.who.int/trade/glossary/story028/en/. (Accessed: 07/11/2014).
90
An Integrated Assessment Scheme for Solid Waste Management in Low and Middle-Income Countries _____________________________________________________________________________________________
[53] Thanh, N.P., Matsui, Y. (2013). Assessment of potential impacts of municipal solid waste treatment alternatives by using life cycle approach: A case study in Vietnam. Environmental Monitoring and Assessment, 185 (10), 7993-8004.
[54] Zhao, Y., Wang, H.T., Lu, W.J., Damgaard, A., Christensen, T.H. (2009). Life-cycle assessment of the municipal solid waste management system in Hangzhou, China (EASEWASTE). Waste Management and Research, 27 (4), 399-406.
[55] Chi, Y., Dong, J., Tang, Y., Huang, Q., Ni, M. (2014). Life cycle assessment of municipal solid waste source-separated collection and integrated waste management systems in Hangzhou, China. Journal of Material Cycles and Waste Management, article in press.
[56] Abduli, M.A., Naghib, A., Yonesi, M., Akbari, A. (2011). Life cycle assessment (LCA) of solid waste management strategies in Tehran: Landfill and composting plus landfill. Environmental Monitoring and Assessment, 178 (1-4), 487-498.
[57] Özeler, D., Yetiş, Ü., Demirer, G.N. (2006). Life cycle assessment of municipal solid waste management methods: Ankara case study. Environment International, 32 (3), 405-411.
[58] UNDP. (2005). Ecosystems and Human well-being. A framework for Assessment. Available online at: http://www.unep.org/maweb/documents/document.300.aspx.pdf. (Accessed: 11/11/2014).
91

An Integrated Assessment Scheme for Solid Waste Management in Low and Middle-Income Countries _____________________________________________________________________________________________
92
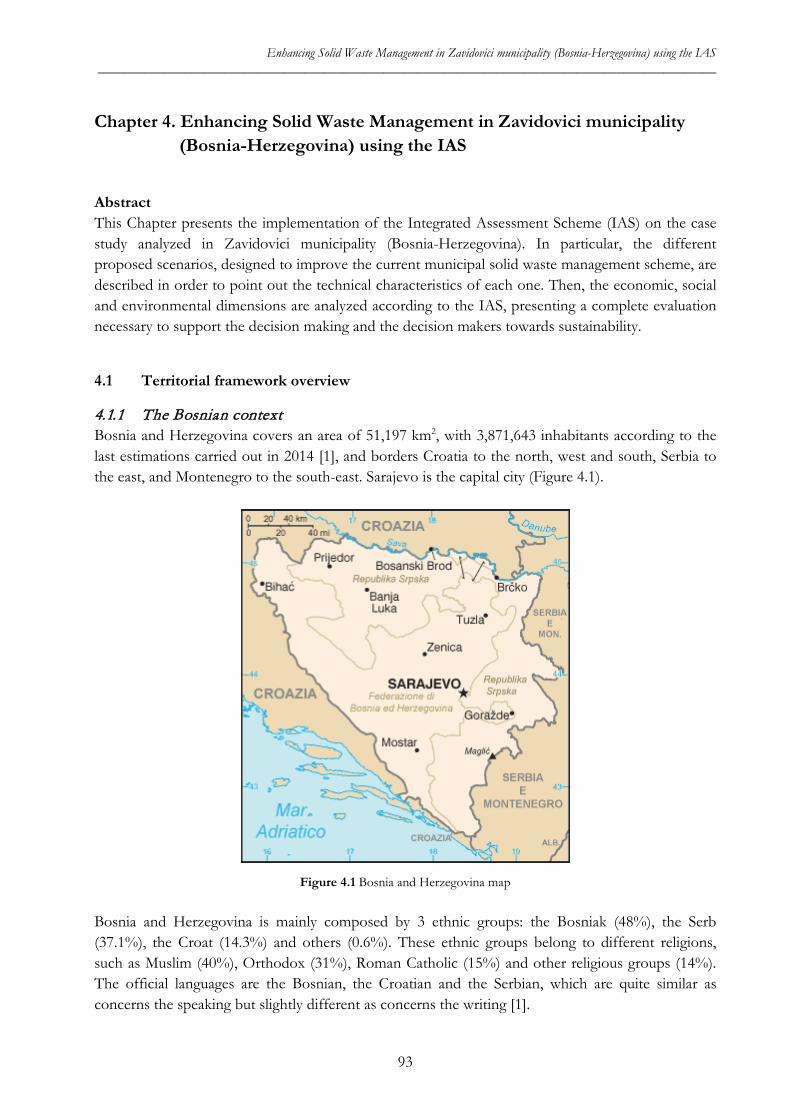
Enhancing Solid Waste Management in Zavidovici municipality (Bosnia-Herzegovina) using the IAS _____________________________________________________________________________________________
Chapter 4. Enhancing Solid Waste Management in Zavidovici municipality (Bosnia-Herzegovina) using the IAS
Abstract This Chapter presents the implementation of the Integrated Assessment Scheme (IAS) on the case study analyzed in Zavidovici municipality (Bosnia-Herzegovina). In particular, the different proposed scenarios, designed to improve the current municipal solid waste management scheme, are described in order to point out the technical characteristics of each one. Then, the economic, social and environmental dimensions are analyzed according to the IAS, presenting a complete evaluation necessary to support the decision making and the decision makers towards sustainability.
4.1 Territorial framework overview
4.1.1 The Bosnian context Bosnia and Herzegovina covers an area of 51,197 km2, with 3,871,643 inhabitants according to the last estimations carried out in 2014 [1], and borders Croatia to the north, west and south, Serbia to the east, and Montenegro to the south-east. Sarajevo is the capital city (Figure 4.1).
Figure 4.1 Bosnia and Herzegovina map
Bosnia and Herzegovina is mainly composed by 3 ethnic groups: the Bosniak (48%), the Serb (37.1%), the Croat (14.3%) and others (0.6%). These ethnic groups belong to different religions, such as Muslim (40%), Orthodox (31%), Roman Catholic (15%) and other religious groups (14%). The official languages are the Bosnian, the Croatian and the Serbian, which are quite similar as concerns the speaking but slightly different as concerns the writing [1].
93
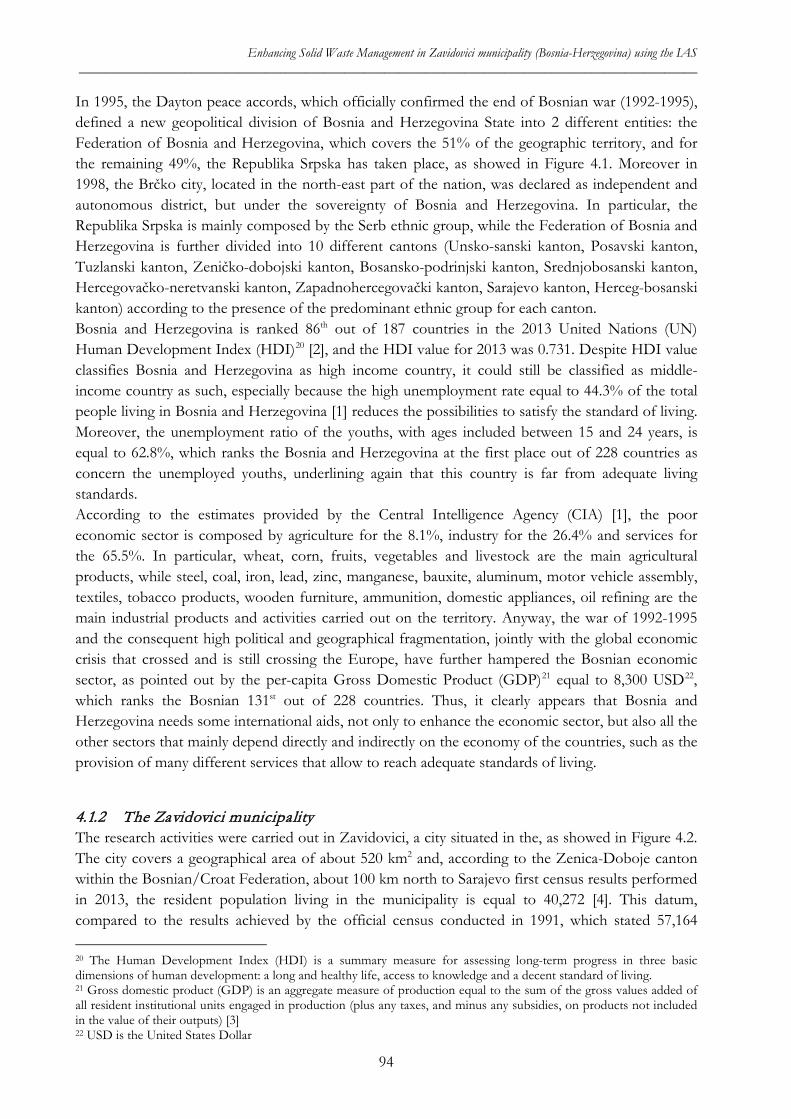
Enhancing Solid Waste Management in Zavidovici municipality (Bosnia-Herzegovina) using the IAS _____________________________________________________________________________________________
In 1995, the Dayton peace accords, which officially confirmed the end of Bosnian war (1992-1995), defined a new geopolitical division of Bosnia and Herzegovina State into 2 different entities: the Federation of Bosnia and Herzegovina, which covers the 51% of the geographic territory, and for the remaining 49%, the Republika Srpska has taken place, as showed in Figure 4.1. Moreover in 1998, the Brčko city, located in the north-east part of the nation, was declared as independent and autonomous district, but under the sovereignty of Bosnia and Herzegovina. In particular, the Republika Srpska is mainly composed by the Serb ethnic group, while the Federation of Bosnia and Herzegovina is further divided into 10 different cantons (Unsko-sanski kanton, Posavski kanton, Tuzlanski kanton, Zeničko-dobojski kanton, Bosansko-podrinjski kanton, Srednjobosanski kanton, Hercegovačko-neretvanski kanton, Zapadnohercegovački kanton, Sarajevo kanton, Herceg-bosanski kanton) according to the presence of the predominant ethnic group for each canton. Bosnia and Herzegovina is ranked 86th out of 187 countries in the 2013 United Nations (UN) Human Development Index (HDI)20 [2], and the HDI value for 2013 was 0.731. Despite HDI value classifies Bosnia and Herzegovina as high income country, it could still be classified as middle-income country as such, especially because the high unemployment rate equal to 44.3% of the total people living in Bosnia and Herzegovina [1] reduces the possibilities to satisfy the standard of living. Moreover, the unemployment ratio of the youths, with ages included between 15 and 24 years, is equal to 62.8%, which ranks the Bosnia and Herzegovina at the first place out of 228 countries as concern the unemployed youths, underlining again that this country is far from adequate living standards. According to the estimates provided by the Central Intelligence Agency (CIA) [1], the poor economic sector is composed by agriculture for the 8.1%, industry for the 26.4% and services for the 65.5%. In particular, wheat, corn, fruits, vegetables and livestock are the main agricultural products, while steel, coal, iron, lead, zinc, manganese, bauxite, aluminum, motor vehicle assembly, textiles, tobacco products, wooden furniture, ammunition, domestic appliances, oil refining are the main industrial products and activities carried out on the territory. Anyway, the war of 1992-1995 and the consequent high political and geographical fragmentation, jointly with the global economic crisis that crossed and is still crossing the Europe, have further hampered the Bosnian economic sector, as pointed out by the per-capita Gross Domestic Product (GDP)21 equal to 8,300 USD22, which ranks the Bosnian 131st out of 228 countries. Thus, it clearly appears that Bosnia and Herzegovina needs some international aids, not only to enhance the economic sector, but also all the other sectors that mainly depend directly and indirectly on the economy of the countries, such as the provision of many different services that allow to reach adequate standards of living.
4.1.2 The Zavidovici municipality The research activities were carried out in Zavidovici, a city situated in the, as showed in Figure 4.2. The city covers a geographical area of about 520 km2 and, according to the Zenica-Doboje canton within the Bosnian/Croat Federation, about 100 km north to Sarajevo first census results performed in 2013, the resident population living in the municipality is equal to 40,272 [4]. This datum, compared to the results achieved by the official census conducted in 1991, which stated 57,164
20 The Human Development Index (HDI) is a summary measure for assessing long-term progress in three basic dimensions of human development: a long and healthy life, access to knowledge and a decent standard of living. 21 Gross domestic product (GDP) is an aggregate measure of production equal to the sum of the gross values added of all resident institutional units engaged in production (plus any taxes, and minus any subsidies, on products not included in the value of their outputs) [3] 22 USD is the United States Dollar
94
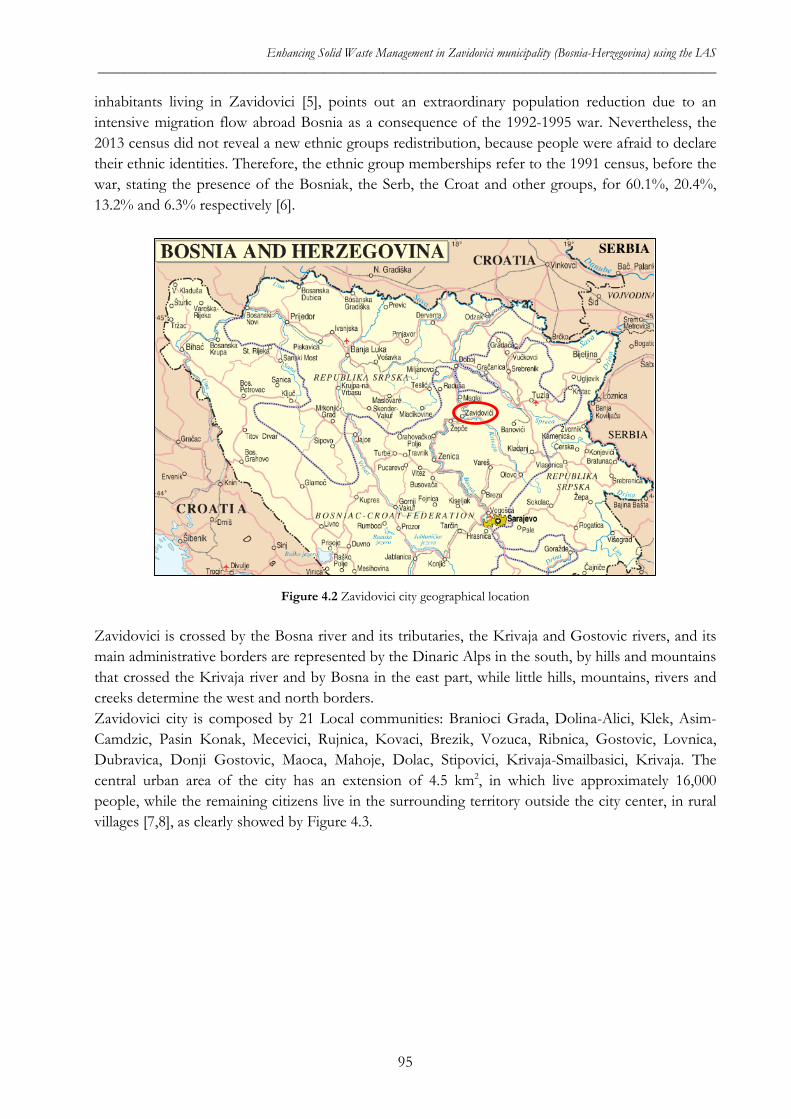
Enhancing Solid Waste Management in Zavidovici municipality (Bosnia-Herzegovina) using the IAS _____________________________________________________________________________________________
inhabitants living in Zavidovici [5], points out an extraordinary population reduction due to an intensive migration flow abroad Bosnia as a consequence of the 1992-1995 war. Nevertheless, the 2013 census did not reveal a new ethnic groups redistribution, because people were afraid to declare their ethnic identities. Therefore, the ethnic group memberships refer to the 1991 census, before the war, stating the presence of the Bosniak, the Serb, the Croat and other groups, for 60.1%, 20.4%, 13.2% and 6.3% respectively [6].
Figure 4.2 Zavidovici city geographical location
Zavidovici is crossed by the Bosna river and its tributaries, the Krivaja and Gostovic rivers, and its main administrative borders are represented by the Dinaric Alps in the south, by hills and mountains that crossed the Krivaja river and by Bosna in the east part, while little hills, mountains, rivers and creeks determine the west and north borders. Zavidovici city is composed by 21 Local communities: Branioci Grada, Dolina-Alici, Klek, Asim-Camdzic, Pasin Konak, Mecevici, Rujnica, Kovaci, Brezik, Vozuca, Ribnica, Gostovic, Lovnica, Dubravica, Donji Gostovic, Maoca, Mahoje, Dolac, Stipovici, Krivaja-Smailbasici, Krivaja. The central urban area of the city has an extension of 4.5 km2, in which live approximately 16,000 people, while the remaining citizens live in the surrounding territory outside the city center, in rural villages [7,8], as clearly showed by Figure 4.3.
95
Enhancing Solid Waste Management in Zavidovici municipality (Bosnia-Herzegovina) using the IAS _____________________________________________________________________________________________
Figure 4.3 Zavidovici municipal boarder (The urban city center circled in red)
The 1992-1995 war destroyed the socio-economic fabric, leaving Zavidovici in a critical situation, which currently is still persisting for the Municipality and all the inhabitants. Zavidovici city unemployment rate is equal to 55% [7, 8], higher than the one registered for Bosnia and Herzegovina (equal to 44.3% [1]). Moreover, the average monthly salary, approximately 400 KM23, about 200 €, is lower than the per-capita GDP in Bosnia and Herzegovina, equal to 8,300 USD per year [1]. The Krivaja enterprise represents the main industrial activity in Zavidovici, as concerns the wood manufacturing, but of course nowadays is going through a strong economic crisis as a consequence of the buildings destruction as well as the territorial redistribution due to the war. Even agriculture and land farming represent the main production activities, even though they have never had a role of primary importance, especially due to the mountainous land features and of course due to the war that destroyed building and equipment and made the land useless through the mines. Nevertheless, the high presence of forests and rivers allows hunting practices and also fish farming. Zavidovici city owns approximately 100 km of main streets and others 100 km of secondary roads that link the urban center to the 21 local communities. The drinking water distribution network in the Zavidovici municipality is not uniform over the municipal water system, which serves approximately 60% of the population, mostly concentrated in the urban and peri-urban area along the Gostovic river valley, where the water conducts are laid in order to transport water to the city [9]. The disposal of wastewaters represents a big issue in the Zavidovici territory, since there is not a complete drainage system; therefore, in most of the cases, wastewaters are directly discharged into the water body without any previous treatment. In the city center, there is a 25 km pipe network that constitutes the incomplete drainage system, but the collected wastewaters are however directly discharged into the closest water body. Anyway, many households have adopted the septic tank systems in order to avoid the direct wastewaters discharge into the environment, even if they represent temporary and incomplete solutions [9]. Even the waste management system represents a big issue from the environmental point of view, in particular because the Zavidovici collection service is not able to cover all the municipality territory, especially because many people live in villages in the rural context, far from the urban center and at the same time with improbable access way for the means of work. Moreover, the collected wastes are discharged into the city landfill,
23 KM (Konvertibilna Marka) is the official money of Bosnia and Herzegovina.
96
Enhancing Solid Waste Management in Zavidovici municipality (Bosnia-Herzegovina) using the IAS _____________________________________________________________________________________________
which is not properly managed, without any system for the leachate and biogas emissions collection, causing a serious environmental impact. Globally, it clearly appears that Zavidovici city is far from the complete living standards satisfaction from many different points of view, as aforementioned. Therefore, the research activities carried out in Zavidovici are aimed to improve the waste management system, enhancing at the same time the economic, social and environmental dimensions that compose the Zavidovici identity.
4.2 Scenario assessment in the Zavidovici municipality Zavidovici city presents several criticalities as concerns the municipal solid waste management. In particular, the lack of appropriate technologies, money, management skills and waste knowledge entails an inadequate waste management, which determines many different consequences from economic, environmental and social points of view. It clearly appears that the city needs to improve its waste management scheme in order to provide an adequate waste management service and consequently reducing the environmental and social impacts on the city and its inhabitants. Firstly, the proposed Integrated Assessment Scheme (IAS) was used in order to evaluate the current waste management system, considering all its related problems from the economic, environmental and social points of view. Then, different scenarios were set and designed in order to provide different waste management schemes. In particular, each scenario entails one different waste management solution. Consequently, each scenario was evaluated with the IAS in order to provide a future overview about possible implications and consequences for Zavidovici choosing a solution rather than another one. All the scenarios were proposed according to the data directly collected into the field, through direct observations and interviews to the main stakeholders of the Zavidovici community, and through the review of the already available secondary written sources. Globally, 10 scenarios were analyzed according to the proposed Integrated Assessment Scheme (IAS) from the economic, social and environmental points of view. The scenario named Z0 (Zavidovici “0”) represents the current waste management system in Zavidovici, while Z1, Z2, Z3, Z4, Z5, Z6, Z7, Z8, Z9 represent the proposed scenarios which, step by step (passing from Z1 to Z9), introduce some technical improvements in order to enhance the current waste management system. It is worth to underline that these proposed scenarios just consider the urban city center, which refers to 16,000 citizens. This choice was carried out aiming at easily and gradually working on the poor existing waste management scheme in a restricted area, avoiding extremely big interventions that are too much demanding to be managed, with a likely failure ratio. Therefore, it has been preferred to study on a small but feasible waste management model, which can be further extended and/or adapted to the remaining areas of Zavidovici.
4.2.1 Z0: mixed waste collection (Zavidovici landfill) The current municipal solid waste management service is provided by the local public utility “JKP Radnik”, which is partially controlled by the Municipality council of the city, but exclusively as concern administrative issues. The per-capita daily waste generation is equal to 0.7 kg per person per day, according to Vaccari et al. [5], and the average municipal solid waste composition of the city is reported in Table 4.1.
97
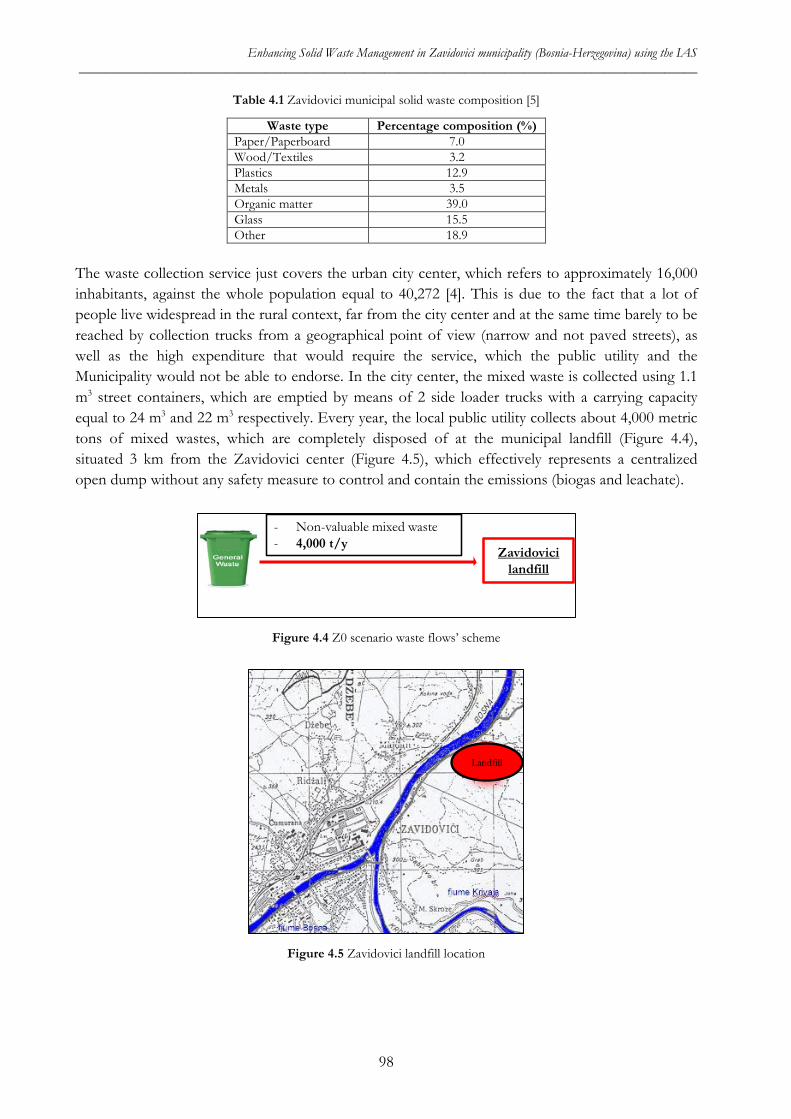
Enhancing Solid Waste Management in Zavidovici municipality (Bosnia-Herzegovina) using the IAS _____________________________________________________________________________________________
Table 4.1 Zavidovici municipal solid waste composition [5]
Waste type Percentage composition (%) Paper/Paperboard 7.0 Wood/Textiles 3.2 Plastics 12.9 Metals 3.5 Organic matter 39.0 Glass 15.5 Other 18.9
The waste collection service just covers the urban city center, which refers to approximately 16,000 inhabitants, against the whole population equal to 40,272 [4]. This is due to the fact that a lot of people live widespread in the rural context, far from the city center and at the same time barely to be reached by collection trucks from a geographical point of view (narrow and not paved streets), as well as the high expenditure that would require the service, which the public utility and the Municipality would not be able to endorse. In the city center, the mixed waste is collected using 1.1 m3 street containers, which are emptied by means of 2 side loader trucks with a carrying capacity equal to 24 m3 and 22 m3 respectively. Every year, the local public utility collects about 4,000 metric tons of mixed wastes, which are completely disposed of at the municipal landfill (Figure 4.4), situated 3 km from the Zavidovici center (Figure 4.5), which effectively represents a centralized open dump without any safety measure to control and contain the emissions (biogas and leachate).
Figure 4.4 Z0 scenario waste flows’ scheme
Figure 4.5 Zavidovici landfill location
Zavidovicilandfill
- Non-valuable mixed waste- 4,000 t/y
Landfill
98
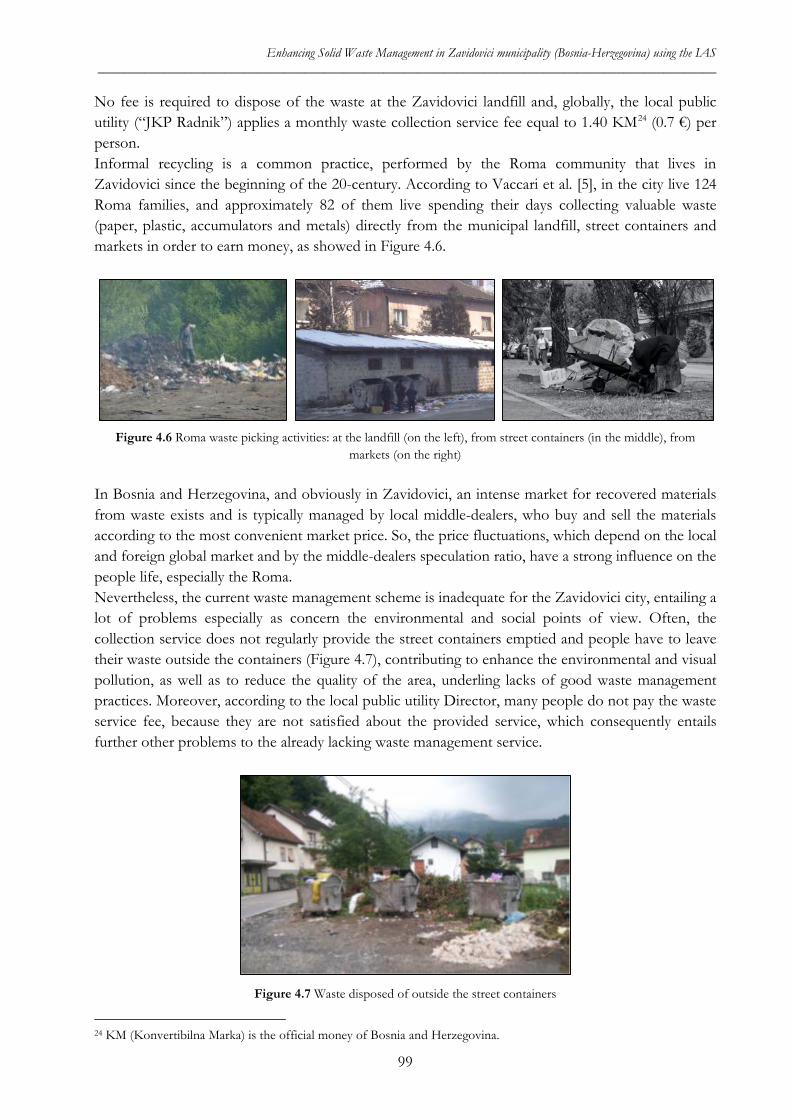
Enhancing Solid Waste Management in Zavidovici municipality (Bosnia-Herzegovina) using the IAS _____________________________________________________________________________________________
No fee is required to dispose of the waste at the Zavidovici landfill and, globally, the local public utility (“JKP Radnik”) applies a monthly waste collection service fee equal to 1.40 KM24 (0.7 €) per person. Informal recycling is a common practice, performed by the Roma community that lives in Zavidovici since the beginning of the 20-century. According to Vaccari et al. [5], in the city live 124 Roma families, and approximately 82 of them live spending their days collecting valuable waste (paper, plastic, accumulators and metals) directly from the municipal landfill, street containers and markets in order to earn money, as showed in Figure 4.6.
Figure 4.6 Roma waste picking activities: at the landfill (on the left), from street containers (in the middle), from
markets (on the right)
In Bosnia and Herzegovina, and obviously in Zavidovici, an intense market for recovered materials from waste exists and is typically managed by local middle-dealers, who buy and sell the materials according to the most convenient market price. So, the price fluctuations, which depend on the local and foreign global market and by the middle-dealers speculation ratio, have a strong influence on the people life, especially the Roma. Nevertheless, the current waste management scheme is inadequate for the Zavidovici city, entailing a lot of problems especially as concern the environmental and social points of view. Often, the collection service does not regularly provide the street containers emptied and people have to leave their waste outside the containers (Figure 4.7), contributing to enhance the environmental and visual pollution, as well as to reduce the quality of the area, underling lacks of good waste management practices. Moreover, according to the local public utility Director, many people do not pay the waste service fee, because they are not satisfied about the provided service, which consequently entails further other problems to the already lacking waste management service.
Figure 4.7 Waste disposed of outside the street containers
24 KM (Konvertibilna Marka) is the official money of Bosnia and Herzegovina.
99
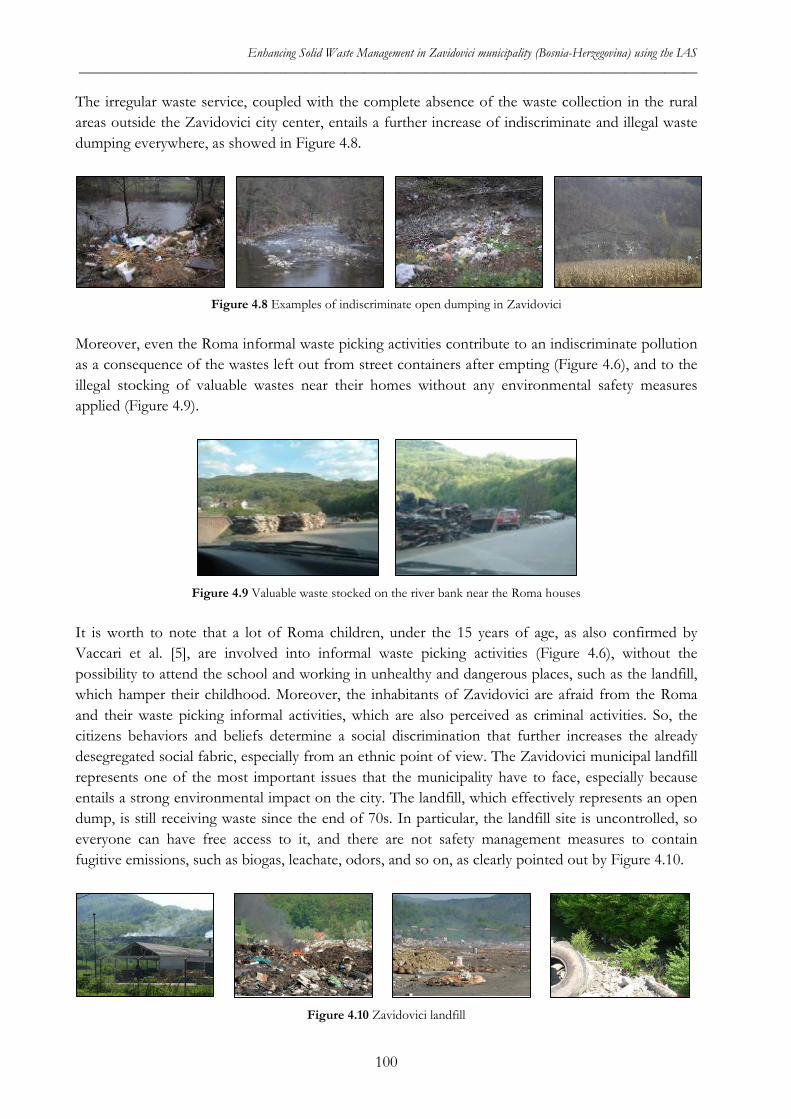
Enhancing Solid Waste Management in Zavidovici municipality (Bosnia-Herzegovina) using the IAS _____________________________________________________________________________________________
The irregular waste service, coupled with the complete absence of the waste collection in the rural areas outside the Zavidovici city center, entails a further increase of indiscriminate and illegal waste dumping everywhere, as showed in Figure 4.8.
Figure 4.8 Examples of indiscriminate open dumping in Zavidovici
Moreover, even the Roma informal waste picking activities contribute to an indiscriminate pollution as a consequence of the wastes left out from street containers after empting (Figure 4.6), and to the illegal stocking of valuable wastes near their homes without any environmental safety measures applied (Figure 4.9).
Figure 4.9 Valuable waste stocked on the river bank near the Roma houses
It is worth to note that a lot of Roma children, under the 15 years of age, as also confirmed by Vaccari et al. [5], are involved into informal waste picking activities (Figure 4.6), without the possibility to attend the school and working in unhealthy and dangerous places, such as the landfill, which hamper their childhood. Moreover, the inhabitants of Zavidovici are afraid from the Roma and their waste picking informal activities, which are also perceived as criminal activities. So, the citizens behaviors and beliefs determine a social discrimination that further increases the already desegregated social fabric, especially from an ethnic point of view. The Zavidovici municipal landfill represents one of the most important issues that the municipality have to face, especially because entails a strong environmental impact on the city. The landfill, which effectively represents an open dump, is still receiving waste since the end of 70s. In particular, the landfill site is uncontrolled, so everyone can have free access to it, and there are not safety management measures to contain fugitive emissions, such as biogas, leachate, odors, and so on, as clearly pointed out by Figure 4.10.
Figure 4.10 Zavidovici landfill
100
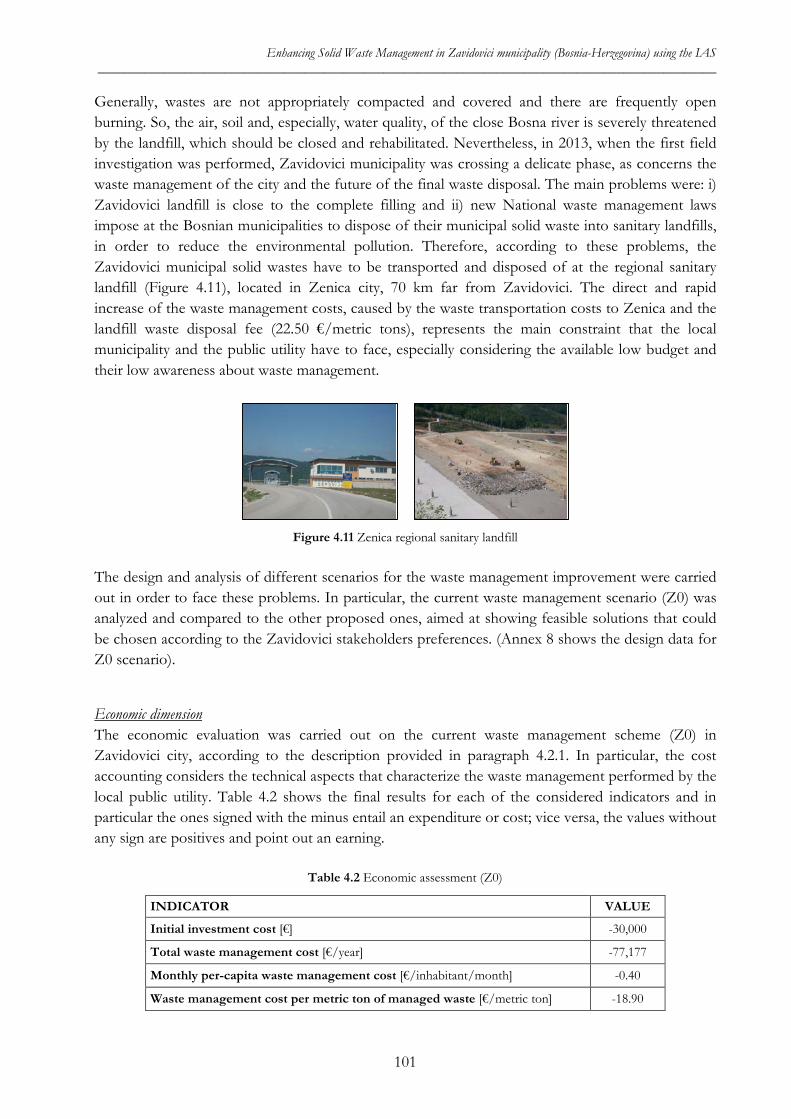
Enhancing Solid Waste Management in Zavidovici municipality (Bosnia-Herzegovina) using the IAS _____________________________________________________________________________________________
Generally, wastes are not appropriately compacted and covered and there are frequently open burning. So, the air, soil and, especially, water quality, of the close Bosna river is severely threatened by the landfill, which should be closed and rehabilitated. Nevertheless, in 2013, when the first field investigation was performed, Zavidovici municipality was crossing a delicate phase, as concerns the waste management of the city and the future of the final waste disposal. The main problems were: i) Zavidovici landfill is close to the complete filling and ii) new National waste management laws impose at the Bosnian municipalities to dispose of their municipal solid waste into sanitary landfills, in order to reduce the environmental pollution. Therefore, according to these problems, the Zavidovici municipal solid wastes have to be transported and disposed of at the regional sanitary landfill (Figure 4.11), located in Zenica city, 70 km far from Zavidovici. The direct and rapid increase of the waste management costs, caused by the waste transportation costs to Zenica and the landfill waste disposal fee (22.50 €/metric tons), represents the main constraint that the local municipality and the public utility have to face, especially considering the available low budget and their low awareness about waste management.
Figure 4.11 Zenica regional sanitary landfill
The design and analysis of different scenarios for the waste management improvement were carried out in order to face these problems. In particular, the current waste management scenario (Z0) was analyzed and compared to the other proposed ones, aimed at showing feasible solutions that could be chosen according to the Zavidovici stakeholders preferences. (Annex 8 shows the design data for Z0 scenario).
Economic dimension The economic evaluation was carried out on the current waste management scheme (Z0) in Zavidovici city, according to the description provided in paragraph 4.2.1. In particular, the cost accounting considers the technical aspects that characterize the waste management performed by the local public utility. Table 4.2 shows the final results for each of the considered indicators and in particular the ones signed with the minus entail an expenditure or cost; vice versa, the values without any sign are positives and point out an earning.
Table 4.2 Economic assessment (Z0)
INDICATOR VALUE
Initial investment cost [€] -30,000
Total waste management cost [€/year] -77,177
Monthly per-capita waste management cost [€/inhabitant/month] -0.40
Waste management cost per metric ton of managed waste [€/metric ton] -18.90
101
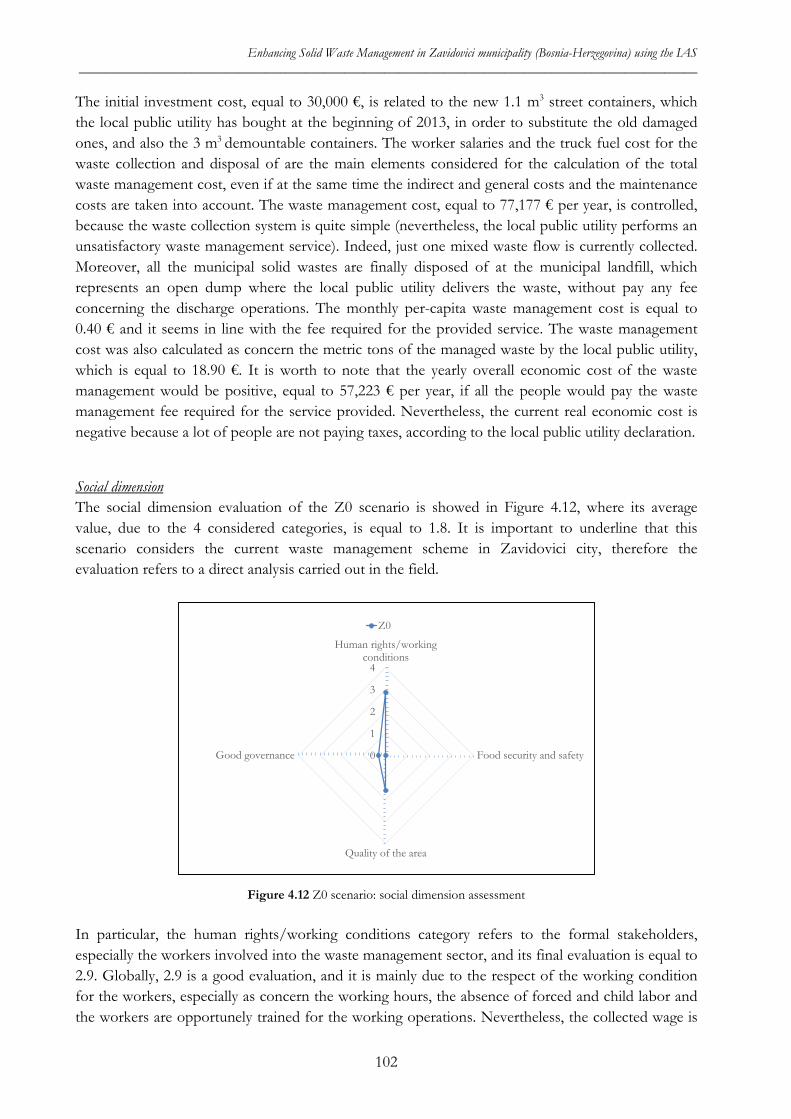
Enhancing Solid Waste Management in Zavidovici municipality (Bosnia-Herzegovina) using the IAS _____________________________________________________________________________________________
The initial investment cost, equal to 30,000 €, is related to the new 1.1 m3 street containers, which the local public utility has bought at the beginning of 2013, in order to substitute the old damaged ones, and also the 3 m3 demountable containers. The worker salaries and the truck fuel cost for the waste collection and disposal of are the main elements considered for the calculation of the total waste management cost, even if at the same time the indirect and general costs and the maintenance costs are taken into account. The waste management cost, equal to 77,177 € per year, is controlled, because the waste collection system is quite simple (nevertheless, the local public utility performs an unsatisfactory waste management service). Indeed, just one mixed waste flow is currently collected. Moreover, all the municipal solid wastes are finally disposed of at the municipal landfill, which represents an open dump where the local public utility delivers the waste, without pay any fee concerning the discharge operations. The monthly per-capita waste management cost is equal to 0.40 € and it seems in line with the fee required for the provided service. The waste management cost was also calculated as concern the metric tons of the managed waste by the local public utility, which is equal to 18.90 €. It is worth to note that the yearly overall economic cost of the waste management would be positive, equal to 57,223 € per year, if all the people would pay the waste management fee required for the service provided. Nevertheless, the current real economic cost is negative because a lot of people are not paying taxes, according to the local public utility declaration.
Social dimension The social dimension evaluation of the Z0 scenario is showed in Figure 4.12, where its average value, due to the 4 considered categories, is equal to 1.8. It is important to underline that this scenario considers the current waste management scheme in Zavidovici city, therefore the evaluation refers to a direct analysis carried out in the field.
Figure 4.12 Z0 scenario: social dimension assessment
In particular, the human rights/working conditions category refers to the formal stakeholders, especially the workers involved into the waste management sector, and its final evaluation is equal to 2.9. Globally, 2.9 is a good evaluation, and it is mainly due to the respect of the working condition for the workers, especially as concern the working hours, the absence of forced and child labor and the workers are opportunely trained for the working operations. Nevertheless, the collected wage is
0
1
2
3
4
Human rights/workingconditions
Food security and safety
Quality of the area
Good governance
Z0
102
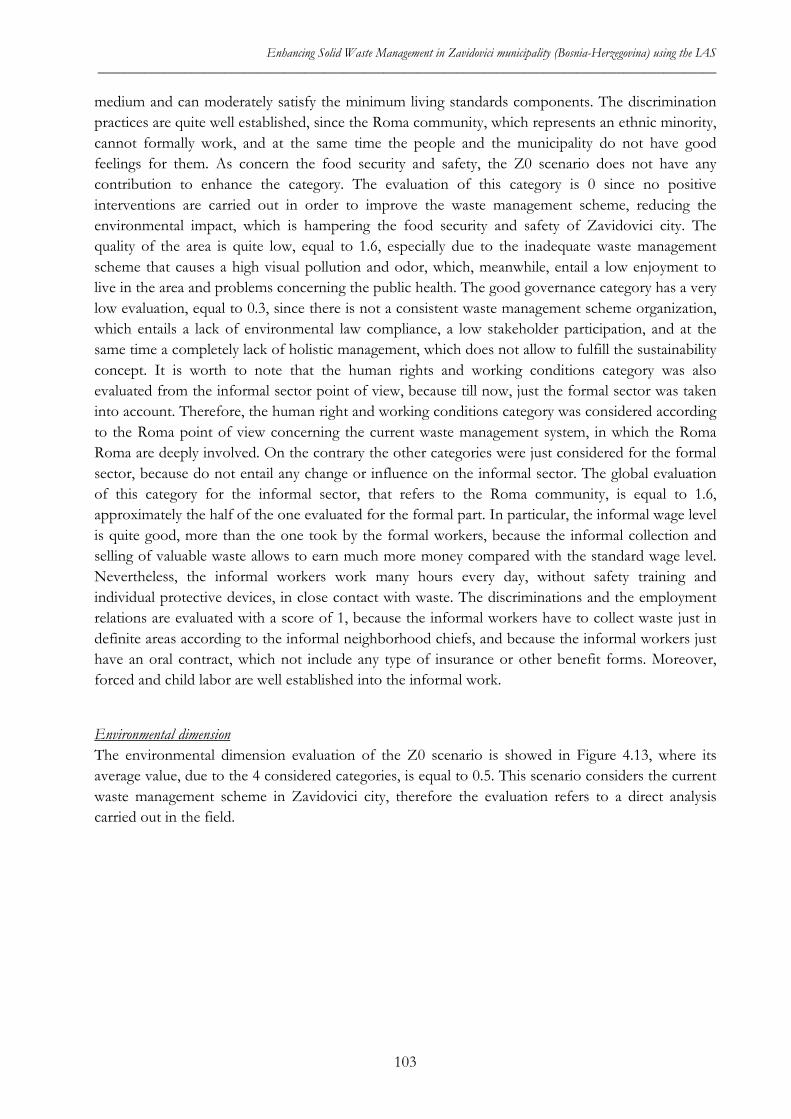
Enhancing Solid Waste Management in Zavidovici municipality (Bosnia-Herzegovina) using the IAS _____________________________________________________________________________________________
medium and can moderately satisfy the minimum living standards components. The discrimination practices are quite well established, since the Roma community, which represents an ethnic minority, cannot formally work, and at the same time the people and the municipality do not have good feelings for them. As concern the food security and safety, the Z0 scenario does not have any contribution to enhance the category. The evaluation of this category is 0 since no positive interventions are carried out in order to improve the waste management scheme, reducing the environmental impact, which is hampering the food security and safety of Zavidovici city. The quality of the area is quite low, equal to 1.6, especially due to the inadequate waste management scheme that causes a high visual pollution and odor, which, meanwhile, entail a low enjoyment to live in the area and problems concerning the public health. The good governance category has a very low evaluation, equal to 0.3, since there is not a consistent waste management scheme organization, which entails a lack of environmental law compliance, a low stakeholder participation, and at the same time a completely lack of holistic management, which does not allow to fulfill the sustainability concept. It is worth to note that the human rights and working conditions category was also evaluated from the informal sector point of view, because till now, just the formal sector was taken into account. Therefore, the human right and working conditions category was considered according to the Roma point of view concerning the current waste management system, in which the Roma Roma are deeply involved. On the contrary the other categories were just considered for the formal sector, because do not entail any change or influence on the informal sector. The global evaluation of this category for the informal sector, that refers to the Roma community, is equal to 1.6, approximately the half of the one evaluated for the formal part. In particular, the informal wage level is quite good, more than the one took by the formal workers, because the informal collection and selling of valuable waste allows to earn much more money compared with the standard wage level. Nevertheless, the informal workers work many hours every day, without safety training and individual protective devices, in close contact with waste. The discriminations and the employment relations are evaluated with a score of 1, because the informal workers have to collect waste just in definite areas according to the informal neighborhood chiefs, and because the informal workers just have an oral contract, which not include any type of insurance or other benefit forms. Moreover, forced and child labor are well established into the informal work.
Environmental dimension The environmental dimension evaluation of the Z0 scenario is showed in Figure 4.13, where its average value, due to the 4 considered categories, is equal to 0.5. This scenario considers the current waste management scheme in Zavidovici city, therefore the evaluation refers to a direct analysis carried out in the field.
103
Enhancing Solid Waste Management in Zavidovici municipality (Bosnia-Herzegovina) using the IAS _____________________________________________________________________________________________
Figure 4.13 Z0 scenario: environmental dimension assessment
The overall environmental evaluation of the Z0 scenario is very low. In particular, Figure 4.13 points out that the provisioning services and the air quality evaluation are equal to 0, because the current waste management scheme has a high negative environmental impact on the ecosystem of the city. One of the worst aspects involves the quality of the air, due to the high amount of gaseous emissions caused by the Zavidovici landfill, the presence of many uncontrolled fires and waste piles that are not properly and regularly covered. The water quality dimension evaluation is equal to 1, which means that there is an intensive pollution of the water resources, mainly caused by the Zavidovici landfill and its leachate production, as well as the indiscriminate open dumping near the rivers that cross the city center. Nevertheless, the impact caused by the waste mismanagement in the water sources is slightly lower than the one caused on the air quality category, as already stated. As concerns the soil quality category, the evaluation provided a value equal to 0.6, less than the water quality one, because besides the high impact originated by the landfill and the waste dumped everywhere, this scenario does not have any positive contribution to enhance the soil quality and formation and the soil erosion. Therefore, in this way, the waste mismanagement has a slightly higher impact on the soil than the one in the water sources, even if the pollution is still very high.
4.2.2 Z1: door to door waste collection (Zavidovici landfill) This scenario represents a first upgrade of the Z0 one. The main objective of this scenario is to reorganize the waste management collection in the urban city center, recovering the secondary raw materials from the urban waste, and at the same time, reducing the environmental burden in the city. In particular, separated door-to-door waste collection is proposed in order to recover paper/paperboard, plastic and metal materials that can consequently be sold onto the local market. In this way, it is possible to cover the waste management expenditures and at the same time to reduce the amount of waste disposed of at the Zavidovici landfill, decreasing, in part, the environmental burden in the city. Z1 scenario represents a sort of temporary solution, waiting the phase in which the municipality will officially start to dispose of the municipal waste to the regional sanitary landfill in Zenica. Nevertheless, this scenario represents a good solution in order to improve the waste management scheme and the holistic management of the local public utility, contributing to reduce the environmental impact, even in the case that, for different technical, economic and administrative reasons, wastes transport to Zenica would not be possible within a further long period of time.
0
1
2
3
4Provisioning services
Air quality
Water quality
Soil quality
Z0
104
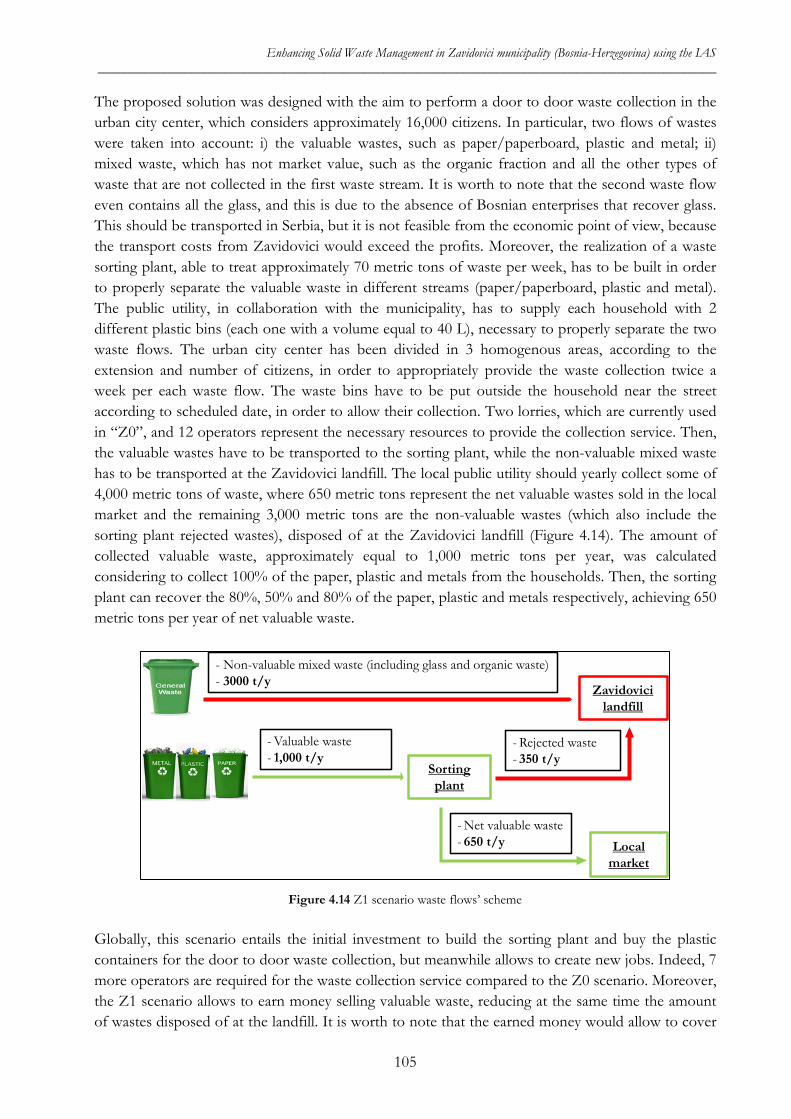
Enhancing Solid Waste Management in Zavidovici municipality (Bosnia-Herzegovina) using the IAS _____________________________________________________________________________________________
The proposed solution was designed with the aim to perform a door to door waste collection in the urban city center, which considers approximately 16,000 citizens. In particular, two flows of wastes were taken into account: i) the valuable wastes, such as paper/paperboard, plastic and metal; ii) mixed waste, which has not market value, such as the organic fraction and all the other types of waste that are not collected in the first waste stream. It is worth to note that the second waste flow even contains all the glass, and this is due to the absence of Bosnian enterprises that recover glass. This should be transported in Serbia, but it is not feasible from the economic point of view, because the transport costs from Zavidovici would exceed the profits. Moreover, the realization of a waste sorting plant, able to treat approximately 70 metric tons of waste per week, has to be built in order to properly separate the valuable waste in different streams (paper/paperboard, plastic and metal). The public utility, in collaboration with the municipality, has to supply each household with 2 different plastic bins (each one with a volume equal to 40 L), necessary to properly separate the two waste flows. The urban city center has been divided in 3 homogenous areas, according to the extension and number of citizens, in order to appropriately provide the waste collection twice a week per each waste flow. The waste bins have to be put outside the household near the street according to scheduled date, in order to allow their collection. Two lorries, which are currently used in “Z0”, and 12 operators represent the necessary resources to provide the collection service. Then, the valuable wastes have to be transported to the sorting plant, while the non-valuable mixed waste has to be transported at the Zavidovici landfill. The local public utility should yearly collect some of 4,000 metric tons of waste, where 650 metric tons represent the net valuable wastes sold in the local market and the remaining 3,000 metric tons are the non-valuable wastes (which also include the sorting plant rejected wastes), disposed of at the Zavidovici landfill (Figure 4.14). The amount of collected valuable waste, approximately equal to 1,000 metric tons per year, was calculated considering to collect 100% of the paper, plastic and metals from the households. Then, the sorting plant can recover the 80%, 50% and 80% of the paper, plastic and metals respectively, achieving 650 metric tons per year of net valuable waste.
Figure 4.14 Z1 scenario waste flows’ scheme
Globally, this scenario entails the initial investment to build the sorting plant and buy the plastic containers for the door to door waste collection, but meanwhile allows to create new jobs. Indeed, 7 more operators are required for the waste collection service compared to the Z0 scenario. Moreover, the Z1 scenario allows to earn money selling valuable waste, reducing at the same time the amount of wastes disposed of at the landfill. It is worth to note that the earned money would allow to cover
Zavidovicilandfill
Sorting plant
- Non-valuable mixed waste (including glass and organic waste)- 3000 t/y
- Valuable waste - 1,000 t/y
- Rejected waste - 350 t/y
Local market
- Net valuable waste - 650 t/y
105
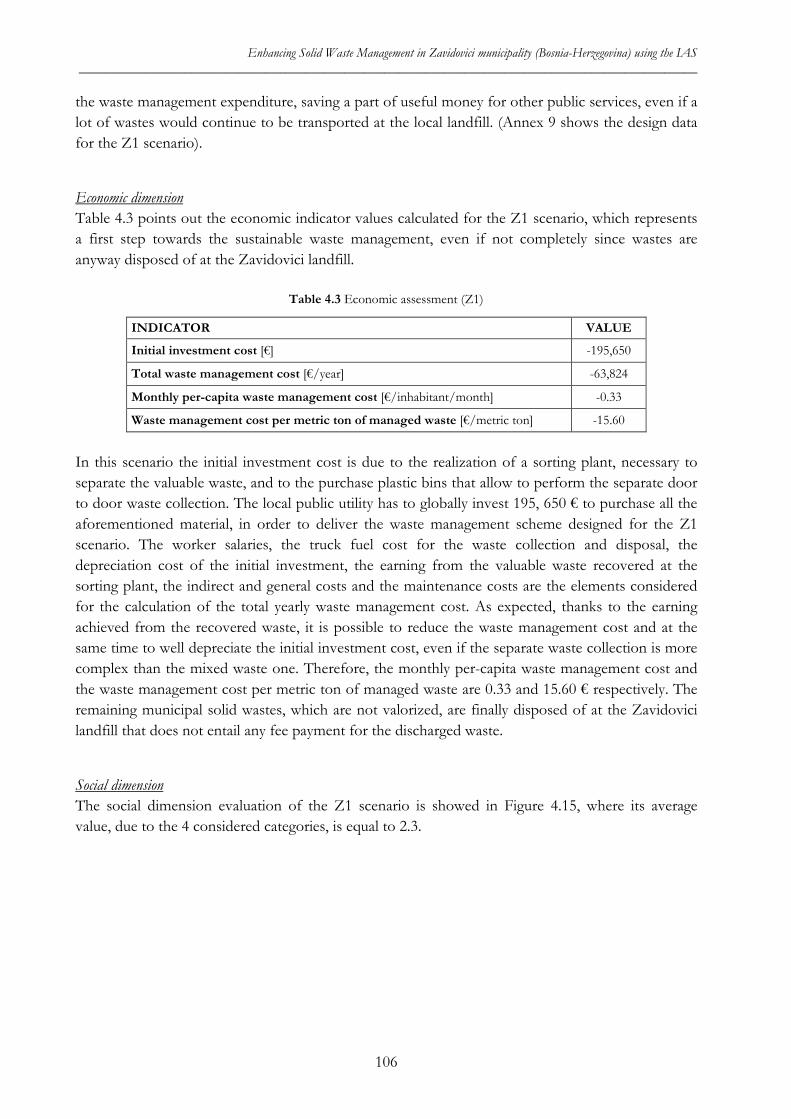
Enhancing Solid Waste Management in Zavidovici municipality (Bosnia-Herzegovina) using the IAS _____________________________________________________________________________________________
the waste management expenditure, saving a part of useful money for other public services, even if a lot of wastes would continue to be transported at the local landfill. (Annex 9 shows the design data for the Z1 scenario).
Economic dimension Table 4.3 points out the economic indicator values calculated for the Z1 scenario, which represents a first step towards the sustainable waste management, even if not completely since wastes are anyway disposed of at the Zavidovici landfill.
Table 4.3 Economic assessment (Z1)
INDICATOR VALUE
Initial investment cost [€] -195,650
Total waste management cost [€/year] -63,824
Monthly per-capita waste management cost [€/inhabitant/month] -0.33
Waste management cost per metric ton of managed waste [€/metric ton] -15.60
In this scenario the initial investment cost is due to the realization of a sorting plant, necessary to separate the valuable waste, and to the purchase plastic bins that allow to perform the separate door to door waste collection. The local public utility has to globally invest 195, 650 € to purchase all the aforementioned material, in order to deliver the waste management scheme designed for the Z1 scenario. The worker salaries, the truck fuel cost for the waste collection and disposal, the depreciation cost of the initial investment, the earning from the valuable waste recovered at the sorting plant, the indirect and general costs and the maintenance costs are the elements considered for the calculation of the total yearly waste management cost. As expected, thanks to the earning achieved from the recovered waste, it is possible to reduce the waste management cost and at the same time to well depreciate the initial investment cost, even if the separate waste collection is more complex than the mixed waste one. Therefore, the monthly per-capita waste management cost and the waste management cost per metric ton of managed waste are 0.33 and 15.60 € respectively. The remaining municipal solid wastes, which are not valorized, are finally disposed of at the Zavidovici landfill that does not entail any fee payment for the discharged waste.
Social dimension The social dimension evaluation of the Z1 scenario is showed in Figure 4.15, where its average value, due to the 4 considered categories, is equal to 2.3.
106
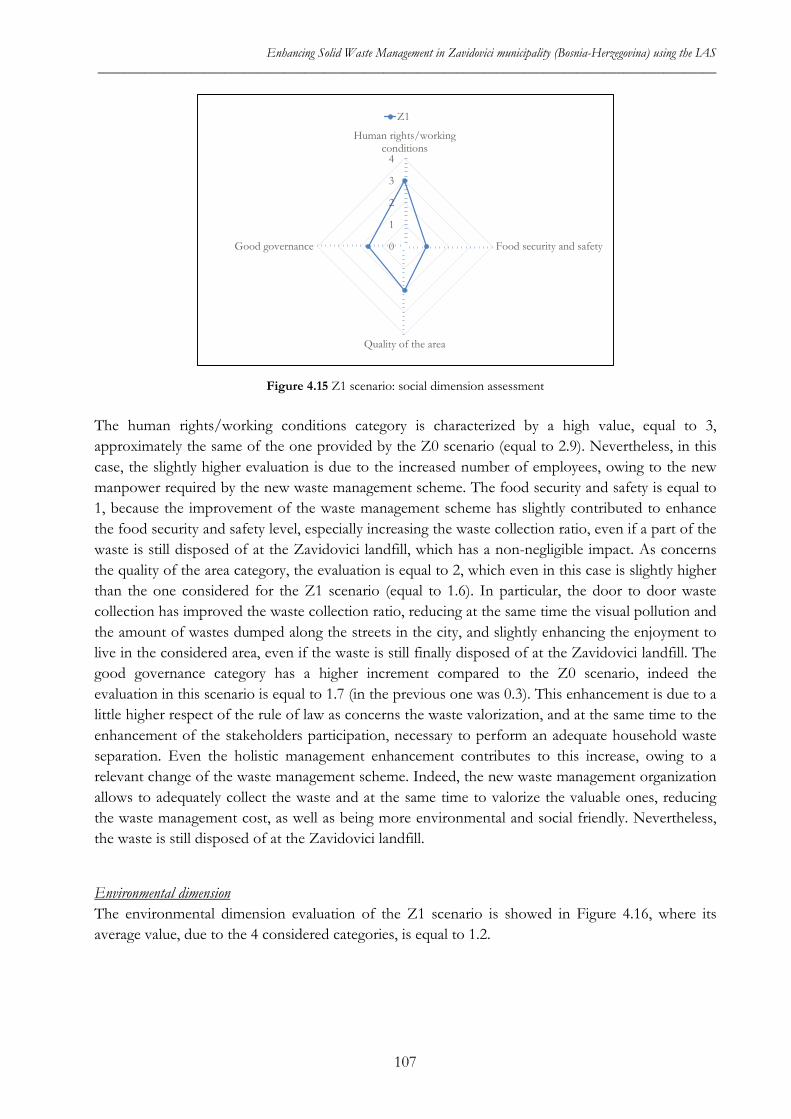
Enhancing Solid Waste Management in Zavidovici municipality (Bosnia-Herzegovina) using the IAS _____________________________________________________________________________________________
Figure 4.15 Z1 scenario: social dimension assessment
The human rights/working conditions category is characterized by a high value, equal to 3, approximately the same of the one provided by the Z0 scenario (equal to 2.9). Nevertheless, in this case, the slightly higher evaluation is due to the increased number of employees, owing to the new manpower required by the new waste management scheme. The food security and safety is equal to 1, because the improvement of the waste management scheme has slightly contributed to enhance the food security and safety level, especially increasing the waste collection ratio, even if a part of the waste is still disposed of at the Zavidovici landfill, which has a non-negligible impact. As concerns the quality of the area category, the evaluation is equal to 2, which even in this case is slightly higher than the one considered for the Z1 scenario (equal to 1.6). In particular, the door to door waste collection has improved the waste collection ratio, reducing at the same time the visual pollution and the amount of wastes dumped along the streets in the city, and slightly enhancing the enjoyment to live in the considered area, even if the waste is still finally disposed of at the Zavidovici landfill. The good governance category has a higher increment compared to the Z0 scenario, indeed the evaluation in this scenario is equal to 1.7 (in the previous one was 0.3). This enhancement is due to a little higher respect of the rule of law as concerns the waste valorization, and at the same time to the enhancement of the stakeholders participation, necessary to perform an adequate household waste separation. Even the holistic management enhancement contributes to this increase, owing to a relevant change of the waste management scheme. Indeed, the new waste management organization allows to adequately collect the waste and at the same time to valorize the valuable ones, reducing the waste management cost, as well as being more environmental and social friendly. Nevertheless, the waste is still disposed of at the Zavidovici landfill.
Environmental dimension The environmental dimension evaluation of the Z1 scenario is showed in Figure 4.16, where its average value, due to the 4 considered categories, is equal to 1.2.
0
1
2
3
4
Human rights/workingconditions
Food security and safety
Quality of the area
Good governance
Z1
107
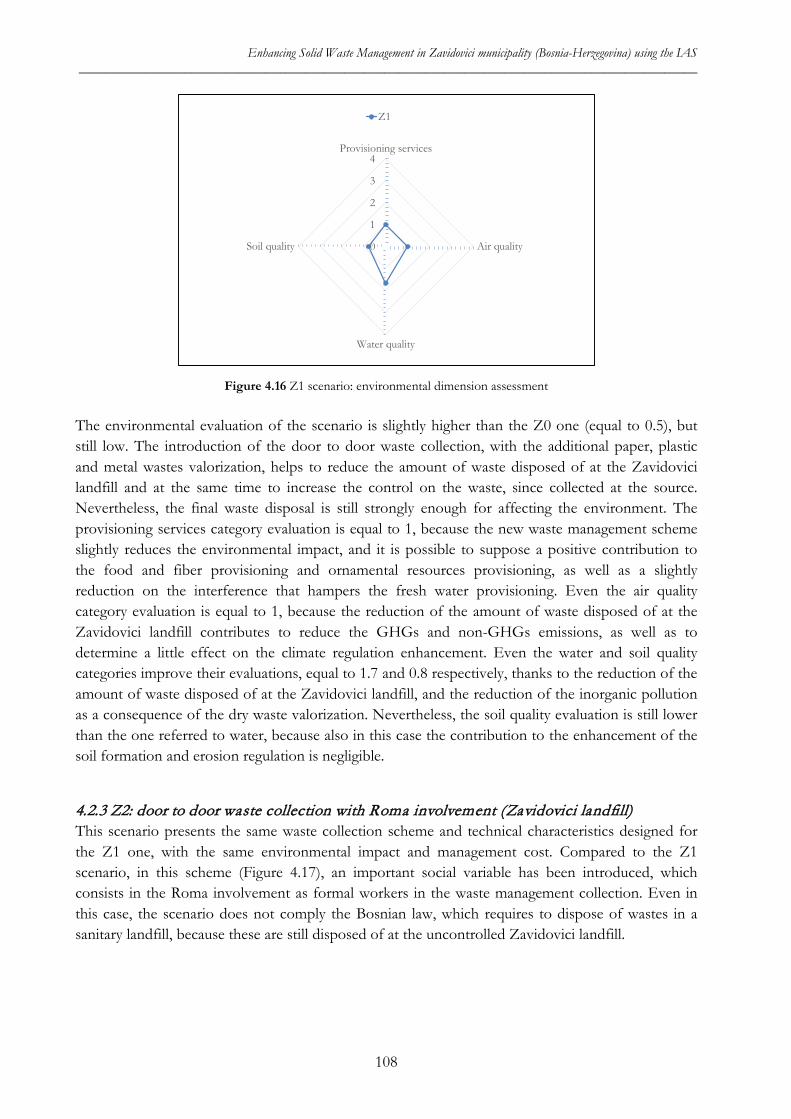
Enhancing Solid Waste Management in Zavidovici municipality (Bosnia-Herzegovina) using the IAS _____________________________________________________________________________________________
Figure 4.16 Z1 scenario: environmental dimension assessment
The environmental evaluation of the scenario is slightly higher than the Z0 one (equal to 0.5), but still low. The introduction of the door to door waste collection, with the additional paper, plastic and metal wastes valorization, helps to reduce the amount of waste disposed of at the Zavidovici landfill and at the same time to increase the control on the waste, since collected at the source. Nevertheless, the final waste disposal is still strongly enough for affecting the environment. The provisioning services category evaluation is equal to 1, because the new waste management scheme slightly reduces the environmental impact, and it is possible to suppose a positive contribution to the food and fiber provisioning and ornamental resources provisioning, as well as a slightly reduction on the interference that hampers the fresh water provisioning. Even the air quality category evaluation is equal to 1, because the reduction of the amount of waste disposed of at the Zavidovici landfill contributes to reduce the GHGs and non-GHGs emissions, as well as to determine a little effect on the climate regulation enhancement. Even the water and soil quality categories improve their evaluations, equal to 1.7 and 0.8 respectively, thanks to the reduction of the amount of waste disposed of at the Zavidovici landfill, and the reduction of the inorganic pollution as a consequence of the dry waste valorization. Nevertheless, the soil quality evaluation is still lower than the one referred to water, because also in this case the contribution to the enhancement of the soil formation and erosion regulation is negligible.
4.2.3 Z2: door to door waste collection with Roma involvement (Zavidovici landfill) This scenario presents the same waste collection scheme and technical characteristics designed for the Z1 one, with the same environmental impact and management cost. Compared to the Z1 scenario, in this scheme (Figure 4.17), an important social variable has been introduced, which consists in the Roma involvement as formal workers in the waste management collection. Even in this case, the scenario does not comply the Bosnian law, which requires to dispose of wastes in a sanitary landfill, because these are still disposed of at the uncontrolled Zavidovici landfill.
0
1
2
3
4Provisioning services
Air quality
Water quality
Soil quality
Z1
108
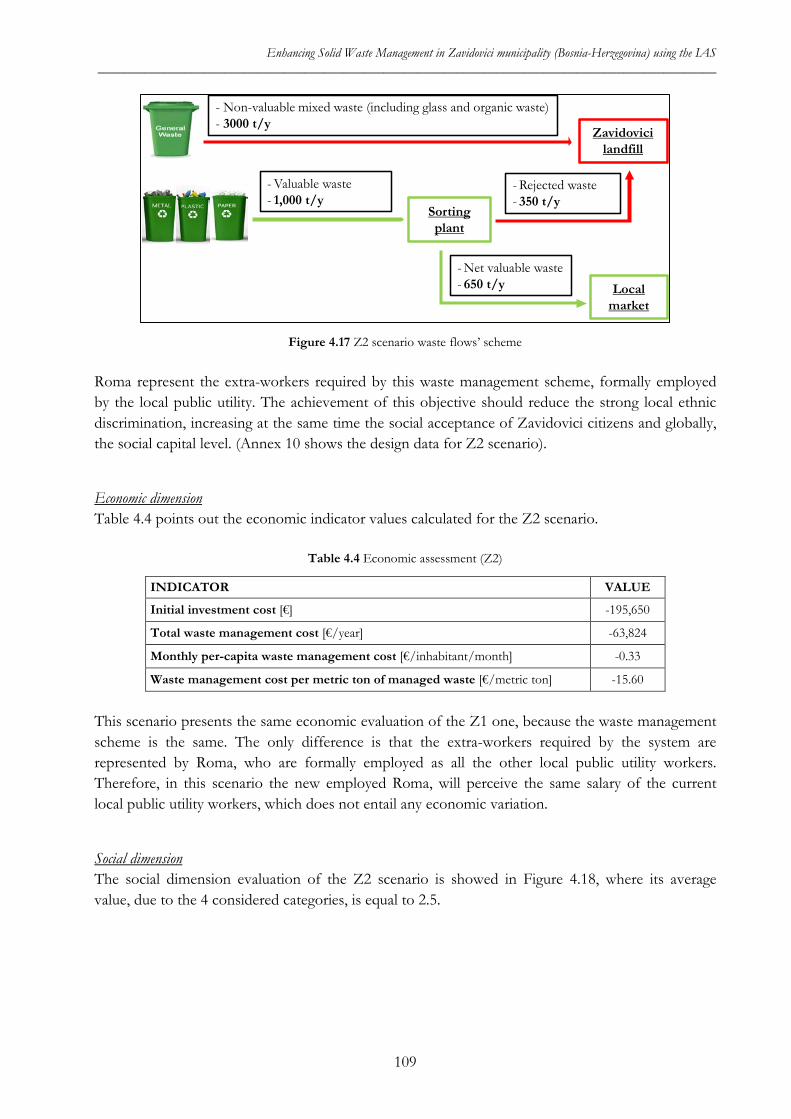
Enhancing Solid Waste Management in Zavidovici municipality (Bosnia-Herzegovina) using the IAS _____________________________________________________________________________________________
Figure 4.17 Z2 scenario waste flows’ scheme
Roma represent the extra-workers required by this waste management scheme, formally employed by the local public utility. The achievement of this objective should reduce the strong local ethnic discrimination, increasing at the same time the social acceptance of Zavidovici citizens and globally, the social capital level. (Annex 10 shows the design data for Z2 scenario).
Economic dimension Table 4.4 points out the economic indicator values calculated for the Z2 scenario.
Table 4.4 Economic assessment (Z2)
INDICATOR VALUE
Initial investment cost [€] -195,650
Total waste management cost [€/year] -63,824
Monthly per-capita waste management cost [€/inhabitant/month] -0.33
Waste management cost per metric ton of managed waste [€/metric ton] -15.60
This scenario presents the same economic evaluation of the Z1 one, because the waste management scheme is the same. The only difference is that the extra-workers required by the system are represented by Roma, who are formally employed as all the other local public utility workers. Therefore, in this scenario the new employed Roma, will perceive the same salary of the current local public utility workers, which does not entail any economic variation.
Social dimension The social dimension evaluation of the Z2 scenario is showed in Figure 4.18, where its average value, due to the 4 considered categories, is equal to 2.5.
Zavidovicilandfill
Sorting plant
- Non-valuable mixed waste (including glass and organic waste)- 3000 t/y
- Valuable waste - 1,000 t/y
- Rejected waste - 350 t/y
Local market
- Net valuable waste - 650 t/y
109
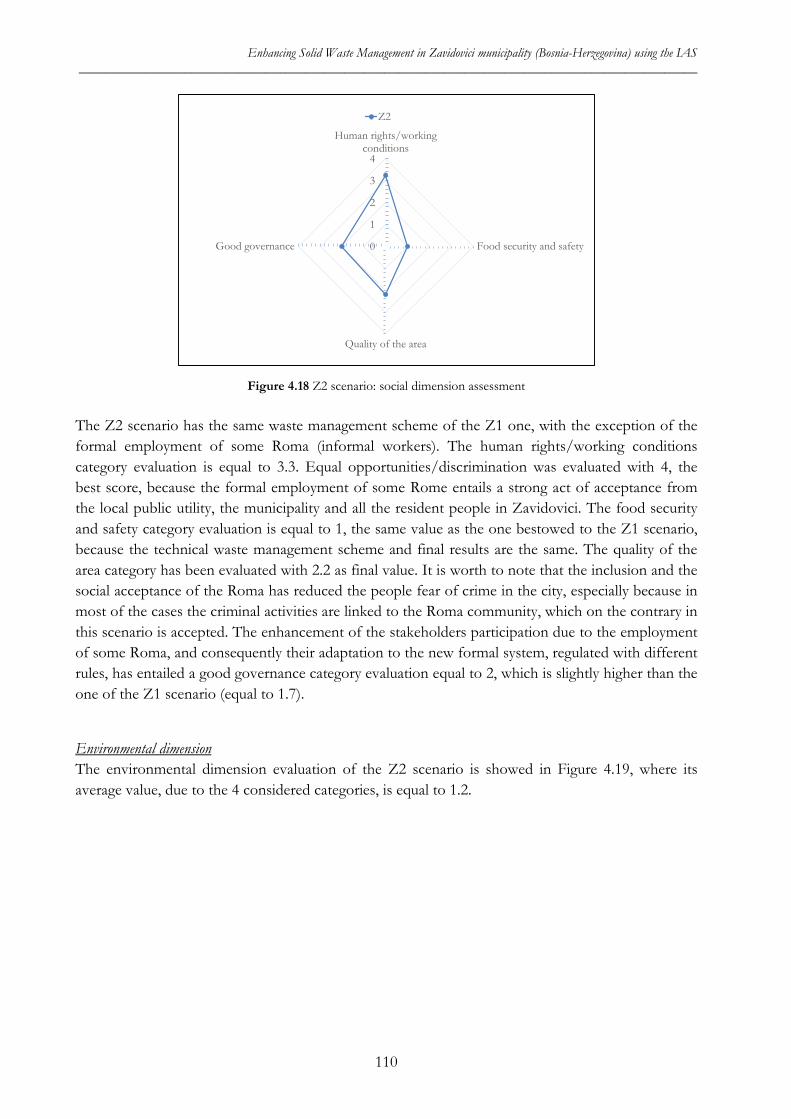
Enhancing Solid Waste Management in Zavidovici municipality (Bosnia-Herzegovina) using the IAS _____________________________________________________________________________________________
Figure 4.18 Z2 scenario: social dimension assessment
The Z2 scenario has the same waste management scheme of the Z1 one, with the exception of the formal employment of some Roma (informal workers). The human rights/working conditions category evaluation is equal to 3.3. Equal opportunities/discrimination was evaluated with 4, the best score, because the formal employment of some Rome entails a strong act of acceptance from the local public utility, the municipality and all the resident people in Zavidovici. The food security and safety category evaluation is equal to 1, the same value as the one bestowed to the Z1 scenario, because the technical waste management scheme and final results are the same. The quality of the area category has been evaluated with 2.2 as final value. It is worth to note that the inclusion and the social acceptance of the Roma has reduced the people fear of crime in the city, especially because in most of the cases the criminal activities are linked to the Roma community, which on the contrary in this scenario is accepted. The enhancement of the stakeholders participation due to the employment of some Roma, and consequently their adaptation to the new formal system, regulated with different rules, has entailed a good governance category evaluation equal to 2, which is slightly higher than the one of the Z1 scenario (equal to 1.7).
Environmental dimension The environmental dimension evaluation of the Z2 scenario is showed in Figure 4.19, where its average value, due to the 4 considered categories, is equal to 1.2.
0
1
2
3
4
Human rights/workingconditions
Food security and safety
Quality of the area
Good governance
Z2
110
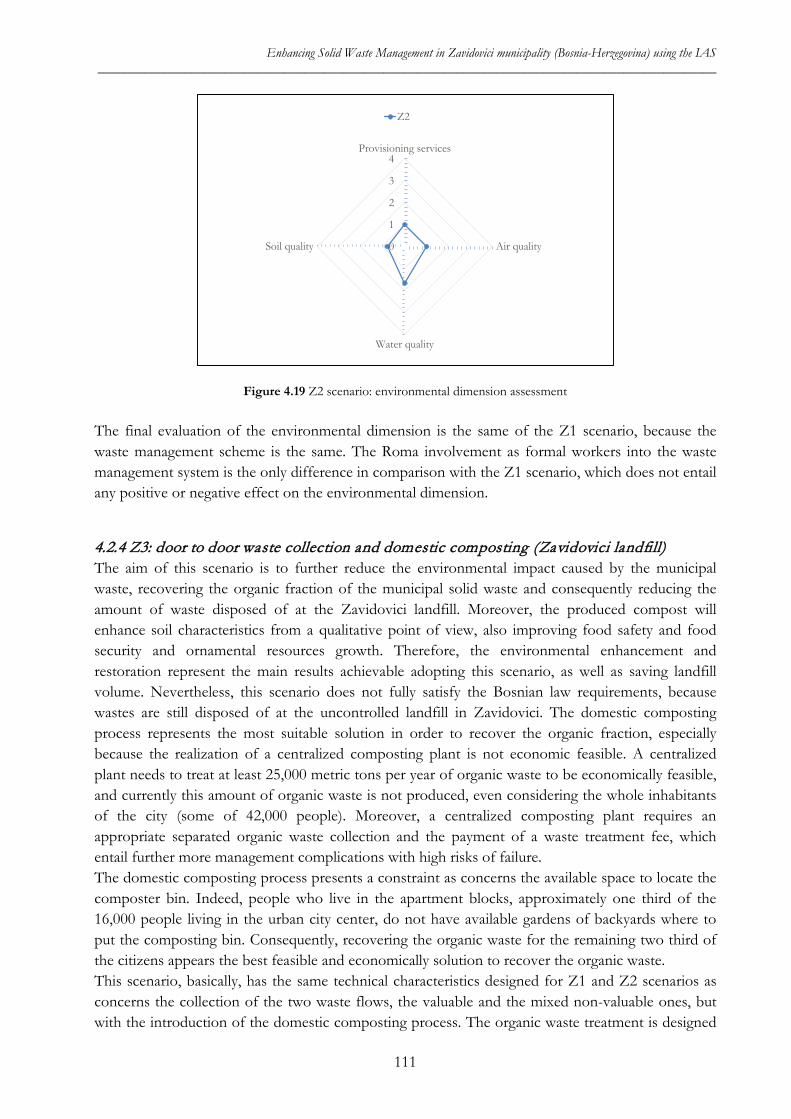
Enhancing Solid Waste Management in Zavidovici municipality (Bosnia-Herzegovina) using the IAS _____________________________________________________________________________________________
Figure 4.19 Z2 scenario: environmental dimension assessment The final evaluation of the environmental dimension is the same of the Z1 scenario, because the waste management scheme is the same. The Roma involvement as formal workers into the waste management system is the only difference in comparison with the Z1 scenario, which does not entail any positive or negative effect on the environmental dimension.
4.2.4 Z3: door to door waste collection and domestic composting (Zavidovici landfill) The aim of this scenario is to further reduce the environmental impact caused by the municipal waste, recovering the organic fraction of the municipal solid waste and consequently reducing the amount of waste disposed of at the Zavidovici landfill. Moreover, the produced compost will enhance soil characteristics from a qualitative point of view, also improving food safety and food security and ornamental resources growth. Therefore, the environmental enhancement and restoration represent the main results achievable adopting this scenario, as well as saving landfill volume. Nevertheless, this scenario does not fully satisfy the Bosnian law requirements, because wastes are still disposed of at the uncontrolled landfill in Zavidovici. The domestic composting process represents the most suitable solution in order to recover the organic fraction, especially because the realization of a centralized composting plant is not economic feasible. A centralized plant needs to treat at least 25,000 metric tons per year of organic waste to be economically feasible, and currently this amount of organic waste is not produced, even considering the whole inhabitants of the city (some of 42,000 people). Moreover, a centralized composting plant requires an appropriate separated organic waste collection and the payment of a waste treatment fee, which entail further more management complications with high risks of failure. The domestic composting process presents a constraint as concerns the available space to locate the composter bin. Indeed, people who live in the apartment blocks, approximately one third of the 16,000 people living in the urban city center, do not have available gardens of backyards where to put the composting bin. Consequently, recovering the organic waste for the remaining two third of the citizens appears the best feasible and economically solution to recover the organic waste. This scenario, basically, has the same technical characteristics designed for Z1 and Z2 scenarios as concerns the collection of the two waste flows, the valuable and the mixed non-valuable ones, but with the introduction of the domestic composting process. The organic waste treatment is designed
0
1
2
3
4Provisioning services
Air quality
Water quality
Soil quality
Z2
111
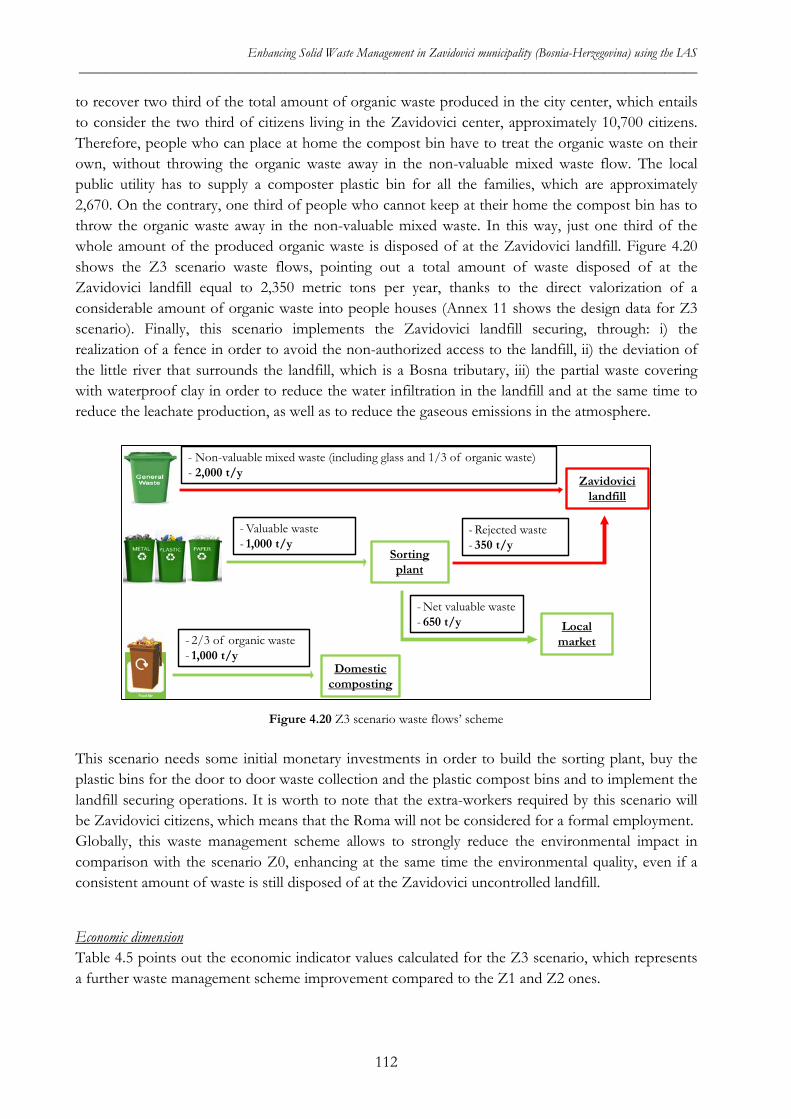
Enhancing Solid Waste Management in Zavidovici municipality (Bosnia-Herzegovina) using the IAS _____________________________________________________________________________________________
to recover two third of the total amount of organic waste produced in the city center, which entails to consider the two third of citizens living in the Zavidovici center, approximately 10,700 citizens. Therefore, people who can place at home the compost bin have to treat the organic waste on their own, without throwing the organic waste away in the non-valuable mixed waste flow. The local public utility has to supply a composter plastic bin for all the families, which are approximately 2,670. On the contrary, one third of people who cannot keep at their home the compost bin has to throw the organic waste away in the non-valuable mixed waste. In this way, just one third of the whole amount of the produced organic waste is disposed of at the Zavidovici landfill. Figure 4.20 shows the Z3 scenario waste flows, pointing out a total amount of waste disposed of at the Zavidovici landfill equal to 2,350 metric tons per year, thanks to the direct valorization of a considerable amount of organic waste into people houses (Annex 11 shows the design data for Z3 scenario). Finally, this scenario implements the Zavidovici landfill securing, through: i) the realization of a fence in order to avoid the non-authorized access to the landfill, ii) the deviation of the little river that surrounds the landfill, which is a Bosna tributary, iii) the partial waste covering with waterproof clay in order to reduce the water infiltration in the landfill and at the same time to reduce the leachate production, as well as to reduce the gaseous emissions in the atmosphere.
Figure 4.20 Z3 scenario waste flows’ scheme
This scenario needs some initial monetary investments in order to build the sorting plant, buy the plastic bins for the door to door waste collection and the plastic compost bins and to implement the landfill securing operations. It is worth to note that the extra-workers required by this scenario will be Zavidovici citizens, which means that the Roma will not be considered for a formal employment. Globally, this waste management scheme allows to strongly reduce the environmental impact in comparison with the scenario Z0, enhancing at the same time the environmental quality, even if a consistent amount of waste is still disposed of at the Zavidovici uncontrolled landfill.
Economic dimension Table 4.5 points out the economic indicator values calculated for the Z3 scenario, which represents a further waste management scheme improvement compared to the Z1 and Z2 ones.
Zavidovicilandfill
Sorting plant
- Non-valuable mixed waste (including glass and 1/3 of organic waste)- 2,000 t/y
- Valuable waste - 1,000 t/y
- Rejected waste - 350 t/y
Local market
- Net valuable waste - 650 t/y
Domestic composting
- 2/3 of organic waste - 1,000 t/y
112
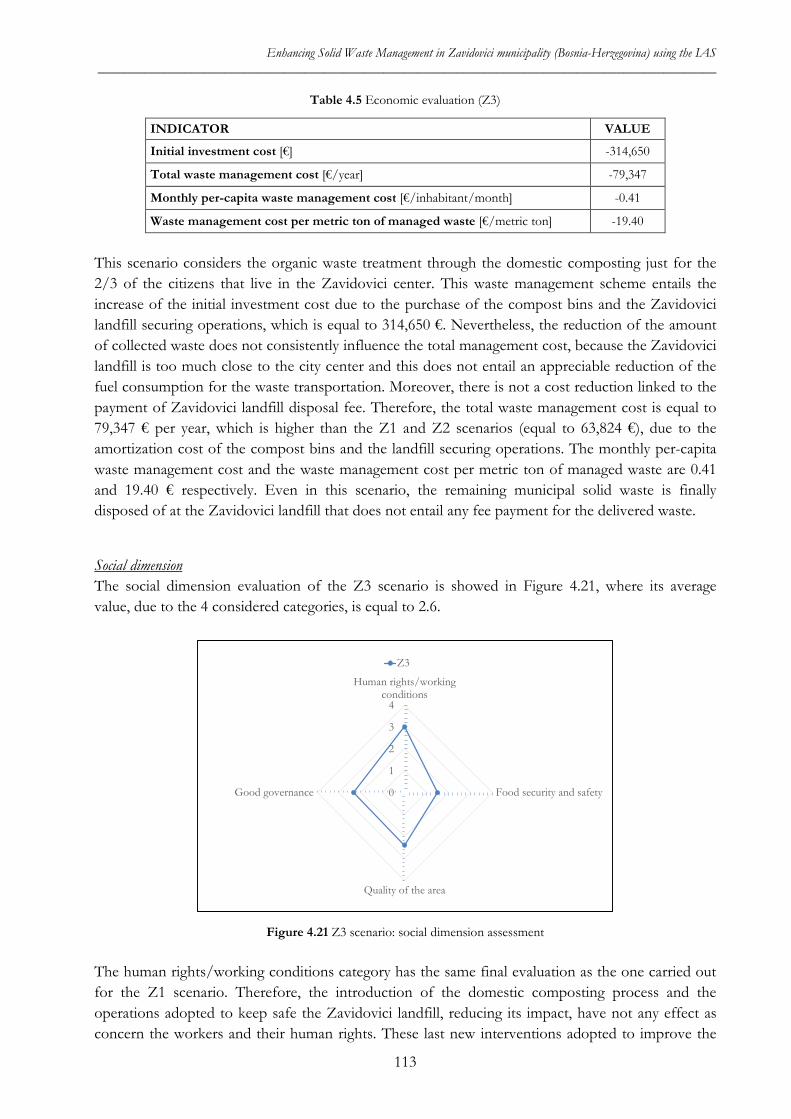
Enhancing Solid Waste Management in Zavidovici municipality (Bosnia-Herzegovina) using the IAS _____________________________________________________________________________________________
Table 4.5 Economic evaluation (Z3)
INDICATOR VALUE
Initial investment cost [€] -314,650
Total waste management cost [€/year] -79,347
Monthly per-capita waste management cost [€/inhabitant/month] -0.41
Waste management cost per metric ton of managed waste [€/metric ton] -19.40
This scenario considers the organic waste treatment through the domestic composting just for the 2/3 of the citizens that live in the Zavidovici center. This waste management scheme entails the increase of the initial investment cost due to the purchase of the compost bins and the Zavidovici landfill securing operations, which is equal to 314,650 €. Nevertheless, the reduction of the amount of collected waste does not consistently influence the total management cost, because the Zavidovici landfill is too much close to the city center and this does not entail an appreciable reduction of the fuel consumption for the waste transportation. Moreover, there is not a cost reduction linked to the payment of Zavidovici landfill disposal fee. Therefore, the total waste management cost is equal to 79,347 € per year, which is higher than the Z1 and Z2 scenarios (equal to 63,824 €), due to the amortization cost of the compost bins and the landfill securing operations. The monthly per-capita waste management cost and the waste management cost per metric ton of managed waste are 0.41 and 19.40 € respectively. Even in this scenario, the remaining municipal solid waste is finally disposed of at the Zavidovici landfill that does not entail any fee payment for the delivered waste.
Social dimension The social dimension evaluation of the Z3 scenario is showed in Figure 4.21, where its average value, due to the 4 considered categories, is equal to 2.6.
Figure 4.21 Z3 scenario: social dimension assessment
The human rights/working conditions category has the same final evaluation as the one carried out for the Z1 scenario. Therefore, the introduction of the domestic composting process and the operations adopted to keep safe the Zavidovici landfill, reducing its impact, have not any effect as concern the workers and their human rights. These last new interventions adopted to improve the
0
1
2
3
4
Human rights/workingconditions
Food security and safety
Quality of the area
Good governance
Z3
113
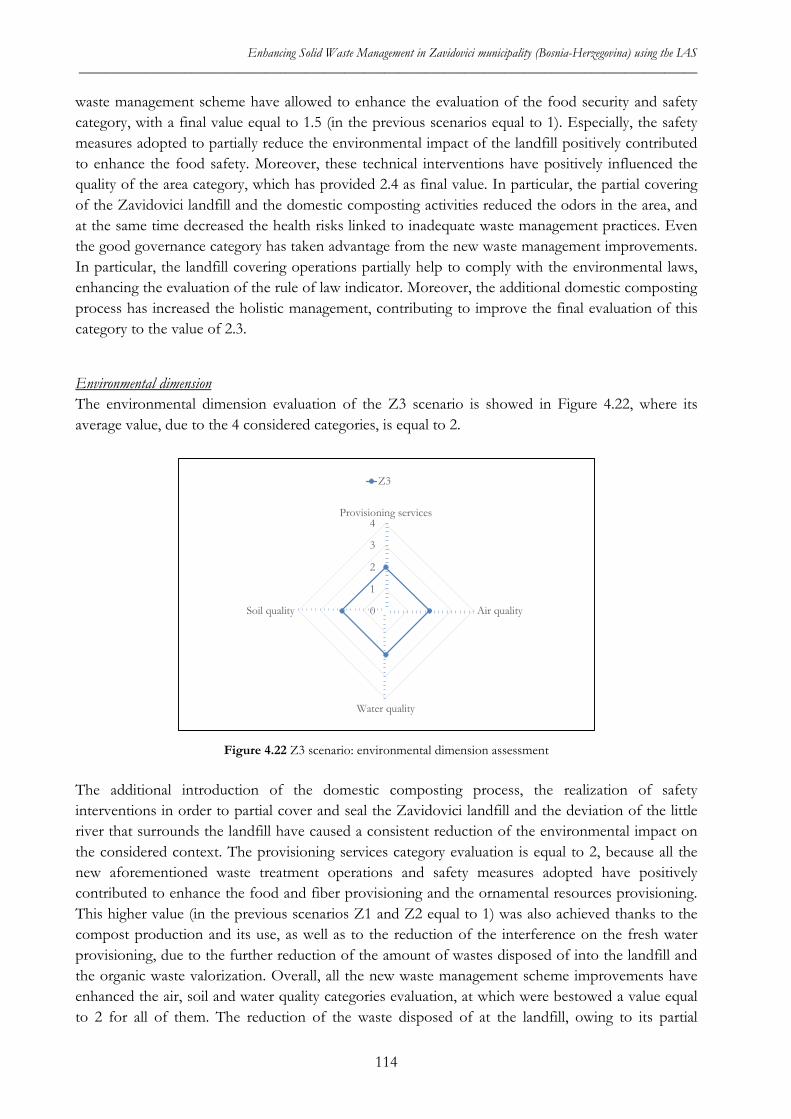
Enhancing Solid Waste Management in Zavidovici municipality (Bosnia-Herzegovina) using the IAS _____________________________________________________________________________________________
waste management scheme have allowed to enhance the evaluation of the food security and safety category, with a final value equal to 1.5 (in the previous scenarios equal to 1). Especially, the safety measures adopted to partially reduce the environmental impact of the landfill positively contributed to enhance the food safety. Moreover, these technical interventions have positively influenced the quality of the area category, which has provided 2.4 as final value. In particular, the partial covering of the Zavidovici landfill and the domestic composting activities reduced the odors in the area, and at the same time decreased the health risks linked to inadequate waste management practices. Even the good governance category has taken advantage from the new waste management improvements. In particular, the landfill covering operations partially help to comply with the environmental laws, enhancing the evaluation of the rule of law indicator. Moreover, the additional domestic composting process has increased the holistic management, contributing to improve the final evaluation of this category to the value of 2.3.
Environmental dimension The environmental dimension evaluation of the Z3 scenario is showed in Figure 4.22, where its average value, due to the 4 considered categories, is equal to 2.
Figure 4.22 Z3 scenario: environmental dimension assessment
The additional introduction of the domestic composting process, the realization of safety interventions in order to partial cover and seal the Zavidovici landfill and the deviation of the little river that surrounds the landfill have caused a consistent reduction of the environmental impact on the considered context. The provisioning services category evaluation is equal to 2, because all the new aforementioned waste treatment operations and safety measures adopted have positively contributed to enhance the food and fiber provisioning and the ornamental resources provisioning. This higher value (in the previous scenarios Z1 and Z2 equal to 1) was also achieved thanks to the compost production and its use, as well as to the reduction of the interference on the fresh water provisioning, due to the further reduction of the amount of wastes disposed of into the landfill and the organic waste valorization. Overall, all the new waste management scheme improvements have enhanced the air, soil and water quality categories evaluation, at which were bestowed a value equal to 2 for all of them. The reduction of the waste disposed of at the landfill, owing to its partial
0
1
2
3
4Provisioning services
Air quality
Water quality
Soil quality
Z3
114
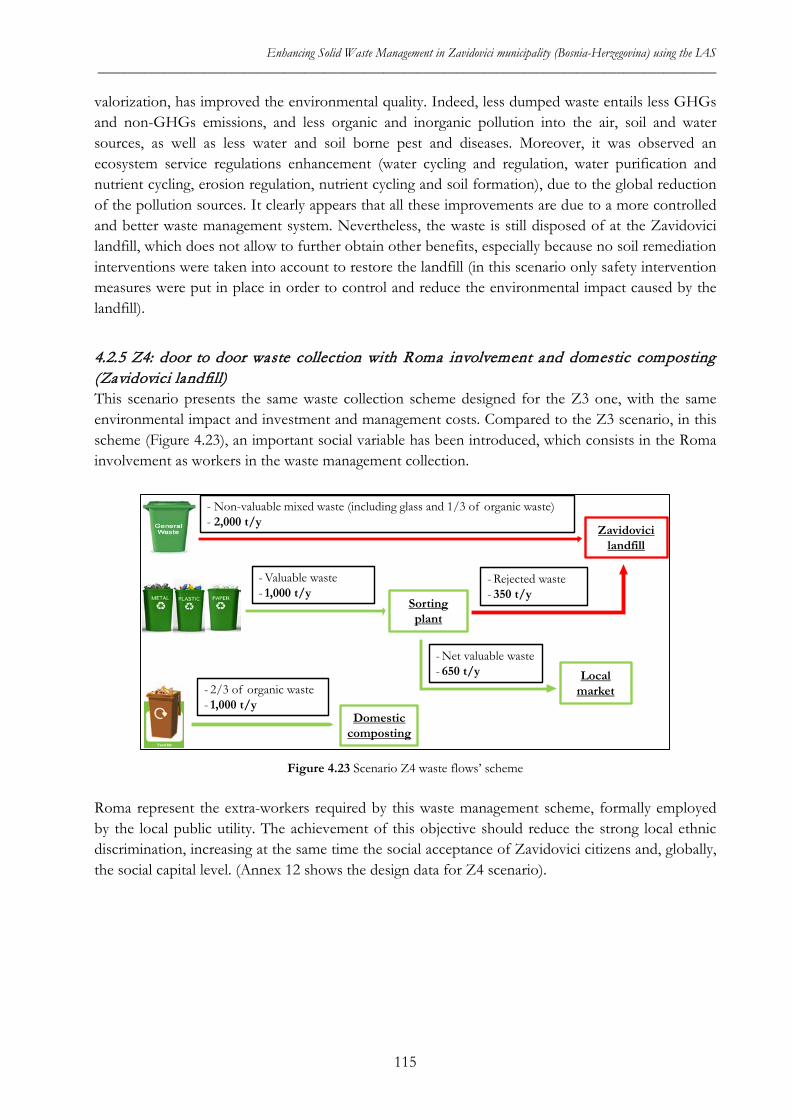
Enhancing Solid Waste Management in Zavidovici municipality (Bosnia-Herzegovina) using the IAS _____________________________________________________________________________________________
valorization, has improved the environmental quality. Indeed, less dumped waste entails less GHGs and non-GHGs emissions, and less organic and inorganic pollution into the air, soil and water sources, as well as less water and soil borne pest and diseases. Moreover, it was observed an ecosystem service regulations enhancement (water cycling and regulation, water purification and nutrient cycling, erosion regulation, nutrient cycling and soil formation), due to the global reduction of the pollution sources. It clearly appears that all these improvements are due to a more controlled and better waste management system. Nevertheless, the waste is still disposed of at the Zavidovici landfill, which does not allow to further obtain other benefits, especially because no soil remediation interventions were taken into account to restore the landfill (in this scenario only safety intervention measures were put in place in order to control and reduce the environmental impact caused by the landfill).
4.2.5 Z4: door to door waste collection with Roma involvement and domestic composting (Zavidovici landfill) This scenario presents the same waste collection scheme designed for the Z3 one, with the same environmental impact and investment and management costs. Compared to the Z3 scenario, in this scheme (Figure 4.23), an important social variable has been introduced, which consists in the Roma involvement as workers in the waste management collection.
Figure 4.23 Scenario Z4 waste flows’ scheme
Roma represent the extra-workers required by this waste management scheme, formally employed by the local public utility. The achievement of this objective should reduce the strong local ethnic discrimination, increasing at the same time the social acceptance of Zavidovici citizens and, globally, the social capital level. (Annex 12 shows the design data for Z4 scenario).
Zavidovicilandfill
Sorting plant
- Non-valuable mixed waste (including glass and 1/3 of organic waste)- 2,000 t/y
- Valuable waste - 1,000 t/y
- Rejected waste - 350 t/y
Local market
- Net valuable waste - 650 t/y
Domestic composting
- 2/3 of organic waste - 1,000 t/y
115
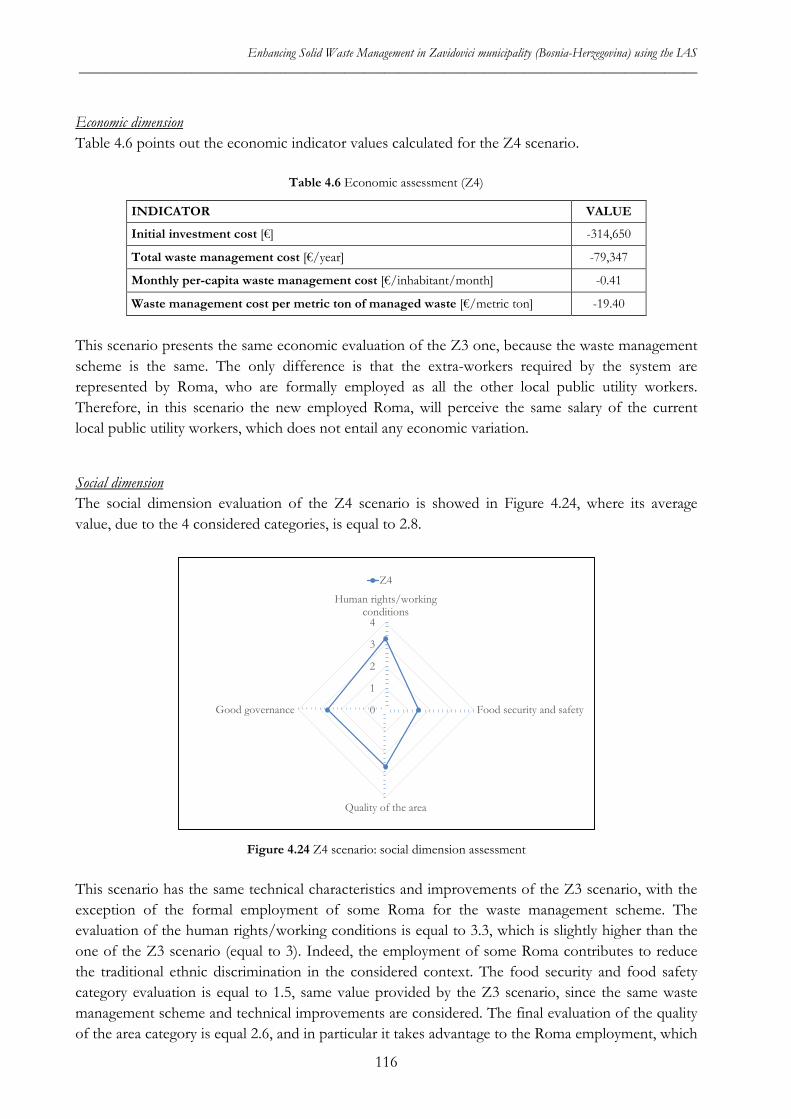
Enhancing Solid Waste Management in Zavidovici municipality (Bosnia-Herzegovina) using the IAS _____________________________________________________________________________________________
Economic dimension Table 4.6 points out the economic indicator values calculated for the Z4 scenario.
Table 4.6 Economic assessment (Z4)
INDICATOR VALUE
Initial investment cost [€] -314,650
Total waste management cost [€/year] -79,347
Monthly per-capita waste management cost [€/inhabitant/month] -0.41
Waste management cost per metric ton of managed waste [€/metric ton] -19.40
This scenario presents the same economic evaluation of the Z3 one, because the waste management scheme is the same. The only difference is that the extra-workers required by the system are represented by Roma, who are formally employed as all the other local public utility workers. Therefore, in this scenario the new employed Roma, will perceive the same salary of the current local public utility workers, which does not entail any economic variation.
Social dimension The social dimension evaluation of the Z4 scenario is showed in Figure 4.24, where its average value, due to the 4 considered categories, is equal to 2.8.
Figure 4.24 Z4 scenario: social dimension assessment
This scenario has the same technical characteristics and improvements of the Z3 scenario, with the exception of the formal employment of some Roma for the waste management scheme. The evaluation of the human rights/working conditions is equal to 3.3, which is slightly higher than the one of the Z3 scenario (equal to 3). Indeed, the employment of some Roma contributes to reduce the traditional ethnic discrimination in the considered context. The food security and food safety category evaluation is equal to 1.5, same value provided by the Z3 scenario, since the same waste management scheme and technical improvements are considered. The final evaluation of the quality of the area category is equal 2.6, and in particular it takes advantage to the Roma employment, which
0
1
2
3
4
Human rights/workingconditions
Food security and safety
Quality of the area
Good governance
Z4
116
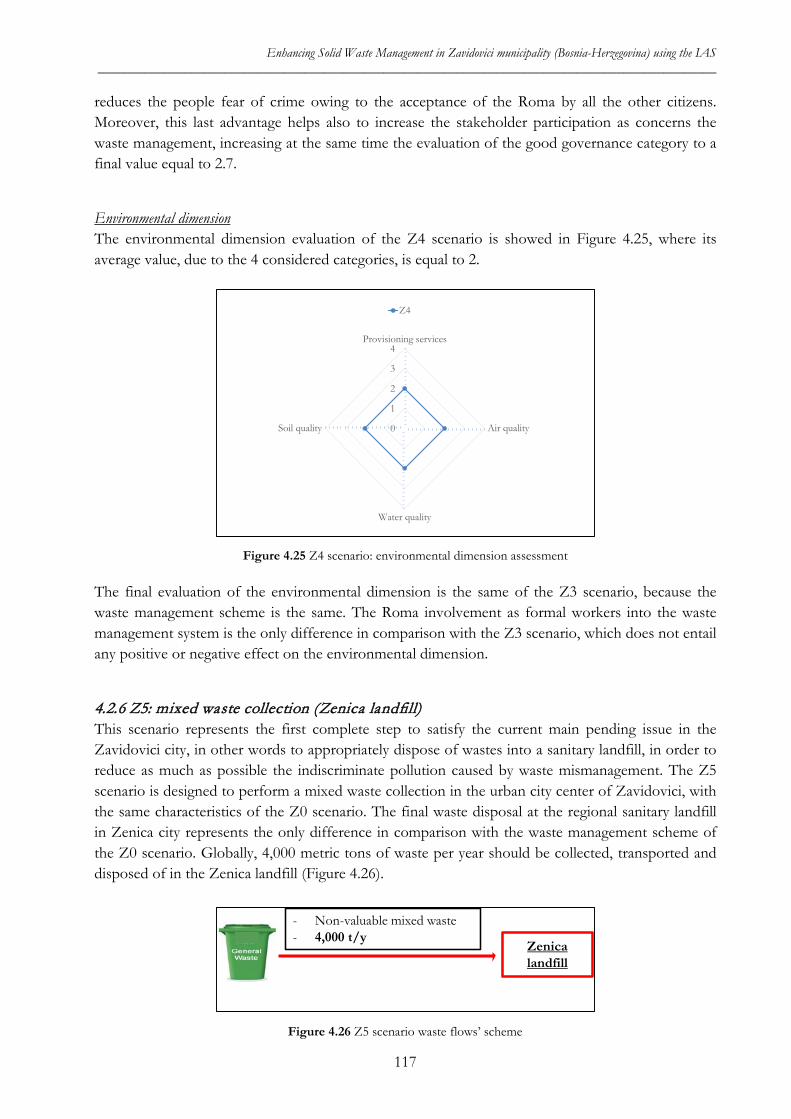
Enhancing Solid Waste Management in Zavidovici municipality (Bosnia-Herzegovina) using the IAS _____________________________________________________________________________________________
reduces the people fear of crime owing to the acceptance of the Roma by all the other citizens. Moreover, this last advantage helps also to increase the stakeholder participation as concerns the waste management, increasing at the same time the evaluation of the good governance category to a final value equal to 2.7.
Environmental dimension The environmental dimension evaluation of the Z4 scenario is showed in Figure 4.25, where its average value, due to the 4 considered categories, is equal to 2.
Figure 4.25 Z4 scenario: environmental dimension assessment
The final evaluation of the environmental dimension is the same of the Z3 scenario, because the waste management scheme is the same. The Roma involvement as formal workers into the waste management system is the only difference in comparison with the Z3 scenario, which does not entail any positive or negative effect on the environmental dimension.
4.2.6 Z5: mixed waste collection (Zenica landfill) This scenario represents the first complete step to satisfy the current main pending issue in the Zavidovici city, in other words to appropriately dispose of wastes into a sanitary landfill, in order to reduce as much as possible the indiscriminate pollution caused by waste mismanagement. The Z5 scenario is designed to perform a mixed waste collection in the urban city center of Zavidovici, with the same characteristics of the Z0 scenario. The final waste disposal at the regional sanitary landfill in Zenica city represents the only difference in comparison with the waste management scheme of the Z0 scenario. Globally, 4,000 metric tons of waste per year should be collected, transported and disposed of in the Zenica landfill (Figure 4.26).
Figure 4.26 Z5 scenario waste flows’ scheme
0
1
2
3
4Provisioning services
Air quality
Water quality
Soil quality
Z4
Zenicalandfill
- Non-valuable mixed waste- 4,000 t/y
117
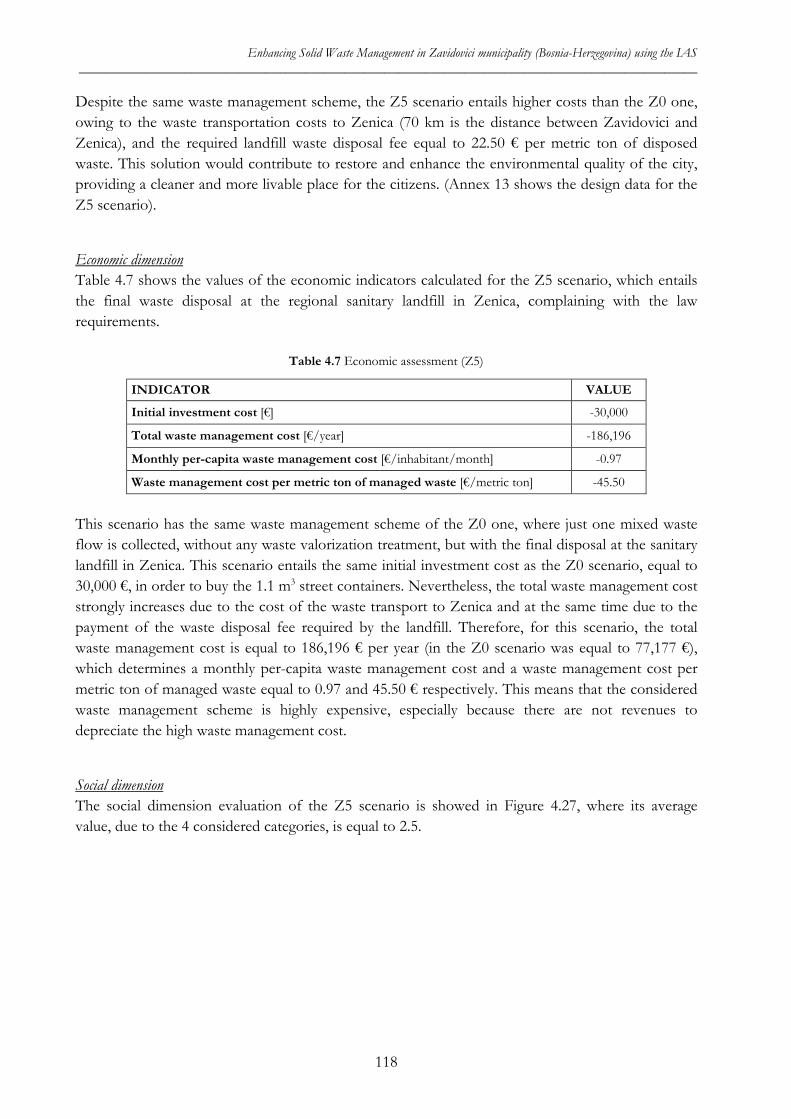
Enhancing Solid Waste Management in Zavidovici municipality (Bosnia-Herzegovina) using the IAS _____________________________________________________________________________________________
Despite the same waste management scheme, the Z5 scenario entails higher costs than the Z0 one, owing to the waste transportation costs to Zenica (70 km is the distance between Zavidovici and Zenica), and the required landfill waste disposal fee equal to 22.50 € per metric ton of disposed waste. This solution would contribute to restore and enhance the environmental quality of the city, providing a cleaner and more livable place for the citizens. (Annex 13 shows the design data for the Z5 scenario).
Economic dimension Table 4.7 shows the values of the economic indicators calculated for the Z5 scenario, which entails the final waste disposal at the regional sanitary landfill in Zenica, complaining with the law requirements.
Table 4.7 Economic assessment (Z5)
INDICATOR VALUE
Initial investment cost [€] -30,000
Total waste management cost [€/year] -186,196
Monthly per-capita waste management cost [€/inhabitant/month] -0.97
Waste management cost per metric ton of managed waste [€/metric ton] -45.50
This scenario has the same waste management scheme of the Z0 one, where just one mixed waste flow is collected, without any waste valorization treatment, but with the final disposal at the sanitary landfill in Zenica. This scenario entails the same initial investment cost as the Z0 scenario, equal to 30,000 €, in order to buy the 1.1 m3 street containers. Nevertheless, the total waste management cost strongly increases due to the cost of the waste transport to Zenica and at the same time due to the payment of the waste disposal fee required by the landfill. Therefore, for this scenario, the total waste management cost is equal to 186,196 € per year (in the Z0 scenario was equal to 77,177 €), which determines a monthly per-capita waste management cost and a waste management cost per metric ton of managed waste equal to 0.97 and 45.50 € respectively. This means that the considered waste management scheme is highly expensive, especially because there are not revenues to depreciate the high waste management cost.
Social dimension The social dimension evaluation of the Z5 scenario is showed in Figure 4.27, where its average value, due to the 4 considered categories, is equal to 2.5.
118
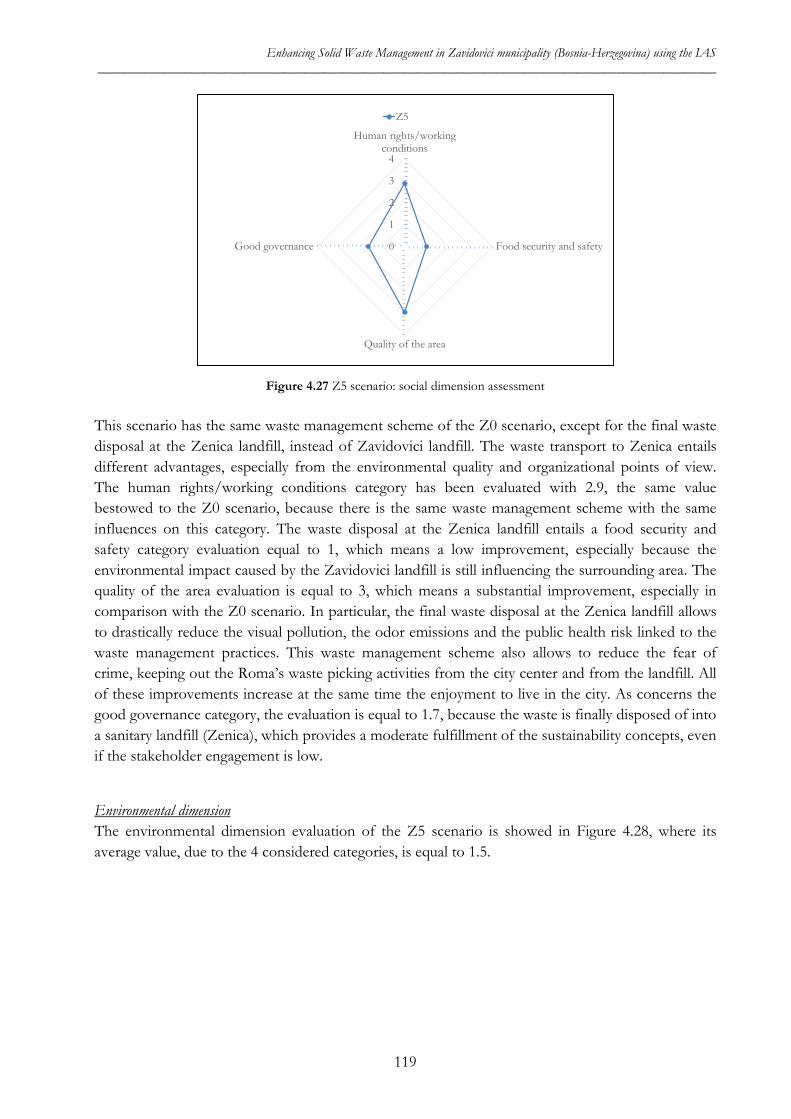
Enhancing Solid Waste Management in Zavidovici municipality (Bosnia-Herzegovina) using the IAS _____________________________________________________________________________________________
Figure 4.27 Z5 scenario: social dimension assessment
This scenario has the same waste management scheme of the Z0 scenario, except for the final waste disposal at the Zenica landfill, instead of Zavidovici landfill. The waste transport to Zenica entails different advantages, especially from the environmental quality and organizational points of view. The human rights/working conditions category has been evaluated with 2.9, the same value bestowed to the Z0 scenario, because there is the same waste management scheme with the same influences on this category. The waste disposal at the Zenica landfill entails a food security and safety category evaluation equal to 1, which means a low improvement, especially because the environmental impact caused by the Zavidovici landfill is still influencing the surrounding area. The quality of the area evaluation is equal to 3, which means a substantial improvement, especially in comparison with the Z0 scenario. In particular, the final waste disposal at the Zenica landfill allows to drastically reduce the visual pollution, the odor emissions and the public health risk linked to the waste management practices. This waste management scheme also allows to reduce the fear of crime, keeping out the Roma’s waste picking activities from the city center and from the landfill. All of these improvements increase at the same time the enjoyment to live in the city. As concerns the good governance category, the evaluation is equal to 1.7, because the waste is finally disposed of into a sanitary landfill (Zenica), which provides a moderate fulfillment of the sustainability concepts, even if the stakeholder engagement is low.
Environmental dimension The environmental dimension evaluation of the Z5 scenario is showed in Figure 4.28, where its average value, due to the 4 considered categories, is equal to 1.5.
0
1
2
3
4
Human rights/workingconditions
Food security and safety
Quality of the area
Good governance
Z5
119
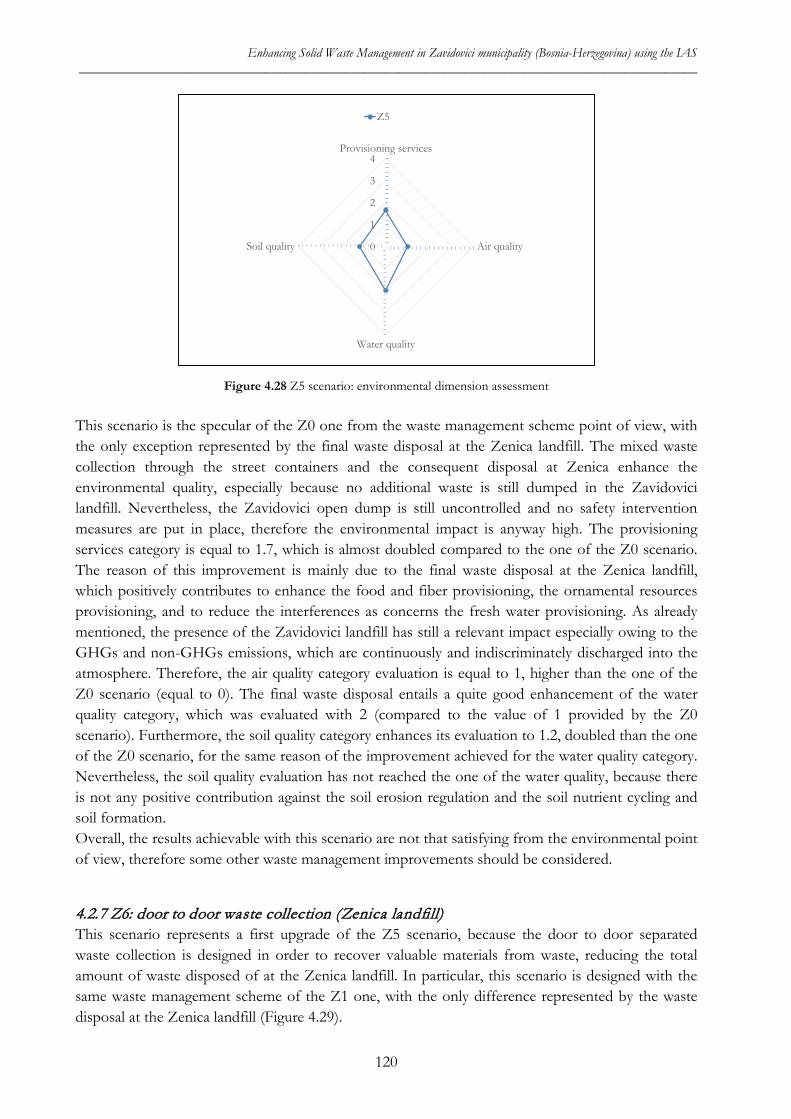
Enhancing Solid Waste Management in Zavidovici municipality (Bosnia-Herzegovina) using the IAS _____________________________________________________________________________________________
Figure 4.28 Z5 scenario: environmental dimension assessment
This scenario is the specular of the Z0 one from the waste management scheme point of view, with the only exception represented by the final waste disposal at the Zenica landfill. The mixed waste collection through the street containers and the consequent disposal at Zenica enhance the environmental quality, especially because no additional waste is still dumped in the Zavidovici landfill. Nevertheless, the Zavidovici open dump is still uncontrolled and no safety intervention measures are put in place, therefore the environmental impact is anyway high. The provisioning services category is equal to 1.7, which is almost doubled compared to the one of the Z0 scenario. The reason of this improvement is mainly due to the final waste disposal at the Zenica landfill, which positively contributes to enhance the food and fiber provisioning, the ornamental resources provisioning, and to reduce the interferences as concerns the fresh water provisioning. As already mentioned, the presence of the Zavidovici landfill has still a relevant impact especially owing to the GHGs and non-GHGs emissions, which are continuously and indiscriminately discharged into the atmosphere. Therefore, the air quality category evaluation is equal to 1, higher than the one of the Z0 scenario (equal to 0). The final waste disposal entails a quite good enhancement of the water quality category, which was evaluated with 2 (compared to the value of 1 provided by the Z0 scenario). Furthermore, the soil quality category enhances its evaluation to 1.2, doubled than the one of the Z0 scenario, for the same reason of the improvement achieved for the water quality category. Nevertheless, the soil quality evaluation has not reached the one of the water quality, because there is not any positive contribution against the soil erosion regulation and the soil nutrient cycling and soil formation. Overall, the results achievable with this scenario are not that satisfying from the environmental point of view, therefore some other waste management improvements should be considered.
4.2.7 Z6: door to door waste collection (Zenica landfill) This scenario represents a first upgrade of the Z5 scenario, because the door to door separated waste collection is designed in order to recover valuable materials from waste, reducing the total amount of waste disposed of at the Zenica landfill. In particular, this scenario is designed with the same waste management scheme of the Z1 one, with the only difference represented by the waste disposal at the Zenica landfill (Figure 4.29).
0
1
2
3
4Provisioning services
Air quality
Water quality
Soil quality
Z5
120
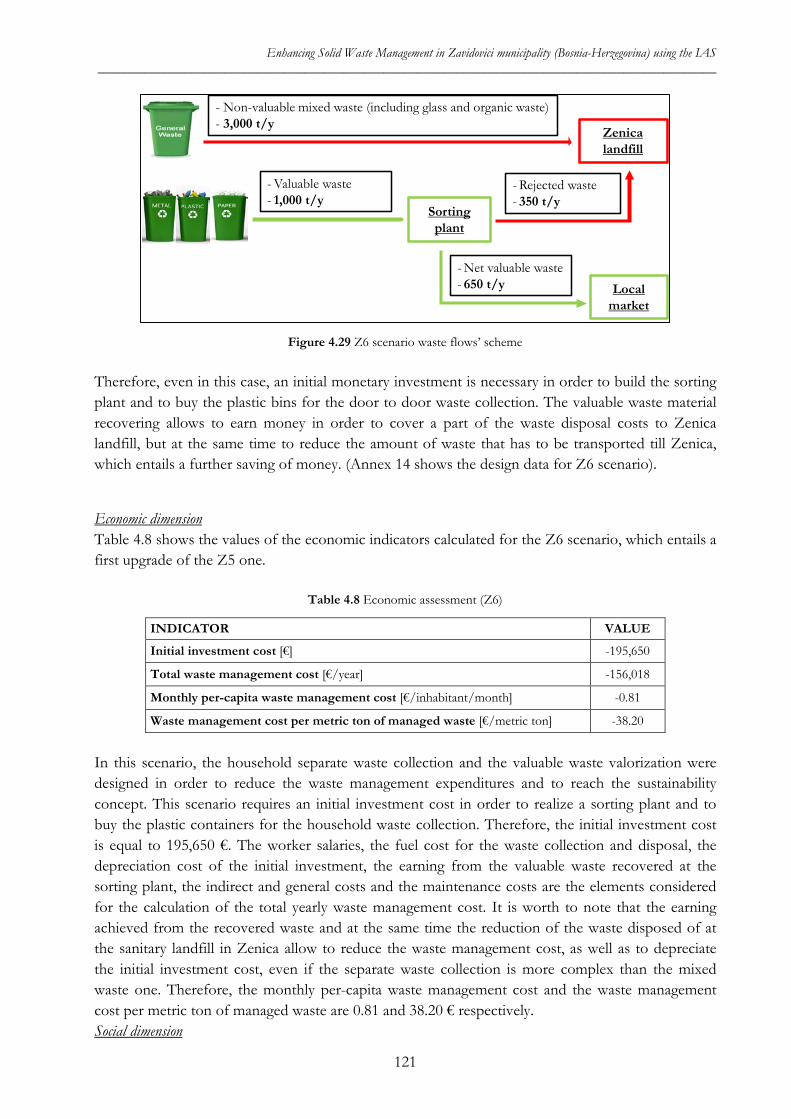
Enhancing Solid Waste Management in Zavidovici municipality (Bosnia-Herzegovina) using the IAS _____________________________________________________________________________________________
Figure 4.29 Z6 scenario waste flows’ scheme
Therefore, even in this case, an initial monetary investment is necessary in order to build the sorting plant and to buy the plastic bins for the door to door waste collection. The valuable waste material recovering allows to earn money in order to cover a part of the waste disposal costs to Zenica landfill, but at the same time to reduce the amount of waste that has to be transported till Zenica, which entails a further saving of money. (Annex 14 shows the design data for Z6 scenario).
Economic dimension Table 4.8 shows the values of the economic indicators calculated for the Z6 scenario, which entails a first upgrade of the Z5 one.
Table 4.8 Economic assessment (Z6)
INDICATOR VALUE
Initial investment cost [€] -195,650
Total waste management cost [€/year] -156,018
Monthly per-capita waste management cost [€/inhabitant/month] -0.81
Waste management cost per metric ton of managed waste [€/metric ton] -38.20
In this scenario, the household separate waste collection and the valuable waste valorization were designed in order to reduce the waste management expenditures and to reach the sustainability concept. This scenario requires an initial investment cost in order to realize a sorting plant and to buy the plastic containers for the household waste collection. Therefore, the initial investment cost is equal to 195,650 €. The worker salaries, the fuel cost for the waste collection and disposal, the depreciation cost of the initial investment, the earning from the valuable waste recovered at the sorting plant, the indirect and general costs and the maintenance costs are the elements considered for the calculation of the total yearly waste management cost. It is worth to note that the earning achieved from the recovered waste and at the same time the reduction of the waste disposed of at the sanitary landfill in Zenica allow to reduce the waste management cost, as well as to depreciate the initial investment cost, even if the separate waste collection is more complex than the mixed waste one. Therefore, the monthly per-capita waste management cost and the waste management cost per metric ton of managed waste are 0.81 and 38.20 € respectively. Social dimension
Zenicalandfill
Sorting plant
- Non-valuable mixed waste (including glass and organic waste)- 3,000 t/y
- Valuable waste - 1,000 t/y
- Rejected waste - 350 t/y
Local market
- Net valuable waste - 650 t/y
121
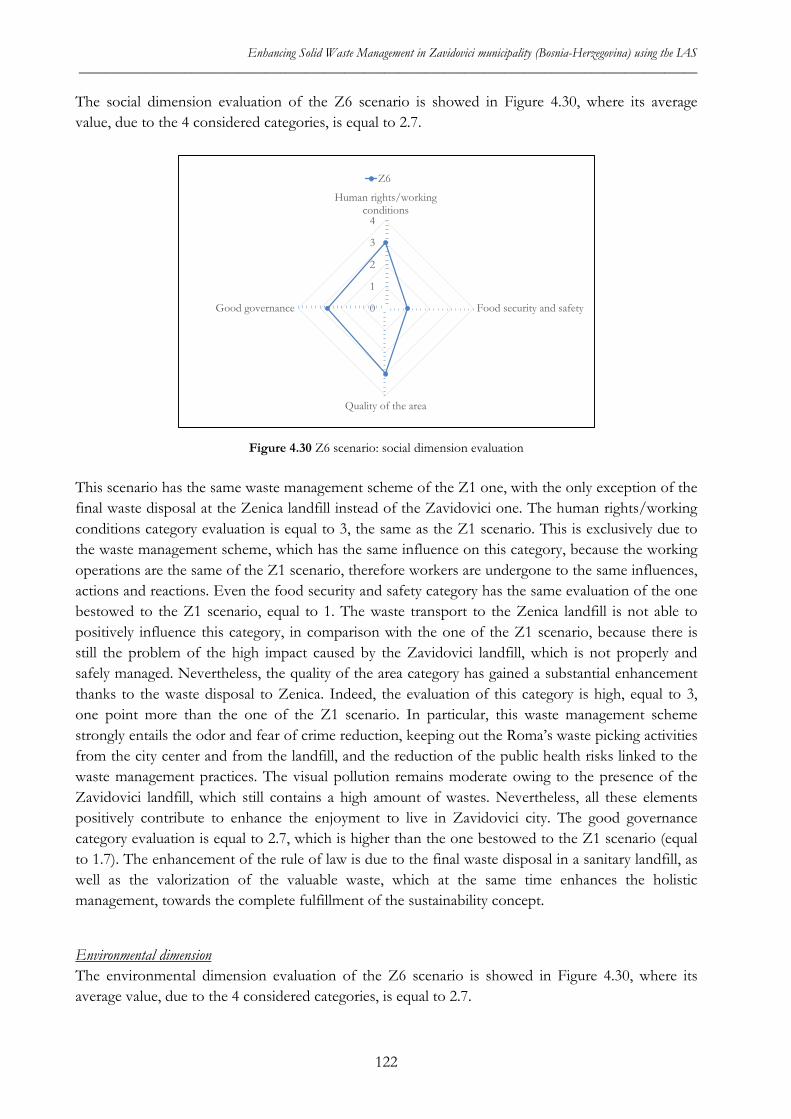
Enhancing Solid Waste Management in Zavidovici municipality (Bosnia-Herzegovina) using the IAS _____________________________________________________________________________________________
The social dimension evaluation of the Z6 scenario is showed in Figure 4.30, where its average value, due to the 4 considered categories, is equal to 2.7.
Figure 4.30 Z6 scenario: social dimension evaluation
This scenario has the same waste management scheme of the Z1 one, with the only exception of the final waste disposal at the Zenica landfill instead of the Zavidovici one. The human rights/working conditions category evaluation is equal to 3, the same as the Z1 scenario. This is exclusively due to the waste management scheme, which has the same influence on this category, because the working operations are the same of the Z1 scenario, therefore workers are undergone to the same influences, actions and reactions. Even the food security and safety category has the same evaluation of the one bestowed to the Z1 scenario, equal to 1. The waste transport to the Zenica landfill is not able to positively influence this category, in comparison with the one of the Z1 scenario, because there is still the problem of the high impact caused by the Zavidovici landfill, which is not properly and safely managed. Nevertheless, the quality of the area category has gained a substantial enhancement thanks to the waste disposal to Zenica. Indeed, the evaluation of this category is high, equal to 3, one point more than the one of the Z1 scenario. In particular, this waste management scheme strongly entails the odor and fear of crime reduction, keeping out the Roma’s waste picking activities from the city center and from the landfill, and the reduction of the public health risks linked to the waste management practices. The visual pollution remains moderate owing to the presence of the Zavidovici landfill, which still contains a high amount of wastes. Nevertheless, all these elements positively contribute to enhance the enjoyment to live in Zavidovici city. The good governance category evaluation is equal to 2.7, which is higher than the one bestowed to the Z1 scenario (equal to 1.7). The enhancement of the rule of law is due to the final waste disposal in a sanitary landfill, as well as the valorization of the valuable waste, which at the same time enhances the holistic management, towards the complete fulfillment of the sustainability concept.
Environmental dimension The environmental dimension evaluation of the Z6 scenario is showed in Figure 4.30, where its average value, due to the 4 considered categories, is equal to 2.7.
0
1
2
3
4
Human rights/workingconditions
Food security and safety
Quality of the area
Good governance
Z6
122
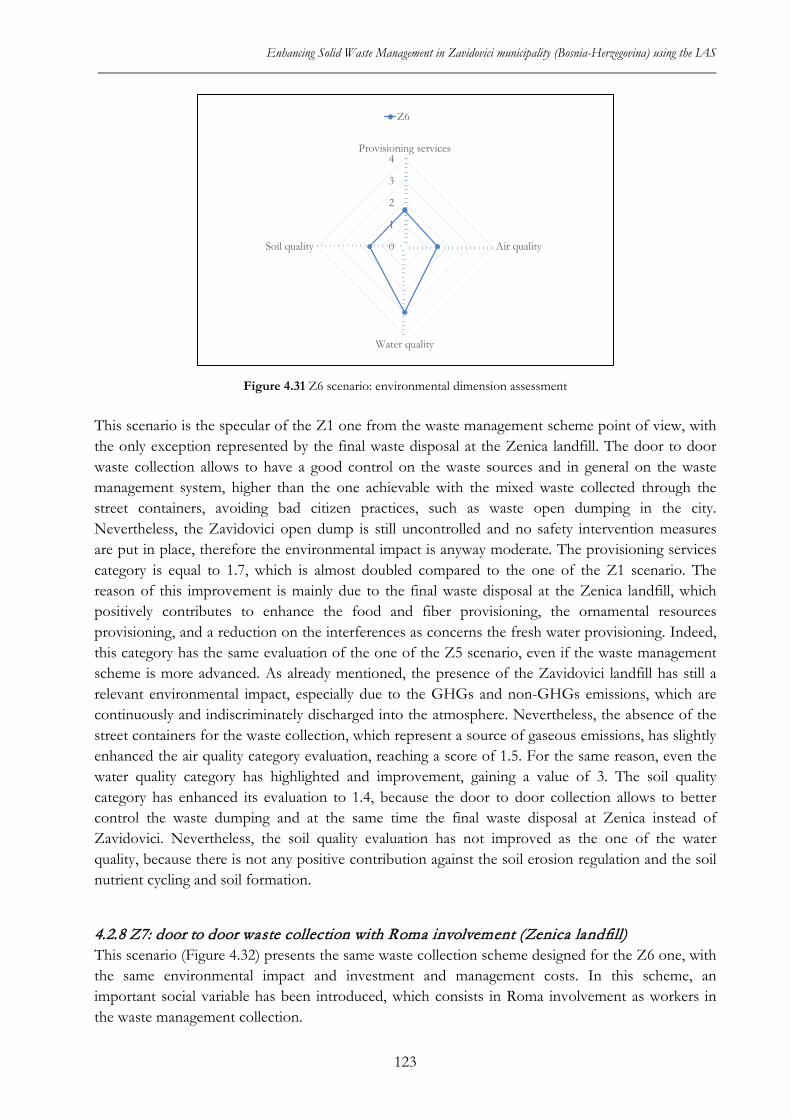
Enhancing Solid Waste Management in Zavidovici municipality (Bosnia-Herzegovina) using the IAS _____________________________________________________________________________________________
Figure 4.31 Z6 scenario: environmental dimension assessment
This scenario is the specular of the Z1 one from the waste management scheme point of view, with the only exception represented by the final waste disposal at the Zenica landfill. The door to door waste collection allows to have a good control on the waste sources and in general on the waste management system, higher than the one achievable with the mixed waste collected through the street containers, avoiding bad citizen practices, such as waste open dumping in the city. Nevertheless, the Zavidovici open dump is still uncontrolled and no safety intervention measures are put in place, therefore the environmental impact is anyway moderate. The provisioning services category is equal to 1.7, which is almost doubled compared to the one of the Z1 scenario. The reason of this improvement is mainly due to the final waste disposal at the Zenica landfill, which positively contributes to enhance the food and fiber provisioning, the ornamental resources provisioning, and a reduction on the interferences as concerns the fresh water provisioning. Indeed, this category has the same evaluation of the one of the Z5 scenario, even if the waste management scheme is more advanced. As already mentioned, the presence of the Zavidovici landfill has still a relevant environmental impact, especially due to the GHGs and non-GHGs emissions, which are continuously and indiscriminately discharged into the atmosphere. Nevertheless, the absence of the street containers for the waste collection, which represent a source of gaseous emissions, has slightly enhanced the air quality category evaluation, reaching a score of 1.5. For the same reason, even the water quality category has highlighted and improvement, gaining a value of 3. The soil quality category has enhanced its evaluation to 1.4, because the door to door collection allows to better control the waste dumping and at the same time the final waste disposal at Zenica instead of Zavidovici. Nevertheless, the soil quality evaluation has not improved as the one of the water quality, because there is not any positive contribution against the soil erosion regulation and the soil nutrient cycling and soil formation.
4.2.8 Z7: door to door waste collection with Roma involvement (Zenica landfill) This scenario (Figure 4.32) presents the same waste collection scheme designed for the Z6 one, with the same environmental impact and investment and management costs. In this scheme, an important social variable has been introduced, which consists in Roma involvement as workers in the waste management collection.
0
1
2
3
4Provisioning services
Air quality
Water quality
Soil quality
Z6
123
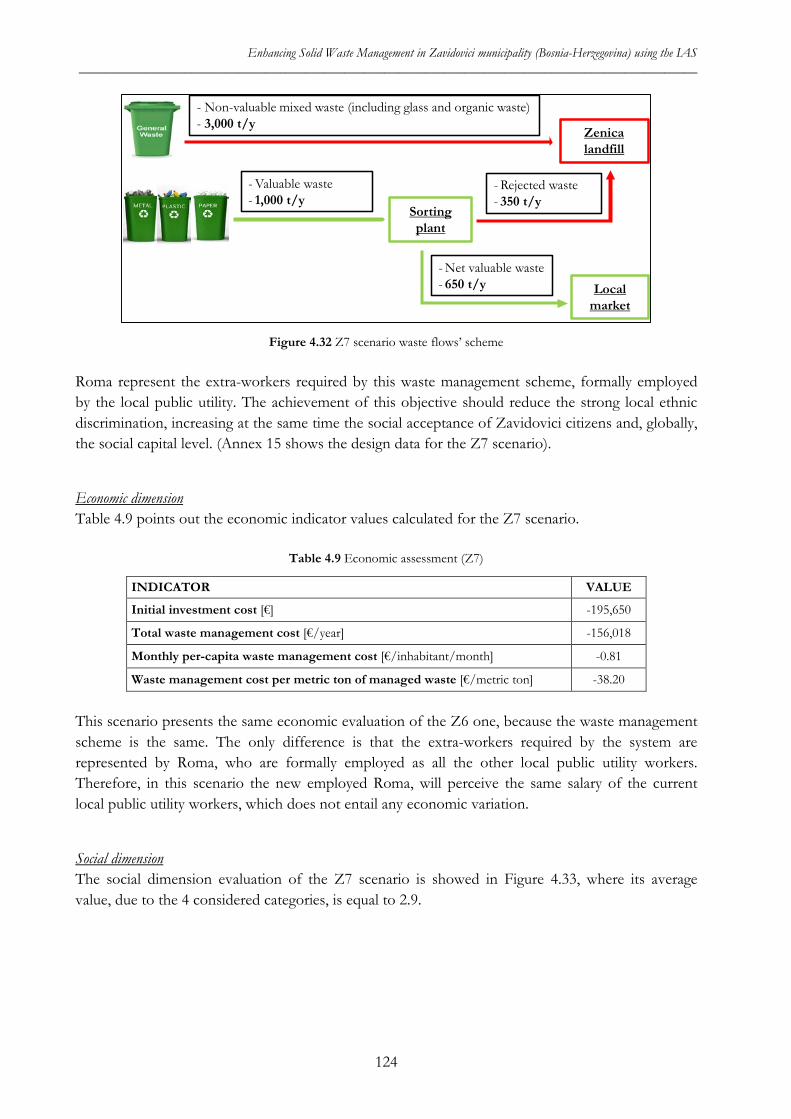
Enhancing Solid Waste Management in Zavidovici municipality (Bosnia-Herzegovina) using the IAS _____________________________________________________________________________________________
Figure 4.32 Z7 scenario waste flows’ scheme
Roma represent the extra-workers required by this waste management scheme, formally employed by the local public utility. The achievement of this objective should reduce the strong local ethnic discrimination, increasing at the same time the social acceptance of Zavidovici citizens and, globally, the social capital level. (Annex 15 shows the design data for the Z7 scenario).
Economic dimension Table 4.9 points out the economic indicator values calculated for the Z7 scenario.
Table 4.9 Economic assessment (Z7)
INDICATOR VALUE
Initial investment cost [€] -195,650
Total waste management cost [€/year] -156,018
Monthly per-capita waste management cost [€/inhabitant/month] -0.81
Waste management cost per metric ton of managed waste [€/metric ton] -38.20
This scenario presents the same economic evaluation of the Z6 one, because the waste management scheme is the same. The only difference is that the extra-workers required by the system are represented by Roma, who are formally employed as all the other local public utility workers. Therefore, in this scenario the new employed Roma, will perceive the same salary of the current local public utility workers, which does not entail any economic variation.
Social dimension The social dimension evaluation of the Z7 scenario is showed in Figure 4.33, where its average value, due to the 4 considered categories, is equal to 2.9.
Zenicalandfill
Sorting plant
- Non-valuable mixed waste (including glass and organic waste)- 3,000 t/y
- Valuable waste - 1,000 t/y
- Rejected waste - 350 t/y
Local market
- Net valuable waste - 650 t/y
124
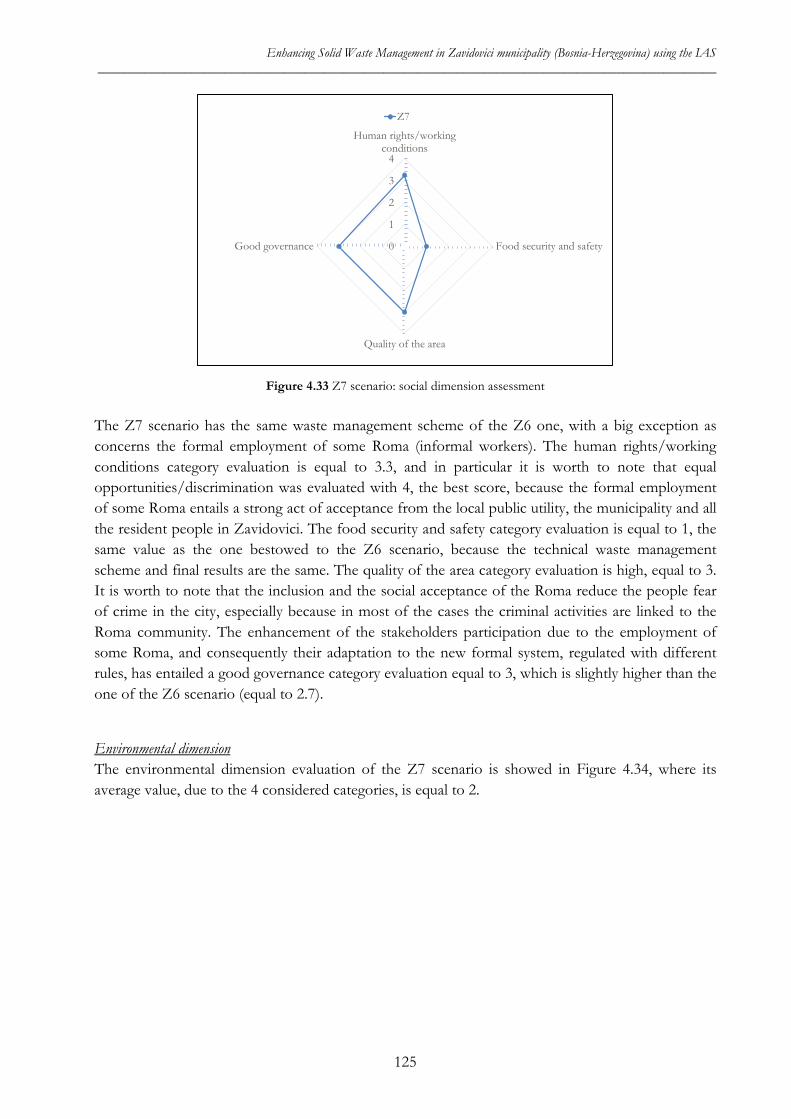
Enhancing Solid Waste Management in Zavidovici municipality (Bosnia-Herzegovina) using the IAS _____________________________________________________________________________________________
Figure 4.33 Z7 scenario: social dimension assessment
The Z7 scenario has the same waste management scheme of the Z6 one, with a big exception as concerns the formal employment of some Roma (informal workers). The human rights/working conditions category evaluation is equal to 3.3, and in particular it is worth to note that equal opportunities/discrimination was evaluated with 4, the best score, because the formal employment of some Roma entails a strong act of acceptance from the local public utility, the municipality and all the resident people in Zavidovici. The food security and safety category evaluation is equal to 1, the same value as the one bestowed to the Z6 scenario, because the technical waste management scheme and final results are the same. The quality of the area category evaluation is high, equal to 3. It is worth to note that the inclusion and the social acceptance of the Roma reduce the people fear of crime in the city, especially because in most of the cases the criminal activities are linked to the Roma community. The enhancement of the stakeholders participation due to the employment of some Roma, and consequently their adaptation to the new formal system, regulated with different rules, has entailed a good governance category evaluation equal to 3, which is slightly higher than the one of the Z6 scenario (equal to 2.7).
Environmental dimension The environmental dimension evaluation of the Z7 scenario is showed in Figure 4.34, where its average value, due to the 4 considered categories, is equal to 2.
0
1
2
3
4
Human rights/workingconditions
Food security and safety
Quality of the area
Good governance
Z7
125
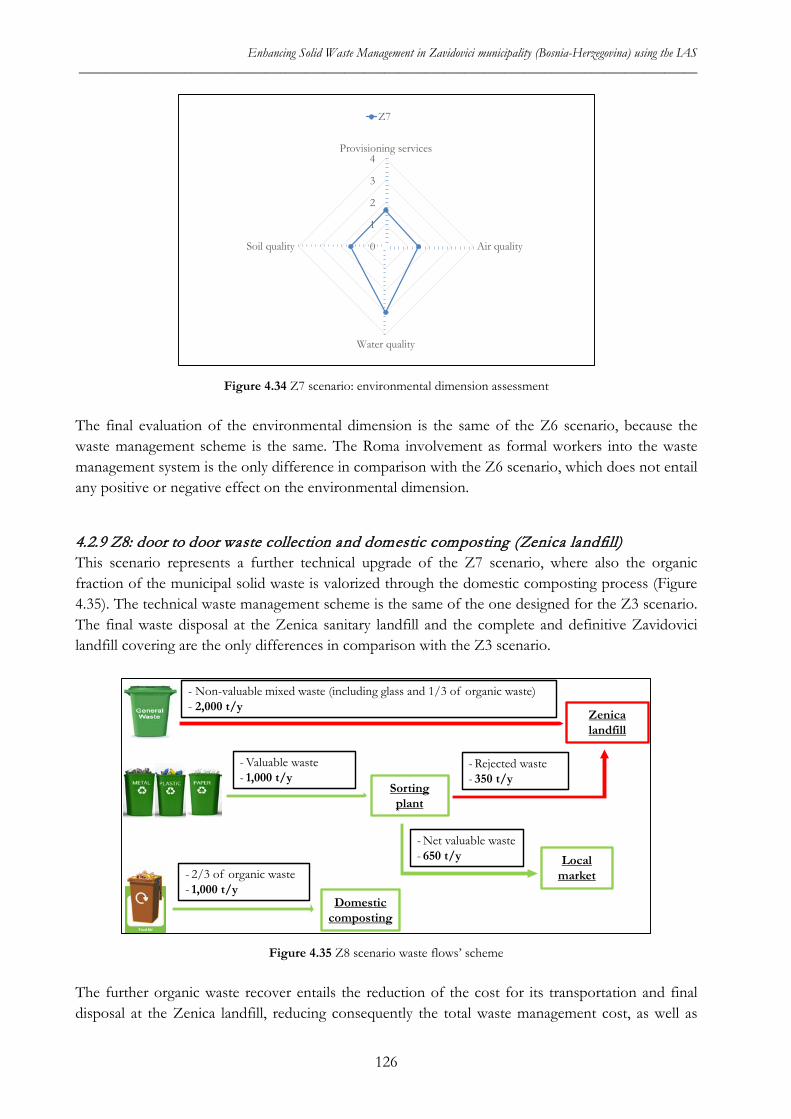
Enhancing Solid Waste Management in Zavidovici municipality (Bosnia-Herzegovina) using the IAS _____________________________________________________________________________________________
Figure 4.34 Z7 scenario: environmental dimension assessment
The final evaluation of the environmental dimension is the same of the Z6 scenario, because the waste management scheme is the same. The Roma involvement as formal workers into the waste management system is the only difference in comparison with the Z6 scenario, which does not entail any positive or negative effect on the environmental dimension.
4.2.9 Z8: door to door waste collection and domestic composting (Zenica landfill) This scenario represents a further technical upgrade of the Z7 scenario, where also the organic fraction of the municipal solid waste is valorized through the domestic composting process (Figure 4.35). The technical waste management scheme is the same of the one designed for the Z3 scenario. The final waste disposal at the Zenica sanitary landfill and the complete and definitive Zavidovici landfill covering are the only differences in comparison with the Z3 scenario.
Figure 4.35 Z8 scenario waste flows’ scheme
The further organic waste recover entails the reduction of the cost for its transportation and final disposal at the Zenica landfill, reducing consequently the total waste management cost, as well as
0
1
2
3
4Provisioning services
Air quality
Water quality
Soil quality
Z7
Zenicalandfill
Sorting plant
- Non-valuable mixed waste (including glass and 1/3 of organic waste)- 2,000 t/y
- Valuable waste - 1,000 t/y
- Rejected waste - 350 t/y
Local market
- Net valuable waste - 650 t/y
Domestic composting
- 2/3 of organic waste - 1,000 t/y
126
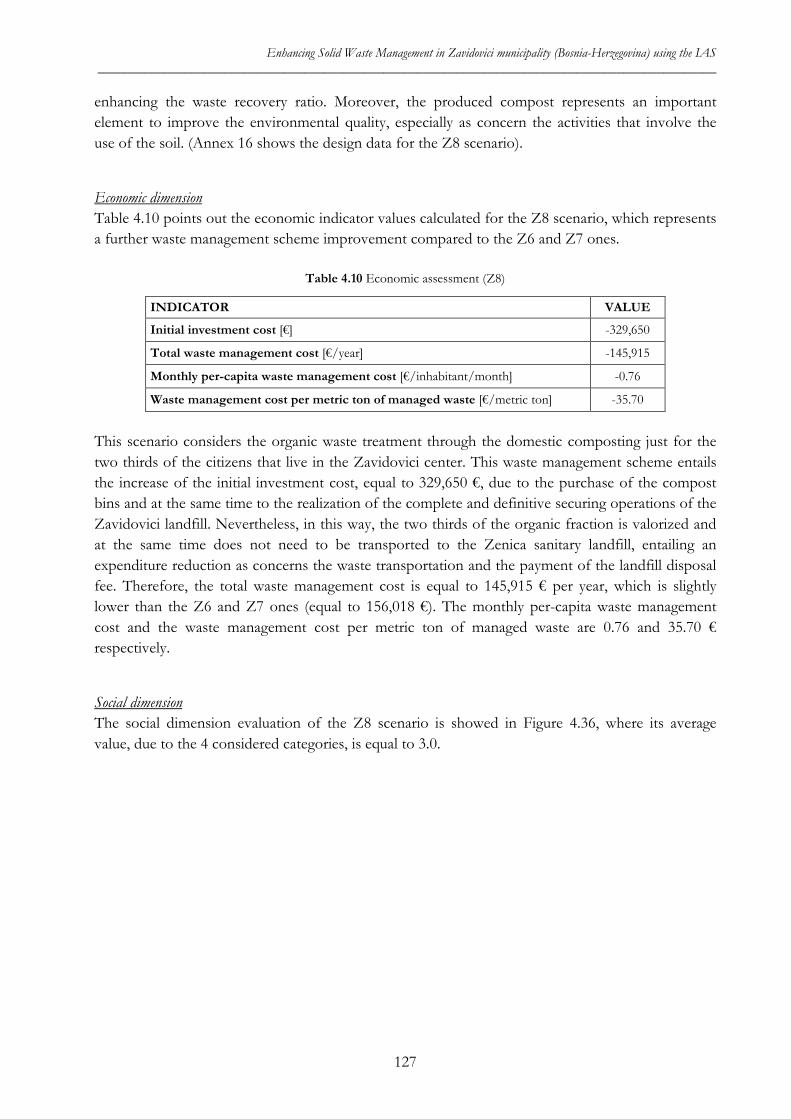
Enhancing Solid Waste Management in Zavidovici municipality (Bosnia-Herzegovina) using the IAS _____________________________________________________________________________________________
enhancing the waste recovery ratio. Moreover, the produced compost represents an important element to improve the environmental quality, especially as concern the activities that involve the use of the soil. (Annex 16 shows the design data for the Z8 scenario).
Economic dimension Table 4.10 points out the economic indicator values calculated for the Z8 scenario, which represents a further waste management scheme improvement compared to the Z6 and Z7 ones.
Table 4.10 Economic assessment (Z8)
INDICATOR VALUE
Initial investment cost [€] -329,650
Total waste management cost [€/year] -145,915
Monthly per-capita waste management cost [€/inhabitant/month] -0.76
Waste management cost per metric ton of managed waste [€/metric ton] -35.70
This scenario considers the organic waste treatment through the domestic composting just for the two thirds of the citizens that live in the Zavidovici center. This waste management scheme entails the increase of the initial investment cost, equal to 329,650 €, due to the purchase of the compost bins and at the same time to the realization of the complete and definitive securing operations of the Zavidovici landfill. Nevertheless, in this way, the two thirds of the organic fraction is valorized and at the same time does not need to be transported to the Zenica sanitary landfill, entailing an expenditure reduction as concerns the waste transportation and the payment of the landfill disposal fee. Therefore, the total waste management cost is equal to 145,915 € per year, which is slightly lower than the Z6 and Z7 ones (equal to 156,018 €). The monthly per-capita waste management cost and the waste management cost per metric ton of managed waste are 0.76 and 35.70 € respectively.
Social dimension The social dimension evaluation of the Z8 scenario is showed in Figure 4.36, where its average value, due to the 4 considered categories, is equal to 3.0.
127
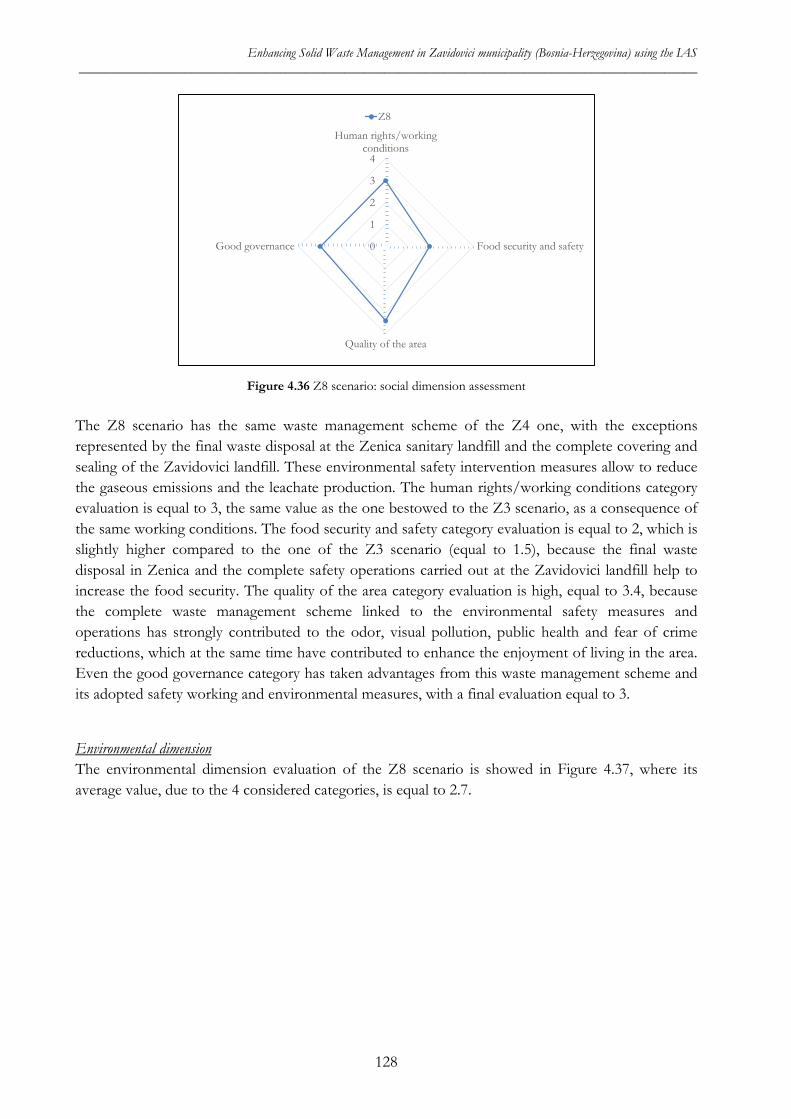
Enhancing Solid Waste Management in Zavidovici municipality (Bosnia-Herzegovina) using the IAS _____________________________________________________________________________________________
Figure 4.36 Z8 scenario: social dimension assessment
The Z8 scenario has the same waste management scheme of the Z4 one, with the exceptions represented by the final waste disposal at the Zenica sanitary landfill and the complete covering and sealing of the Zavidovici landfill. These environmental safety intervention measures allow to reduce the gaseous emissions and the leachate production. The human rights/working conditions category evaluation is equal to 3, the same value as the one bestowed to the Z3 scenario, as a consequence of the same working conditions. The food security and safety category evaluation is equal to 2, which is slightly higher compared to the one of the Z3 scenario (equal to 1.5), because the final waste disposal in Zenica and the complete safety operations carried out at the Zavidovici landfill help to increase the food security. The quality of the area category evaluation is high, equal to 3.4, because the complete waste management scheme linked to the environmental safety measures and operations has strongly contributed to the odor, visual pollution, public health and fear of crime reductions, which at the same time have contributed to enhance the enjoyment of living in the area. Even the good governance category has taken advantages from this waste management scheme and its adopted safety working and environmental measures, with a final evaluation equal to 3.
Environmental dimension The environmental dimension evaluation of the Z8 scenario is showed in Figure 4.37, where its average value, due to the 4 considered categories, is equal to 2.7.
0
1
2
3
4
Human rights/workingconditions
Food security and safety
Quality of the area
Good governance
Z8
128
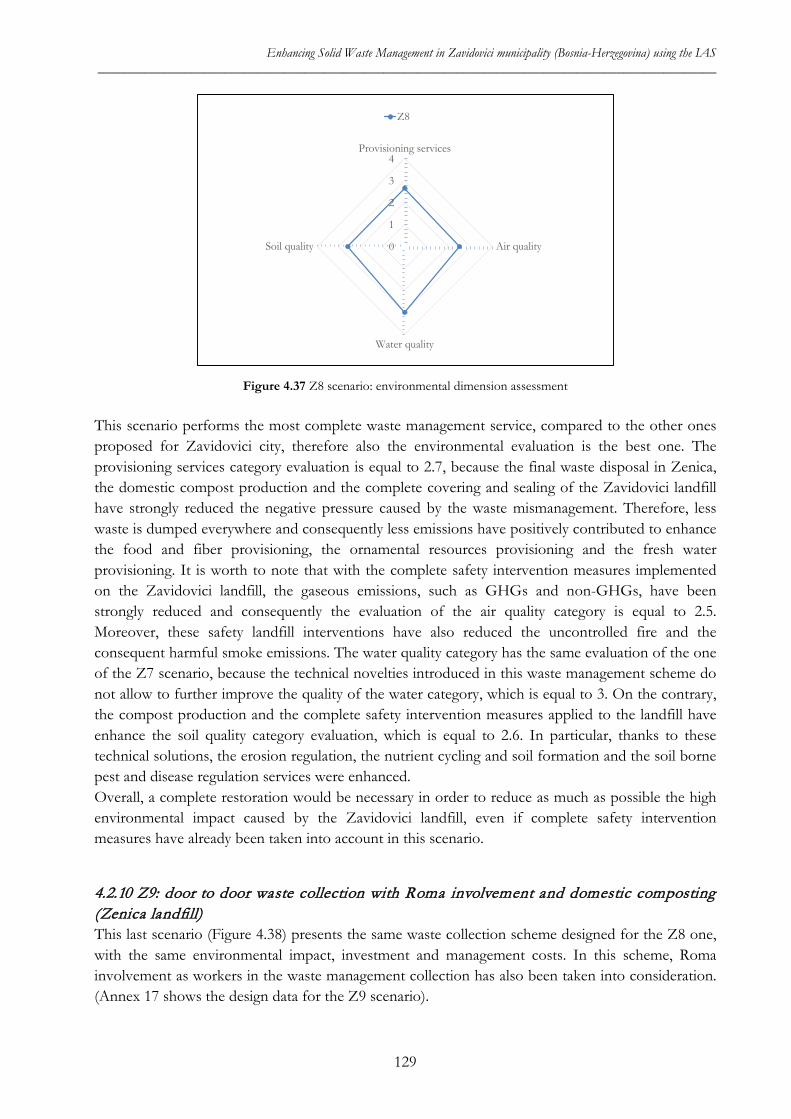
Enhancing Solid Waste Management in Zavidovici municipality (Bosnia-Herzegovina) using the IAS _____________________________________________________________________________________________
Figure 4.37 Z8 scenario: environmental dimension assessment
This scenario performs the most complete waste management service, compared to the other ones proposed for Zavidovici city, therefore also the environmental evaluation is the best one. The provisioning services category evaluation is equal to 2.7, because the final waste disposal in Zenica, the domestic compost production and the complete covering and sealing of the Zavidovici landfill have strongly reduced the negative pressure caused by the waste mismanagement. Therefore, less waste is dumped everywhere and consequently less emissions have positively contributed to enhance the food and fiber provisioning, the ornamental resources provisioning and the fresh water provisioning. It is worth to note that with the complete safety intervention measures implemented on the Zavidovici landfill, the gaseous emissions, such as GHGs and non-GHGs, have been strongly reduced and consequently the evaluation of the air quality category is equal to 2.5. Moreover, these safety landfill interventions have also reduced the uncontrolled fire and the consequent harmful smoke emissions. The water quality category has the same evaluation of the one of the Z7 scenario, because the technical novelties introduced in this waste management scheme do not allow to further improve the quality of the water category, which is equal to 3. On the contrary, the compost production and the complete safety intervention measures applied to the landfill have enhance the soil quality category evaluation, which is equal to 2.6. In particular, thanks to these technical solutions, the erosion regulation, the nutrient cycling and soil formation and the soil borne pest and disease regulation services were enhanced. Overall, a complete restoration would be necessary in order to reduce as much as possible the high environmental impact caused by the Zavidovici landfill, even if complete safety intervention measures have already been taken into account in this scenario.
4.2.10 Z9: door to door waste collection with Roma involvement and domestic composting (Zenica landfill) This last scenario (Figure 4.38) presents the same waste collection scheme designed for the Z8 one, with the same environmental impact, investment and management costs. In this scheme, Roma involvement as workers in the waste management collection has also been taken into consideration. (Annex 17 shows the design data for the Z9 scenario).
0
1
2
3
4Provisioning services
Air quality
Water quality
Soil quality
Z8
129
Enhancing Solid Waste Management in Zavidovici municipality (Bosnia-Herzegovina) using the IAS _____________________________________________________________________________________________
Figure 4.38 Z9 scenario waste flows’ scheme
Roma represent the extra-workers required by this waste management scheme, formally employed by the local public utility. The achievement of this objective should reduce the strong local ethnic discrimination, increasing at the same time the social acceptance of Zavidovici citizens and, globally, the social capital level.
Economic dimension Table 4.9 points out the economic indicator values calculated for the Z9 scenario.
Table 4.11 Economic assessment (Z9)
INDICATOR VALUE
Initial investment cost [€] -329,650
Total waste management cost [€/year] -145,915
Monthly per-capita waste management cost [€/inhabitant/month] -0.76
Waste management cost per metric ton of managed waste [€/metric ton] -35.70
This scenario presents the same economic evaluation of the Z8 one, because the waste management scheme is the same. The only difference is that the extra-workers required by the system are represented by Roma, who are formally employed as all the other local public utility workers. Therefore, in this scenario the new employed Roma, will perceive the same salary of the current local public utility workers, which does not entail any economic variation.
Social dimension The social dimension evaluation of the Z9 scenario is showed in Figure 4.39, where its average value, due to the 4 considered, categories is equal to 3.2.
Zenicalandfill
Sorting plant
- Non-valuable mixed waste (including glass and 1/3 of organic waste)- 2,000 t/y
- Valuable waste - 1,000 t/y
- Rejected waste - 350 t/y
Local market
- Net valuable waste - 650 t/y
Domestic composting
- 2/3 of organic waste - 1,000 t/y
130
Enhancing Solid Waste Management in Zavidovici municipality (Bosnia-Herzegovina) using the IAS _____________________________________________________________________________________________
Figure 4.39 Z9 scenario: social dimension assessment
The Z9 scenario has the same waste management scheme of the Z8 one, with a big exception as concerns the formal employment of some Roma (informal workers). The human rights/working conditions category evaluation is equal to 3.3 and, in particular, equal opportunities/discrimination was evaluated with 4, the best score, because the formal employment of some Roma entails a strong act of acceptance from the local public utility, the municipality and all the resident people in Zavidovici. The food security and safety category evaluation is equal to 2, the same value as the one bestowed to the Z8 scenario, because the technical waste management scheme and the final results are the same. The quality of the area category evaluation is high, equal to 3.4. It is worth to note that the inclusion and the social acceptance of the Roma have reduced the people fear of crime in the city, especially because in most of the cases the criminal activities are linked to the Roma community. The enhancement of the stakeholders participation due to the employment of some Roma and consequently their adaptation to the new formal system, regulated with different rules, has entailed a good governance category evaluation equal to 3.3, which is slightly higher than the one of the Z8 scenario (equal to 3).
Environmental dimension The environmental dimension evaluation of the Z9 scenario is showed in Figure 4.40, where its average value, due to the 4 considered categories, is equal to 2.7.
0
1
2
3
4
Human rights/workingconditions
Food security and safety
Quality of the area
Good governance
Z9
131
Enhancing Solid Waste Management in Zavidovici municipality (Bosnia-Herzegovina) using the IAS _____________________________________________________________________________________________
Figure 4.40 Z9 scenario: environmental dimension assessment
The final evaluation of the environmental dimension is the same of the Z8 scenario, because the waste management scheme is the same. The Roma involvement, as formal workers into the waste management system, is the only difference in comparison with the Z8 scenario, which does not entail any positive or negative effect on the environmental dimension.
4.2.11 Sustainability assessment: the scenarios’ comparison The sustainability assessment is carried out comparing the designed scenarios with all the 3 evaluated dimensions, with the final aim to point out the overall results of the considered context, supporting, at the same time, the decision making process. The Figure 4.41 points out the overall economic dimension evaluation, comparing simultaneously all the considered scenarios.
Figure 4.41 Economic dimension assessment: the scenarios’ comparison
It is worth to note that Figure 4.41 just reports the monthly per-capita waste management cost for each scenario, in order to simplify the comparison and since this indicator considers all the
0
1
2
3
4Provisioning services
Air quality
Water quality
Soil quality
Z9
0.00.20.40.60.81.0
Z0
Z1
Z2
Z3
Z4
Z5
Z6
Z7
Z8
Z9
Economic dimension [€/inhabitant/month]
132
Enhancing Solid Waste Management in Zavidovici municipality (Bosnia-Herzegovina) using the IAS _____________________________________________________________________________________________
expenditures and the earnings of each scenario, except for the earnings coming from the municipal waste fee. Moreover, this indicator allows to easily understand which are the effective expenditures for each inhabitant covered by the waste collection and disposal services. The Z0 scenario monthly per-capita cost is equal to 0.40 €, which entails the mixed waste collection through street containers, and final disposal at the Zavidovici landfill. This cost is controlled, especially because the considered waste management scheme does not require any fee for the waste disposal at the landfill, and at the same time because the provided service is not so complex to be carried out by the local public utility. The monthly per-capita cost of the Z1, Z2, Z3, and Z4 scenarios, where the waste is still disposed of at the Zavidovici landfill, are 0.33, 0.33, 0.41 and 0.41 € respectively. The Z1 and Z2 scenarios, which have the same cost due to the same waste management scheme, are characterized by a lower monthly per-capita waste management cost than the Z0 one. This is due to the door to door waste collection that allows to separate paper, plastic and metal wastes and consequently earning money, even if some initial investment costs have to be considered in order to realize the sorting plant and to buy all the necessary staff to perform the door to door collection. The monthly per-capita waste management cost of the Z3 and Z4 scenarios, which is the same, increases compared to the Z0, Z1, and Z2 ones. This is due to the higher initial investment, required in order to buy the domestic compost bins, and at the same time to realize the partial covering of the Zavidovici landfill, with the final aim to introduce safety measures able to reduce the environmental impact. The monthly per-capita cost of the scenarios Z5, Z6, Z7, Z8 and Z9 are 0.97, 0.81, 0.81, 0.76 and 0.76 € respectively. The introduction of the final waste disposal at the Zenica landfill has doubled the monthly per-capita waste management cost for all these last scenarios (Z5, Z6, Z7, Z8, Z9), as a consequence of the waste transportation cost to Zenica and the disposal fee required by the sanitary landfill. Nevertheless, thanks to the dry and organic waste valorization is possible to reduce the expenditures of the waste management. In particular, from the paper, plastic and metal wastes recovering is possible to earn money and at the same time to reduce the amount of waste that has to be transported to the Zenica landfill, as well the further waste disposal reduction through the domestic composting. Indeed, it was observed a gradual monthly per-capita waste management cost reduction passing from Z5 to Z9 scenario, thanks to the enhancement of the amount of valorized waste. Nevertheless, more complex the waste management scheme, higher the waste management cost. The Figure 4.42 points out the overall social dimension evaluation.
Figure 4.42 Social dimension assessment: the scenarios’ comparison
0
1
2
3
4Z0
Z1
Z2
Z3
Z4
Z5
Z6
Z7
Z8
Z9
Social dimension
133
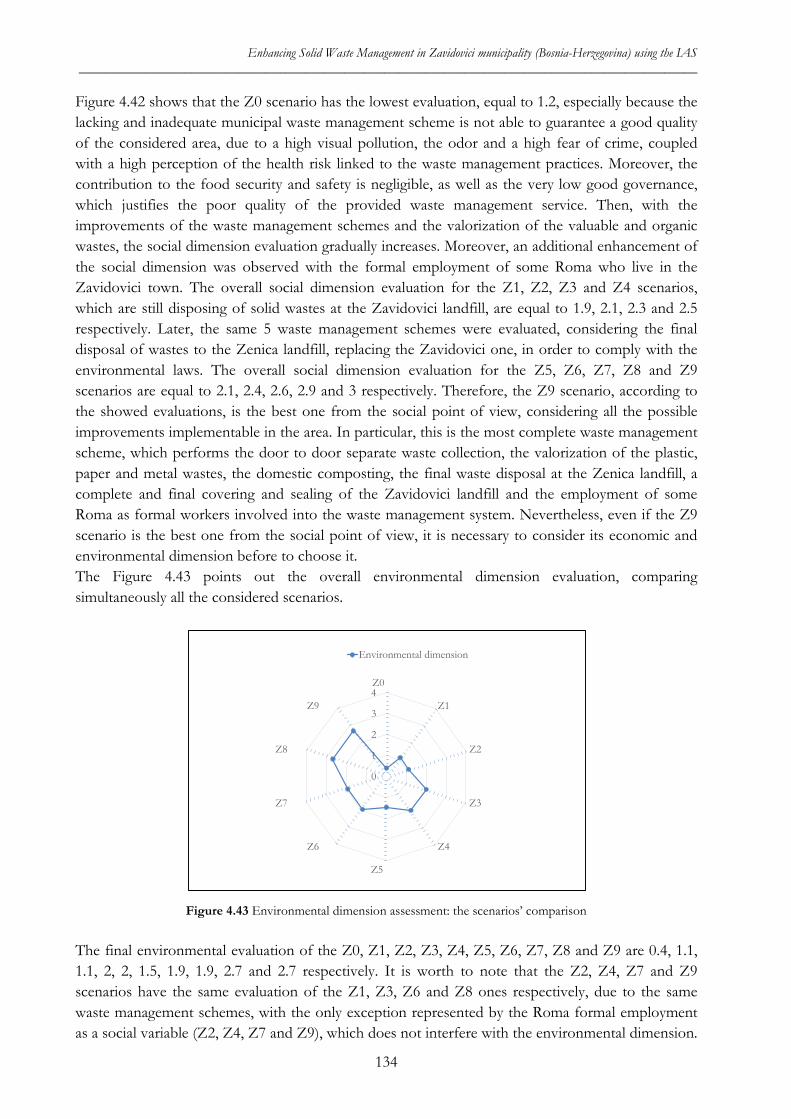
Enhancing Solid Waste Management in Zavidovici municipality (Bosnia-Herzegovina) using the IAS _____________________________________________________________________________________________
Figure 4.42 shows that the Z0 scenario has the lowest evaluation, equal to 1.2, especially because the lacking and inadequate municipal waste management scheme is not able to guarantee a good quality of the considered area, due to a high visual pollution, the odor and a high fear of crime, coupled with a high perception of the health risk linked to the waste management practices. Moreover, the contribution to the food security and safety is negligible, as well as the very low good governance, which justifies the poor quality of the provided waste management service. Then, with the improvements of the waste management schemes and the valorization of the valuable and organic wastes, the social dimension evaluation gradually increases. Moreover, an additional enhancement of the social dimension was observed with the formal employment of some Roma who live in the Zavidovici town. The overall social dimension evaluation for the Z1, Z2, Z3 and Z4 scenarios, which are still disposing of solid wastes at the Zavidovici landfill, are equal to 1.9, 2.1, 2.3 and 2.5 respectively. Later, the same 5 waste management schemes were evaluated, considering the final disposal of wastes to the Zenica landfill, replacing the Zavidovici one, in order to comply with the environmental laws. The overall social dimension evaluation for the Z5, Z6, Z7, Z8 and Z9 scenarios are equal to 2.1, 2.4, 2.6, 2.9 and 3 respectively. Therefore, the Z9 scenario, according to the showed evaluations, is the best one from the social point of view, considering all the possible improvements implementable in the area. In particular, this is the most complete waste management scheme, which performs the door to door separate waste collection, the valorization of the plastic, paper and metal wastes, the domestic composting, the final waste disposal at the Zenica landfill, a complete and final covering and sealing of the Zavidovici landfill and the employment of some Roma as formal workers involved into the waste management system. Nevertheless, even if the Z9 scenario is the best one from the social point of view, it is necessary to consider its economic and environmental dimension before to choose it. The Figure 4.43 points out the overall environmental dimension evaluation, comparing simultaneously all the considered scenarios.
Figure 4.43 Environmental dimension assessment: the scenarios’ comparison
The final environmental evaluation of the Z0, Z1, Z2, Z3, Z4, Z5, Z6, Z7, Z8 and Z9 are 0.4, 1.1, 1.1, 2, 2, 1.5, 1.9, 1.9, 2.7 and 2.7 respectively. It is worth to note that the Z2, Z4, Z7 and Z9 scenarios have the same evaluation of the Z1, Z3, Z6 and Z8 ones respectively, due to the same waste management schemes, with the only exception represented by the Roma formal employment as a social variable (Z2, Z4, Z7 and Z9), which does not interfere with the environmental dimension.
0
1
2
3
4Z0
Z1
Z2
Z3
Z4
Z5
Z6
Z7
Z8
Z9
Environmental dimension
134
Enhancing Solid Waste Management in Zavidovici municipality (Bosnia-Herzegovina) using the IAS _____________________________________________________________________________________________
Globally, figure 4.43 points out an environmental enhancement passing from the Z0 scenario, the worst one from a technical point of view, to the Z9 scenario, which is the best one as concern the technical waste treatments and processes. Every time that an improvement, such as dry waste valorization, domestic composting, safety intervention measures to the Zavidovici landfill and final waste disposal at the Zenica landfill, has been implemented in a scenario, an environmental impact reduction was observed. Nevertheless, it is worth to underline that the environmental evaluation takes also into account ecosystem services, such as the provisioning and regulating services, which are influenced by the environmental impact, but also by the benefits that a scenario can provide to them. Therefore, even if the waste management scheme of the Z5 scenario seems to be more secure from the environmental point of view, compared to the one of the Z4 scenario, the final environmental evaluation is lower than the Z4 one. Despite the Z5 scenario performs the final waste disposal in Zenica, which entails a higher environmental pollution reduction in Zavidovici town, there is not any support to enhance the ecosystem services, as, on the contrary, the Z4 scenario, characterized by the domestic composting, positively contributes to the soil erosion regulation and to the nutrient cycling and soil formation. Therefore, the Z8 and Z9 scenarios are the best one as concerns the environmental point of view, considering all the suitable improvements implementable in the area. This is due to the adopted waste management scheme that allows to strongly reduce the environmental impact caused by the waste pollution, but at the same time provides benefits for the considered ecosystem services.
4.3 Conclusions The IAS scheme was applied to provide the sustainability assessment of 10 different scenarios, the existing one (Z0), evaluated directly in the field, and 9 new scenarios designed to improve the lacking Z0 waste management scheme. In particular, 9 different technical solutions were designed in order to improve the Z0 scenario and entail future changes as concern the economic, social and environmental dimensions of the Zavidovici city. The technical solutions were designed according to the data and information collected through direct field observations, structured interviews with the main stakeholders, and meetings with local citizens, in order to understand their perceptions and feeling about the waste management problems. The new waste management schemes were designed in order to satisfy the sustainability concept, according to the waste management hierarchy. Therefore, gradually and step by step, the door to door waste collection, the secondary raw material valorization, the household composting and the implementation of safety measures to control the Zavidovici landfill were considered. The valuable waste valorization, especially as concerns the paper, plastic and metal waste, represents a very interesting solution, because in Zavidovici exists an intensive market of the secondary raw material, which easily allows to sell all the collected material and consequently earn money and save raw material. The type of waste management scheme has a high influence on the amount of waste flows. In particular, the Z0 and Z5 scenarios, which do not perform any waste valorization treatment, dispose of in the landfill (Zavidovici, Zenica) approximately 4,000 metric tons of waste per year. The Z1, Z2, Z6 and Z7 scenarios, which perform the waste valorization of the paper, plastic and metal, would dispose of in the landfill (Zavidovici, Zenica) approximately 3,350 metric tons of waste per year, and valorize approximately 650 metric tons of waste per year. The Z3, Z4, Z8 and Z9 scenarios, which perform the waste valorization of the paper, plastic, metal and the organic fractions of municipal solid waste, would dispose of in the landfill (Zavidovici, Zenica) approximately 2,350 metric tons of
135
Enhancing Solid Waste Management in Zavidovici municipality (Bosnia-Herzegovina) using the IAS _____________________________________________________________________________________________
waste per year, and valorize approximately 1,650 metric tons of waste per year. Therefore, it clearly appears that paper, plastic, metal and organic waste valorization allows to almost halve the amount of waste disposal to the landfill. It is worth to note that the glass valorization was not taken into account because in Bosnia there are not industries that produce glass products, thus with the possibility to recover this secondary raw material. Indeed, the glass should be transported in Serbia for its valorization, and since the transport cost would be higher than the earning, this solution is not economically feasible. This constraint forces to dispose of at the landfill approximately 600 metric tons of glass per year. The final results carried out for the scenarios assessment point out a set of different solutions that the local stakeholders have to analyze and choose according to their basic needs and requirements in order to fulfill them. For example, Z9 scenario entails the best technical solution for the waste collection and disposal, which allows to reach the best evaluation as concerns the environmental and social dimension, even if the economic expenditure to support this solution is double than the current waste management system Z0. The scenarios assessment points out that the Roma, the Zavidovici informal waste collectors, were almost excluded from the collection activities in the city center, due to the introduction of the door to door waste collection, which allows to have a high control and collection ratio directly at the source. Nevertheless, the proposal of the formal employment of some Roma has been taken into account in order to face this problem, trying to gradually increase the involvement of this discriminate ethnic group into the Zavidovici community. The final results of this assessment were presented, during an official meeting, to the local Zavidovici stakeholders, in particular the Municipality and the local public utility teams. The meeting pointed out that the local stakeholders were aware about some of the current waste management problems, but without a clear idea about the possible entailed consequences. Indeed, the possible changes and influences on the economic, social and environmental dimensions, entailed by the different type of scenarios, have received a lot of attention and surprise into the meeting participants. Currently, the real Zavidovici main constraint about the waste management is the new environmental law fulfillment, which forces the waste final disposal at a sanitary landfill. Therefore, the waste should be transported from Zavidovici to Zenica landfill, which strongly entails the waste management cost raising, due to the transport cost and the waste disposal fee. The Municipality and the local public utility were very interested about the solutions proposed into Z5, Z6, Z7, Z8 and Z9 scenarios, because they need an appropriate technical support to implement the proposed novelties, even if, the Municipality was worried about the high cost entailed by these scenarios (Z5, Z6, Z7, Z8, Z9), double than the one of the Z0 scenario. Nevertheless, the Municipality has to improve the fee collection system as concerns the waste management service, which currently is not satisfactory and sufficient, in order to face and minimize as much as possible the proposed waste management cost, allowing their implementation. Currently, the Municipality and the local public utility are trying to organize and provide a mixed separated waste collection with the final disposal to Zenica sanitary landfill, in order to satisfy their basic needs. The IAS should be applied even after the implementation of the proposed scenarios, in order to evaluate if the expected results will be fulfilled. In this way it would be possible to analyze the project sustainability or, in other words, the efficiency over time.
136
Enhancing Solid Waste Management in Zavidovici municipality (Bosnia-Herzegovina) using the IAS _____________________________________________________________________________________________
References
[1] CIA. The World Factbook. Available online at: https://www.cia.gov/library/publications/the-world-factbook/geos/bk.html. (Accessed: 12/11/2014).
[2] UNDP (2014). Human Development Report 2014. Sustaining Human Progress: Reducing Vulnerabilities and Building Resilience. Available online at: http://hdr.undp.org/sites/default/files/hdr14-report-en-1.pdf. (Accessed: 12/11/2014).
[3] Wikipedia (2014). Gross Domestic Product Definition. Available online at: http://en.wikipedia.org/wiki/Gross_domestic_product. (Accessed: 12/11/2014).
[4] Agency for Statistics Bosnia and Herzegovina. Available online at: http://dissemination.bhas.ba/PXWeb/pxweb/en/Census%202013%20-%20Popis%202013%20-%20%D0%9F%D0%BE%D0%BF%D0%B8%D1%81%202013/Census%202013%20-%20Popis%202013%20-%20%D0%9F%D0%BE%D0%BF%D0%B8%D1%81%202013/Preliminarni_rezultati_Import_Opcine.px/table/tableViewLayout1/?rxid=8d98a7a6-a73a-491b-8e73-527ad7361011 (Accessed: 12/11/2014).
[5] Vaccari, M., Di Bella, V., Vitali, F., Collivignarelli, C. (2013). From mixed to separated collection of solid waste: Benefits for the town of Zavidovici (Bosnia and Herzegovina). Waste Management, 33, 277-286.
[6] Provincia di Cremona. Ufficio per la cooperazione e la Solidarietà Internazionale (2008). Analisi dei bisogni e delle problematiche sociali nell’area di Zavidovici. Available online at: file:///C:/Users/Cetamb/Downloads/Ald%20Italy%20HIGH%20(1).pdf. (Accessed: 12/11/2014).
[7] ADL a Zavidovici (2013). Personal communications with the local country delegate.
[8] Zavidovici Municipality (2013). Personal communication with the local council members.
[9] Vaccari, M., Vitali, F., Collivignarelli, C. (2011). Libro Bianco dei Servizi Ambientali a Zavidovici (BiH). ISBN 978-88-97307-03-7.
137
Enhancing Solid Waste Management in Zavidovici municipality (Bosnia-Herzegovina) using the IAS _____________________________________________________________________________________________
138
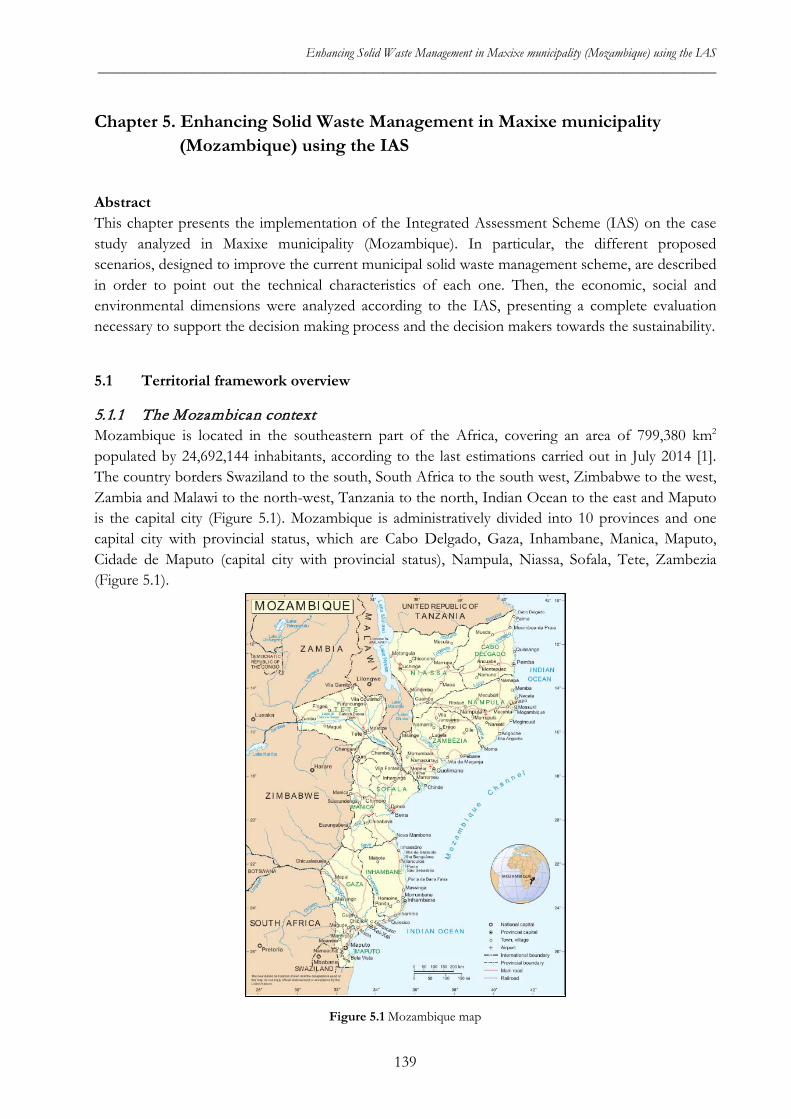
Enhancing Solid Waste Management in Maxixe municipality (Mozambique) using the IAS _____________________________________________________________________________________________
Chapter 5. Enhancing Solid Waste Management in Maxixe municipality (Mozambique) using the IAS
Abstract This chapter presents the implementation of the Integrated Assessment Scheme (IAS) on the case study analyzed in Maxixe municipality (Mozambique). In particular, the different proposed scenarios, designed to improve the current municipal solid waste management scheme, are described in order to point out the technical characteristics of each one. Then, the economic, social and environmental dimensions were analyzed according to the IAS, presenting a complete evaluation necessary to support the decision making process and the decision makers towards the sustainability.
5.1 Territorial framework overview
5.1.1 The Mozambican context Mozambique is located in the southeastern part of the Africa, covering an area of 799,380 km2 populated by 24,692,144 inhabitants, according to the last estimations carried out in July 2014 [1]. The country borders Swaziland to the south, South Africa to the south west, Zimbabwe to the west, Zambia and Malawi to the north-west, Tanzania to the north, Indian Ocean to the east and Maputo is the capital city (Figure 5.1). Mozambique is administratively divided into 10 provinces and one capital city with provincial status, which are Cabo Delgado, Gaza, Inhambane, Manica, Maputo, Cidade de Maputo (capital city with provincial status), Nampula, Niassa, Sofala, Tete, Zambezia (Figure 5.1).
Figure 5.1 Mozambique map
139
Enhancing Solid Waste Management in Maxixe municipality (Mozambique) using the IAS _____________________________________________________________________________________________
Mozambique is mainly composed by African ethnic groups such as Makhuwa, Tsonga, Lomwe and Sena, which belong to different religions, for instance the Roman Catholic (28.4%), the Muslim (17.9%), the Zionist Christian (15.5%), the Protestant (12.2%), other (6.7%), none (18.7%). The official language is Portuguese (10.7%), but there are many other ones, such as the Emakhuwa (25.3%), the Xichangana (10.3%), the Cisena (7.5%), the Elomwe (7%), the Echuwabo (5.1%) and other Mozambican languages (30.1%) [1]. In 1975, Mozambique became independent from the Portuguese colony and consequently the Portuguese government recognized the FRELIMO (Frente de Liberation of Mozambique/The ruling Front for the liberation of Mozambique) party as legitimate representative of the Mozambican people. Nevertheless, in 1981 the FRELIMO clashed into a civil war against the opposite party, the RENAMO (Resisténcia Nacional de Moçambique/Mozambique national resistance), guided by the rebels of the Mozambique national resistance. The civil war lasted 11 years, till to 1992, when the Rome peace accords, negotiated by the Community of Sant’Egidio25 with the support of the United Nations, signed the end of fight, leaving the Mozambican state in disastrous living conditions. Mozambique is ranked 178th out of 187 countries in the 2013 United Nations (UN) Human Development Index (HDI)26 [3], and the HDI value for 2013 was 0.393, which definitively classify the Mozambique as low income country. The unemployment ratio of the country is equal to 17% [1], nevertheless the 52% of the population lives below the poverty line. According to the estimates provided by the Central Intelligence Agency (CIA) [1], the economic sector is composed by the agriculture for the 81%, by industry for the 6% and by services for the 13%. In particular cotton, cashew nuts, sugarcane, tea, cassava (manioc, tapioca), corn, coconuts, sisal, citrus, tropical fruits, potatoes, sunflowers, beef and poultry are the main agricultural products, while aluminum, petroleum products, chemicals (fertilizer, soap, paints), textiles, cement, glass, asbestos, tobacco, food and the beverages are the main industrial products. The per-capita Gross Domestic Product (GDP)27 of the country is equal to 1,200 USD28, which ranks the Mozambique 213st out of 228 considered countries [1]. Thus, it clearly appears that Mozambique is extremely poor and consequently needs some international aids to enhance the minimum living standards for the people.
5.1.2 The Maxixe municipality The research activities were carried out in Maxixe, which is a city located on the coast of the Inhambane province (Figure 5.2). Maxixe city, which coincides with the administrative district of the same name, covers a geographical area about 268 km², and the resident living population in the city is equal to 125,208, according to current the INE29 estimations [5]. This data sounds reasonable, because in 2007, the census carried out by INE stated that the living inhabitants in the city were equal to 111,771 [6], entailing a consistent population growth compared with the estimations of 2013 [5]. Currently, Maxixe municipality is waiting the fourth INE census that will carry out in 2017
25 The Community of Sant'Egidio (Italian: Comunità di Sant'Egidio) is a Christian community that is officially recognized by the Catholic Church as a "Church public lay association" [2]. 26 The Human Development Index (HDI) is a summary measure for assessing long-term progress in three basic dimensions of human development: a long and healthy life, access to knowledge and a decent standard of living. 27 Gross domestic product (GDP) is an aggregate measure of production equal to the sum of the gross values added of all resident institutional units engaged in production (plus any taxes, and minus any subsidies, on products not included in the value of their outputs) [4] 28 USD is the United States Dollars 29 INE: Instituto Nacional de Estatistica: The national Institute of Statistics is located in Mozambique and provide all the data about the statistics of the country and its provinces and district
140
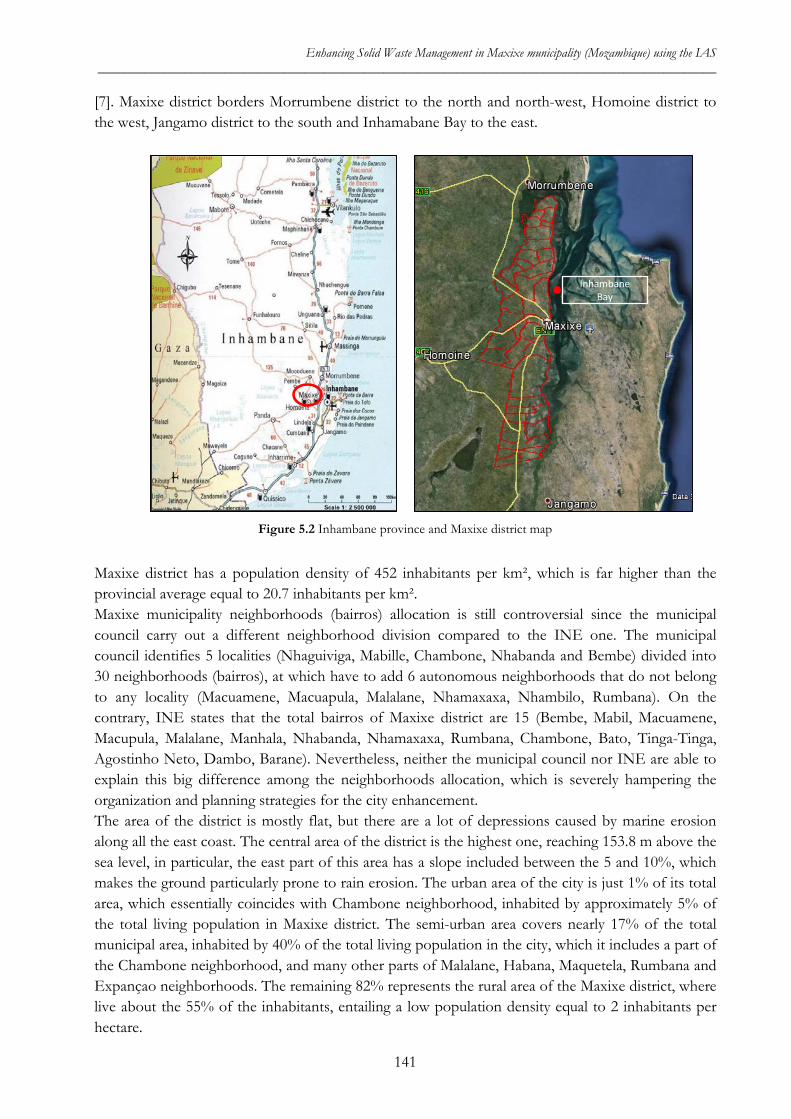
Enhancing Solid Waste Management in Maxixe municipality (Mozambique) using the IAS _____________________________________________________________________________________________
[7]. Maxixe district borders Morrumbene district to the north and north-west, Homoine district to the west, Jangamo district to the south and Inhamabane Bay to the east.
Figure 5.2 Inhambane province and Maxixe district map
Maxixe district has a population density of 452 inhabitants per km², which is far higher than the provincial average equal to 20.7 inhabitants per km². Maxixe municipality neighborhoods (bairros) allocation is still controversial since the municipal council carry out a different neighborhood division compared to the INE one. The municipal council identifies 5 localities (Nhaguiviga, Mabille, Chambone, Nhabanda and Bembe) divided into 30 neighborhoods (bairros), at which have to add 6 autonomous neighborhoods that do not belong to any locality (Macuamene, Macuapula, Malalane, Nhamaxaxa, Nhambilo, Rumbana). On the contrary, INE states that the total bairros of Maxixe district are 15 (Bembe, Mabil, Macuamene, Macupula, Malalane, Manhala, Nhabanda, Nhamaxaxa, Rumbana, Chambone, Bato, Tinga-Tinga, Agostinho Neto, Dambo, Barane). Nevertheless, neither the municipal council nor INE are able to explain this big difference among the neighborhoods allocation, which is severely hampering the organization and planning strategies for the city enhancement. The area of the district is mostly flat, but there are a lot of depressions caused by marine erosion along all the east coast. The central area of the district is the highest one, reaching 153.8 m above the sea level, in particular, the east part of this area has a slope included between the 5 and 10%, which makes the ground particularly prone to rain erosion. The urban area of the city is just 1% of its total area, which essentially coincides with Chambone neighborhood, inhabited by approximately 5% of the total living population in Maxixe district. The semi-urban area covers nearly 17% of the total municipal area, inhabited by 40% of the total living population in the city, which it includes a part of the Chambone neighborhood, and many other parts of Malalane, Habana, Maquetela, Rumbana and Expançao neighborhoods. The remaining 82% represents the rural area of the Maxixe district, where live about the 55% of the inhabitants, entailing a low population density equal to 2 inhabitants per hectare.
Inhambane Bay
141
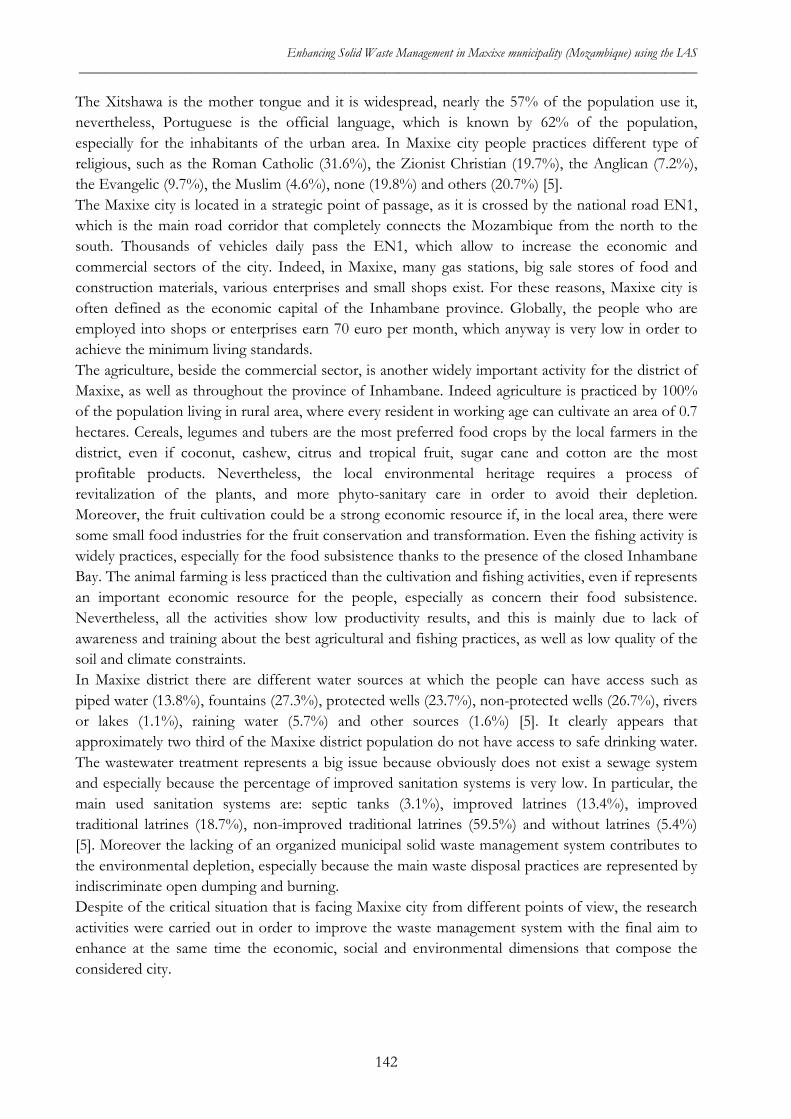
Enhancing Solid Waste Management in Maxixe municipality (Mozambique) using the IAS _____________________________________________________________________________________________
The Xitshawa is the mother tongue and it is widespread, nearly the 57% of the population use it, nevertheless, Portuguese is the official language, which is known by 62% of the population, especially for the inhabitants of the urban area. In Maxixe city people practices different type of religious, such as the Roman Catholic (31.6%), the Zionist Christian (19.7%), the Anglican (7.2%), the Evangelic (9.7%), the Muslim (4.6%), none (19.8%) and others (20.7%) [5]. The Maxixe city is located in a strategic point of passage, as it is crossed by the national road EN1, which is the main road corridor that completely connects the Mozambique from the north to the south. Thousands of vehicles daily pass the EN1, which allow to increase the economic and commercial sectors of the city. Indeed, in Maxixe, many gas stations, big sale stores of food and construction materials, various enterprises and small shops exist. For these reasons, Maxixe city is often defined as the economic capital of the Inhambane province. Globally, the people who are employed into shops or enterprises earn 70 euro per month, which anyway is very low in order to achieve the minimum living standards. The agriculture, beside the commercial sector, is another widely important activity for the district of Maxixe, as well as throughout the province of Inhambane. Indeed agriculture is practiced by 100% of the population living in rural area, where every resident in working age can cultivate an area of 0.7 hectares. Cereals, legumes and tubers are the most preferred food crops by the local farmers in the district, even if coconut, cashew, citrus and tropical fruit, sugar cane and cotton are the most profitable products. Nevertheless, the local environmental heritage requires a process of revitalization of the plants, and more phyto-sanitary care in order to avoid their depletion. Moreover, the fruit cultivation could be a strong economic resource if, in the local area, there were some small food industries for the fruit conservation and transformation. Even the fishing activity is widely practices, especially for the food subsistence thanks to the presence of the closed Inhambane Bay. The animal farming is less practiced than the cultivation and fishing activities, even if represents an important economic resource for the people, especially as concern their food subsistence. Nevertheless, all the activities show low productivity results, and this is mainly due to lack of awareness and training about the best agricultural and fishing practices, as well as low quality of the soil and climate constraints. In Maxixe district there are different water sources at which the people can have access such as piped water (13.8%), fountains (27.3%), protected wells (23.7%), non-protected wells (26.7%), rivers or lakes (1.1%), raining water (5.7%) and other sources (1.6%) [5]. It clearly appears that approximately two third of the Maxixe district population do not have access to safe drinking water. The wastewater treatment represents a big issue because obviously does not exist a sewage system and especially because the percentage of improved sanitation systems is very low. In particular, the main used sanitation systems are: septic tanks (3.1%), improved latrines (13.4%), improved traditional latrines (18.7%), non-improved traditional latrines (59.5%) and without latrines (5.4%) [5]. Moreover the lacking of an organized municipal solid waste management system contributes to the environmental depletion, especially because the main waste disposal practices are represented by indiscriminate open dumping and burning. Despite of the critical situation that is facing Maxixe city from different points of view, the research activities were carried out in order to improve the waste management system with the final aim to enhance at the same time the economic, social and environmental dimensions that compose the considered city.
142
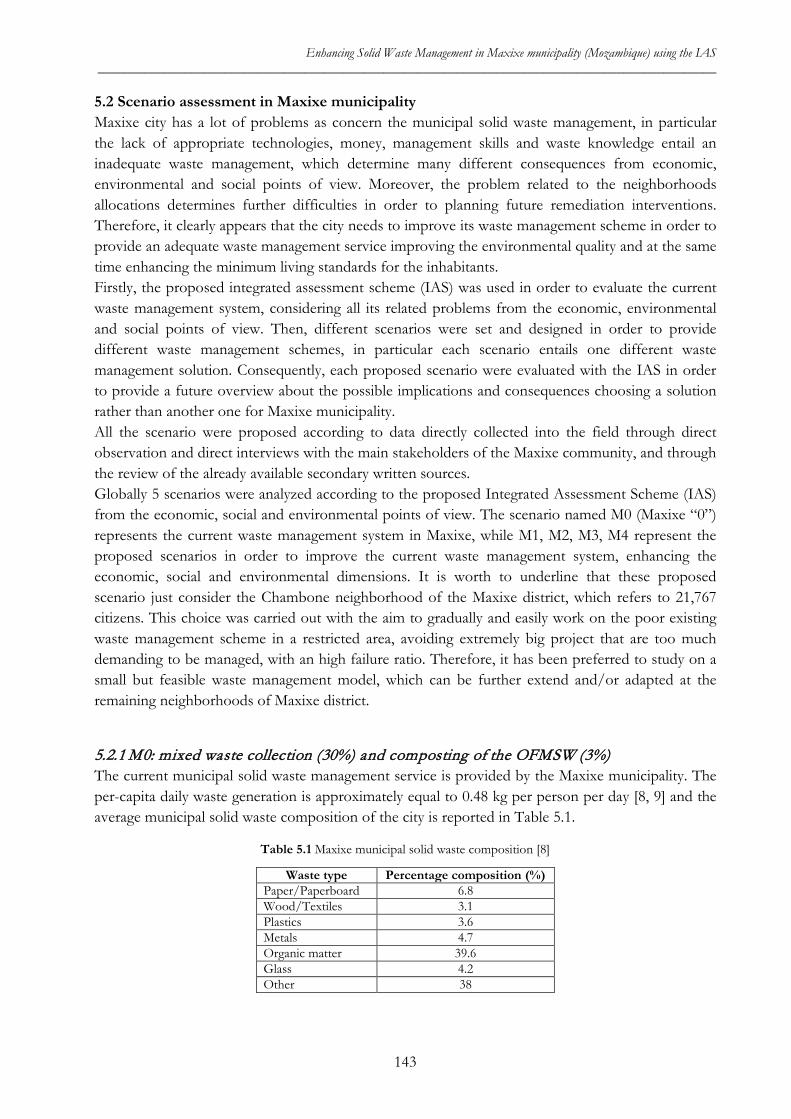
Enhancing Solid Waste Management in Maxixe municipality (Mozambique) using the IAS _____________________________________________________________________________________________
5.2 Scenario assessment in Maxixe municipality Maxixe city has a lot of problems as concern the municipal solid waste management, in particular the lack of appropriate technologies, money, management skills and waste knowledge entail an inadequate waste management, which determine many different consequences from economic, environmental and social points of view. Moreover, the problem related to the neighborhoods allocations determines further difficulties in order to planning future remediation interventions. Therefore, it clearly appears that the city needs to improve its waste management scheme in order to provide an adequate waste management service improving the environmental quality and at the same time enhancing the minimum living standards for the inhabitants. Firstly, the proposed integrated assessment scheme (IAS) was used in order to evaluate the current waste management system, considering all its related problems from the economic, environmental and social points of view. Then, different scenarios were set and designed in order to provide different waste management schemes, in particular each scenario entails one different waste management solution. Consequently, each proposed scenario were evaluated with the IAS in order to provide a future overview about the possible implications and consequences choosing a solution rather than another one for Maxixe municipality. All the scenario were proposed according to data directly collected into the field through direct observation and direct interviews with the main stakeholders of the Maxixe community, and through the review of the already available secondary written sources. Globally 5 scenarios were analyzed according to the proposed Integrated Assessment Scheme (IAS) from the economic, social and environmental points of view. The scenario named M0 (Maxixe “0”) represents the current waste management system in Maxixe, while M1, M2, M3, M4 represent the proposed scenarios in order to improve the current waste management system, enhancing the economic, social and environmental dimensions. It is worth to underline that these proposed scenario just consider the Chambone neighborhood of the Maxixe district, which refers to 21,767 citizens. This choice was carried out with the aim to gradually and easily work on the poor existing waste management scheme in a restricted area, avoiding extremely big project that are too much demanding to be managed, with an high failure ratio. Therefore, it has been preferred to study on a small but feasible waste management model, which can be further extend and/or adapted at the remaining neighborhoods of Maxixe district.
5.2.1 M0: mixed waste collection (30%) and composting of the OFMSW (3%) The current municipal solid waste management service is provided by the Maxixe municipality. The per-capita daily waste generation is approximately equal to 0.48 kg per person per day [8, 9] and the average municipal solid waste composition of the city is reported in Table 5.1.
Table 5.1 Maxixe municipal solid waste composition [8]
Waste type Percentage composition (%) Paper/Paperboard 6.8 Wood/Textiles 3.1 Plastics 3.6 Metals 4.7 Organic matter 39.6 Glass 4.2 Other 38
143
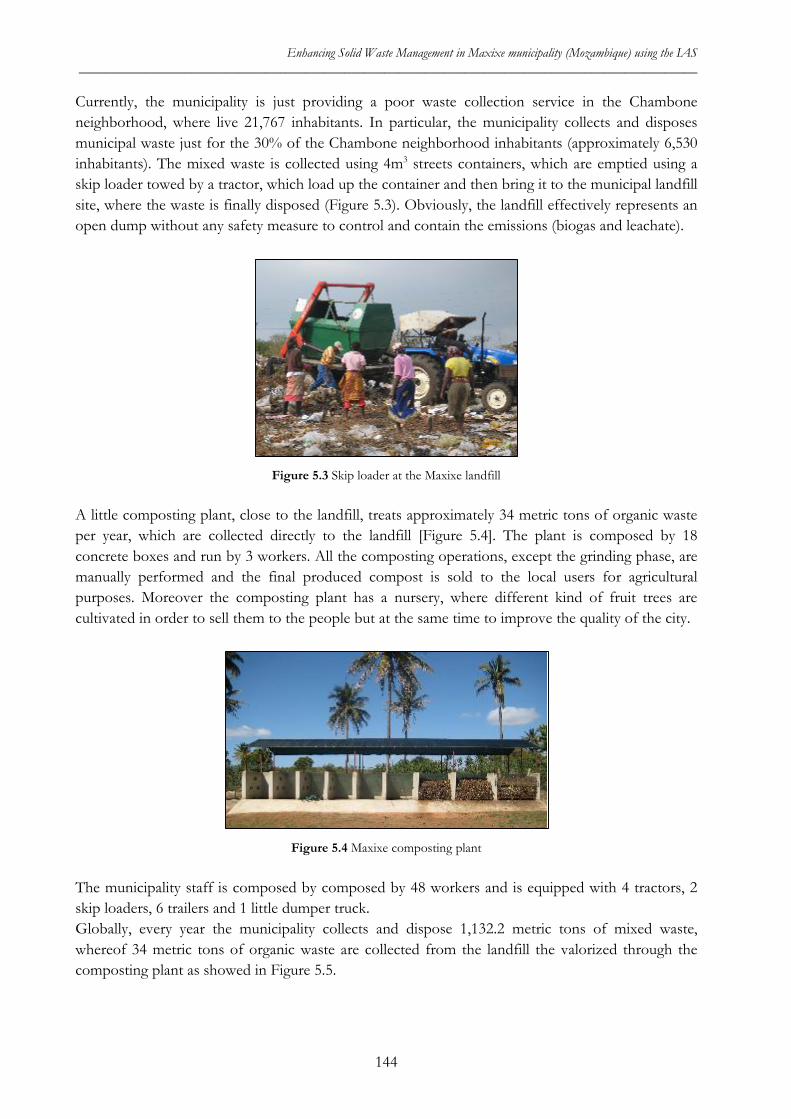
Enhancing Solid Waste Management in Maxixe municipality (Mozambique) using the IAS _____________________________________________________________________________________________
Currently, the municipality is just providing a poor waste collection service in the Chambone neighborhood, where live 21,767 inhabitants. In particular, the municipality collects and disposes municipal waste just for the 30% of the Chambone neighborhood inhabitants (approximately 6,530 inhabitants). The mixed waste is collected using 4m3 streets containers, which are emptied using a skip loader towed by a tractor, which load up the container and then bring it to the municipal landfill site, where the waste is finally disposed (Figure 5.3). Obviously, the landfill effectively represents an open dump without any safety measure to control and contain the emissions (biogas and leachate).
Figure 5.3 Skip loader at the Maxixe landfill
A little composting plant, close to the landfill, treats approximately 34 metric tons of organic waste per year, which are collected directly to the landfill [Figure 5.4]. The plant is composed by 18 concrete boxes and run by 3 workers. All the composting operations, except the grinding phase, are manually performed and the final produced compost is sold to the local users for agricultural purposes. Moreover the composting plant has a nursery, where different kind of fruit trees are cultivated in order to sell them to the people but at the same time to improve the quality of the city.
Figure 5.4 Maxixe composting plant
The municipality staff is composed by composed by 48 workers and is equipped with 4 tractors, 2 skip loaders, 6 trailers and 1 little dumper truck. Globally, every year the municipality collects and dispose 1,132.2 metric tons of mixed waste, whereof 34 metric tons of organic waste are collected from the landfill the valorized through the composting plant as showed in Figure 5.5.
144
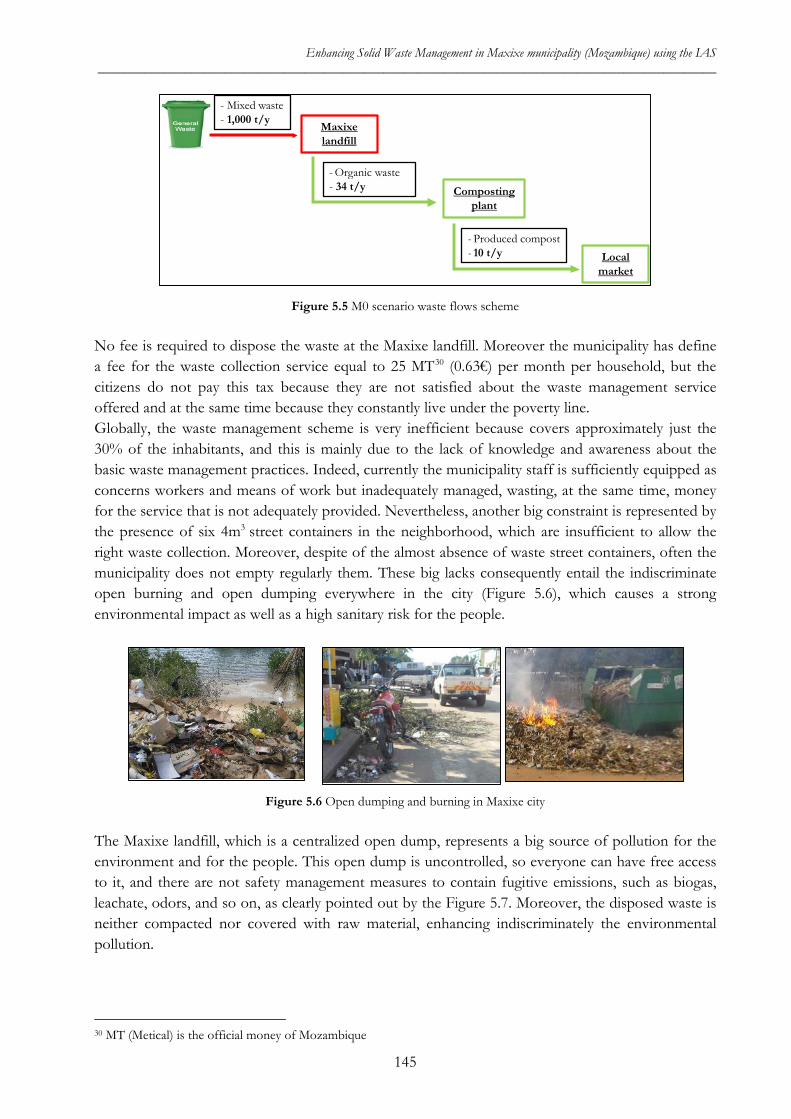
Enhancing Solid Waste Management in Maxixe municipality (Mozambique) using the IAS _____________________________________________________________________________________________
Figure 5.5 M0 scenario waste flows scheme
No fee is required to dispose the waste at the Maxixe landfill. Moreover the municipality has define a fee for the waste collection service equal to 25 MT30 (0.63€) per month per household, but the citizens do not pay this tax because they are not satisfied about the waste management service offered and at the same time because they constantly live under the poverty line. Globally, the waste management scheme is very inefficient because covers approximately just the 30% of the inhabitants, and this is mainly due to the lack of knowledge and awareness about the basic waste management practices. Indeed, currently the municipality staff is sufficiently equipped as concerns workers and means of work but inadequately managed, wasting, at the same time, money for the service that is not adequately provided. Nevertheless, another big constraint is represented by the presence of six 4m3 street containers in the neighborhood, which are insufficient to allow the right waste collection. Moreover, despite of the almost absence of waste street containers, often the municipality does not empty regularly them. These big lacks consequently entail the indiscriminate open burning and open dumping everywhere in the city (Figure 5.6), which causes a strong environmental impact as well as a high sanitary risk for the people.
Figure 5.6 Open dumping and burning in Maxixe city
The Maxixe landfill, which is a centralized open dump, represents a big source of pollution for the environment and for the people. This open dump is uncontrolled, so everyone can have free access to it, and there are not safety management measures to contain fugitive emissions, such as biogas, leachate, odors, and so on, as clearly pointed out by the Figure 5.7. Moreover, the disposed waste is neither compacted nor covered with raw material, enhancing indiscriminately the environmental pollution.
30 MT (Metical) is the official money of Mozambique
Maxixelandfill
- Mixed waste- 1,000 t/y
Composting plant
- Organic waste - 34 t/y
Local market
- Produced compost - 10 t/y
145
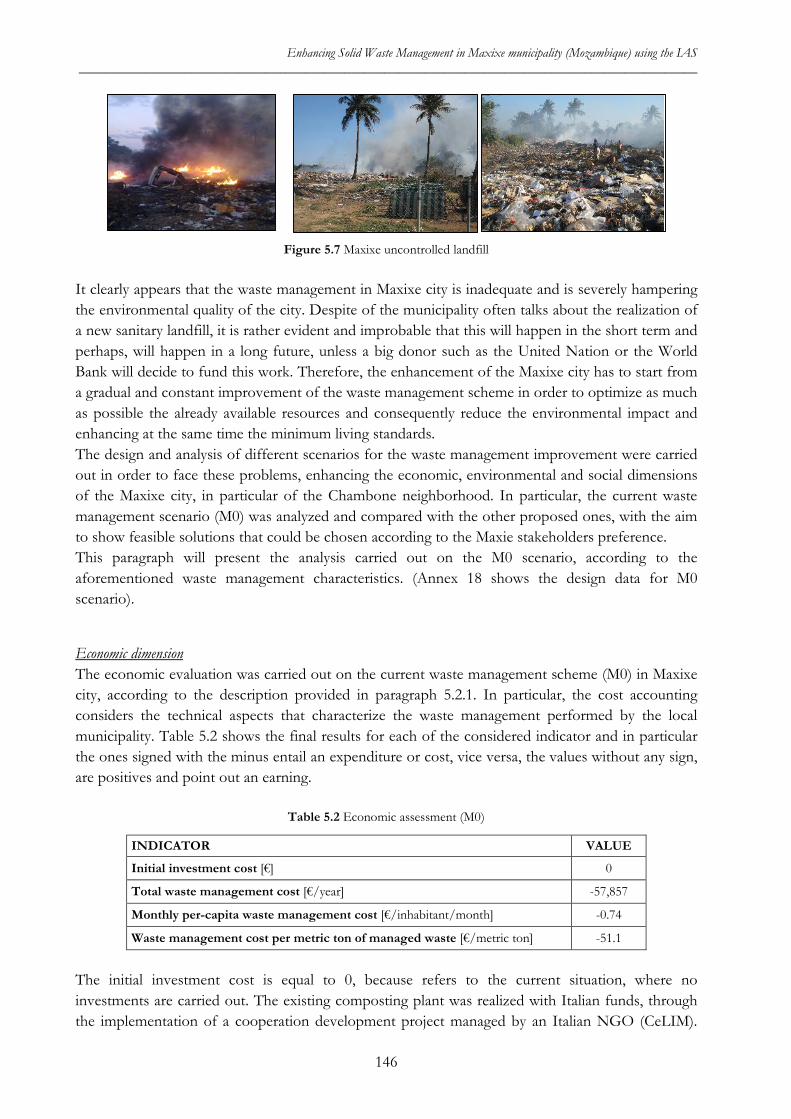
Enhancing Solid Waste Management in Maxixe municipality (Mozambique) using the IAS _____________________________________________________________________________________________
Figure 5.7 Maxixe uncontrolled landfill
It clearly appears that the waste management in Maxixe city is inadequate and is severely hampering the environmental quality of the city. Despite of the municipality often talks about the realization of a new sanitary landfill, it is rather evident and improbable that this will happen in the short term and perhaps, will happen in a long future, unless a big donor such as the United Nation or the World Bank will decide to fund this work. Therefore, the enhancement of the Maxixe city has to start from a gradual and constant improvement of the waste management scheme in order to optimize as much as possible the already available resources and consequently reduce the environmental impact and enhancing at the same time the minimum living standards. The design and analysis of different scenarios for the waste management improvement were carried out in order to face these problems, enhancing the economic, environmental and social dimensions of the Maxixe city, in particular of the Chambone neighborhood. In particular, the current waste management scenario (M0) was analyzed and compared with the other proposed ones, with the aim to show feasible solutions that could be chosen according to the Maxie stakeholders preference. This paragraph will present the analysis carried out on the M0 scenario, according to the aforementioned waste management characteristics. (Annex 18 shows the design data for M0 scenario).
Economic dimension The economic evaluation was carried out on the current waste management scheme (M0) in Maxixe city, according to the description provided in paragraph 5.2.1. In particular, the cost accounting considers the technical aspects that characterize the waste management performed by the local municipality. Table 5.2 shows the final results for each of the considered indicator and in particular the ones signed with the minus entail an expenditure or cost, vice versa, the values without any sign, are positives and point out an earning.
Table 5.2 Economic assessment (M0)
INDICATOR VALUE
Initial investment cost [€] 0
Total waste management cost [€/year] -57,857
Monthly per-capita waste management cost [€/inhabitant/month] -0.74
Waste management cost per metric ton of managed waste [€/metric ton] -51.1
The initial investment cost is equal to 0, because refers to the current situation, where no investments are carried out. The existing composting plant was realized with Italian funds, through the implementation of a cooperation development project managed by an Italian NGO (CeLIM).
146
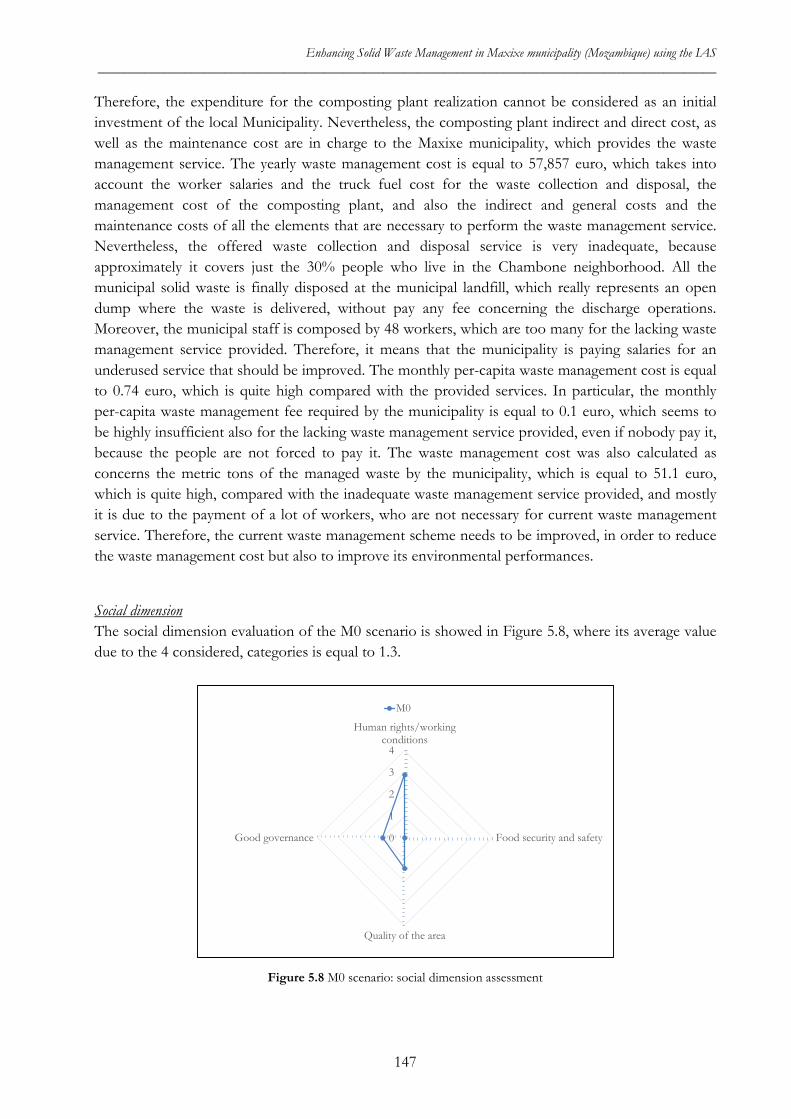
Enhancing Solid Waste Management in Maxixe municipality (Mozambique) using the IAS _____________________________________________________________________________________________
Therefore, the expenditure for the composting plant realization cannot be considered as an initial investment of the local Municipality. Nevertheless, the composting plant indirect and direct cost, as well as the maintenance cost are in charge to the Maxixe municipality, which provides the waste management service. The yearly waste management cost is equal to 57,857 euro, which takes into account the worker salaries and the truck fuel cost for the waste collection and disposal, the management cost of the composting plant, and also the indirect and general costs and the maintenance costs of all the elements that are necessary to perform the waste management service. Nevertheless, the offered waste collection and disposal service is very inadequate, because approximately it covers just the 30% people who live in the Chambone neighborhood. All the municipal solid waste is finally disposed at the municipal landfill, which really represents an open dump where the waste is delivered, without pay any fee concerning the discharge operations. Moreover, the municipal staff is composed by 48 workers, which are too many for the lacking waste management service provided. Therefore, it means that the municipality is paying salaries for an underused service that should be improved. The monthly per-capita waste management cost is equal to 0.74 euro, which is quite high compared with the provided services. In particular, the monthly per-capita waste management fee required by the municipality is equal to 0.1 euro, which seems to be highly insufficient also for the lacking waste management service provided, even if nobody pay it, because the people are not forced to pay it. The waste management cost was also calculated as concerns the metric tons of the managed waste by the municipality, which is equal to 51.1 euro, which is quite high, compared with the inadequate waste management service provided, and mostly it is due to the payment of a lot of workers, who are not necessary for current waste management service. Therefore, the current waste management scheme needs to be improved, in order to reduce the waste management cost but also to improve its environmental performances.
Social dimension The social dimension evaluation of the M0 scenario is showed in Figure 5.8, where its average value due to the 4 considered, categories is equal to 1.3.
Figure 5.8 M0 scenario: social dimension assessment
0
1
2
3
4
Human rights/workingconditions
Food security and safety
Quality of the area
Good governance
M0
147
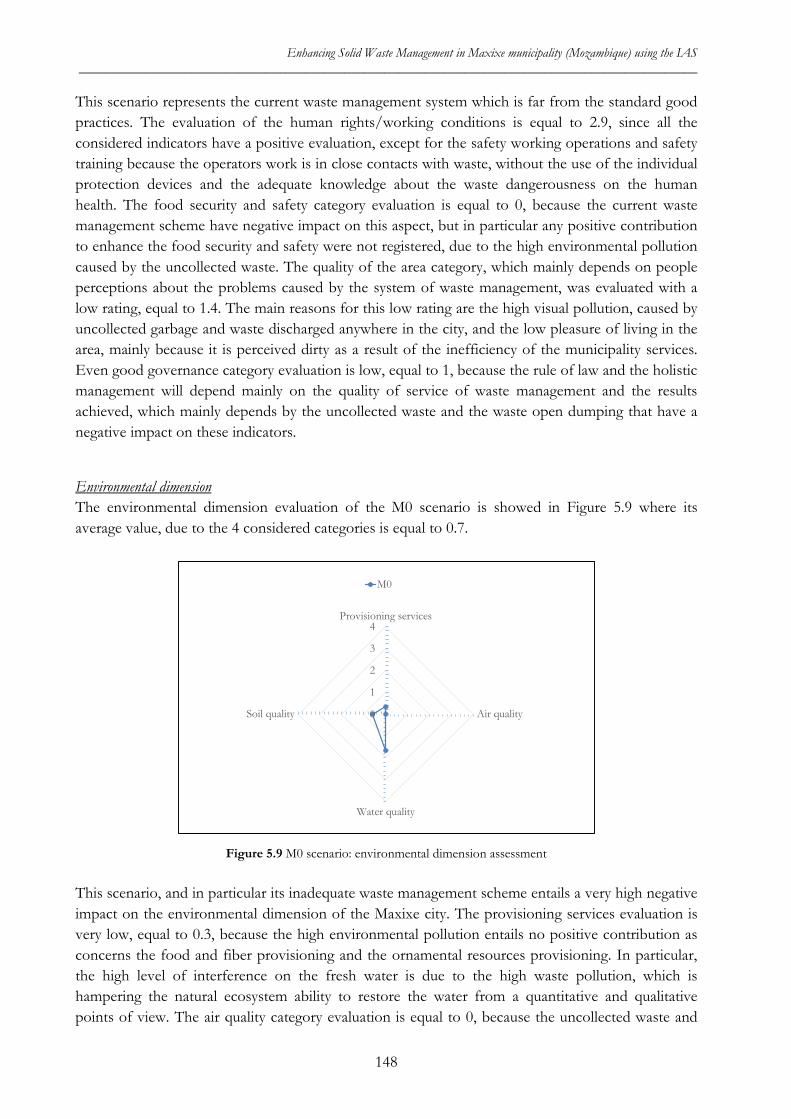
Enhancing Solid Waste Management in Maxixe municipality (Mozambique) using the IAS _____________________________________________________________________________________________
This scenario represents the current waste management system which is far from the standard good practices. The evaluation of the human rights/working conditions is equal to 2.9, since all the considered indicators have a positive evaluation, except for the safety working operations and safety training because the operators work is in close contacts with waste, without the use of the individual protection devices and the adequate knowledge about the waste dangerousness on the human health. The food security and safety category evaluation is equal to 0, because the current waste management scheme have negative impact on this aspect, but in particular any positive contribution to enhance the food security and safety were not registered, due to the high environmental pollution caused by the uncollected waste. The quality of the area category, which mainly depends on people perceptions about the problems caused by the system of waste management, was evaluated with a low rating, equal to 1.4. The main reasons for this low rating are the high visual pollution, caused by uncollected garbage and waste discharged anywhere in the city, and the low pleasure of living in the area, mainly because it is perceived dirty as a result of the inefficiency of the municipality services. Even good governance category evaluation is low, equal to 1, because the rule of law and the holistic management will depend mainly on the quality of service of waste management and the results achieved, which mainly depends by the uncollected waste and the waste open dumping that have a negative impact on these indicators.
Environmental dimension The environmental dimension evaluation of the M0 scenario is showed in Figure 5.9 where its average value, due to the 4 considered categories is equal to 0.7.
Figure 5.9 M0 scenario: environmental dimension assessment
This scenario, and in particular its inadequate waste management scheme entails a very high negative impact on the environmental dimension of the Maxixe city. The provisioning services evaluation is very low, equal to 0.3, because the high environmental pollution entails no positive contribution as concerns the food and fiber provisioning and the ornamental resources provisioning. In particular, the high level of interference on the fresh water is due to the high waste pollution, which is hampering the natural ecosystem ability to restore the water from a quantitative and qualitative points of view. The air quality category evaluation is equal to 0, because the uncollected waste and
0
1
2
3
4Provisioning services
Air quality
Water quality
Soil quality
M0
148
Enhancing Solid Waste Management in Maxixe municipality (Mozambique) using the IAS _____________________________________________________________________________________________
the waste disposed of to the municipal open dump, as well as the uncontrolled open burning and degradation of the organic waste represent a very high source of gaseous emissions, which entail a very high negative impact from the environmental point of view, hampering at the same time the functionality of the regulating services, concerning the air quality regulation and the climate regulation. The water quality category evaluation is low, equal to 1.7, due to the high impact caused by the organic, inorganic and microbiological pollutants released by the uncollected waste, which at the same time caused a low evaluation of the water born and pest diseases, especially due to the microbiological contamination, especially linked to high presence of organic waste. Nevertheless, the water cycling and regulation and the water purification and nutrient cycling have an high evaluation, especially because the Chambone neighborhood is not crossed by any river, therefore the high environmental pollution caused by the waste do not hamper the functionality of these ecosystem regulation services. The evaluation of the soil quality category is equal to 0.6, and is lower than the one of the water quality category. This is mainly due because the soil represents the first element on which the waste are disposed, and therefore the first source contaminated by organic and inorganic pollutants. Moreover, this inadequate waste management scheme does not have any positive contribution on the erosion regulation and the nutrient cycling and soil formation regulating services.
5.2.2 M1: mixed waste collection extension (80%) and composting of the OFMSW (3%) This scenario represents the first step to improve the current waste management scenario in Maxixe, in order to reduce the environmental impact. The designed solution wants to extend the waste collection service, trying to reach as much inhabitants as possible, since more waste is collected and less are the chance to indiscriminately dump or burn it. In this scenario, the waste collection service covers at most the 80% of the Chambone neighborhood inhabitants. The remaining 20% of the people cannot be reached by the waste collection service because they live too much scattered and isolated into areas that normally are difficult to be reached. Therefore, it is necessary to assume the 20% of the waste is not collected and consequently is inappropriately disposed. The extension of the waste collection service is based on the possibility to count on a consistent number of workers in the municipality staff (48 workers), who currently work less than they should do, especially because they are a lot and the work to do is not so much. Even the means of work are able to guarantee the waste collection service on the considered area, which can rely on 4 tractors, 2 skip loaders, 6 trailers and 1 little dumper truck. Globally, forty 2 m3 street containers are required in order to collect all the produced waste. Moreover, the municipality, who is in charge to provide the waste management service, has to provide the necessary safety training and the individual protection devices to the workers in order to highly improve the safety during the working activities, reducing at the same time the possibility to the workers to incur into dangerous injuries and chronic diseases. In this scenario, the improvement of the composting capacity plant is carried out increasing the compost heaps overturning frequency. This modification allows to increase the oxygen supply and consequently to reduce the biological degradation process duration, which allows at the same time to treat a bigger amount of organic waste, respect to the scenario M0, up to 84 metric tons of organic waste per year. Nevertheless, the composting plant treatment capacity is not enough to treat all the amount of organic waste produced in the city. Figure 5.10 shows the new waste flows according to the designed waste management scheme.
149
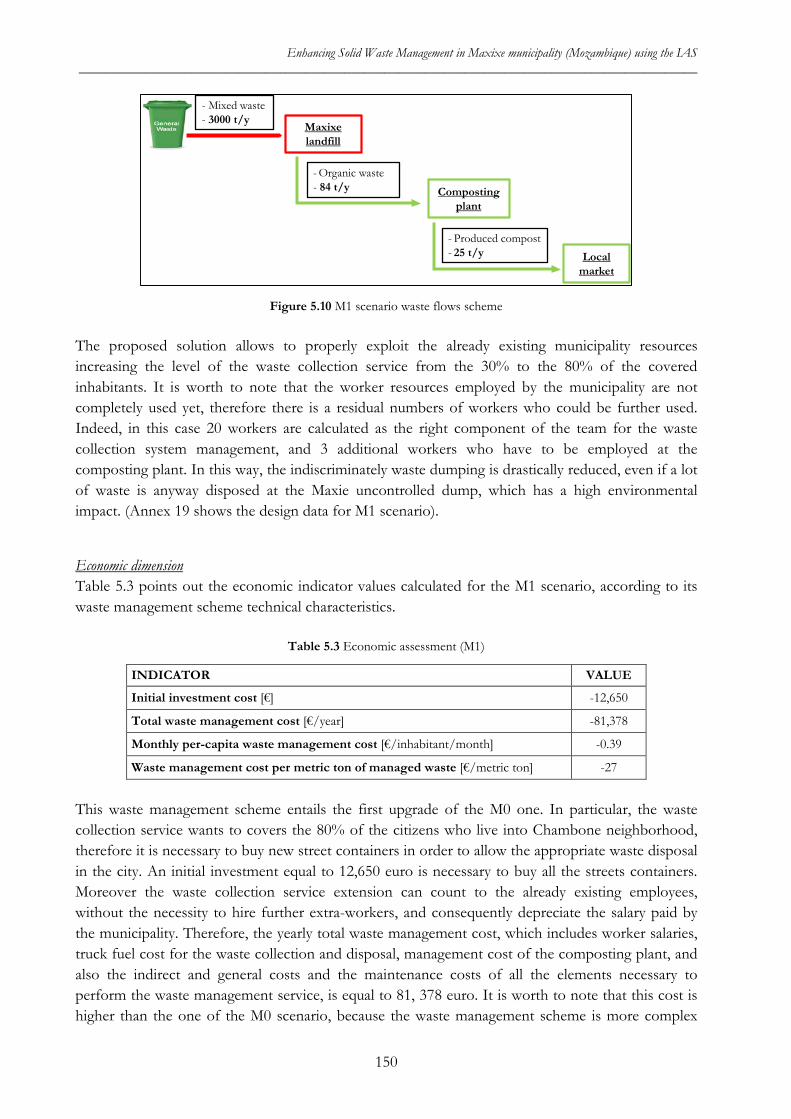
Enhancing Solid Waste Management in Maxixe municipality (Mozambique) using the IAS _____________________________________________________________________________________________
Figure 5.10 M1 scenario waste flows scheme
The proposed solution allows to properly exploit the already existing municipality resources increasing the level of the waste collection service from the 30% to the 80% of the covered inhabitants. It is worth to note that the worker resources employed by the municipality are not completely used yet, therefore there is a residual numbers of workers who could be further used. Indeed, in this case 20 workers are calculated as the right component of the team for the waste collection system management, and 3 additional workers who have to be employed at the composting plant. In this way, the indiscriminately waste dumping is drastically reduced, even if a lot of waste is anyway disposed at the Maxie uncontrolled dump, which has a high environmental impact. (Annex 19 shows the design data for M1 scenario).
Economic dimension Table 5.3 points out the economic indicator values calculated for the M1 scenario, according to its waste management scheme technical characteristics.
Table 5.3 Economic assessment (M1)
INDICATOR VALUE
Initial investment cost [€] -12,650
Total waste management cost [€/year] -81,378
Monthly per-capita waste management cost [€/inhabitant/month] -0.39
Waste management cost per metric ton of managed waste [€/metric ton] -27
This waste management scheme entails the first upgrade of the M0 one. In particular, the waste collection service wants to covers the 80% of the citizens who live into Chambone neighborhood, therefore it is necessary to buy new street containers in order to allow the appropriate waste disposal in the city. An initial investment equal to 12,650 euro is necessary to buy all the streets containers. Moreover the waste collection service extension can count to the already existing employees, without the necessity to hire further extra-workers, and consequently depreciate the salary paid by the municipality. Therefore, the yearly total waste management cost, which includes worker salaries, truck fuel cost for the waste collection and disposal, management cost of the composting plant, and also the indirect and general costs and the maintenance costs of all the elements necessary to perform the waste management service, is equal to 81, 378 euro. It is worth to note that this cost is higher than the one of the M0 scenario, because the waste management scheme is more complex
Maxixelandfill
- Mixed waste- 3000 t/y
Composting plant
- Organic waste - 84 t/y
Local market
- Produced compost - 25 t/y
150
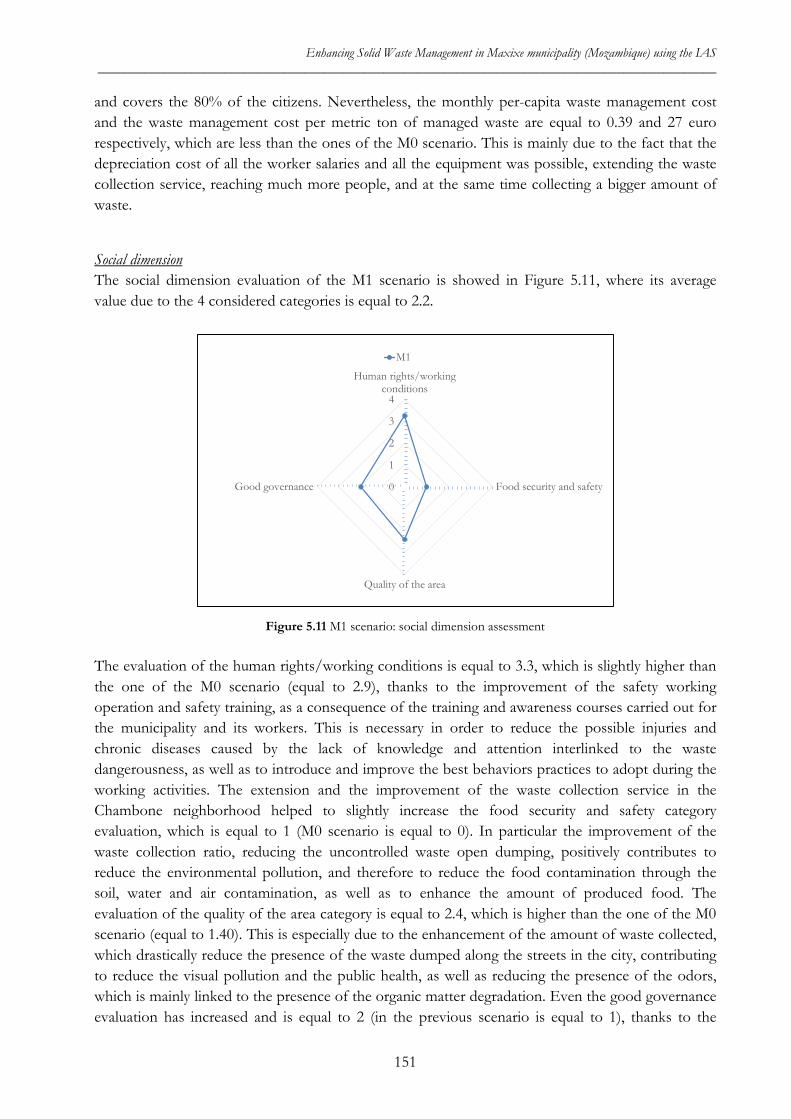
Enhancing Solid Waste Management in Maxixe municipality (Mozambique) using the IAS _____________________________________________________________________________________________
and covers the 80% of the citizens. Nevertheless, the monthly per-capita waste management cost and the waste management cost per metric ton of managed waste are equal to 0.39 and 27 euro respectively, which are less than the ones of the M0 scenario. This is mainly due to the fact that the depreciation cost of all the worker salaries and all the equipment was possible, extending the waste collection service, reaching much more people, and at the same time collecting a bigger amount of waste.
Social dimension The social dimension evaluation of the M1 scenario is showed in Figure 5.11, where its average value due to the 4 considered categories is equal to 2.2.
Figure 5.11 M1 scenario: social dimension assessment
The evaluation of the human rights/working conditions is equal to 3.3, which is slightly higher than the one of the M0 scenario (equal to 2.9), thanks to the improvement of the safety working operation and safety training, as a consequence of the training and awareness courses carried out for the municipality and its workers. This is necessary in order to reduce the possible injuries and chronic diseases caused by the lack of knowledge and attention interlinked to the waste dangerousness, as well as to introduce and improve the best behaviors practices to adopt during the working activities. The extension and the improvement of the waste collection service in the Chambone neighborhood helped to slightly increase the food security and safety category evaluation, which is equal to 1 (M0 scenario is equal to 0). In particular the improvement of the waste collection ratio, reducing the uncontrolled waste open dumping, positively contributes to reduce the environmental pollution, and therefore to reduce the food contamination through the soil, water and air contamination, as well as to enhance the amount of produced food. The evaluation of the quality of the area category is equal to 2.4, which is higher than the one of the M0 scenario (equal to 1.40). This is especially due to the enhancement of the amount of waste collected, which drastically reduce the presence of the waste dumped along the streets in the city, contributing to reduce the visual pollution and the public health, as well as reducing the presence of the odors, which is mainly linked to the presence of the organic matter degradation. Even the good governance evaluation has increased and is equal to 2 (in the previous scenario is equal to 1), thanks to the
0
1
2
3
4
Human rights/workingconditions
Food security and safety
Quality of the area
Good governance
M1
151
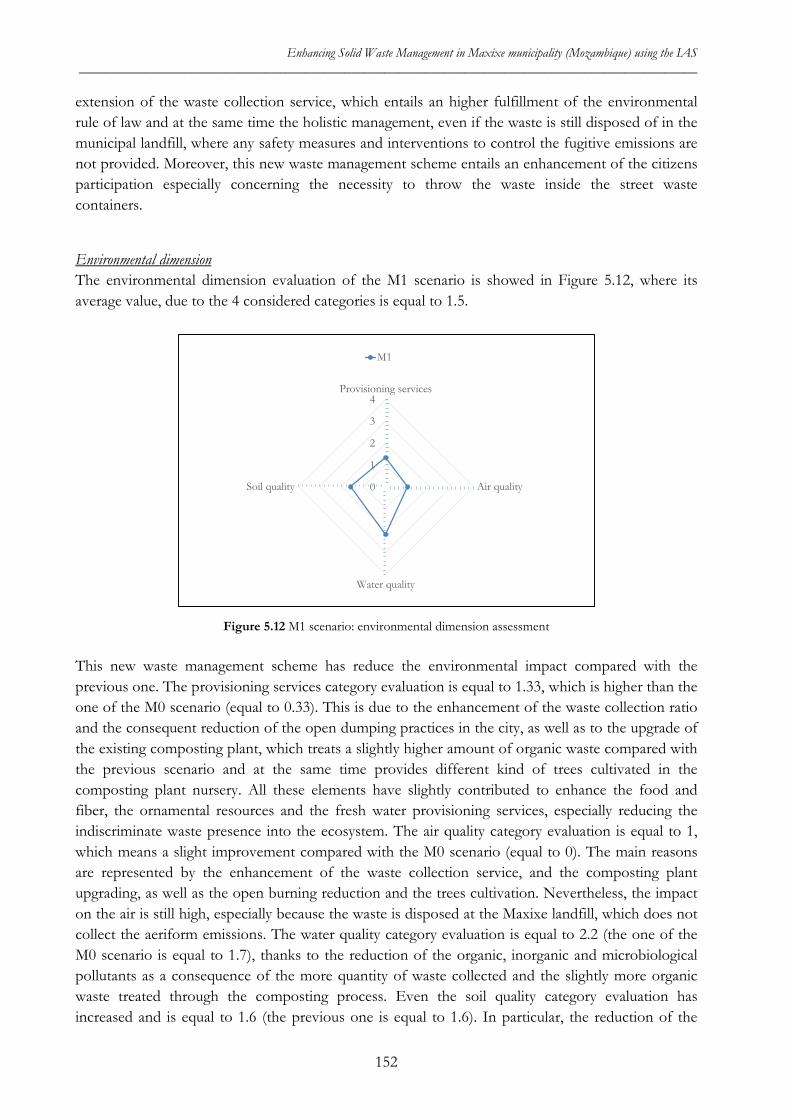
Enhancing Solid Waste Management in Maxixe municipality (Mozambique) using the IAS _____________________________________________________________________________________________
extension of the waste collection service, which entails an higher fulfillment of the environmental rule of law and at the same time the holistic management, even if the waste is still disposed of in the municipal landfill, where any safety measures and interventions to control the fugitive emissions are not provided. Moreover, this new waste management scheme entails an enhancement of the citizens participation especially concerning the necessity to throw the waste inside the street waste containers.
Environmental dimension The environmental dimension evaluation of the M1 scenario is showed in Figure 5.12, where its average value, due to the 4 considered categories is equal to 1.5.
Figure 5.12 M1 scenario: environmental dimension assessment
This new waste management scheme has reduce the environmental impact compared with the previous one. The provisioning services category evaluation is equal to 1.33, which is higher than the one of the M0 scenario (equal to 0.33). This is due to the enhancement of the waste collection ratio and the consequent reduction of the open dumping practices in the city, as well as to the upgrade of the existing composting plant, which treats a slightly higher amount of organic waste compared with the previous scenario and at the same time provides different kind of trees cultivated in the composting plant nursery. All these elements have slightly contributed to enhance the food and fiber, the ornamental resources and the fresh water provisioning services, especially reducing the indiscriminate waste presence into the ecosystem. The air quality category evaluation is equal to 1, which means a slight improvement compared with the M0 scenario (equal to 0). The main reasons are represented by the enhancement of the waste collection service, and the composting plant upgrading, as well as the open burning reduction and the trees cultivation. Nevertheless, the impact on the air is still high, especially because the waste is disposed at the Maxixe landfill, which does not collect the aeriform emissions. The water quality category evaluation is equal to 2.2 (the one of the M0 scenario is equal to 1.7), thanks to the reduction of the organic, inorganic and microbiological pollutants as a consequence of the more quantity of waste collected and the slightly more organic waste treated through the composting process. Even the soil quality category evaluation has increased and is equal to 1.6 (the previous one is equal to 1.6). In particular, the reduction of the
0
1
2
3
4Provisioning services
Air quality
Water quality
Soil quality
M1
152
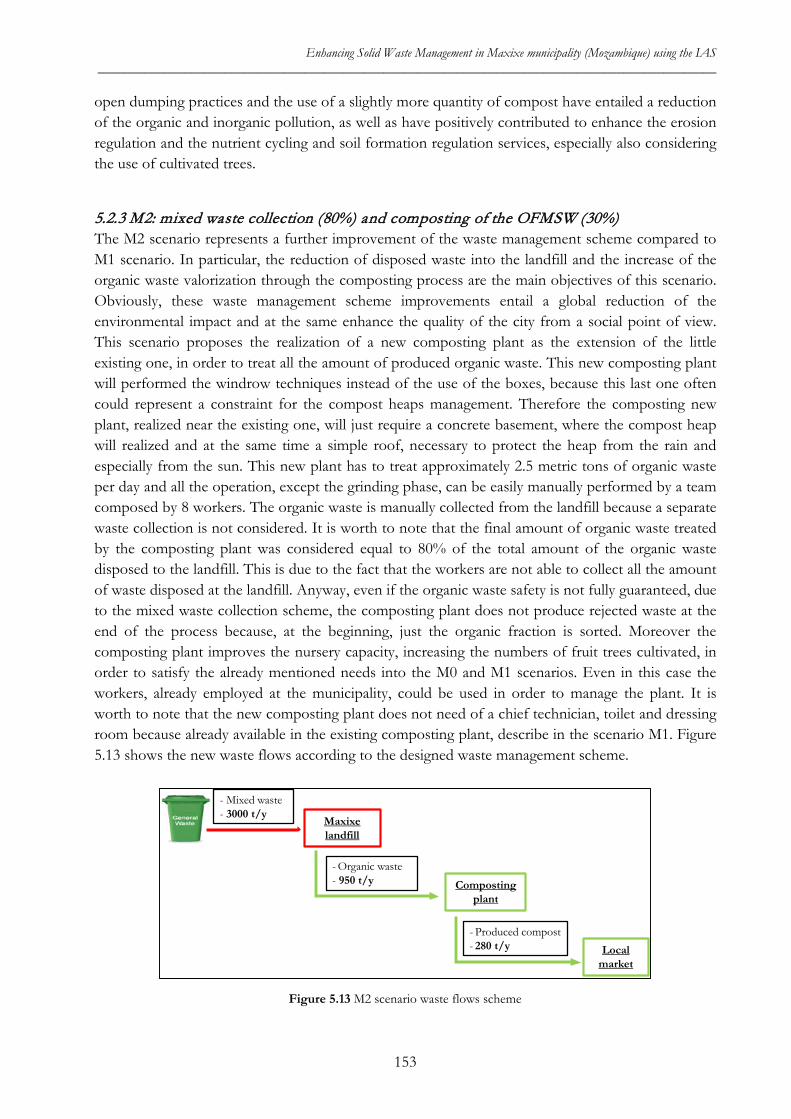
Enhancing Solid Waste Management in Maxixe municipality (Mozambique) using the IAS _____________________________________________________________________________________________
open dumping practices and the use of a slightly more quantity of compost have entailed a reduction of the organic and inorganic pollution, as well as have positively contributed to enhance the erosion regulation and the nutrient cycling and soil formation regulation services, especially also considering the use of cultivated trees.
5.2.3 M2: mixed waste collection (80%) and composting of the OFMSW (30%) The M2 scenario represents a further improvement of the waste management scheme compared to M1 scenario. In particular, the reduction of disposed waste into the landfill and the increase of the organic waste valorization through the composting process are the main objectives of this scenario. Obviously, these waste management scheme improvements entail a global reduction of the environmental impact and at the same enhance the quality of the city from a social point of view. This scenario proposes the realization of a new composting plant as the extension of the little existing one, in order to treat all the amount of produced organic waste. This new composting plant will performed the windrow techniques instead of the use of the boxes, because this last one often could represent a constraint for the compost heaps management. Therefore the composting new plant, realized near the existing one, will just require a concrete basement, where the compost heap will realized and at the same time a simple roof, necessary to protect the heap from the rain and especially from the sun. This new plant has to treat approximately 2.5 metric tons of organic waste per day and all the operation, except the grinding phase, can be easily manually performed by a team composed by 8 workers. The organic waste is manually collected from the landfill because a separate waste collection is not considered. It is worth to note that the final amount of organic waste treated by the composting plant was considered equal to 80% of the total amount of the organic waste disposed to the landfill. This is due to the fact that the workers are not able to collect all the amount of waste disposed at the landfill. Anyway, even if the organic waste safety is not fully guaranteed, due to the mixed waste collection scheme, the composting plant does not produce rejected waste at the end of the process because, at the beginning, just the organic fraction is sorted. Moreover the composting plant improves the nursery capacity, increasing the numbers of fruit trees cultivated, in order to satisfy the already mentioned needs into the M0 and M1 scenarios. Even in this case the workers, already employed at the municipality, could be used in order to manage the plant. It is worth to note that the new composting plant does not need of a chief technician, toilet and dressing room because already available in the existing composting plant, describe in the scenario M1. Figure 5.13 shows the new waste flows according to the designed waste management scheme.
Figure 5.13 M2 scenario waste flows scheme
Maxixelandfill
- Mixed waste- 3000 t/y
Composting plant
- Organic waste - 950 t/y
Local market
- Produced compost - 280 t/y
153

Enhancing Solid Waste Management in Maxixe municipality (Mozambique) using the IAS _____________________________________________________________________________________________
Globally, this scenario allows to reduce the amount of waste disposed to the landfill due to the increased valorization of the organic fraction valorization. Therefore, a consistent environmental impact reduction is registered as well as a reduction of the human health risk. Moreover, the high availability of the compost represents a natural resource to restore the ecosystem, especially as concern the soil quality and all the interlinked positive effects. (Annex 20 shows the design data for M2 scenario). Economic dimension Table 5.4 points out the economic indicator values calculated for the M2 scenario.
Table 5.4 Economic assessment (M2)
INDICATOR VALUE
Initial investment cost [€] -84,365
Total waste management cost [€/year] -64,238
Monthly per-capita waste management cost [€/inhabitant/month] -0.31
Waste management cost per metric ton of managed waste [€/metric ton] -21.3
This waste management scheme, which is a further upgrade of the M1 scenario, entails the additional realization of a complementary composting plant, near the already existing one, in order to treat all the amount of the organic waste produced by the citizens of the Chambone neighborhood. Therefore the initial investment cost for the realization of the new composting plant and the street containers buying is equal to 84,365 euro. The yearly waste management cost is equal to 64,238 euro, and is less than the one of the M1 scenario, because also the new composting plant can count on the already existing workers of the municipality. Moreover, it is worth to note that, the economic balance of the composting plant is based on a strong hypothesis, which is all the produced compost has to be sold at the current local price. In this way is possible to depreciate the salary workers and at the same time the composting plant maintenance cost. Consequently, the monthly per-capita waste management cost and the waste management cost per metric ton of managed waste are equal to 0.31 and 21.3 euro, which are less than the ones of the M1 scenario. Social dimension The social dimension evaluation of the M2 scenario is showed in Figure 5.14, where its average value due to the 4 considered categories is equal to 2.4.
154
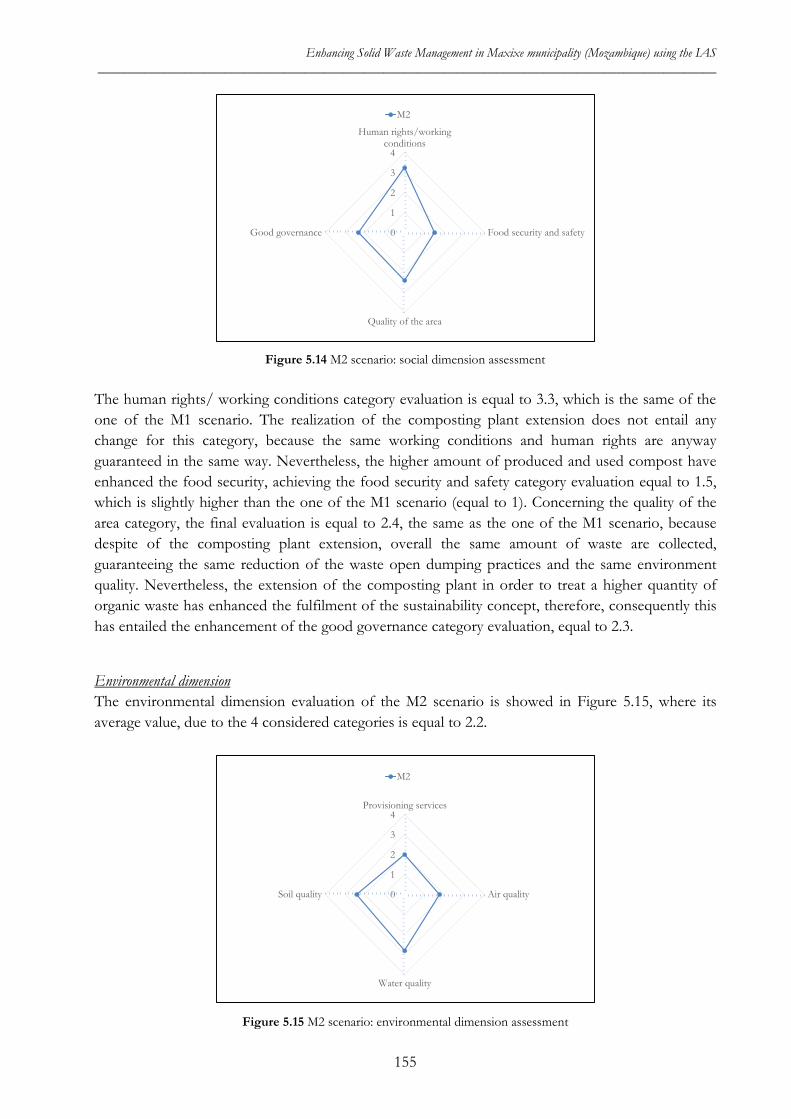
Enhancing Solid Waste Management in Maxixe municipality (Mozambique) using the IAS _____________________________________________________________________________________________
Figure 5.14 M2 scenario: social dimension assessment
The human rights/ working conditions category evaluation is equal to 3.3, which is the same of the one of the M1 scenario. The realization of the composting plant extension does not entail any change for this category, because the same working conditions and human rights are anyway guaranteed in the same way. Nevertheless, the higher amount of produced and used compost have enhanced the food security, achieving the food security and safety category evaluation equal to 1.5, which is slightly higher than the one of the M1 scenario (equal to 1). Concerning the quality of the area category, the final evaluation is equal to 2.4, the same as the one of the M1 scenario, because despite of the composting plant extension, overall the same amount of waste are collected, guaranteeing the same reduction of the waste open dumping practices and the same environment quality. Nevertheless, the extension of the composting plant in order to treat a higher quantity of organic waste has enhanced the fulfilment of the sustainability concept, therefore, consequently this has entailed the enhancement of the good governance category evaluation, equal to 2.3.
Environmental dimension The environmental dimension evaluation of the M2 scenario is showed in Figure 5.15, where its average value, due to the 4 considered categories is equal to 2.2.
Figure 5.15 M2 scenario: environmental dimension assessment
0
1
2
3
4
Human rights/workingconditions
Food security and safety
Quality of the area
Good governance
M2
0
1
2
3
4Provisioning services
Air quality
Water quality
Soil quality
M2
155
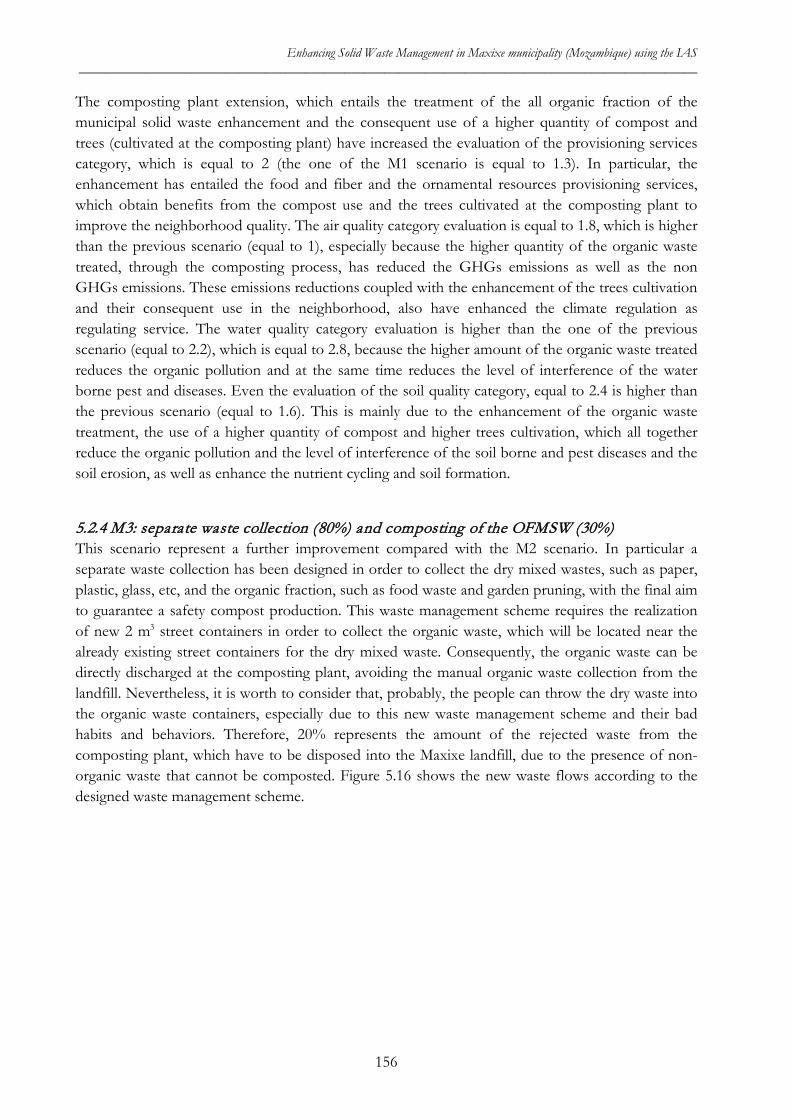
Enhancing Solid Waste Management in Maxixe municipality (Mozambique) using the IAS _____________________________________________________________________________________________
The composting plant extension, which entails the treatment of the all organic fraction of the municipal solid waste enhancement and the consequent use of a higher quantity of compost and trees (cultivated at the composting plant) have increased the evaluation of the provisioning services category, which is equal to 2 (the one of the M1 scenario is equal to 1.3). In particular, the enhancement has entailed the food and fiber and the ornamental resources provisioning services, which obtain benefits from the compost use and the trees cultivated at the composting plant to improve the neighborhood quality. The air quality category evaluation is equal to 1.8, which is higher than the previous scenario (equal to 1), especially because the higher quantity of the organic waste treated, through the composting process, has reduced the GHGs emissions as well as the non GHGs emissions. These emissions reductions coupled with the enhancement of the trees cultivation and their consequent use in the neighborhood, also have enhanced the climate regulation as regulating service. The water quality category evaluation is higher than the one of the previous scenario (equal to 2.2), which is equal to 2.8, because the higher amount of the organic waste treated reduces the organic pollution and at the same time reduces the level of interference of the water borne pest and diseases. Even the evaluation of the soil quality category, equal to 2.4 is higher than the previous scenario (equal to 1.6). This is mainly due to the enhancement of the organic waste treatment, the use of a higher quantity of compost and higher trees cultivation, which all together reduce the organic pollution and the level of interference of the soil borne and pest diseases and the soil erosion, as well as enhance the nutrient cycling and soil formation.
5.2.4 M3: separate waste collection (80%) and composting of the OFMSW (30%) This scenario represent a further improvement compared with the M2 scenario. In particular a separate waste collection has been designed in order to collect the dry mixed wastes, such as paper, plastic, glass, etc, and the organic fraction, such as food waste and garden pruning, with the final aim to guarantee a safety compost production. This waste management scheme requires the realization of new 2 m3 street containers in order to collect the organic waste, which will be located near the already existing street containers for the dry mixed waste. Consequently, the organic waste can be directly discharged at the composting plant, avoiding the manual organic waste collection from the landfill. Nevertheless, it is worth to consider that, probably, the people can throw the dry waste into the organic waste containers, especially due to this new waste management scheme and their bad habits and behaviors. Therefore, 20% represents the amount of the rejected waste from the composting plant, which have to be disposed into the Maxixe landfill, due to the presence of non-organic waste that cannot be composted. Figure 5.16 shows the new waste flows according to the designed waste management scheme.
156
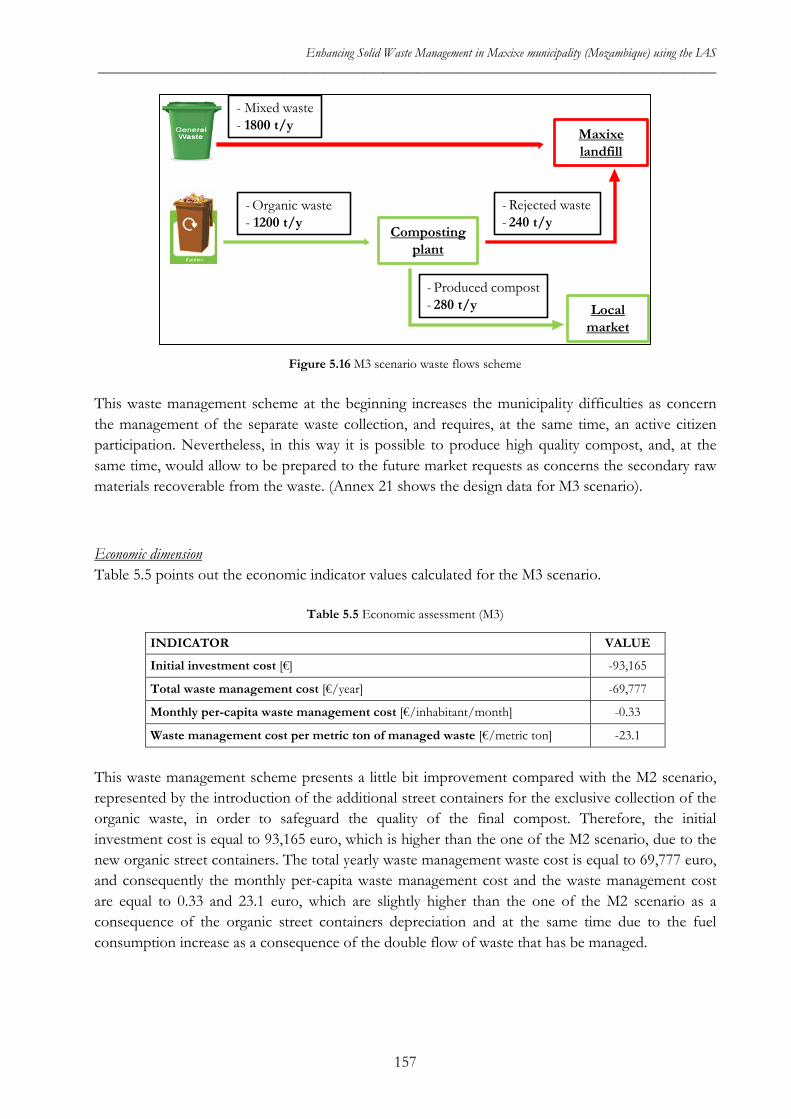
Enhancing Solid Waste Management in Maxixe municipality (Mozambique) using the IAS _____________________________________________________________________________________________
Figure 5.16 M3 scenario waste flows scheme
This waste management scheme at the beginning increases the municipality difficulties as concern the management of the separate waste collection, and requires, at the same time, an active citizen participation. Nevertheless, in this way it is possible to produce high quality compost, and, at the same time, would allow to be prepared to the future market requests as concerns the secondary raw materials recoverable from the waste. (Annex 21 shows the design data for M3 scenario).
Economic dimension Table 5.5 points out the economic indicator values calculated for the M3 scenario.
Table 5.5 Economic assessment (M3)
INDICATOR VALUE
Initial investment cost [€] -93,165
Total waste management cost [€/year] -69,777
Monthly per-capita waste management cost [€/inhabitant/month] -0.33
Waste management cost per metric ton of managed waste [€/metric ton] -23.1
This waste management scheme presents a little bit improvement compared with the M2 scenario, represented by the introduction of the additional street containers for the exclusive collection of the organic waste, in order to safeguard the quality of the final compost. Therefore, the initial investment cost is equal to 93,165 euro, which is higher than the one of the M2 scenario, due to the new organic street containers. The total yearly waste management waste cost is equal to 69,777 euro, and consequently the monthly per-capita waste management cost and the waste management cost are equal to 0.33 and 23.1 euro, which are slightly higher than the one of the M2 scenario as a consequence of the organic street containers depreciation and at the same time due to the fuel consumption increase as a consequence of the double flow of waste that has be managed.
Maxixelandfill
- Mixed waste- 1800 t/y
Composting plant
- Organic waste - 1200 t/y
Local market
- Produced compost - 280 t/y
- Rejected waste - 240 t/y
157
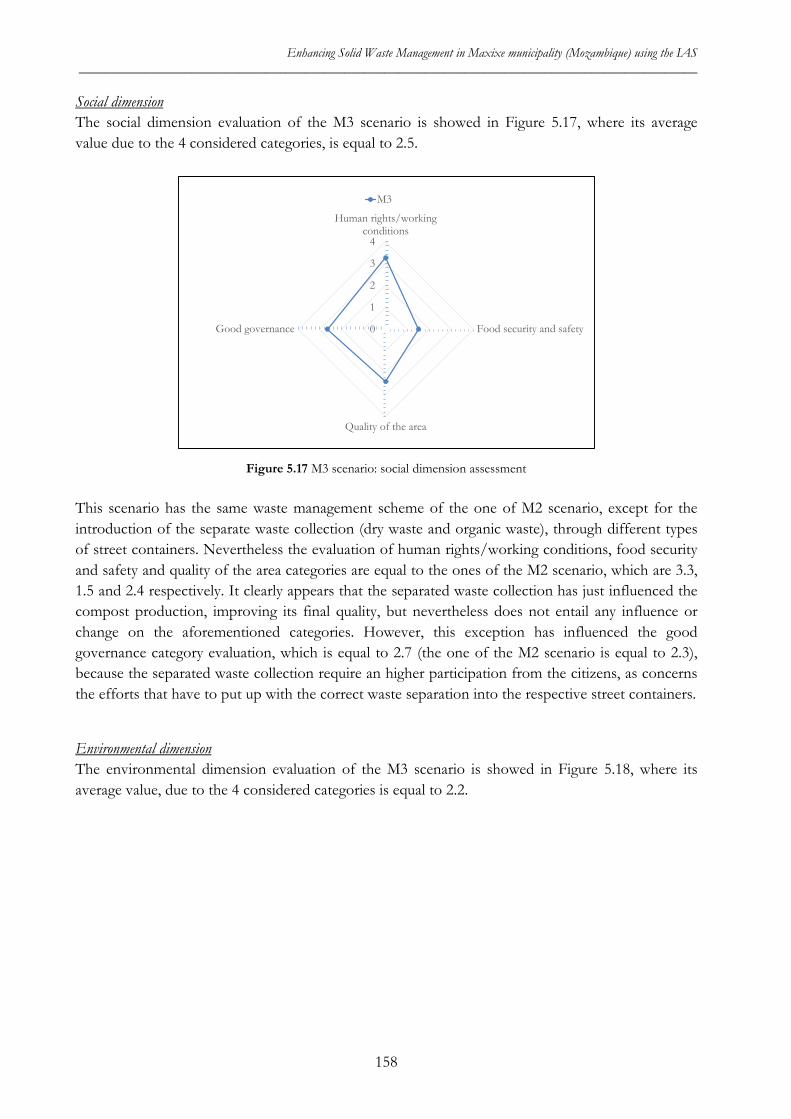
Enhancing Solid Waste Management in Maxixe municipality (Mozambique) using the IAS _____________________________________________________________________________________________
Social dimension The social dimension evaluation of the M3 scenario is showed in Figure 5.17, where its average value due to the 4 considered categories, is equal to 2.5.
Figure 5.17 M3 scenario: social dimension assessment
This scenario has the same waste management scheme of the one of M2 scenario, except for the introduction of the separate waste collection (dry waste and organic waste), through different types of street containers. Nevertheless the evaluation of human rights/working conditions, food security and safety and quality of the area categories are equal to the ones of the M2 scenario, which are 3.3, 1.5 and 2.4 respectively. It clearly appears that the separated waste collection has just influenced the compost production, improving its final quality, but nevertheless does not entail any influence or change on the aforementioned categories. However, this exception has influenced the good governance category evaluation, which is equal to 2.7 (the one of the M2 scenario is equal to 2.3), because the separated waste collection require an higher participation from the citizens, as concerns the efforts that have to put up with the correct waste separation into the respective street containers.
Environmental dimension The environmental dimension evaluation of the M3 scenario is showed in Figure 5.18, where its average value, due to the 4 considered categories is equal to 2.2.
0
1
2
3
4
Human rights/workingconditions
Food security and safety
Quality of the area
Good governance
M3
158
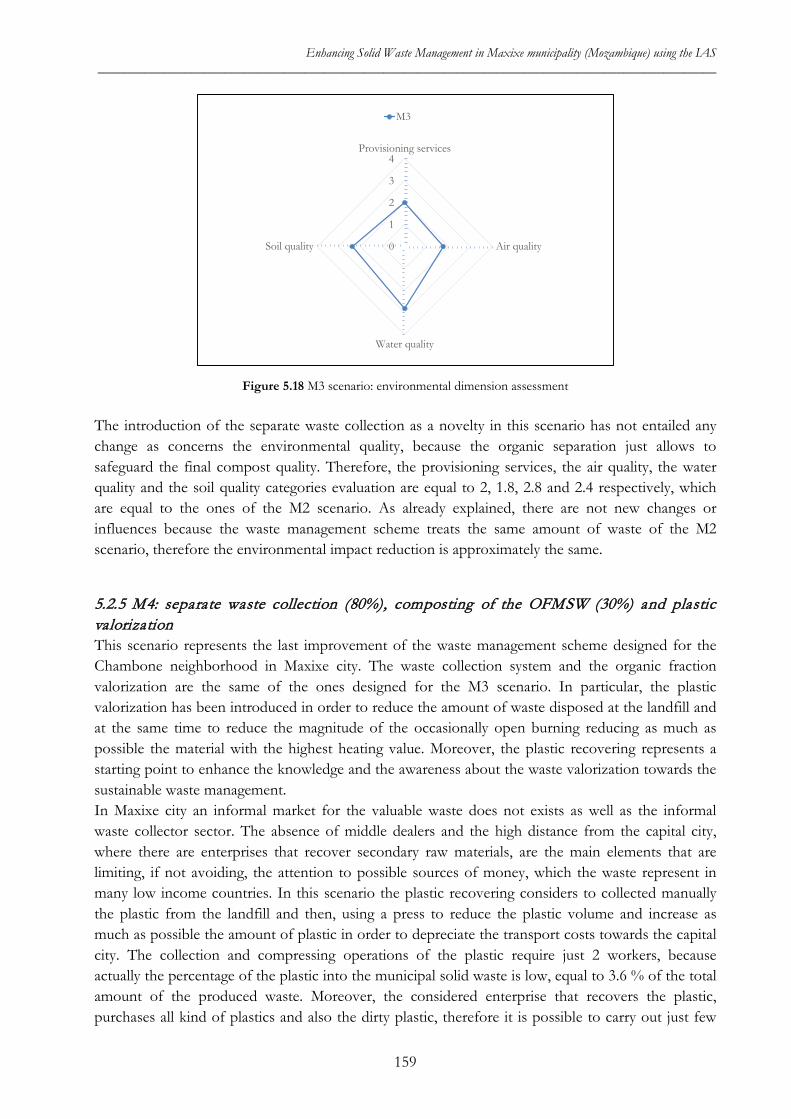
Enhancing Solid Waste Management in Maxixe municipality (Mozambique) using the IAS _____________________________________________________________________________________________
Figure 5.18 M3 scenario: environmental dimension assessment
The introduction of the separate waste collection as a novelty in this scenario has not entailed any change as concerns the environmental quality, because the organic separation just allows to safeguard the final compost quality. Therefore, the provisioning services, the air quality, the water quality and the soil quality categories evaluation are equal to 2, 1.8, 2.8 and 2.4 respectively, which are equal to the ones of the M2 scenario. As already explained, there are not new changes or influences because the waste management scheme treats the same amount of waste of the M2 scenario, therefore the environmental impact reduction is approximately the same.
5.2.5 M4: separate waste collection (80%), composting of the OFMSW (30%) and plastic valorization This scenario represents the last improvement of the waste management scheme designed for the Chambone neighborhood in Maxixe city. The waste collection system and the organic fraction valorization are the same of the ones designed for the M3 scenario. In particular, the plastic valorization has been introduced in order to reduce the amount of waste disposed at the landfill and at the same time to reduce the magnitude of the occasionally open burning reducing as much as possible the material with the highest heating value. Moreover, the plastic recovering represents a starting point to enhance the knowledge and the awareness about the waste valorization towards the sustainable waste management. In Maxixe city an informal market for the valuable waste does not exists as well as the informal waste collector sector. The absence of middle dealers and the high distance from the capital city, where there are enterprises that recover secondary raw materials, are the main elements that are limiting, if not avoiding, the attention to possible sources of money, which the waste represent in many low income countries. In this scenario the plastic recovering considers to collected manually the plastic from the landfill and then, using a press to reduce the plastic volume and increase as much as possible the amount of plastic in order to depreciate the transport costs towards the capital city. The collection and compressing operations of the plastic require just 2 workers, because actually the percentage of the plastic into the municipal solid waste is low, equal to 3.6 % of the total amount of the produced waste. Moreover, the considered enterprise that recovers the plastic, purchases all kind of plastics and also the dirty plastic, therefore it is possible to carry out just few
0
1
2
3
4Provisioning services
Air quality
Water quality
Soil quality
M3
159
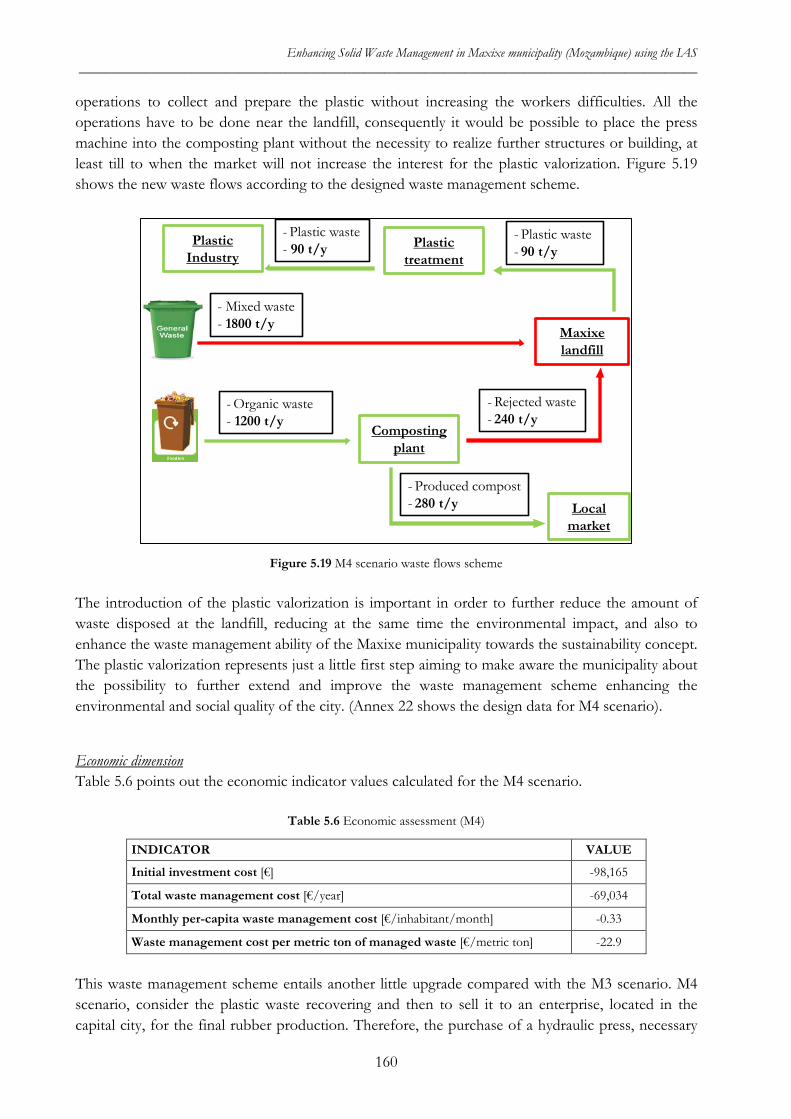
Enhancing Solid Waste Management in Maxixe municipality (Mozambique) using the IAS _____________________________________________________________________________________________
operations to collect and prepare the plastic without increasing the workers difficulties. All the operations have to be done near the landfill, consequently it would be possible to place the press machine into the composting plant without the necessity to realize further structures or building, at least till to when the market will not increase the interest for the plastic valorization. Figure 5.19 shows the new waste flows according to the designed waste management scheme.
Figure 5.19 M4 scenario waste flows scheme The introduction of the plastic valorization is important in order to further reduce the amount of waste disposed at the landfill, reducing at the same time the environmental impact, and also to enhance the waste management ability of the Maxixe municipality towards the sustainability concept. The plastic valorization represents just a little first step aiming to make aware the municipality about the possibility to further extend and improve the waste management scheme enhancing the environmental and social quality of the city. (Annex 22 shows the design data for M4 scenario).
Economic dimension Table 5.6 points out the economic indicator values calculated for the M4 scenario.
Table 5.6 Economic assessment (M4)
INDICATOR VALUE
Initial investment cost [€] -98,165
Total waste management cost [€/year] -69,034
Monthly per-capita waste management cost [€/inhabitant/month] -0.33
Waste management cost per metric ton of managed waste [€/metric ton] -22.9
This waste management scheme entails another little upgrade compared with the M3 scenario. M4 scenario, consider the plastic waste recovering and then to sell it to an enterprise, located in the capital city, for the final rubber production. Therefore, the purchase of a hydraulic press, necessary
Maxixelandfill
- Mixed waste- 1800 t/y
Composting plant
- Organic waste - 1200 t/y
Local market
- Produced compost - 280 t/y
- Rejected waste - 240 t/y
Plastic treatment
- Plastic waste- 90 t/y
- Plastic waste- 90 t/y Plastic
Industry
160
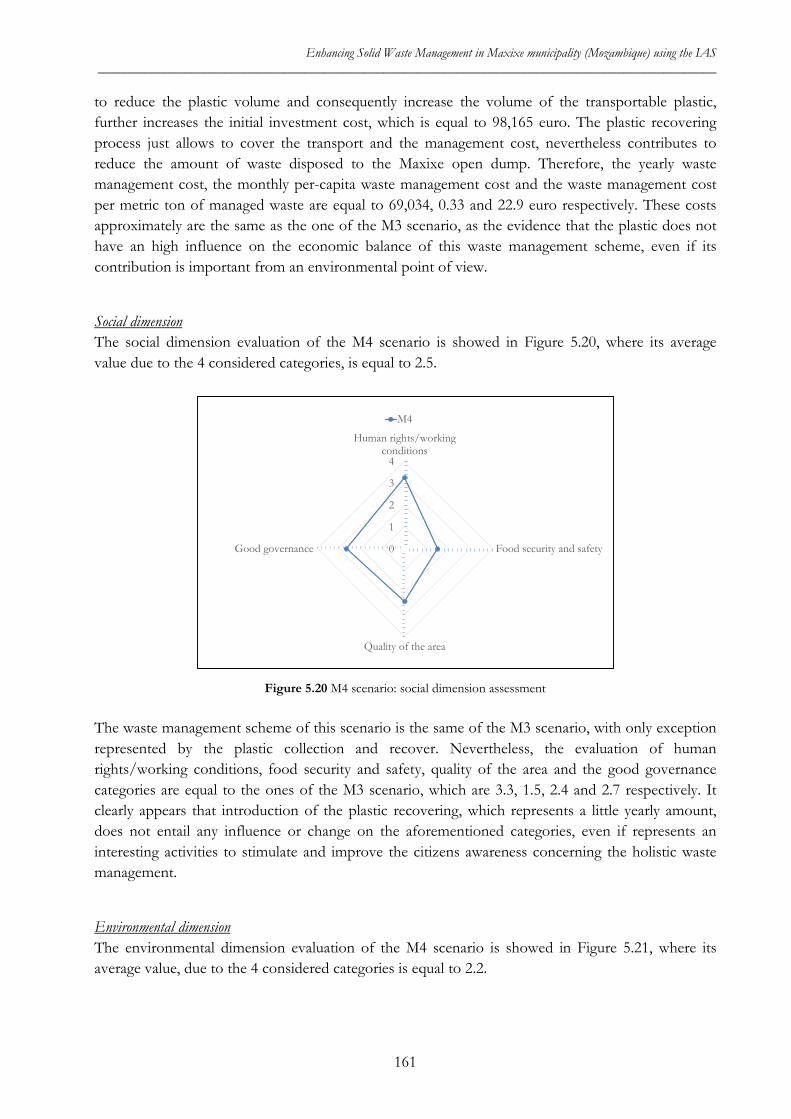
Enhancing Solid Waste Management in Maxixe municipality (Mozambique) using the IAS _____________________________________________________________________________________________
to reduce the plastic volume and consequently increase the volume of the transportable plastic, further increases the initial investment cost, which is equal to 98,165 euro. The plastic recovering process just allows to cover the transport and the management cost, nevertheless contributes to reduce the amount of waste disposed to the Maxixe open dump. Therefore, the yearly waste management cost, the monthly per-capita waste management cost and the waste management cost per metric ton of managed waste are equal to 69,034, 0.33 and 22.9 euro respectively. These costs approximately are the same as the one of the M3 scenario, as the evidence that the plastic does not have an high influence on the economic balance of this waste management scheme, even if its contribution is important from an environmental point of view.
Social dimension The social dimension evaluation of the M4 scenario is showed in Figure 5.20, where its average value due to the 4 considered categories, is equal to 2.5.
Figure 5.20 M4 scenario: social dimension assessment
The waste management scheme of this scenario is the same of the M3 scenario, with only exception represented by the plastic collection and recover. Nevertheless, the evaluation of human rights/working conditions, food security and safety, quality of the area and the good governance categories are equal to the ones of the M3 scenario, which are 3.3, 1.5, 2.4 and 2.7 respectively. It clearly appears that introduction of the plastic recovering, which represents a little yearly amount, does not entail any influence or change on the aforementioned categories, even if represents an interesting activities to stimulate and improve the citizens awareness concerning the holistic waste management.
Environmental dimension The environmental dimension evaluation of the M4 scenario is showed in Figure 5.21, where its average value, due to the 4 considered categories is equal to 2.2.
0
1
2
3
4
Human rights/workingconditions
Food security and safety
Quality of the area
Good governance
M4
161
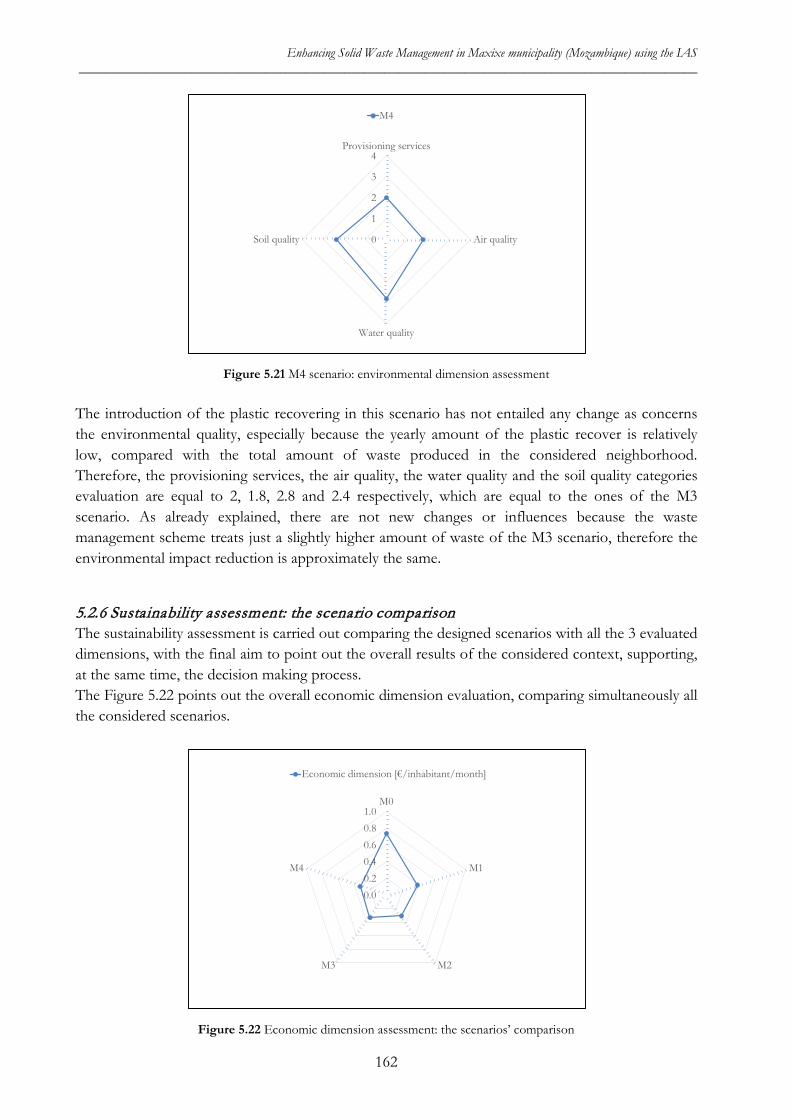
Enhancing Solid Waste Management in Maxixe municipality (Mozambique) using the IAS _____________________________________________________________________________________________
Figure 5.21 M4 scenario: environmental dimension assessment
The introduction of the plastic recovering in this scenario has not entailed any change as concerns the environmental quality, especially because the yearly amount of the plastic recover is relatively low, compared with the total amount of waste produced in the considered neighborhood. Therefore, the provisioning services, the air quality, the water quality and the soil quality categories evaluation are equal to 2, 1.8, 2.8 and 2.4 respectively, which are equal to the ones of the M3 scenario. As already explained, there are not new changes or influences because the waste management scheme treats just a slightly higher amount of waste of the M3 scenario, therefore the environmental impact reduction is approximately the same.
5.2.6 Sustainability assessment: the scenario comparison The sustainability assessment is carried out comparing the designed scenarios with all the 3 evaluated dimensions, with the final aim to point out the overall results of the considered context, supporting, at the same time, the decision making process. The Figure 5.22 points out the overall economic dimension evaluation, comparing simultaneously all the considered scenarios.
Figure 5.22 Economic dimension assessment: the scenarios’ comparison
0
1
2
3
4Provisioning services
Air quality
Water quality
Soil quality
M4
0.00.20.40.60.81.0
M0
M1
M2M3
M4
Economic dimension [€/inhabitant/month]
162
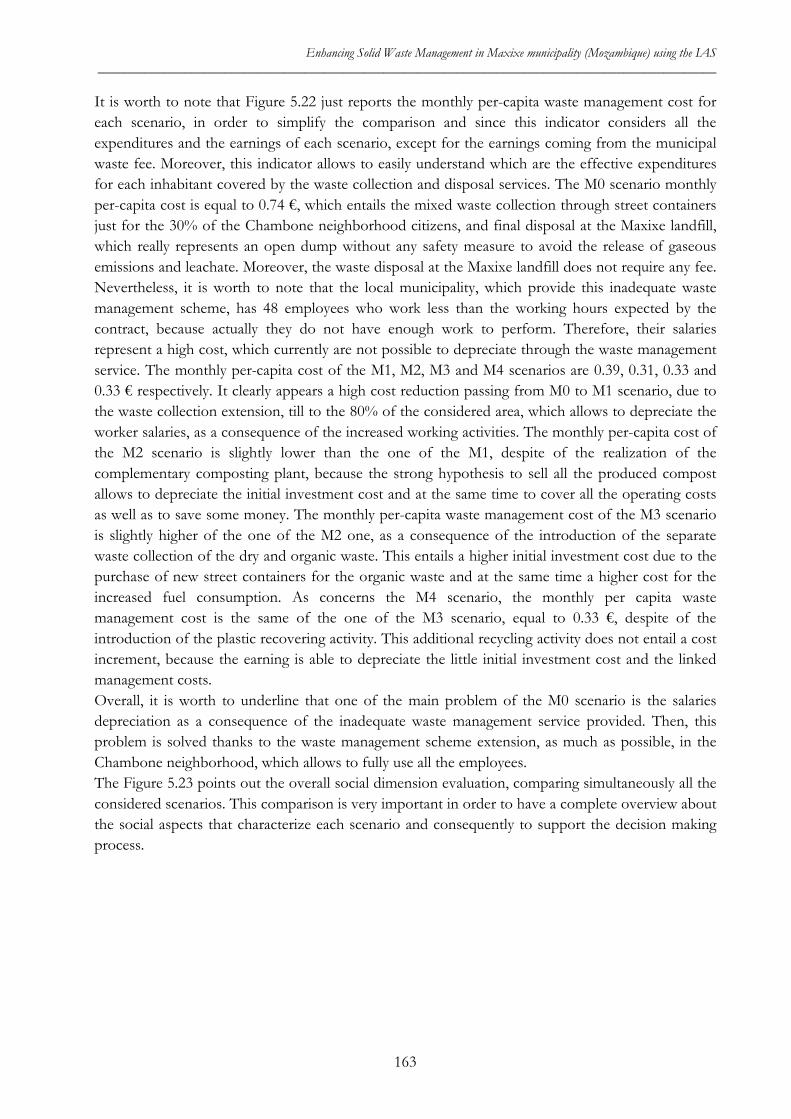
Enhancing Solid Waste Management in Maxixe municipality (Mozambique) using the IAS _____________________________________________________________________________________________
It is worth to note that Figure 5.22 just reports the monthly per-capita waste management cost for each scenario, in order to simplify the comparison and since this indicator considers all the expenditures and the earnings of each scenario, except for the earnings coming from the municipal waste fee. Moreover, this indicator allows to easily understand which are the effective expenditures for each inhabitant covered by the waste collection and disposal services. The M0 scenario monthly per-capita cost is equal to 0.74 €, which entails the mixed waste collection through street containers just for the 30% of the Chambone neighborhood citizens, and final disposal at the Maxixe landfill, which really represents an open dump without any safety measure to avoid the release of gaseous emissions and leachate. Moreover, the waste disposal at the Maxixe landfill does not require any fee. Nevertheless, it is worth to note that the local municipality, which provide this inadequate waste management scheme, has 48 employees who work less than the working hours expected by the contract, because actually they do not have enough work to perform. Therefore, their salaries represent a high cost, which currently are not possible to depreciate through the waste management service. The monthly per-capita cost of the M1, M2, M3 and M4 scenarios are 0.39, 0.31, 0.33 and 0.33 € respectively. It clearly appears a high cost reduction passing from M0 to M1 scenario, due to the waste collection extension, till to the 80% of the considered area, which allows to depreciate the worker salaries, as a consequence of the increased working activities. The monthly per-capita cost of the M2 scenario is slightly lower than the one of the M1, despite of the realization of the complementary composting plant, because the strong hypothesis to sell all the produced compost allows to depreciate the initial investment cost and at the same time to cover all the operating costs as well as to save some money. The monthly per-capita waste management cost of the M3 scenario is slightly higher of the one of the M2 one, as a consequence of the introduction of the separate waste collection of the dry and organic waste. This entails a higher initial investment cost due to the purchase of new street containers for the organic waste and at the same time a higher cost for the increased fuel consumption. As concerns the M4 scenario, the monthly per capita waste management cost is the same of the one of the M3 scenario, equal to 0.33 €, despite of the introduction of the plastic recovering activity. This additional recycling activity does not entail a cost increment, because the earning is able to depreciate the little initial investment cost and the linked management costs. Overall, it is worth to underline that one of the main problem of the M0 scenario is the salaries depreciation as a consequence of the inadequate waste management service provided. Then, this problem is solved thanks to the waste management scheme extension, as much as possible, in the Chambone neighborhood, which allows to fully use all the employees. The Figure 5.23 points out the overall social dimension evaluation, comparing simultaneously all the considered scenarios. This comparison is very important in order to have a complete overview about the social aspects that characterize each scenario and consequently to support the decision making process.
163
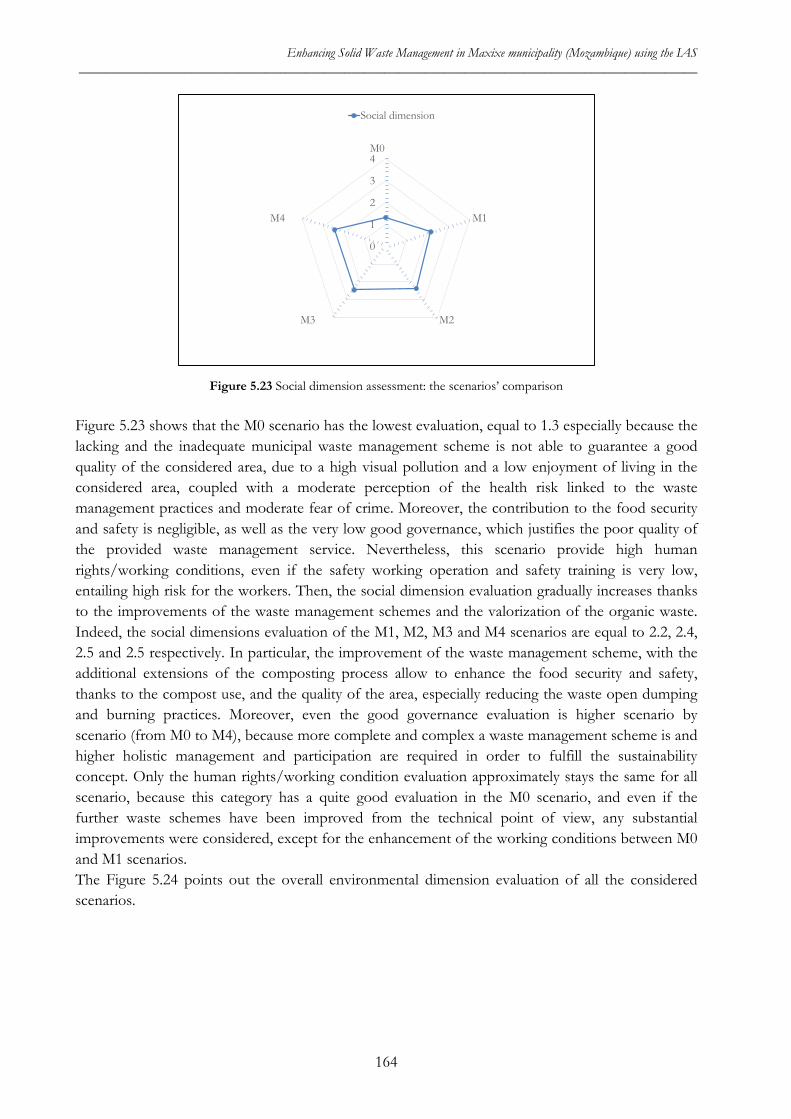
Enhancing Solid Waste Management in Maxixe municipality (Mozambique) using the IAS _____________________________________________________________________________________________
Figure 5.23 Social dimension assessment: the scenarios’ comparison
Figure 5.23 shows that the M0 scenario has the lowest evaluation, equal to 1.3 especially because the lacking and the inadequate municipal waste management scheme is not able to guarantee a good quality of the considered area, due to a high visual pollution and a low enjoyment of living in the considered area, coupled with a moderate perception of the health risk linked to the waste management practices and moderate fear of crime. Moreover, the contribution to the food security and safety is negligible, as well as the very low good governance, which justifies the poor quality of the provided waste management service. Nevertheless, this scenario provide high human rights/working conditions, even if the safety working operation and safety training is very low, entailing high risk for the workers. Then, the social dimension evaluation gradually increases thanks to the improvements of the waste management schemes and the valorization of the organic waste. Indeed, the social dimensions evaluation of the M1, M2, M3 and M4 scenarios are equal to 2.2, 2.4, 2.5 and 2.5 respectively. In particular, the improvement of the waste management scheme, with the additional extensions of the composting process allow to enhance the food security and safety, thanks to the compost use, and the quality of the area, especially reducing the waste open dumping and burning practices. Moreover, even the good governance evaluation is higher scenario by scenario (from M0 to M4), because more complete and complex a waste management scheme is and higher holistic management and participation are required in order to fulfill the sustainability concept. Only the human rights/working condition evaluation approximately stays the same for all scenario, because this category has a quite good evaluation in the M0 scenario, and even if the further waste schemes have been improved from the technical point of view, any substantial improvements were considered, except for the enhancement of the working conditions between M0 and M1 scenarios. The Figure 5.24 points out the overall environmental dimension evaluation of all the considered scenarios.
0
1
2
3
4M0
M1
M2M3
M4
Social dimension
164
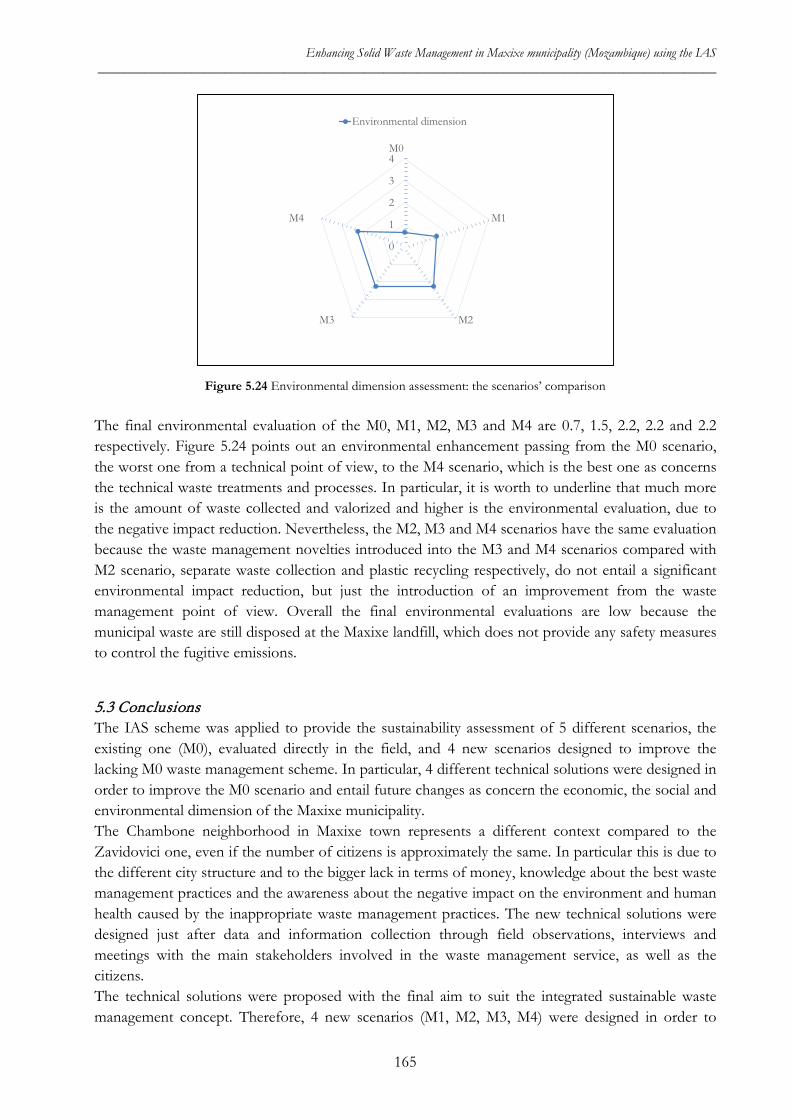
Enhancing Solid Waste Management in Maxixe municipality (Mozambique) using the IAS _____________________________________________________________________________________________
Figure 5.24 Environmental dimension assessment: the scenarios’ comparison
The final environmental evaluation of the M0, M1, M2, M3 and M4 are 0.7, 1.5, 2.2, 2.2 and 2.2 respectively. Figure 5.24 points out an environmental enhancement passing from the M0 scenario, the worst one from a technical point of view, to the M4 scenario, which is the best one as concerns the technical waste treatments and processes. In particular, it is worth to underline that much more is the amount of waste collected and valorized and higher is the environmental evaluation, due to the negative impact reduction. Nevertheless, the M2, M3 and M4 scenarios have the same evaluation because the waste management novelties introduced into the M3 and M4 scenarios compared with M2 scenario, separate waste collection and plastic recycling respectively, do not entail a significant environmental impact reduction, but just the introduction of an improvement from the waste management point of view. Overall the final environmental evaluations are low because the municipal waste are still disposed at the Maxixe landfill, which does not provide any safety measures to control the fugitive emissions.
5.3 Conclusions The IAS scheme was applied to provide the sustainability assessment of 5 different scenarios, the existing one (M0), evaluated directly in the field, and 4 new scenarios designed to improve the lacking M0 waste management scheme. In particular, 4 different technical solutions were designed in order to improve the M0 scenario and entail future changes as concern the economic, the social and environmental dimension of the Maxixe municipality. The Chambone neighborhood in Maxixe town represents a different context compared to the Zavidovici one, even if the number of citizens is approximately the same. In particular this is due to the different city structure and to the bigger lack in terms of money, knowledge about the best waste management practices and the awareness about the negative impact on the environment and human health caused by the inappropriate waste management practices. The new technical solutions were designed just after data and information collection through field observations, interviews and meetings with the main stakeholders involved in the waste management service, as well as the citizens. The technical solutions were proposed with the final aim to suit the integrated sustainable waste management concept. Therefore, 4 new scenarios (M1, M2, M3, M4) were designed in order to
0
1
2
3
4M0
M1
M2M3
M4
Environmental dimension
165
Enhancing Solid Waste Management in Maxixe municipality (Mozambique) using the IAS _____________________________________________________________________________________________
enhance the current waste management scheme (M0), according to the context characteristics and possibilities. In particular, the enhancement of the waste collection service, the waste valorization, especially as concerns the organic fraction of municipal solid waste through composting process, and the separate waste collection (dry and organic waste) represent the main suitable and feasible processes necessary to improve the waste management service. Moreover, the new scenarios entail the M0 waste management scheme rearrangement, which currently is causing high expenditure without any positive economic and performance results. It is worth to note that the proposed technical solutions want to enhance the current waste management system (M0) trying to involve the same staff and the equipment already in place, limiting as much as possible further expenditures. The type of waste management scheme has a high influence on the amount of waste flows. In particular, the M0 scenario, which does not perform an adequate waste management collection and a negligible organic waste valorization treatment, disposes of in the landfill approximately 970 metric tons of waste per year and valorizes 30 metric tons of organic waste per year. Obviously, in this scenario, a big amount of waste is dumped along the streets of the city and near the households, therefore is not collected and disposed of in the landfill. The M1 scenario, which performs an appropriate waste collection with a little bit higher waste valorization of the organic matter, disposes of in the landfill approximately 2,900 metric tons of waste per year, and valorizes approximately 100 metric tons of organic waste per year. The scenario M2 disposes of in the landfill 2,000 metric tons of waste year and valorizes approximately 1,000 metric tons of organic waste per year, thanks to the construction of a bigger composting plant. The M3 scenario has the same waste flows of the M2 one, because the introduction of the separate waste collection just guarantees the final compost quality. Finally, the scenario Z4 that valorizes a little amount of plastic waste, allows to dispose of in the landfill and to valorize approximately 1,900 and 1,000 metric tons of waste per year respectively. It is worth to underline that in Maxixe municipality there is not a waste management informal sector with waste pickers and middle dealers, therefore the valorization of the valuable waste is currently not so economically feasible. This is mainly due to the high distance from the capital city (Maputo), where there are different companies that can buy and reuse the secondary raw materials. Therefore, this high distance would entail huge transport costs, higher than the earning. Nevertheless, a little plastic recovering treatment was designed just to reduce the environmental impact and to increase the awareness about this issue, because actually this process is just able to cover the running expenditure, without saving money. Despite the gradual introduction of new technologies and processes into the scenario M1, M2, M3 and M4, a waste management reduction cost was estimated as a consequence of the worker salaries depreciation. This was possible because the extension of the waste collection service and also the introduction of new technologies require to fully employ the workers already engaged by the municipality. These considerations underline how the Mozambican and Bosnian contexts are different and provide different evaluations despite some of the considered waste treatment options are the same.
166
Enhancing Solid Waste Management in Maxixe municipality (Mozambique) using the IAS _____________________________________________________________________________________________
References [1] CIA. The World Factbook. Available online
at: https://www.cia.gov/library/publications/the-world-factbook/geos/mz.html. Accessed: 04/12/2014).
[2] Wikipedia. Community of Sant’Egidio Available online at: http://en.wikipedia.org/wiki/Community_of_Sant%27Egidio. Accessed: 04/12/2014).
[3] UNDP. (2014). Human Development Report 2014. Sustaining Human Progress: Reducing Vulnerabilities and Building Resilience. Available online at: http://hdr.undp.org/sites/default/files/hdr14-report-en-1.pdf. (Accessed: 12/11/2014).
[4] Wikipedia. (2014). Gross Domestic Product Definition. Available online at: http://en.wikipedia.org/wiki/Gross_domestic_product. (Accessed: 12/11/2014).
[5] INE (2013). Estatistica do Distrito. Cidade de Maxixe – Novembro 2013. Available online at: http://www.ine.gov.mz/estatisticas/estatisticas-territorias-distritais/inhambane/novembro-de-2013/cidade-da-maxixe.pdf/view. (Accessed: 12/11/2014).
[6] INE (2007). Recenseamento geral da população e habitação 2007. Available online at: http://www.ine.gov.mz/operacoes-estatisticas/censos/censo-2007/rgph-2007/indicadores-distritais/regiao-sol/indicadores-socio-demograficos-distritais-inhambane.pdf/view. (Accessed: 12/11/2014).
[7] INE (2014). Preparação do IV Censo Populacional 2017. Available online at: http://www.ine.gov.mz/operacoes-estatisticas/censos/censo-2007/censo-2017. (Accessed: 12/11/2014).
[8] Fernando A., Carmo Lima S. (2012). Caracterizacao dos residuos solidos urbanos do municipio de Maxixe/Mozambique. Caminhos de geografia. ISSN 1678-6343. Available at http://www.seer.ufu.br/index.php/caminhosdegeografia. (Accessed: 12/11/2014).
[9] WAPCOS (2014). Muncipal solid waste management plan for Maxixe city. Available online at: www.wapcos.gov.in/. (Accessed: 12/11/2014).
167

Enhancing Solid Waste Management in Maxixe municipality (Mozambique) using the IAS _____________________________________________________________________________________________
168
Conclusions _____________________________________________________________________________________________
Chapter 6. Concluding remarks
The main objective of this research was to develop a multi-dimensional tool to support the decision making process, based on the scenario analysis and on a mixed scoring system (qualitative and quantitative), in order to reach a sustainable waste management in low and middle income countries. In particular, the assessment tool considers the economic, social and economic implications and the impacts caused by different technical solutions proposed to improve the waste management, and therefore to evaluate the sustainability. This integrated assessment scheme (IAS) was applied and validated in two different contexts (Bosnia- Herzegovina and Mozambique), in order to analyze the strength points and constraints of the developed methodology, and therefore to understand its suitability on other contexts. The experimental research carried out in this thesis has brought to the following considerations:
- the IAS allows to overcome the lack of big quantity and specific good quality data necessary to support the traditional complex assessment tools;
- the IAS is based on the scenario analysis, a methodological approach that allows to assess and understand changes that might be expected to modify the considered context and its elements, as a consequence of technical solutions choice aimed at appropriately managing the waste in low and middle income countries;
- the IAS allows to carry out the scenario comparison taking into account the implications and changes caused by different waste management options on the 3 main sustainability dimensions (economic, social and environmental). Moreover, the IAS allows to perform a more integrated evaluation (holistic evaluation) compared to many other tools that consider just a single dimension;
- the IAS scoring system is easily understandable also for those who do not have a clear knowledge and training about waste management practices and the elements that compose it. In particular, the environmental and social dimensions provide the final results with dimensional values, in the range 0-4, where 0 represents the worst result and 4 the best one;
- the economic dimension provides quantitative results, expressed in monetary unit. This evaluation depends on quantitative data collected in the field, therefore provides accurate and significant final results.
- The final results of the social and environmental dimensions depend on the qualitative scoring system which is subjected to the expert judgment. The personal expert evaluation is considered a valuable and often an essential instrument to understand the dynamic of complex systems linked to management interventions. The significance of the final results, depending so highly on human skills, could represent a relevant drawback in the IAS implementation.
169
Conclusions _____________________________________________________________________________________________
- the application of the IAS requires a good knowledge of the analyzed context, therefore, direct missions in the field are necessary in order to understand and see what really is happening in such contexts, as well as to collect data and information about the waste management system and the main involved stakeholders. Meanwhile, the context knowledge could represent a constraint, because it requires a lot of time in order to understand which are the main characteristics and elements and even money to support the local staying and collection data activities.
- the IAS has to be implemented by people who have good awareness and knowledge about the waste management practices, technologies and processes as well as a good technical skill in this field, in order to understand the system dynamics and relations that exist between the system elements and its dimensions (economic, social and environmental). All these dimensions have to be taken into account in order to achieve reasonable and reliable results, which otherwise could represent a constraint for the methodology implementation and scenario evaluations;
- the IAS allows to carry out a comparison of the scenarios’ sustainability without, however, bestowing absolute weight to the different elements considered for the scenario evaluation. Therefore, even the stakeholder community, and not just the evaluator, has to define the system elements weight related to the final aims;
- the IAS application to the real case studies (Bosnia and Herzegovina and Mozambique) has shown a good suitability to both the evaluated contexts, which have significant different environmental and socio-economic characteristics, showing the feasibility to use this assessment scheme in other different contexts;
- the significant different characteristics of the analyzed contexts (such as different waste
management practices, levels of technical skills, awareness and knowledge about the waste management, living standards, traditional habits and behaviors and economic resources) entail a site specific assessment, even if the adopted technical solutions to manage waste could be the same;
- the IAS can be applied to assess different scenarios for a specific context, and then can be used to evaluate the chosen scenario after a period of time, in order to analyze if the adopted scenario, at least, has provided the expected actions and reactions in the considered context, with the final aim to evaluate the sustainability (as follow-up).
170

171

172
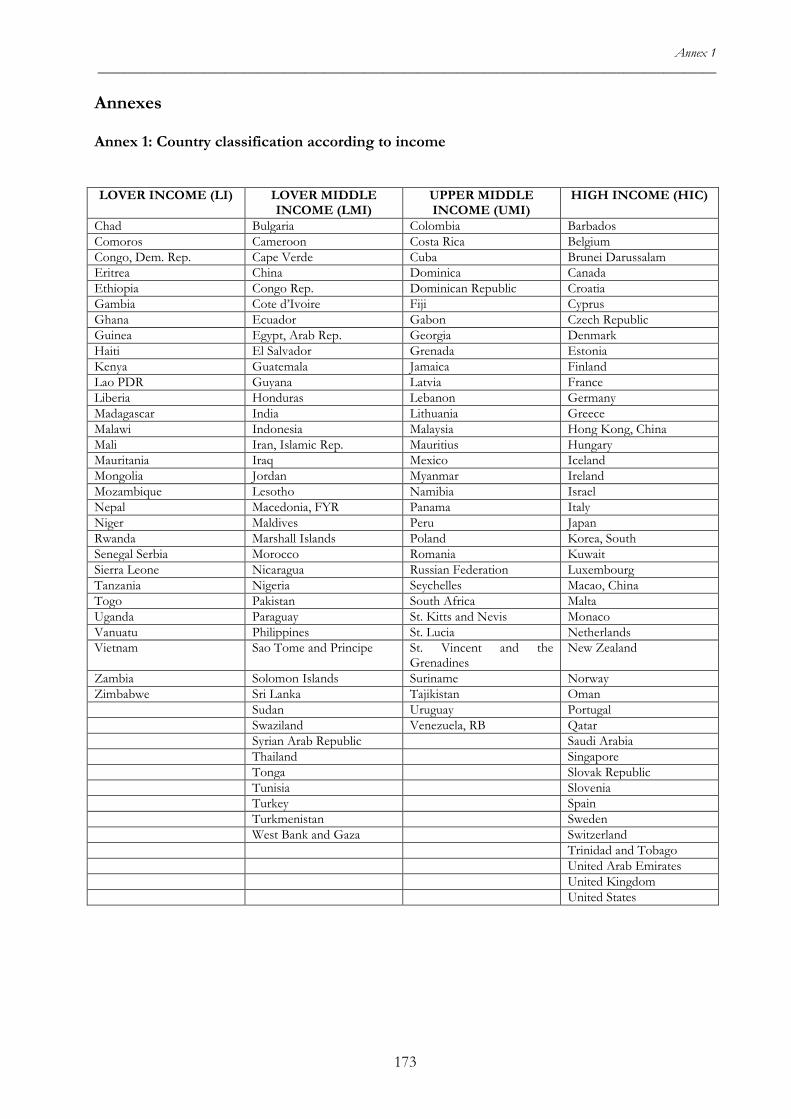
Annex 1 _____________________________________________________________________________________________
Annexes
Annex 1: Country classification according to income
LOVER INCOME (LI) LOVER MIDDLE INCOME (LMI)
UPPER MIDDLE INCOME (UMI)
HIGH INCOME (HIC)
Chad Bulgaria Colombia Barbados Comoros Cameroon Costa Rica Belgium Congo, Dem. Rep. Cape Verde Cuba Brunei Darussalam Eritrea China Dominica Canada Ethiopia Congo Rep. Dominican Republic Croatia Gambia Cote d’Ivoire Fiji Cyprus Ghana Ecuador Gabon Czech Republic Guinea Egypt, Arab Rep. Georgia Denmark Haiti El Salvador Grenada Estonia Kenya Guatemala Jamaica Finland Lao PDR Guyana Latvia France Liberia Honduras Lebanon Germany Madagascar India Lithuania Greece Malawi Indonesia Malaysia Hong Kong, China Mali Iran, Islamic Rep. Mauritius Hungary Mauritania Iraq Mexico Iceland Mongolia Jordan Myanmar Ireland Mozambique Lesotho Namibia Israel Nepal Macedonia, FYR Panama Italy Niger Maldives Peru Japan Rwanda Marshall Islands Poland Korea, South Senegal Serbia Morocco Romania Kuwait Sierra Leone Nicaragua Russian Federation Luxembourg Tanzania Nigeria Seychelles Macao, China Togo Pakistan South Africa Malta Uganda Paraguay St. Kitts and Nevis Monaco Vanuatu Philippines St. Lucia Netherlands Vietnam Sao Tome and Principe St. Vincent and the
Grenadines New Zealand
Zambia Solomon Islands Suriname Norway Zimbabwe Sri Lanka Tajikistan Oman Sudan Uruguay Portugal Swaziland Venezuela, RB Qatar Syrian Arab Republic Saudi Arabia Thailand Singapore Tonga Slovak Republic Tunisia Slovenia Turkey Spain Turkmenistan Sweden West Bank and Gaza Switzerland Trinidad and Tobago United Arab Emirates United Kingdom United States
173

Annex 2 _____________________________________________________________________________________________
Annex 2: Summary of the steps in the ISWM assessment process
No. Step Activities Outputs 1 Initiate and start
the process - Recognise a need or receive a demand for an
assessment of waste management - Decide to use ISWM for this assessment - Secure funding - Establish contacts with the city and local
stakeholders - Make the need or demand widely known in
the locality
- ToR for facilitating organisation
- Briefing/announcement workshop
2 Set up organisational framework
- Designate or hire office space - Develop a work plan and a budget - Divide tasks within the facilitating
organisation - Identify the need for external advice - Set up a monitoring and evaluation
framework - Establish administrative procedures
(reporting, financial procedures, etc.) - Visits to the city and meetings with local
stakeholders - Select a city coordinator
- Work plan and budget - Monitoring and evaluation
framework - Administrative procedures
3 Stakeholder mobilisation and establishment of working group
- Identify potential members - Decide on a venue - Organise launching - Work with the group to develop their role
and activities - Develop statutes or internal regulations - Monitor meetings
- Functioning working group, Stakeholder platform or Waste Management Board
- Minutes of meetings with existing stakeholder groups
4 MoU process - Hold preliminary discussions with organisations
- Decide on organisations to sign MoU - Negotiate roles, responsibilities and
contributions with potential signatories - Prepare a draft MoU - Discuss the draft MoU with potential
signatories - Finalise text of MoU - Organise signing of MoU - Monitor implementation of the MoU
- Memorandum of Understanding (MoU) signed by relevant parties
5 Capacity building
- Select target groups for capacity building - Identify capacity building needs - Identify the most appropriate methods to
build capacities - Deliver capacity building
- Capacity building events, e.g. workshops and study tours
- Reports about capacity building events
6 Data collection, analysis, reporting and review
- Develop a research plan - Train stakeholders - Collect data - Analyse data - Write draft report - Organise and gather feedback from local
stakeholders - Adapt and finalise report - Present the report to stakeholders and
disseminate findings
- Research plan - ISWM assessment baseline
document
7 Identification and prioritisation of key issues
- Identify main problems, bottlenecks, key issues
- Prioritise key issues
- List of key issues and priorities
174
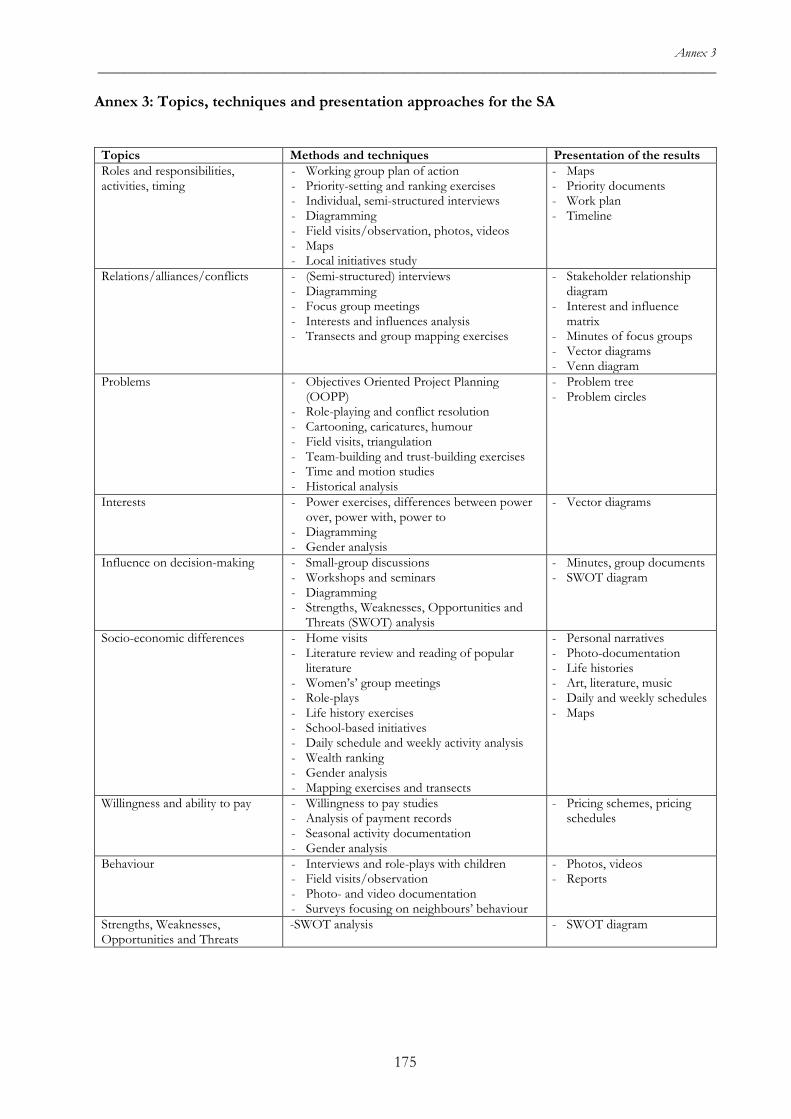
Annex 3 _____________________________________________________________________________________________
Annex 3: Topics, techniques and presentation approaches for the SA
Topics Methods and techniques Presentation of the results Roles and responsibilities, activities, timing
- Working group plan of action - Priority-setting and ranking exercises - Individual, semi-structured interviews - Diagramming - Field visits/observation, photos, videos - Maps - Local initiatives study
- Maps - Priority documents - Work plan - Timeline
Relations/alliances/conflicts - (Semi-structured) interviews - Diagramming - Focus group meetings - Interests and influences analysis - Transects and group mapping exercises
- Stakeholder relationship diagram
- Interest and influence matrix
- Minutes of focus groups - Vector diagrams - Venn diagram
Problems - Objectives Oriented Project Planning (OOPP)
- Role-playing and conflict resolution - Cartooning, caricatures, humour - Field visits, triangulation - Team-building and trust-building exercises - Time and motion studies - Historical analysis
- Problem tree - Problem circles
Interests - Power exercises, differences between power over, power with, power to
- Diagramming - Gender analysis
- Vector diagrams
Influence on decision-making - Small-group discussions - Workshops and seminars - Diagramming - Strengths, Weaknesses, Opportunities and
Threats (SWOT) analysis
- Minutes, group documents - SWOT diagram
Socio-economic differences - Home visits - Literature review and reading of popular
literature - Women’s’ group meetings - Role-plays - Life history exercises - School-based initiatives - Daily schedule and weekly activity analysis - Wealth ranking - Gender analysis - Mapping exercises and transects
- Personal narratives - Photo-documentation - Life histories - Art, literature, music - Daily and weekly schedules - Maps
Willingness and ability to pay - Willingness to pay studies - Analysis of payment records - Seasonal activity documentation - Gender analysis
- Pricing schemes, pricing schedules
Behaviour - Interviews and role-plays with children - Field visits/observation - Photo- and video documentation - Surveys focusing on neighbours’ behaviour
- Photos, videos - Reports
Strengths, Weaknesses, Opportunities and Threats
-SWOT analysis - SWOT diagram
175
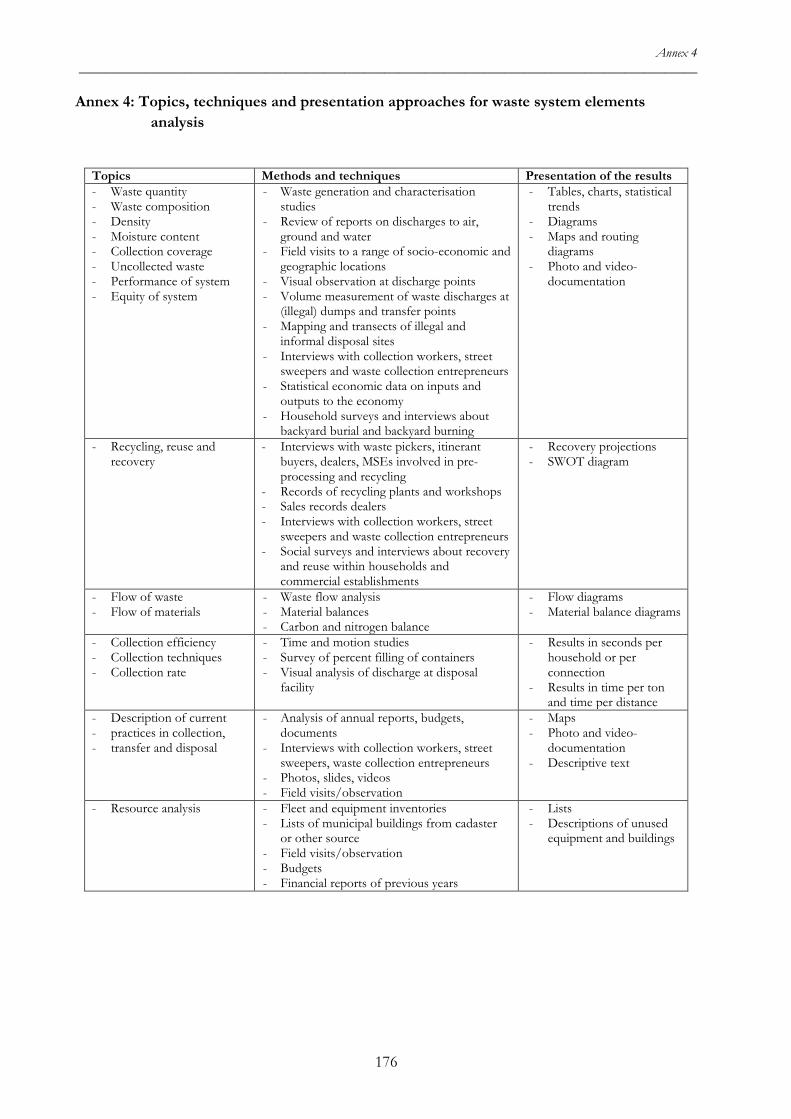
Annex 4 _____________________________________________________________________________________________
Annex 4: Topics, techniques and presentation approaches for waste system elements analysis
Topics Methods and techniques Presentation of the results - Waste quantity - Waste composition - Density - Moisture content - Collection coverage - Uncollected waste - Performance of system - Equity of system
- Waste generation and characterisation studies
- Review of reports on discharges to air, ground and water
- Field visits to a range of socio-economic and geographic locations
- Visual observation at discharge points - Volume measurement of waste discharges at
(illegal) dumps and transfer points - Mapping and transects of illegal and
informal disposal sites - Interviews with collection workers, street
sweepers and waste collection entrepreneurs - Statistical economic data on inputs and
outputs to the economy - Household surveys and interviews about
backyard burial and backyard burning
- Tables, charts, statistical trends
- Diagrams - Maps and routing
diagrams - Photo and video-
documentation
- Recycling, reuse and recovery
- Interviews with waste pickers, itinerant buyers, dealers, MSEs involved in pre-processing and recycling
- Records of recycling plants and workshops - Sales records dealers - Interviews with collection workers, street
sweepers and waste collection entrepreneurs - Social surveys and interviews about recovery
and reuse within households and commercial establishments
- Recovery projections - SWOT diagram
- Flow of waste - Flow of materials
- Waste flow analysis - Material balances - Carbon and nitrogen balance
- Flow diagrams - Material balance diagrams
- Collection efficiency - Collection techniques - Collection rate
- Time and motion studies - Survey of percent filling of containers - Visual analysis of discharge at disposal
facility
- Results in seconds per household or per connection
- Results in time per ton and time per distance
- Description of current - practices in collection, - transfer and disposal
- Analysis of annual reports, budgets, documents
- Interviews with collection workers, street sweepers, waste collection entrepreneurs
- Photos, slides, videos - Field visits/observation
- Maps - Photo and video-
documentation - Descriptive text
- Resource analysis - Fleet and equipment inventories - Lists of municipal buildings from cadaster
or other source - Field visits/observation - Budgets - Financial reports of previous years
- Lists - Descriptions of unused
equipment and buildings
176
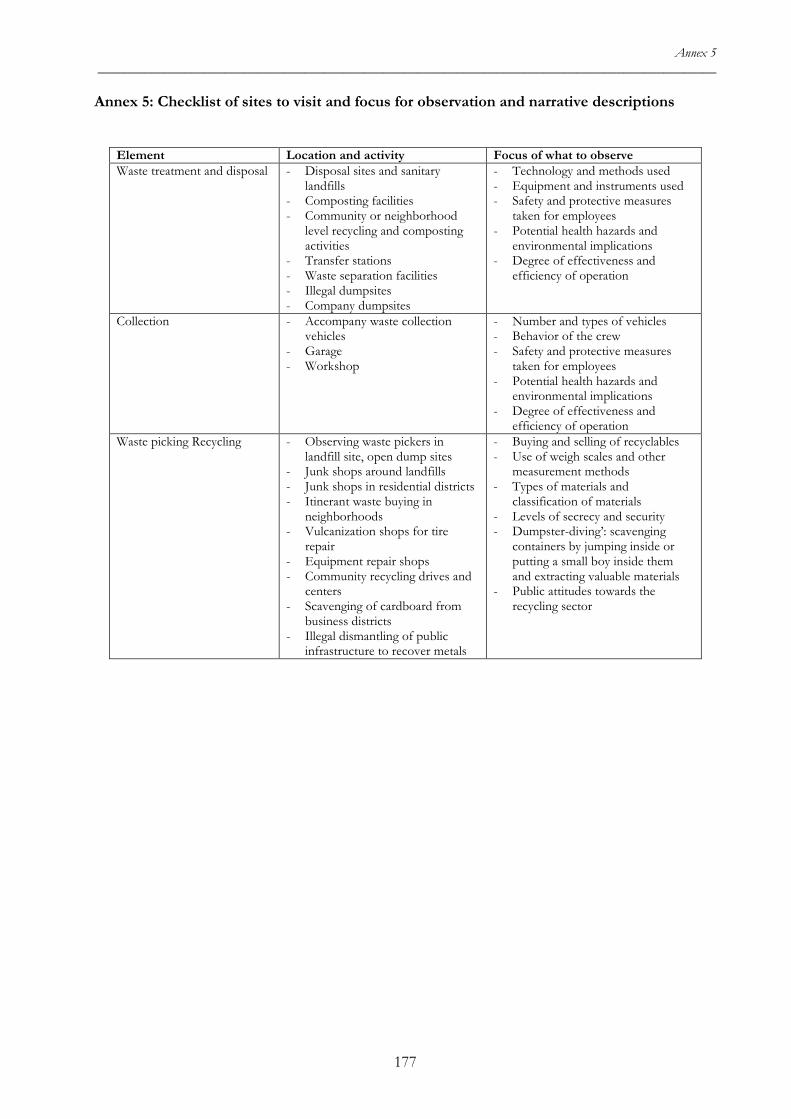
Annex 5 _____________________________________________________________________________________________
Annex 5: Checklist of sites to visit and focus for observation and narrative descriptions
Element Location and activity Focus of what to observe Waste treatment and disposal - Disposal sites and sanitary
landfills - Composting facilities - Community or neighborhood
level recycling and composting activities
- Transfer stations - Waste separation facilities - Illegal dumpsites - Company dumpsites
- Technology and methods used - Equipment and instruments used - Safety and protective measures
taken for employees - Potential health hazards and
environmental implications - Degree of effectiveness and
efficiency of operation
Collection - Accompany waste collection vehicles
- Garage - Workshop
- Number and types of vehicles - Behavior of the crew - Safety and protective measures
taken for employees - Potential health hazards and
environmental implications - Degree of effectiveness and
efficiency of operation Waste picking Recycling - Observing waste pickers in
landfill site, open dump sites - Junk shops around landfills - Junk shops in residential districts - Itinerant waste buying in
neighborhoods - Vulcanization shops for tire
repair - Equipment repair shops - Community recycling drives and
centers - Scavenging of cardboard from
business districts - Illegal dismantling of public
infrastructure to recover metals
- Buying and selling of recyclables - Use of weigh scales and other
measurement methods - Types of materials and
classification of materials - Levels of secrecy and security - Dumpster-diving’: scavenging
containers by jumping inside or putting a small boy inside them and extracting valuable materials
- Public attitudes towards the recycling sector
177
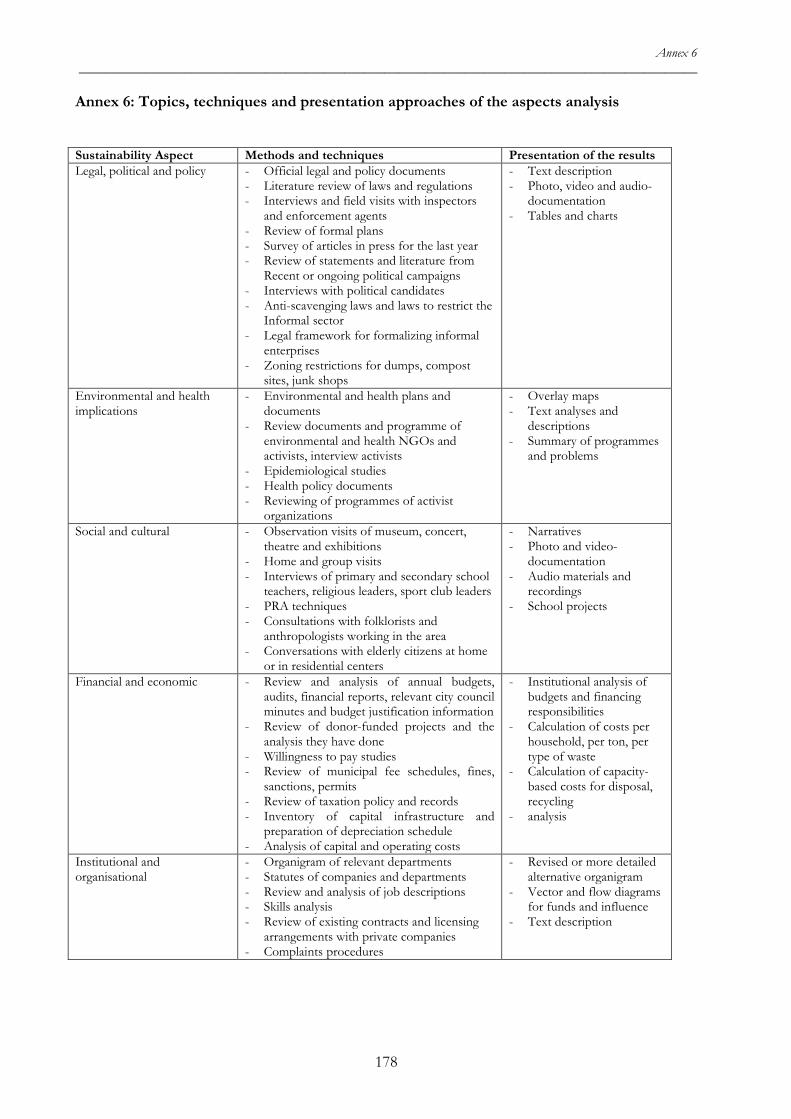
Annex 6 _____________________________________________________________________________________________
Annex 6: Topics, techniques and presentation approaches of the aspects analysis
Sustainability Aspect Methods and techniques Presentation of the results Legal, political and policy - Official legal and policy documents
- Literature review of laws and regulations - Interviews and field visits with inspectors
and enforcement agents - Review of formal plans - Survey of articles in press for the last year - Review of statements and literature from
Recent or ongoing political campaigns - Interviews with political candidates - Anti-scavenging laws and laws to restrict the
Informal sector - Legal framework for formalizing informal
enterprises - Zoning restrictions for dumps, compost
sites, junk shops
- Text description - Photo, video and audio-
documentation - Tables and charts
Environmental and health implications
- Environmental and health plans and documents
- Review documents and programme of environmental and health NGOs and activists, interview activists
- Epidemiological studies - Health policy documents - Reviewing of programmes of activist
organizations
- Overlay maps - Text analyses and
descriptions - Summary of programmes
and problems
Social and cultural - Observation visits of museum, concert, theatre and exhibitions
- Home and group visits - Interviews of primary and secondary school
teachers, religious leaders, sport club leaders - PRA techniques - Consultations with folklorists and
anthropologists working in the area - Conversations with elderly citizens at home
or in residential centers
- Narratives - Photo and video-
documentation - Audio materials and
recordings - School projects
Financial and economic - Review and analysis of annual budgets, audits, financial reports, relevant city council minutes and budget justification information
- Review of donor-funded projects and the analysis they have done
- Willingness to pay studies - Review of municipal fee schedules, fines,
sanctions, permits - Review of taxation policy and records - Inventory of capital infrastructure and
preparation of depreciation schedule - Analysis of capital and operating costs
- Institutional analysis of budgets and financing responsibilities
- Calculation of costs per household, per ton, per type of waste
- Calculation of capacity-based costs for disposal, recycling
- analysis
Institutional and organisational
- Organigram of relevant departments - Statutes of companies and departments - Review and analysis of job descriptions - Skills analysis - Review of existing contracts and licensing
arrangements with private companies - Complaints procedures
- Revised or more detailed alternative organigram
- Vector and flow diagrams for funds and influence
- Text description
178
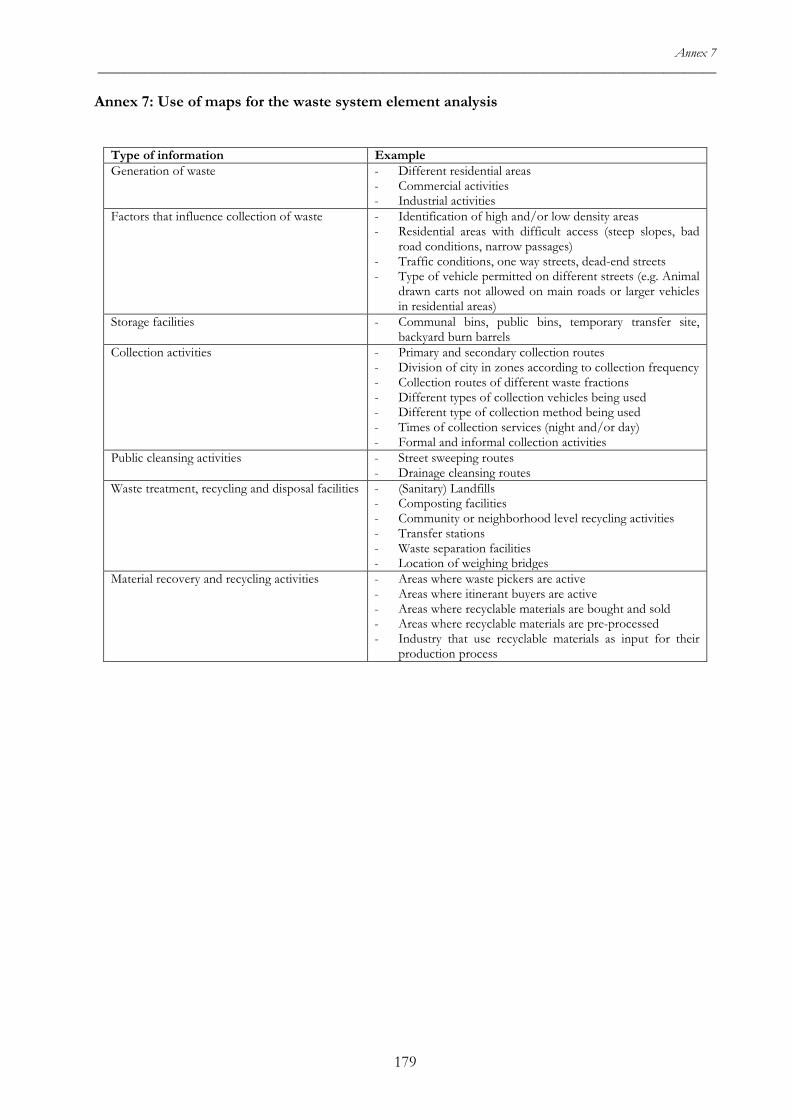
Annex 7 _____________________________________________________________________________________________
Annex 7: Use of maps for the waste system element analysis
Type of information Example Generation of waste - Different residential areas
- Commercial activities - Industrial activities
Factors that influence collection of waste - Identification of high and/or low density areas - Residential areas with difficult access (steep slopes, bad
road conditions, narrow passages) - Traffic conditions, one way streets, dead-end streets - Type of vehicle permitted on different streets (e.g. Animal
drawn carts not allowed on main roads or larger vehicles in residential areas)
Storage facilities - Communal bins, public bins, temporary transfer site, backyard burn barrels
Collection activities - Primary and secondary collection routes - Division of city in zones according to collection frequency - Collection routes of different waste fractions - Different types of collection vehicles being used - Different type of collection method being used - Times of collection services (night and/or day) - Formal and informal collection activities
Public cleansing activities - Street sweeping routes - Drainage cleansing routes
Waste treatment, recycling and disposal facilities - (Sanitary) Landfills - Composting facilities - Community or neighborhood level recycling activities - Transfer stations - Waste separation facilities - Location of weighing bridges
Material recovery and recycling activities - Areas where waste pickers are active - Areas where itinerant buyers are active - Areas where recyclable materials are bought and sold - Areas where recyclable materials are pre-processed - Industry that use recyclable materials as input for their
production process
179

Annex 8 _____________________________________________________________________________________________
Annex 8: Design data for Z0 scenario
Z0 SCENARIO Data Measurement unit Value Source
Daily per-capita waste production kg/day/inhabitant 0.7 [1]; personal communication and
cross-checking field data
Inhabitants N° 16,000 Personal communication with Municipality and local public utility
Fuel cost euro/L 1.2 Field data
Workers N° 7 Personal communication with the local public utility
Gross workers salary (paid by the local public utility) euro/worker/month 500 Personal communication with the
local public utility
Net workers salary euro/worker/month 300 Personal communication with local public utility and workers
Working days days/week 6 Personal communication with local public utility and workers
Volume of garbage truck (N°1) m3 22 Personal communication with the local public utility
Volume of garbage truck (N°2) m3 24 Personal communication with the local public utility and workers; field observation
Garbage truck fuel consumption km/L 4 Personal assumption Zavidovici municipal solid waste fee euro/inhabitant/month 0.7 Personal communication with the
local public utility and Municipality Waste flow collected N° 1 -
Frequency of waste collection N° of collection/week 3 Personal communication with the local public utility and workers; field observation
Street containers (V=1.1 m3) N° 100 Personal communication with local public utility; field observations
Street containers cost euro/container 300 Personal communication with the local public utility
Street containers lifespan year 5 Personal communication with the local public utility; personal assumption
Zavidovici landfill disposal fee euro/t 0 Personal communication with the local public utility
[1] Vaccari, M.; Di Bella, V.; Vitali, F.; Collivignarelli, C. (2013). From mixed to separated collection of solid waste: Benefits for the town of Zavidovici (Bosnia and Herzegovina). Waste Management, 33, 277–286.
180
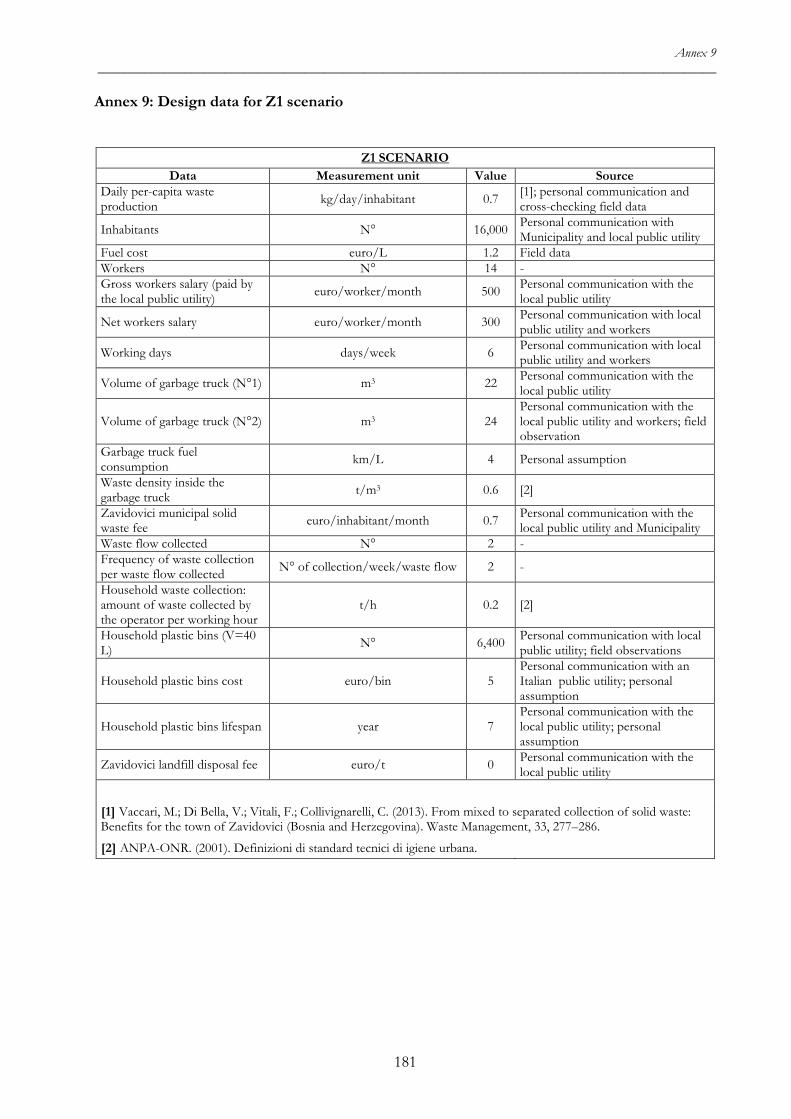
Annex 9 _____________________________________________________________________________________________
Annex 9: Design data for Z1 scenario
Z1 SCENARIO Data Measurement unit Value Source
Daily per-capita waste production kg/day/inhabitant 0.7 [1]; personal communication and
cross-checking field data
Inhabitants N° 16,000 Personal communication with Municipality and local public utility
Fuel cost euro/L 1.2 Field data Workers N° 14 - Gross workers salary (paid by the local public utility) euro/worker/month 500 Personal communication with the
local public utility
Net workers salary euro/worker/month 300 Personal communication with local public utility and workers
Working days days/week 6 Personal communication with local public utility and workers
Volume of garbage truck (N°1) m3 22 Personal communication with the local public utility
Volume of garbage truck (N°2) m3 24 Personal communication with the local public utility and workers; field observation
Garbage truck fuel consumption km/L 4 Personal assumption
Waste density inside the garbage truck t/m3 0.6 [2]
Zavidovici municipal solid waste fee euro/inhabitant/month 0.7 Personal communication with the
local public utility and Municipality Waste flow collected N° 2 - Frequency of waste collection per waste flow collected N° of collection/week/waste flow 2 -
Household waste collection: amount of waste collected by the operator per working hour
t/h 0.2 [2]
Household plastic bins (V=40 L) N° 6,400 Personal communication with local
public utility; field observations
Household plastic bins cost euro/bin 5 Personal communication with an Italian public utility; personal assumption
Household plastic bins lifespan year 7 Personal communication with the local public utility; personal assumption
Zavidovici landfill disposal fee euro/t 0 Personal communication with the local public utility
[1] Vaccari, M.; Di Bella, V.; Vitali, F.; Collivignarelli, C. (2013). From mixed to separated collection of solid waste: Benefits for the town of Zavidovici (Bosnia and Herzegovina). Waste Management, 33, 277–286.
[2] ANPA-ONR. (2001). Definizioni di standard tecnici di igiene urbana.
181

Annex 10 _____________________________________________________________________________________________
Annex 10: Design data for Z2 scenario
Z2 SCENARIO Data Measurement unit Value Source
Daily per-capita waste production kg/day/inhabitant 0.7 [1]; personal communication and
cross-checking field data
Inhabitants N° 16,000 Personal communication with Municipality and local public utility
Fuel cost euro/L 1.2 Field data Workers N° 7 - Roma formally employed N° 7 - Gross workers salary (paid by the local public utility) euro/worker/month 500 Personal communication with the
local public utility
Net workers salary euro/worker/month 300 Personal communication with local public utility and workers
Working days days/week 6 Personal communication with local public utility and workers
Volume of garbage truck (N°1) m3 22 Personal communication with the local public utility
Volume of garbage truck (N°2) m3 24 Personal communication with the local public utility and workers; field observation
Garbage truck fuel consumption km/L 4 Personal assumption
Waste density inside the garbage truck t/m3 0.6 [2]
Zavidovici municipal solid waste fee euro/inhabitant/month 0.7 Personal communication with the
local public utility and Municipality Waste flow collected N° 2 - Frequency of waste collection per waste flow collected N° of collection/week/waste flow 2 -
Household waste collection: amount of waste collected by the operator per working hour
t/h 0.2 [2]
Household plastic bins (V=40 L) N° 6,400 Personal communication with local
public utility; field observations
Household plastic bins cost euro/bin 5 Personal communication with an Italian public utility; personal assumption
Household plastic bins lifespan year 7 Personal communication with the local public utility; personal assumption
Zavidovici landfill disposal fee euro/t 0 Personal communication with the local public utility
[1] Vaccari, M.; Di Bella, V.; Vitali, F.; Collivignarelli, C. (2013). From mixed to separated collection of solid waste: Benefits for the town of Zavidovici (Bosnia and Herzegovina). Waste Management, 33, 277–286.
[2] ANPA-ONR. (2001). Definizioni di standard tecnici di igiene urbana.
182
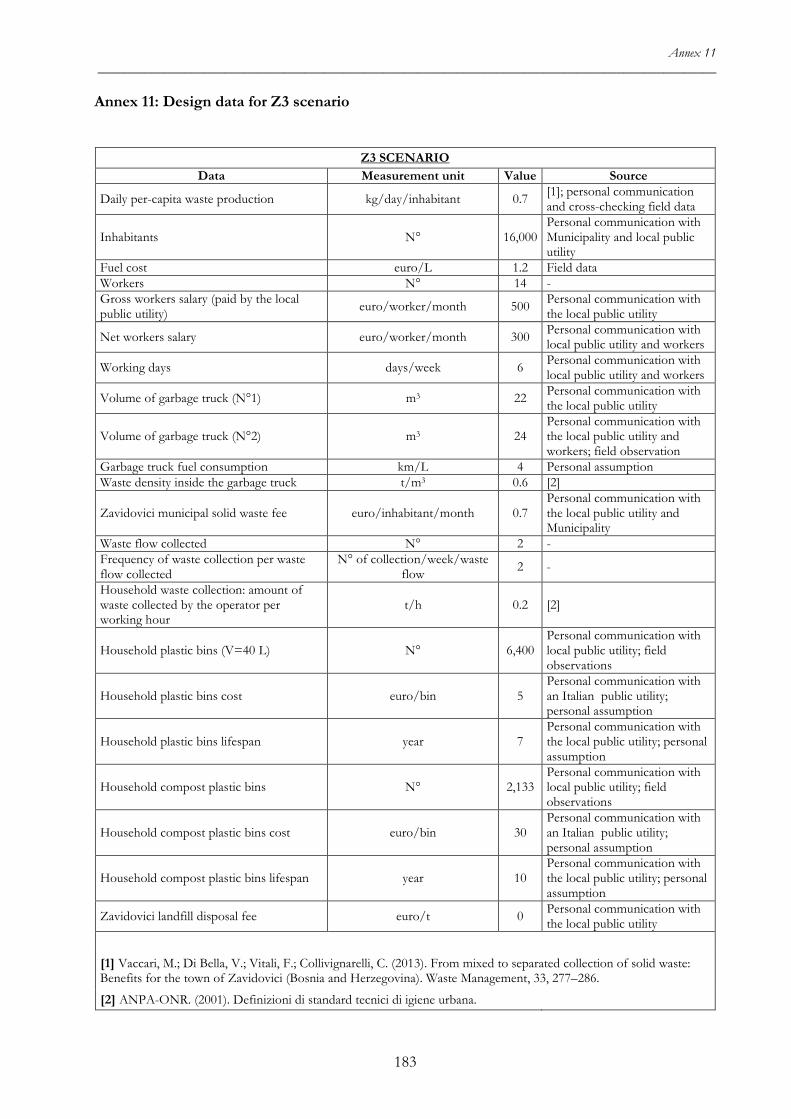
Annex 11 _____________________________________________________________________________________________
Annex 11: Design data for Z3 scenario
Z3 SCENARIO Data Measurement unit Value Source
Daily per-capita waste production kg/day/inhabitant 0.7 [1]; personal communication and cross-checking field data
Inhabitants N° 16,000 Personal communication with Municipality and local public utility
Fuel cost euro/L 1.2 Field data Workers N° 14 - Gross workers salary (paid by the local public utility) euro/worker/month 500 Personal communication with
the local public utility
Net workers salary euro/worker/month 300 Personal communication with local public utility and workers
Working days days/week 6 Personal communication with local public utility and workers
Volume of garbage truck (N°1) m3 22 Personal communication with the local public utility
Volume of garbage truck (N°2) m3 24 Personal communication with the local public utility and workers; field observation
Garbage truck fuel consumption km/L 4 Personal assumption Waste density inside the garbage truck t/m3 0.6 [2]
Zavidovici municipal solid waste fee euro/inhabitant/month 0.7 Personal communication with the local public utility and Municipality
Waste flow collected N° 2 - Frequency of waste collection per waste flow collected
N° of collection/week/waste flow 2 -
Household waste collection: amount of waste collected by the operator per working hour
t/h 0.2 [2]
Household plastic bins (V=40 L) N° 6,400 Personal communication with local public utility; field observations
Household plastic bins cost euro/bin 5 Personal communication with an Italian public utility; personal assumption
Household plastic bins lifespan year 7 Personal communication with the local public utility; personal assumption
Household compost plastic bins N° 2,133 Personal communication with local public utility; field observations
Household compost plastic bins cost euro/bin 30 Personal communication with an Italian public utility; personal assumption
Household compost plastic bins lifespan year 10 Personal communication with the local public utility; personal assumption
Zavidovici landfill disposal fee euro/t 0 Personal communication with the local public utility
[1] Vaccari, M.; Di Bella, V.; Vitali, F.; Collivignarelli, C. (2013). From mixed to separated collection of solid waste: Benefits for the town of Zavidovici (Bosnia and Herzegovina). Waste Management, 33, 277–286.
[2] ANPA-ONR. (2001). Definizioni di standard tecnici di igiene urbana.
183
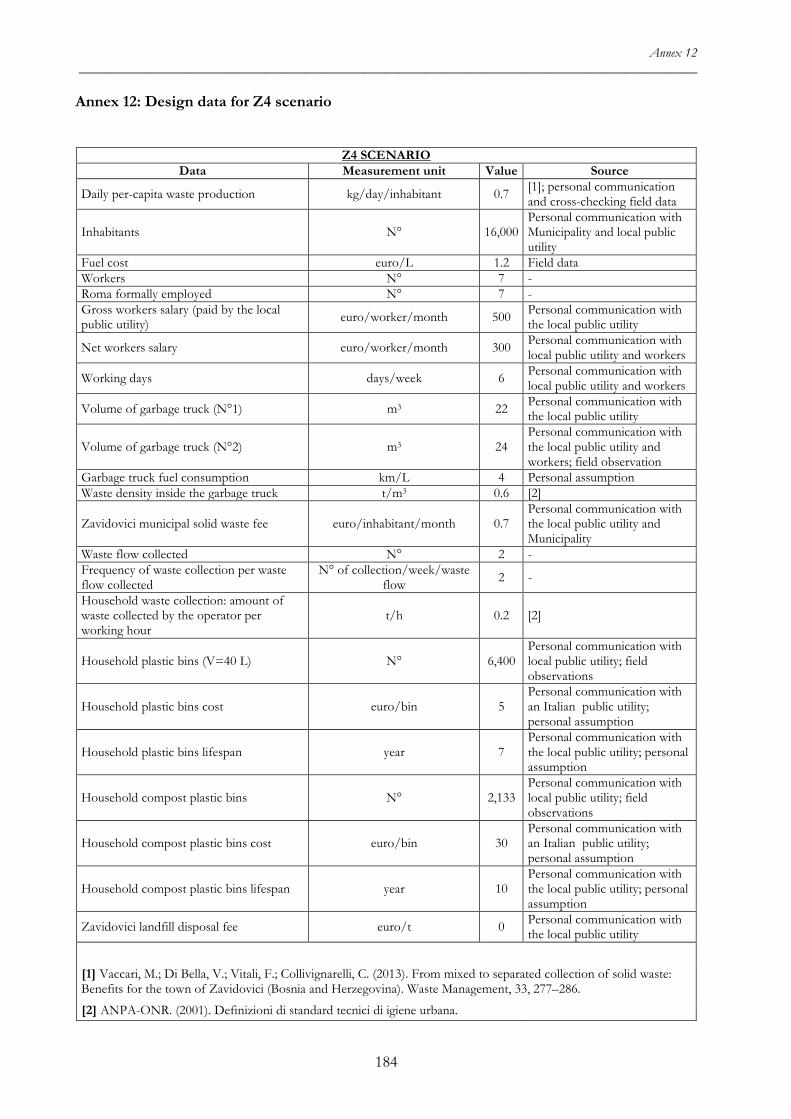
Annex 12 _____________________________________________________________________________________________
Annex 12: Design data for Z4 scenario
Z4 SCENARIO Data Measurement unit Value Source
Daily per-capita waste production kg/day/inhabitant 0.7 [1]; personal communication and cross-checking field data
Inhabitants N° 16,000 Personal communication with Municipality and local public utility
Fuel cost euro/L 1.2 Field data Workers N° 7 - Roma formally employed N° 7 - Gross workers salary (paid by the local public utility) euro/worker/month 500 Personal communication with
the local public utility
Net workers salary euro/worker/month 300 Personal communication with local public utility and workers
Working days days/week 6 Personal communication with local public utility and workers
Volume of garbage truck (N°1) m3 22 Personal communication with the local public utility
Volume of garbage truck (N°2) m3 24 Personal communication with the local public utility and workers; field observation
Garbage truck fuel consumption km/L 4 Personal assumption Waste density inside the garbage truck t/m3 0.6 [2]
Zavidovici municipal solid waste fee euro/inhabitant/month 0.7 Personal communication with the local public utility and Municipality
Waste flow collected N° 2 - Frequency of waste collection per waste flow collected
N° of collection/week/waste flow 2 -
Household waste collection: amount of waste collected by the operator per working hour
t/h 0.2 [2]
Household plastic bins (V=40 L) N° 6,400 Personal communication with local public utility; field observations
Household plastic bins cost euro/bin 5 Personal communication with an Italian public utility; personal assumption
Household plastic bins lifespan year 7 Personal communication with the local public utility; personal assumption
Household compost plastic bins N° 2,133 Personal communication with local public utility; field observations
Household compost plastic bins cost euro/bin 30 Personal communication with an Italian public utility; personal assumption
Household compost plastic bins lifespan year 10 Personal communication with the local public utility; personal assumption
Zavidovici landfill disposal fee euro/t 0 Personal communication with the local public utility
[1] Vaccari, M.; Di Bella, V.; Vitali, F.; Collivignarelli, C. (2013). From mixed to separated collection of solid waste: Benefits for the town of Zavidovici (Bosnia and Herzegovina). Waste Management, 33, 277–286.
[2] ANPA-ONR. (2001). Definizioni di standard tecnici di igiene urbana.
184
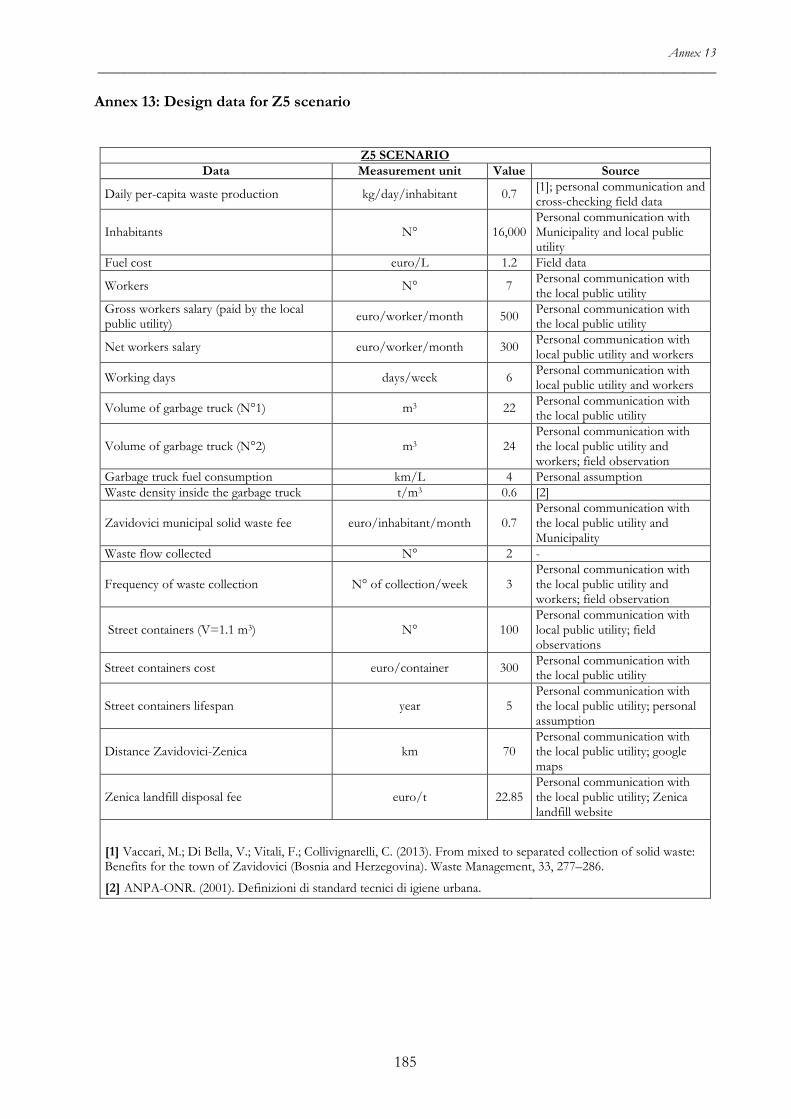
Annex 13 _____________________________________________________________________________________________
Annex 13: Design data for Z5 scenario
Z5 SCENARIO Data Measurement unit Value Source
Daily per-capita waste production kg/day/inhabitant 0.7 [1]; personal communication and cross-checking field data
Inhabitants N° 16,000 Personal communication with Municipality and local public utility
Fuel cost euro/L 1.2 Field data
Workers N° 7 Personal communication with the local public utility
Gross workers salary (paid by the local public utility) euro/worker/month 500 Personal communication with
the local public utility
Net workers salary euro/worker/month 300 Personal communication with local public utility and workers
Working days days/week 6 Personal communication with local public utility and workers
Volume of garbage truck (N°1) m3 22 Personal communication with the local public utility
Volume of garbage truck (N°2) m3 24 Personal communication with the local public utility and workers; field observation
Garbage truck fuel consumption km/L 4 Personal assumption Waste density inside the garbage truck t/m3 0.6 [2]
Zavidovici municipal solid waste fee euro/inhabitant/month 0.7 Personal communication with the local public utility and Municipality
Waste flow collected N° 2 -
Frequency of waste collection N° of collection/week 3 Personal communication with the local public utility and workers; field observation
Street containers (V=1.1 m3) N° 100 Personal communication with local public utility; field observations
Street containers cost euro/container 300 Personal communication with the local public utility
Street containers lifespan year 5 Personal communication with the local public utility; personal assumption
Distance Zavidovici-Zenica km 70 Personal communication with the local public utility; google maps
Zenica landfill disposal fee euro/t 22.85 Personal communication with the local public utility; Zenica landfill website
[1] Vaccari, M.; Di Bella, V.; Vitali, F.; Collivignarelli, C. (2013). From mixed to separated collection of solid waste: Benefits for the town of Zavidovici (Bosnia and Herzegovina). Waste Management, 33, 277–286.
[2] ANPA-ONR. (2001). Definizioni di standard tecnici di igiene urbana.
185
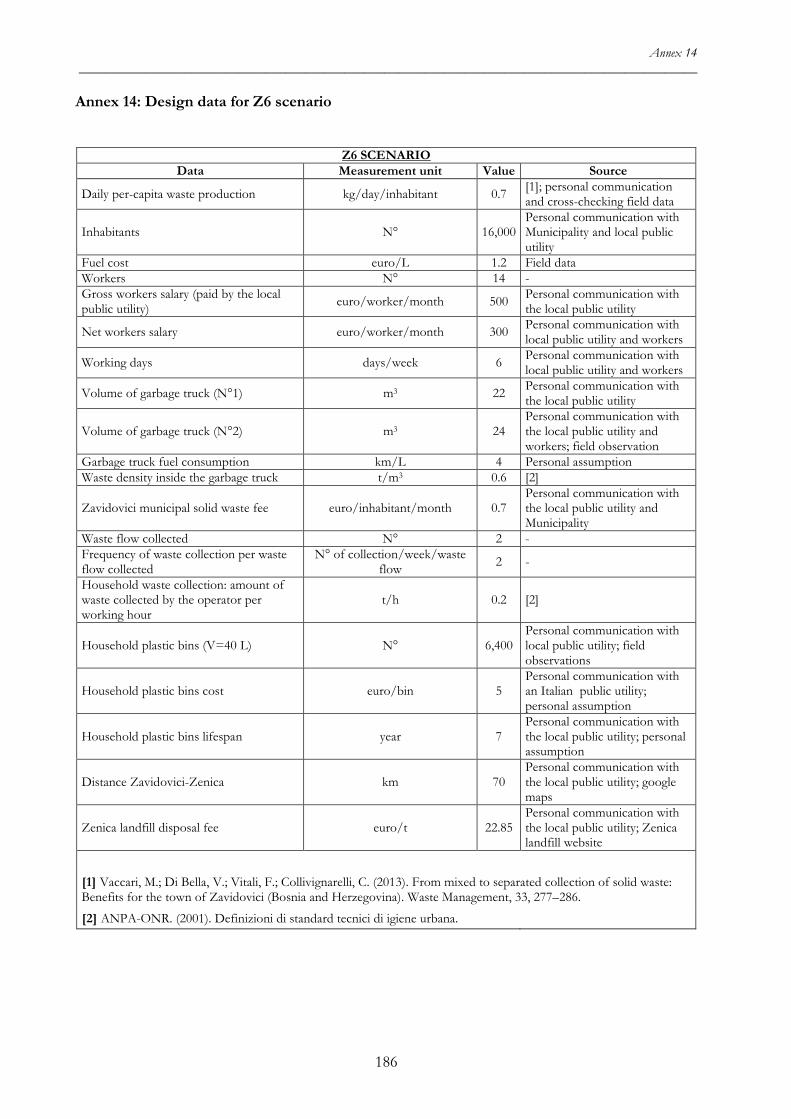
Annex 14 _____________________________________________________________________________________________
Annex 14: Design data for Z6 scenario
Z6 SCENARIO Data Measurement unit Value Source
Daily per-capita waste production kg/day/inhabitant 0.7 [1]; personal communication and cross-checking field data
Inhabitants N° 16,000 Personal communication with Municipality and local public utility
Fuel cost euro/L 1.2 Field data Workers N° 14 - Gross workers salary (paid by the local public utility) euro/worker/month 500 Personal communication with
the local public utility
Net workers salary euro/worker/month 300 Personal communication with local public utility and workers
Working days days/week 6 Personal communication with local public utility and workers
Volume of garbage truck (N°1) m3 22 Personal communication with the local public utility
Volume of garbage truck (N°2) m3 24 Personal communication with the local public utility and workers; field observation
Garbage truck fuel consumption km/L 4 Personal assumption Waste density inside the garbage truck t/m3 0.6 [2]
Zavidovici municipal solid waste fee euro/inhabitant/month 0.7 Personal communication with the local public utility and Municipality
Waste flow collected N° 2 - Frequency of waste collection per waste flow collected
N° of collection/week/waste flow 2 -
Household waste collection: amount of waste collected by the operator per working hour
t/h 0.2 [2]
Household plastic bins (V=40 L) N° 6,400 Personal communication with local public utility; field observations
Household plastic bins cost euro/bin 5 Personal communication with an Italian public utility; personal assumption
Household plastic bins lifespan year 7 Personal communication with the local public utility; personal assumption
Distance Zavidovici-Zenica km 70 Personal communication with the local public utility; google maps
Zenica landfill disposal fee euro/t 22.85 Personal communication with the local public utility; Zenica landfill website
[1] Vaccari, M.; Di Bella, V.; Vitali, F.; Collivignarelli, C. (2013). From mixed to separated collection of solid waste: Benefits for the town of Zavidovici (Bosnia and Herzegovina). Waste Management, 33, 277–286.
[2] ANPA-ONR. (2001). Definizioni di standard tecnici di igiene urbana.
186
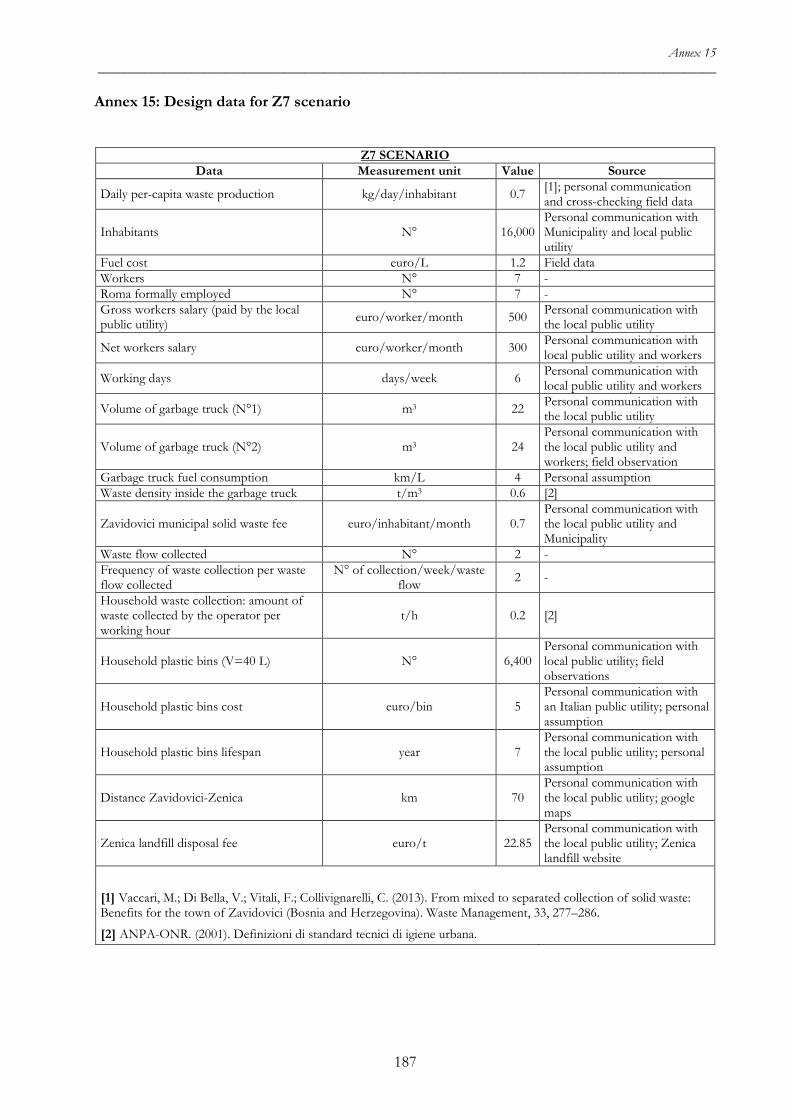
Annex 15 _____________________________________________________________________________________________
Annex 15: Design data for Z7 scenario
Z7 SCENARIO Data Measurement unit Value Source
Daily per-capita waste production kg/day/inhabitant 0.7 [1]; personal communication and cross-checking field data
Inhabitants N° 16,000 Personal communication with Municipality and local public utility
Fuel cost euro/L 1.2 Field data Workers N° 7 - Roma formally employed N° 7 - Gross workers salary (paid by the local public utility) euro/worker/month 500 Personal communication with
the local public utility
Net workers salary euro/worker/month 300 Personal communication with local public utility and workers
Working days days/week 6 Personal communication with local public utility and workers
Volume of garbage truck (N°1) m3 22 Personal communication with the local public utility
Volume of garbage truck (N°2) m3 24 Personal communication with the local public utility and workers; field observation
Garbage truck fuel consumption km/L 4 Personal assumption Waste density inside the garbage truck t/m3 0.6 [2]
Zavidovici municipal solid waste fee euro/inhabitant/month 0.7 Personal communication with the local public utility and Municipality
Waste flow collected N° 2 - Frequency of waste collection per waste flow collected
N° of collection/week/waste flow 2 -
Household waste collection: amount of waste collected by the operator per working hour
t/h 0.2 [2]
Household plastic bins (V=40 L) N° 6,400 Personal communication with local public utility; field observations
Household plastic bins cost euro/bin 5 Personal communication with an Italian public utility; personal assumption
Household plastic bins lifespan year 7 Personal communication with the local public utility; personal assumption
Distance Zavidovici-Zenica km 70 Personal communication with the local public utility; google maps
Zenica landfill disposal fee euro/t 22.85 Personal communication with the local public utility; Zenica landfill website
[1] Vaccari, M.; Di Bella, V.; Vitali, F.; Collivignarelli, C. (2013). From mixed to separated collection of solid waste: Benefits for the town of Zavidovici (Bosnia and Herzegovina). Waste Management, 33, 277–286.
[2] ANPA-ONR. (2001). Definizioni di standard tecnici di igiene urbana.
187
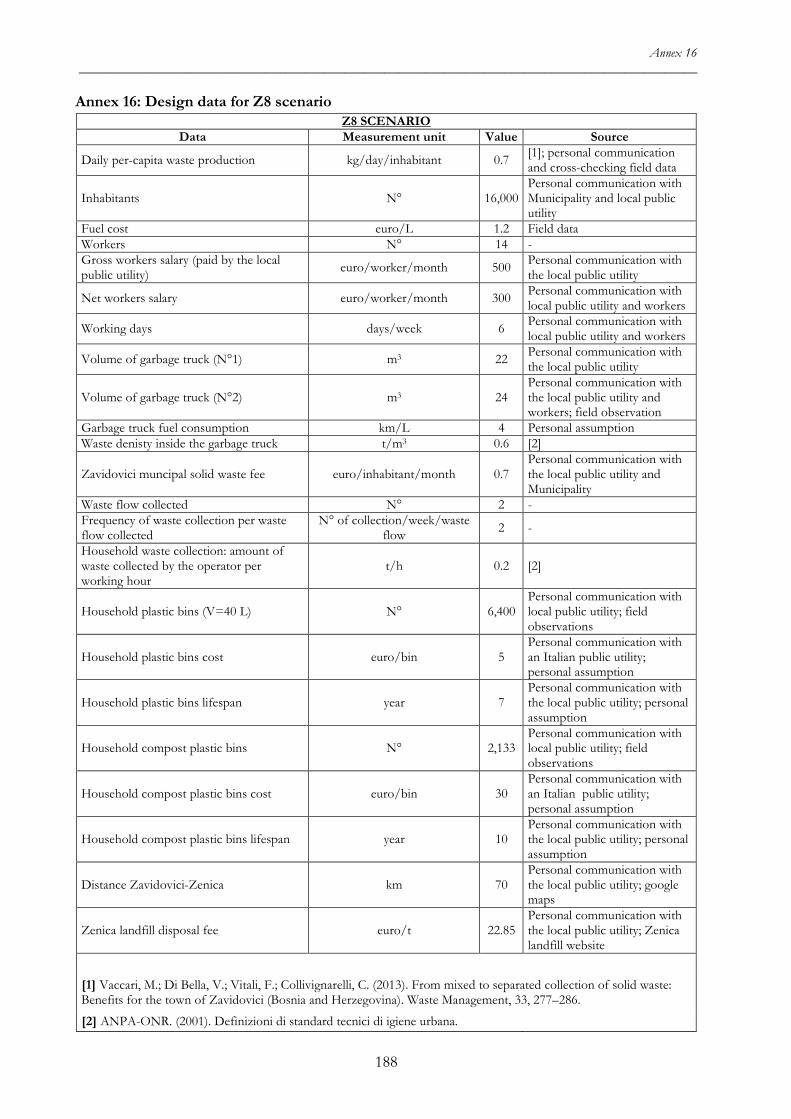
Annex 16 _____________________________________________________________________________________________
Annex 16: Design data for Z8 scenario
Z8 SCENARIO Data Measurement unit Value Source
Daily per-capita waste production kg/day/inhabitant 0.7 [1]; personal communication and cross-checking field data
Inhabitants N° 16,000 Personal communication with Municipality and local public utility
Fuel cost euro/L 1.2 Field data Workers N° 14 - Gross workers salary (paid by the local public utility) euro/worker/month 500 Personal communication with
the local public utility
Net workers salary euro/worker/month 300 Personal communication with local public utility and workers
Working days days/week 6 Personal communication with local public utility and workers
Volume of garbage truck (N°1) m3 22 Personal communication with the local public utility
Volume of garbage truck (N°2) m3 24 Personal communication with the local public utility and workers; field observation
Garbage truck fuel consumption km/L 4 Personal assumption Waste denisty inside the garbage truck t/m3 0.6 [2]
Zavidovici muncipal solid waste fee euro/inhabitant/month 0.7 Personal communication with the local public utility and Municipality
Waste flow collected N° 2 - Frequency of waste collection per waste flow collected
N° of collection/week/waste flow 2 -
Household waste collection: amount of waste collected by the operator per working hour
t/h 0.2 [2]
Household plastic bins (V=40 L) N° 6,400 Personal communication with local public utility; field observations
Household plastic bins cost euro/bin 5 Personal communication with an Italian public utility; personal assumption
Household plastic bins lifespan year 7 Personal communication with the local public utility; personal assumption
Household compost plastic bins N° 2,133 Personal communication with local public utility; field observations
Household compost plastic bins cost euro/bin 30 Personal communication with an Italian public utility; personal assumption
Household compost plastic bins lifespan year 10 Personal communication with the local public utility; personal assumption
Distance Zavidovici-Zenica km 70 Personal communication with the local public utility; google maps
Zenica landfill disposal fee euro/t 22.85 Personal communication with the local public utility; Zenica landfill website
[1] Vaccari, M.; Di Bella, V.; Vitali, F.; Collivignarelli, C. (2013). From mixed to separated collection of solid waste: Benefits for the town of Zavidovici (Bosnia and Herzegovina). Waste Management, 33, 277–286.
[2] ANPA-ONR. (2001). Definizioni di standard tecnici di igiene urbana.
188
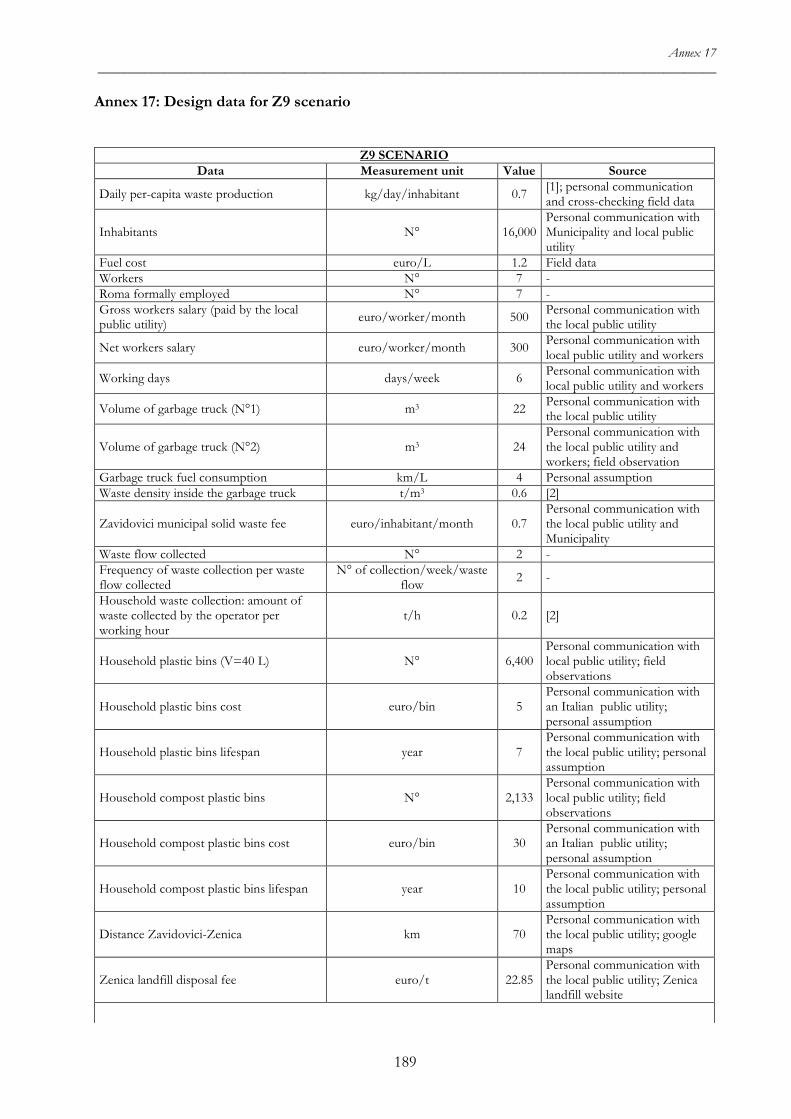
Annex 17 _____________________________________________________________________________________________
Annex 17: Design data for Z9 scenario
Z9 SCENARIO Data Measurement unit Value Source
Daily per-capita waste production kg/day/inhabitant 0.7 [1]; personal communication and cross-checking field data
Inhabitants N° 16,000 Personal communication with Municipality and local public utility
Fuel cost euro/L 1.2 Field data Workers N° 7 - Roma formally employed N° 7 - Gross workers salary (paid by the local public utility) euro/worker/month 500 Personal communication with
the local public utility
Net workers salary euro/worker/month 300 Personal communication with local public utility and workers
Working days days/week 6 Personal communication with local public utility and workers
Volume of garbage truck (N°1) m3 22 Personal communication with the local public utility
Volume of garbage truck (N°2) m3 24 Personal communication with the local public utility and workers; field observation
Garbage truck fuel consumption km/L 4 Personal assumption Waste density inside the garbage truck t/m3 0.6 [2]
Zavidovici municipal solid waste fee euro/inhabitant/month 0.7 Personal communication with the local public utility and Municipality
Waste flow collected N° 2 - Frequency of waste collection per waste flow collected
N° of collection/week/waste flow 2 -
Household waste collection: amount of waste collected by the operator per working hour
t/h 0.2 [2]
Household plastic bins (V=40 L) N° 6,400 Personal communication with local public utility; field observations
Household plastic bins cost euro/bin 5 Personal communication with an Italian public utility; personal assumption
Household plastic bins lifespan year 7 Personal communication with the local public utility; personal assumption
Household compost plastic bins N° 2,133 Personal communication with local public utility; field observations
Household compost plastic bins cost euro/bin 30 Personal communication with an Italian public utility; personal assumption
Household compost plastic bins lifespan year 10 Personal communication with the local public utility; personal assumption
Distance Zavidovici-Zenica km 70 Personal communication with the local public utility; google maps
Zenica landfill disposal fee euro/t 22.85 Personal communication with the local public utility; Zenica landfill website
189
Annex 17 _____________________________________________________________________________________________
[1] Vaccari, M.; Di Bella, V.; Vitali, F.; Collivignarelli, C. (2013). From mixed to separated collection of solid waste: Benefits for the town of Zavidovici (Bosnia and Herzegovina). Waste Management, 33, 277–286.
[2] ANPA-ONR. (2001). Definizioni di standard tecnici di igiene urbana.
190
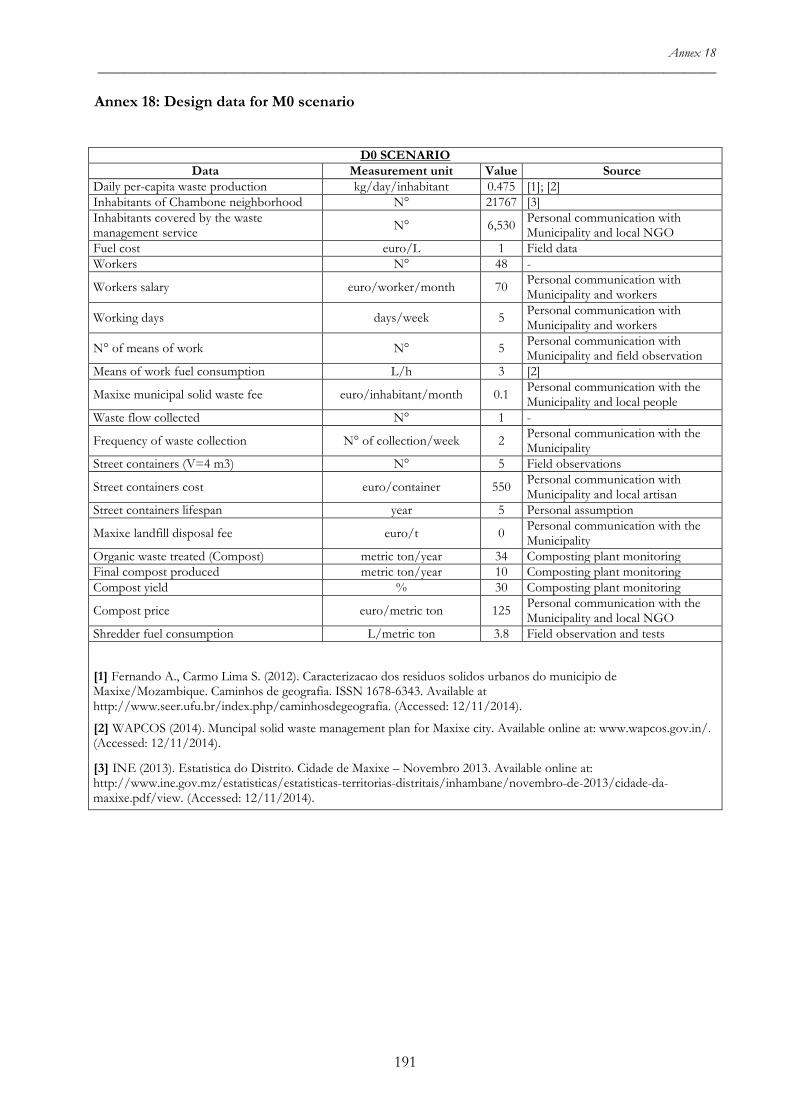
Annex 18 _____________________________________________________________________________________________
Annex 18: Design data for M0 scenario
D0 SCENARIO Data Measurement unit Value Source
Daily per-capita waste production kg/day/inhabitant 0.475 [1]; [2] Inhabitants of Chambone neighborhood N° 21767 [3] Inhabitants covered by the waste management service N° 6,530 Personal communication with
Municipality and local NGO Fuel cost euro/L 1 Field data Workers N° 48 -
Workers salary euro/worker/month 70 Personal communication with Municipality and workers
Working days days/week 5 Personal communication with Municipality and workers
N° of means of work N° 5 Personal communication with Municipality and field observation
Means of work fuel consumption L/h 3 [2]
Maxixe municipal solid waste fee euro/inhabitant/month 0.1 Personal communication with the Municipality and local people
Waste flow collected N° 1 -
Frequency of waste collection N° of collection/week 2 Personal communication with the Municipality
Street containers (V=4 m3) N° 5 Field observations
Street containers cost euro/container 550 Personal communication with Municipality and local artisan
Street containers lifespan year 5 Personal assumption
Maxixe landfill disposal fee euro/t 0 Personal communication with the Municipality
Organic waste treated (Compost) metric ton/year 34 Composting plant monitoring Final compost produced metric ton/year 10 Composting plant monitoring Compost yield % 30 Composting plant monitoring
Compost price euro/metric ton 125 Personal communication with the Municipality and local NGO
Shredder fuel consumption L/metric ton 3.8 Field observation and tests
[1] Fernando A., Carmo Lima S. (2012). Caracterizacao dos residuos solidos urbanos do municipio de Maxixe/Mozambique. Caminhos de geografia. ISSN 1678-6343. Available at http://www.seer.ufu.br/index.php/caminhosdegeografia. (Accessed: 12/11/2014).
[2] WAPCOS (2014). Muncipal solid waste management plan for Maxixe city. Available online at: www.wapcos.gov.in/. (Accessed: 12/11/2014).
[3] INE (2013). Estatistica do Distrito. Cidade de Maxixe – Novembro 2013. Available online at: http://www.ine.gov.mz/estatisticas/estatisticas-territorias-distritais/inhambane/novembro-de-2013/cidade-da-maxixe.pdf/view. (Accessed: 12/11/2014).
191
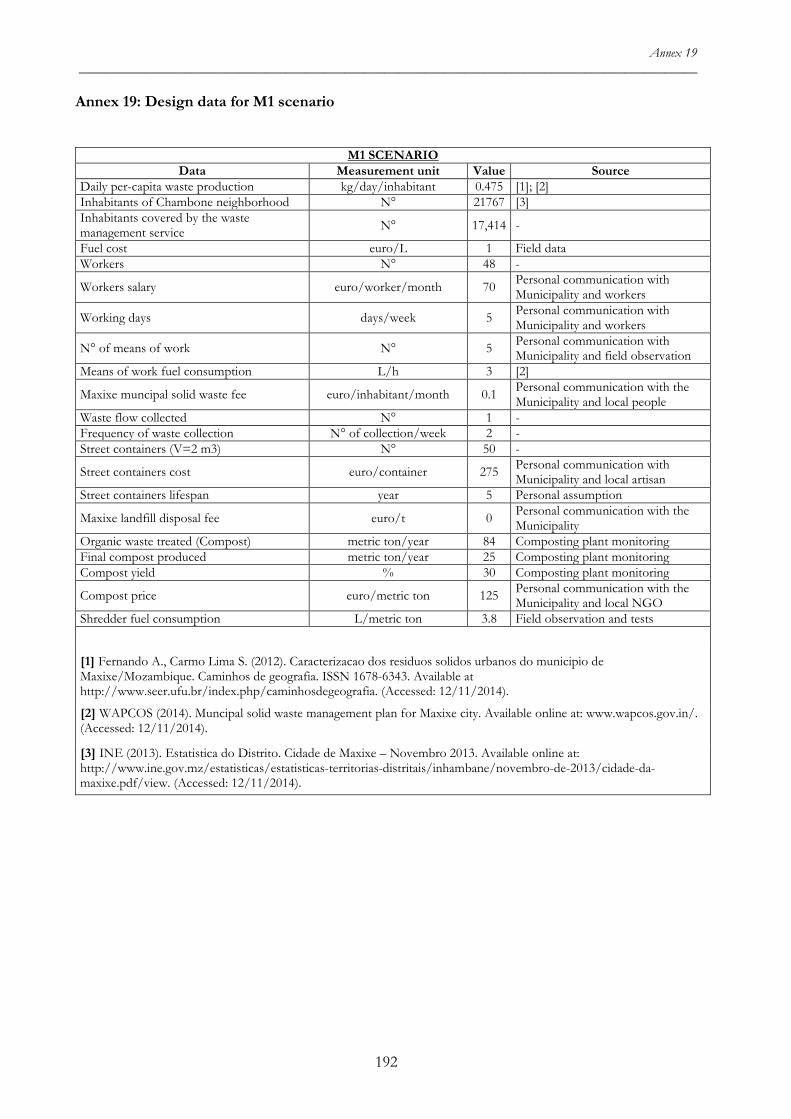
Annex 19 _____________________________________________________________________________________________
Annex 19: Design data for M1 scenario
M1 SCENARIO Data Measurement unit Value Source
Daily per-capita waste production kg/day/inhabitant 0.475 [1]; [2] Inhabitants of Chambone neighborhood N° 21767 [3] Inhabitants covered by the waste management service N° 17,414 -
Fuel cost euro/L 1 Field data Workers N° 48 -
Workers salary euro/worker/month 70 Personal communication with Municipality and workers
Working days days/week 5 Personal communication with Municipality and workers
N° of means of work N° 5 Personal communication with Municipality and field observation
Means of work fuel consumption L/h 3 [2]
Maxixe muncipal solid waste fee euro/inhabitant/month 0.1 Personal communication with the Municipality and local people
Waste flow collected N° 1 - Frequency of waste collection N° of collection/week 2 - Street containers (V=2 m3) N° 50 -
Street containers cost euro/container 275 Personal communication with Municipality and local artisan
Street containers lifespan year 5 Personal assumption
Maxixe landfill disposal fee euro/t 0 Personal communication with the Municipality
Organic waste treated (Compost) metric ton/year 84 Composting plant monitoring Final compost produced metric ton/year 25 Composting plant monitoring Compost yield % 30 Composting plant monitoring
Compost price euro/metric ton 125 Personal communication with the Municipality and local NGO
Shredder fuel consumption L/metric ton 3.8 Field observation and tests
[1] Fernando A., Carmo Lima S. (2012). Caracterizacao dos residuos solidos urbanos do municipio de Maxixe/Mozambique. Caminhos de geografia. ISSN 1678-6343. Available at http://www.seer.ufu.br/index.php/caminhosdegeografia. (Accessed: 12/11/2014).
[2] WAPCOS (2014). Muncipal solid waste management plan for Maxixe city. Available online at: www.wapcos.gov.in/. (Accessed: 12/11/2014).
[3] INE (2013). Estatistica do Distrito. Cidade de Maxixe – Novembro 2013. Available online at: http://www.ine.gov.mz/estatisticas/estatisticas-territorias-distritais/inhambane/novembro-de-2013/cidade-da-maxixe.pdf/view. (Accessed: 12/11/2014).
192
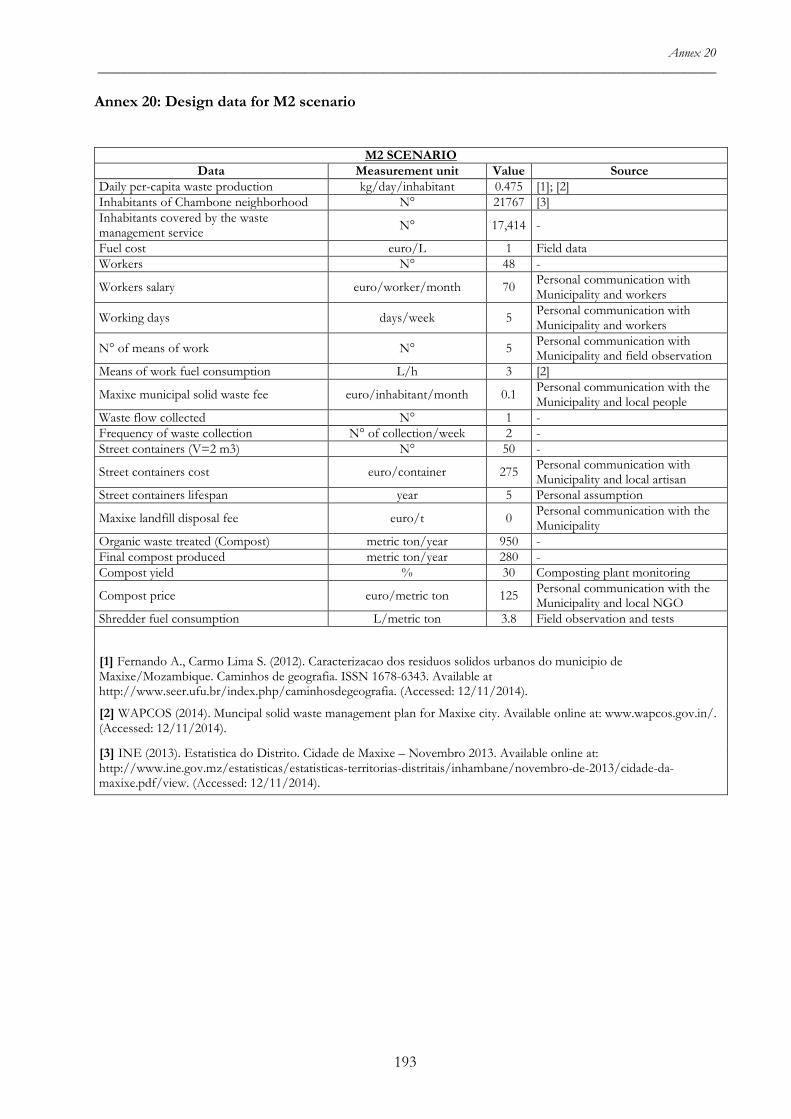
Annex 20 _____________________________________________________________________________________________
Annex 20: Design data for M2 scenario
M2 SCENARIO Data Measurement unit Value Source
Daily per-capita waste production kg/day/inhabitant 0.475 [1]; [2] Inhabitants of Chambone neighborhood N° 21767 [3] Inhabitants covered by the waste management service N° 17,414 -
Fuel cost euro/L 1 Field data Workers N° 48 -
Workers salary euro/worker/month 70 Personal communication with Municipality and workers
Working days days/week 5 Personal communication with Municipality and workers
N° of means of work N° 5 Personal communication with Municipality and field observation
Means of work fuel consumption L/h 3 [2]
Maxixe municipal solid waste fee euro/inhabitant/month 0.1 Personal communication with the Municipality and local people
Waste flow collected N° 1 - Frequency of waste collection N° of collection/week 2 - Street containers (V=2 m3) N° 50 -
Street containers cost euro/container 275 Personal communication with Municipality and local artisan
Street containers lifespan year 5 Personal assumption
Maxixe landfill disposal fee euro/t 0 Personal communication with the Municipality
Organic waste treated (Compost) metric ton/year 950 - Final compost produced metric ton/year 280 - Compost yield % 30 Composting plant monitoring
Compost price euro/metric ton 125 Personal communication with the Municipality and local NGO
Shredder fuel consumption L/metric ton 3.8 Field observation and tests
[1] Fernando A., Carmo Lima S. (2012). Caracterizacao dos residuos solidos urbanos do municipio de Maxixe/Mozambique. Caminhos de geografia. ISSN 1678-6343. Available at http://www.seer.ufu.br/index.php/caminhosdegeografia. (Accessed: 12/11/2014).
[2] WAPCOS (2014). Muncipal solid waste management plan for Maxixe city. Available online at: www.wapcos.gov.in/. (Accessed: 12/11/2014).
[3] INE (2013). Estatistica do Distrito. Cidade de Maxixe – Novembro 2013. Available online at: http://www.ine.gov.mz/estatisticas/estatisticas-territorias-distritais/inhambane/novembro-de-2013/cidade-da-maxixe.pdf/view. (Accessed: 12/11/2014).
193
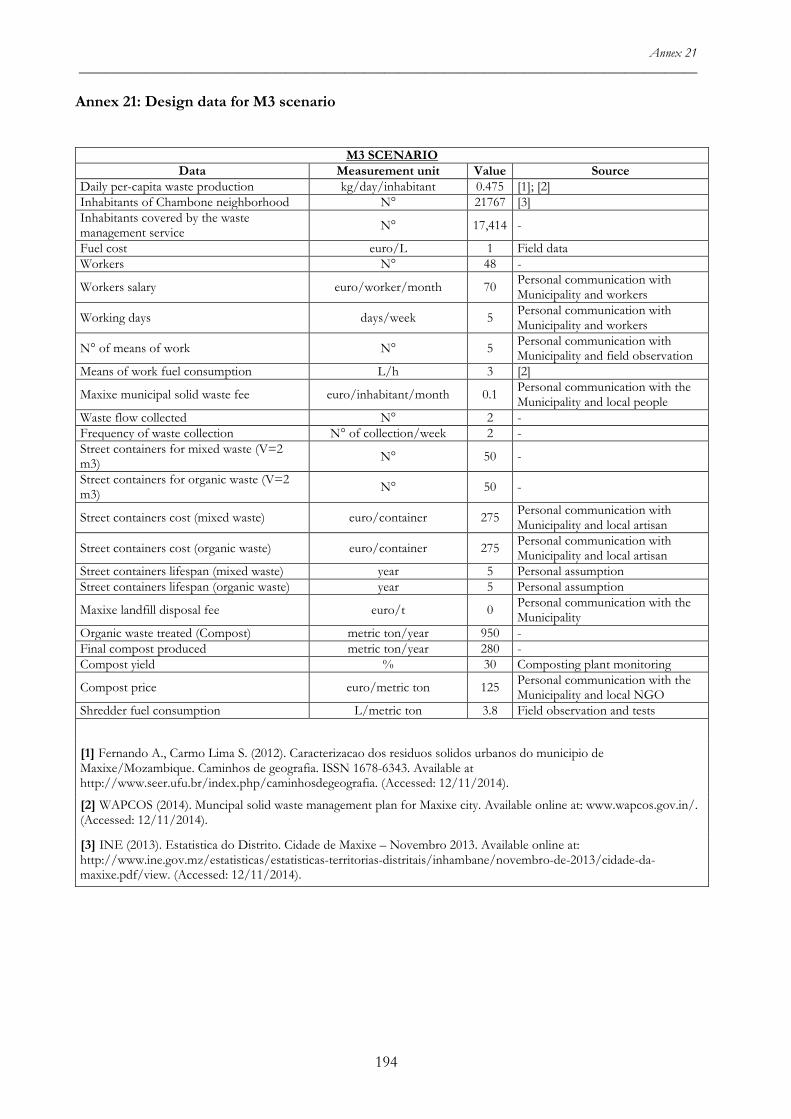
Annex 21 _____________________________________________________________________________________________
Annex 21: Design data for M3 scenario
M3 SCENARIO Data Measurement unit Value Source
Daily per-capita waste production kg/day/inhabitant 0.475 [1]; [2] Inhabitants of Chambone neighborhood N° 21767 [3] Inhabitants covered by the waste management service N° 17,414 -
Fuel cost euro/L 1 Field data Workers N° 48 -
Workers salary euro/worker/month 70 Personal communication with Municipality and workers
Working days days/week 5 Personal communication with Municipality and workers
N° of means of work N° 5 Personal communication with Municipality and field observation
Means of work fuel consumption L/h 3 [2]
Maxixe municipal solid waste fee euro/inhabitant/month 0.1 Personal communication with the Municipality and local people
Waste flow collected N° 2 - Frequency of waste collection N° of collection/week 2 - Street containers for mixed waste (V=2 m3) N° 50 -
Street containers for organic waste (V=2 m3) N° 50 -
Street containers cost (mixed waste) euro/container 275 Personal communication with Municipality and local artisan
Street containers cost (organic waste) euro/container 275 Personal communication with Municipality and local artisan
Street containers lifespan (mixed waste) year 5 Personal assumption Street containers lifespan (organic waste) year 5 Personal assumption
Maxixe landfill disposal fee euro/t 0 Personal communication with the Municipality
Organic waste treated (Compost) metric ton/year 950 - Final compost produced metric ton/year 280 - Compost yield % 30 Composting plant monitoring
Compost price euro/metric ton 125 Personal communication with the Municipality and local NGO
Shredder fuel consumption L/metric ton 3.8 Field observation and tests [1] Fernando A., Carmo Lima S. (2012). Caracterizacao dos residuos solidos urbanos do municipio de Maxixe/Mozambique. Caminhos de geografia. ISSN 1678-6343. Available at http://www.seer.ufu.br/index.php/caminhosdegeografia. (Accessed: 12/11/2014).
[2] WAPCOS (2014). Muncipal solid waste management plan for Maxixe city. Available online at: www.wapcos.gov.in/. (Accessed: 12/11/2014).
[3] INE (2013). Estatistica do Distrito. Cidade de Maxixe – Novembro 2013. Available online at: http://www.ine.gov.mz/estatisticas/estatisticas-territorias-distritais/inhambane/novembro-de-2013/cidade-da-maxixe.pdf/view. (Accessed: 12/11/2014).
194
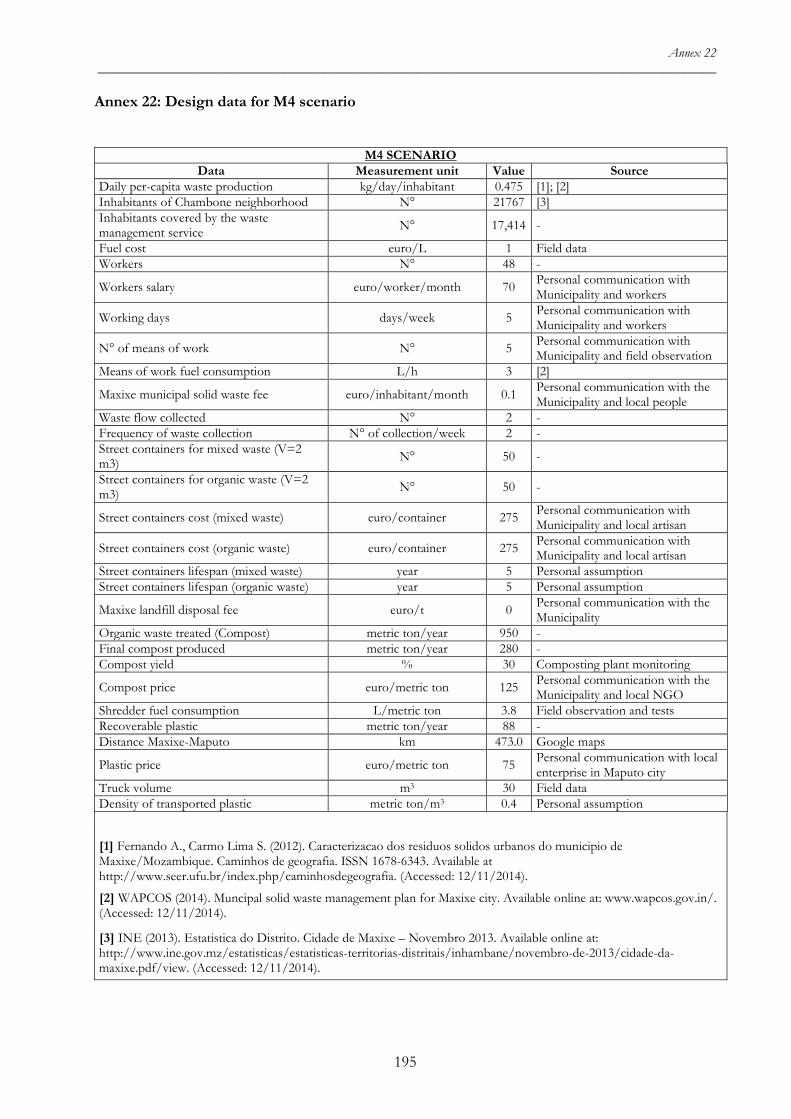
Annex 22 _____________________________________________________________________________________________
Annex 22: Design data for M4 scenario
M4 SCENARIO Data Measurement unit Value Source
Daily per-capita waste production kg/day/inhabitant 0.475 [1]; [2] Inhabitants of Chambone neighborhood N° 21767 [3] Inhabitants covered by the waste management service N° 17,414 -
Fuel cost euro/L 1 Field data Workers N° 48 -
Workers salary euro/worker/month 70 Personal communication with Municipality and workers
Working days days/week 5 Personal communication with Municipality and workers
N° of means of work N° 5 Personal communication with Municipality and field observation
Means of work fuel consumption L/h 3 [2]
Maxixe municipal solid waste fee euro/inhabitant/month 0.1 Personal communication with the Municipality and local people
Waste flow collected N° 2 - Frequency of waste collection N° of collection/week 2 - Street containers for mixed waste (V=2 m3) N° 50 -
Street containers for organic waste (V=2 m3) N° 50 -
Street containers cost (mixed waste) euro/container 275 Personal communication with Municipality and local artisan
Street containers cost (organic waste) euro/container 275 Personal communication with Municipality and local artisan
Street containers lifespan (mixed waste) year 5 Personal assumption Street containers lifespan (organic waste) year 5 Personal assumption
Maxixe landfill disposal fee euro/t 0 Personal communication with the Municipality
Organic waste treated (Compost) metric ton/year 950 - Final compost produced metric ton/year 280 - Compost yield % 30 Composting plant monitoring
Compost price euro/metric ton 125 Personal communication with the Municipality and local NGO
Shredder fuel consumption L/metric ton 3.8 Field observation and tests Recoverable plastic metric ton/year 88 - Distance Maxixe-Maputo km 473.0 Google maps
Plastic price euro/metric ton 75 Personal communication with local enterprise in Maputo city
Truck volume m3 30 Field data Density of transported plastic metric ton/m3 0.4 Personal assumption
[1] Fernando A., Carmo Lima S. (2012). Caracterizacao dos residuos solidos urbanos do municipio de Maxixe/Mozambique. Caminhos de geografia. ISSN 1678-6343. Available at http://www.seer.ufu.br/index.php/caminhosdegeografia. (Accessed: 12/11/2014).
[2] WAPCOS (2014). Muncipal solid waste management plan for Maxixe city. Available online at: www.wapcos.gov.in/. (Accessed: 12/11/2014).
[3] INE (2013). Estatistica do Distrito. Cidade de Maxixe – Novembro 2013. Available online at: http://www.ine.gov.mz/estatisticas/estatisticas-territorias-distritais/inhambane/novembro-de-2013/cidade-da-maxixe.pdf/view. (Accessed: 12/11/2014).
195
