an indicator of well-being for italian agriculture
TRANSCRIPT

Italian Review of Agricultural Economics Vol. 76, n. 2: 57-72, 2021
Firenze University Press www.fupress.com/rea
ISSN 0035-6190 (print) | ISSN 2281-1559 (online) | DOI: 10.36253/rea-13097
REA ITALIAN REVIEW OF AGRICULTURAL ECONOMICS
ITALIAN REVIEW OF AGRICULTURAL ECONOMICS
Citation: Mafalda Monda, Giuliano Gabrieli, Matteo Mazziotta (2021) An indi-cator of well-being for Italian agricul-ture. Italian Review of Agricultural Economics 76(2): 57-72. DOI: 10.36253/rea-13097
Received: October 11, 2020
Revised: May 12, 2021
Accepted: June 7, 2021
Copyright: © 2021 Mafalda Monda, Giuliano Gabrieli, Matteo Mazziotta. This is an open access, peer-reviewed article published by Firenze Univer-sity Press (http://www.fupress.com/rea) and distributed under the terms of the Creative Commons Attribution License, which permits unrestricted use, distri-bution, and reproduction in any medi-um, provided the original author and source are credited.
Data Availability Statement: All rel-evant data are within the paper and its Supporting Information files.
Competing Interests: The Author(s) declare(s) no conflict of interest.
An indicator of well-being for Italian agriculture
Mafalda Monda1, Giuliano Gabrieli2, Matteo Mazziotta3
1 DG Joint Research Centre, European Commission - Bruxelles2 CREA - Research Centre for Agricultural Policies and Bioeconomy - Italy3 ISTAT - Italy
Abstract. The paper presents a composite indicator of well-being for Italian agricul-ture.Well-being is defined as the health condition of the agricultural sector from the point of view of farmers. The indicator is based on four dimensions: social, environ-mental, institutional and economic, allowing comparability of well-being at regional level. The novelty of the approach consists in presenting a well-being indicator at sec-torial level, by applying a new method of aggregation, the Adjusted Mazziotta-Pareto index (2016). It is a non-compensatory approach for summarizing a set of individual indicators which accounts for unbalanced distribution among the indicators. Results show that central and northern regions are in the top ten for the regional agricultural well-being in years 2013 and 2016.
Keywords: well-being, farmers, agriculture, sustainability, composite index.JEL codes: Q01, R11, Q18.
1. INTRODUCTION
The role of statistical indicators as tools that allow the evaluation and orientation of public policies has changed over time, thanks to data avail-ability and the development of new methods enabling synthesizing complex and multidimensional phenomena. The constructing of composite indica-tors comes under the discussion, carried out in the international arena, that the country development cannot be measured by considering only eco-nomic aspects.
Indeed, the gross domestic product (GDP) is not a suitable indicator for complex concepts such as well-being and sustainability. For this reason, in the last years, composite indicators have been constructed to evaluate coun-try’s well-being, in broader terms, taking into consideration social and envi-ronmental aspects (e.g.: the Waterloo University’s Canadian Index of Well-being, the Measures of Australia’s Progress, the Buthan Gross National Hap-piness Index, the Economist Intelligence Unit’s Quality of life).
In 1990, the UN’s human development index was built by considering three individual indicators such as the per capita income, the life expectancy and the level of education. The human development index has included other

58 Mafalda Monda, Giuliano Gabrieli, Matteo Mazziotta
aspects such as the environmental sustainability which is considered of fundamental importance in order to meas-ure country life conditions.
The objective of this paper is to build a compos-ite indicator of well-being for Italian agriculture. The indicator wants to describe the health condition of the agricultural sector from the point of view of farmersat regional level. It is constructed on 4 dimensions (social, environmental, institutional and economic), taking into account subjective aspects of well-being (e.g.: perception of environmental conditions) as well as dimensions not overlooked before (e.g. institutional aspects). The indica-tor allows us to measure the well-being of an economic sector in a new perspective that is complementary to that one derived from the human well-being indicator at country level.
2. AN OVERVIEW OF THE ECONOMIC LITERATURE ON COMPOSITE INDICATORS OF WELL-BEING AND
SUSTAINABILITY
In June 2007 the European commission, the OECD, the organization of Islamic conference, the United Nations for development (UNDP) and the World Bank adopted the Istanbul declaration that stated the need to measure social development in every country of the world, going beyond the conventional measures such as the gross domestic product per capita (GDP).
In line with this, the Stiglitz-Sen-Fitoussi Commis-sion proposed to shift the focus from the measurement of economic production to people’s well-being by con-sidering aspects linked to environmental, economic and social sustainability.
In 2010, following the inclusion of the Stiglitz-Sen-Fitoussi Commission’s recommendations in the memo-randum of Sofia, the measurement of well-being entered the official statistics.
2.1. Indicators of “Sustainability”
A number of sustainability indicators have been developed in the last years, on the basis of the United Nations Brundtland Commission’s definition of sustain-ability. It states: “meeting the needs of the present with-out compromising the ability of future generations to meet their own needs.” (WCED, 1987).
However, the definition of sustainability varies con-siderably when applied to the agricultural sector (Binder et al., 2010). This is due to the existence of alternative agriculture such as organic, regenerative and ecological (Lockeretz, 1988) and to the variability of agricultural
aspects in different regional and country contexts (Zhen, Routray, 2003).
Agricultural production impacts on the environ-ment and the quality of life in rural areas with social and economic implications. For this, most definitions of agricultural sustainability take into consideration three pillars of sustainability and according with them group sustainability indicators in three dimensions: social, eco-nomic and environmental (Lebacq et al., 2013).
Specifically, economic indicators of sustainabil-ity focus on yields, input expenditures, income derived by on-farm and off-farm activities and land ownership (Becker, 1997; Herzog, Gotsch, 1998; Karami, 1995; Nambiar et al., 2001; Rasul, Tapa, 2004; Nijkamp, Vreek-er, 2000; Van Cauwenbergh et al., 2007). Furthermore, economic sustainability indicators also examine changes in yields and total factor productivity (Lynam, Herdt, 1989). Other sustainability indicators consider salaries paid to farm workers and employment opportunities (Herzog, Gotsch, 1998; Rasul, Tapa, 2004) as part of the economic dimension.
Environmental indicators of sustainability are linked with physical and chemical input use (pesticides, herbicides, fungicides), efficiency in the use of inputs, soil erosion and energy use (Hayati, 1995; Ingels et al., 1997; Nambiar et al., 2001; Comer et al., 1999; Van Cau-wenbergh et al., 2007). In this context, the sustainable management of land and water resources is one of the major requirement for a sustainable agriculture (Hayati et al., 2010).
Sustainability indicators also include the social dimension by considering aspects such as: the educa-tion level of the household members (Herzog, Gotsch, 1998; Van Cauwenbergh et al., 2007), the nutritional status of the farmers’ family members (Herzog, Gotsch, 1998; Rasul, Tapa, 2004; Van Cauwenbergh et al., 2007) and social equity (Becker, 1997; Rigby et al., 2001; Rasul, Tapa, 2004).
While the majority of existing research considers the sustainability indicators separately, few studies have proposed to synthetize them in one composite indicator (Valko, 2016) thus facilitating country and region com-parability.
2.2. Composite indicators of “well-being”
There are various approaches to the measurement of well-being which are based on various methods to com-bine individual indicators. Several authors have explored challenges in constructing an indicator of well-being identifying, among the major difficulties, the reliability and availability of data; the methodology to be applied

59An indicator of well-being for Italian agriculture
which can vary depending on the objectives and data; the selection of relevant indicators which may cover sub-jective and objective aspects of well-being. Among them we can find the index of sustainable economic welfare (ISEW), the Genuine Savings (Hamilton, 1994 and 1996) and the measure of economic welfare (MEW).
The ISEW, introduced by Daly and Cobb (1989), has been conceived as a substitute measure for the GDP inte-grating the traditional measures of macroeconomic per-formance with social and environmental aspects, taking into account inequalities in the income distribution.
In 1995, the ISEW was reviewed and renamed the Genuine progress indicator (GPI) (Talberth et al., 2007) with the objective to measure the country’s progress tak-ing into account environmental degradation, pollution, depletion of resources and other costs. However, the dif-ficulties to quantify these costs and the subjectivity of selecting the indicators that form the basis of the index are among the main limits of both ISEW and GPI.
The measure of economic welfare (MEW), proposed by Nordhaus and Tobin (1972) wants to measure welfare by calculating the consumptions of goods and services while subtracting some costs such as pollution.
The criticism raised around the capacity of these indicators to ref lect economic welfare and sustain-ability (Giannetti et al., 2015) led to the application of non-monetary approaches to measure country pro-gress. Some examples are: the physical quality life index (PQLI), the Gross national Happiness (GNH) and the Happy Planet Index (HPI).
The PQLI is based on the assumption that nations could have a poor life quality despite high income per capita. For this, it considers measures such as infant mortality, life expectancy and basic literacy, excluding income or other measures of economic well-being.
In line with it, the GNH, firstly suggested by the king of Buthan in 1980, measures the general peo-ple well-being or happiness on the basis of indicators belonging to four pillars: the conservation of natural environment, the promotion of cultural values and sus-tainable development and proper governance. In par-ticular, used indicators are: time use, living standards, good governance, community vitality, health, education.
Finally, in 2006 the New Economic Foundation launched the HPI based on three dimensions: life expec-tancy at birth, life satisfaction and ecological footprint.
In Italy, the Indicator of equitable and sustainable well-being (BES) was introduced in 2010, with the ambi-tious objective of measuring the human well-being by considering important aspects related to people’s lives, together with the equity in the distribution of well-being among people and the sustainability among generations
(Bacchini, Baldazzi, Morrone, Savioli, Sorvillo, Tinto, 2016).
Indicators of equitable and sustainable well-being currently cover 12 dimensions, taking into consideration subjective and objective aspects. Subjective indicators allow the capture of perceptions of individuals. Objec-tive indicators synthesize aspects related to the repre-sentativeness of political Institutions, territorial condi-tions and human health.
3. ISSUES IN BUILDING COMPOSITE INDICATORS
There are some issues in composite indicators to be taken into account for their construction. Firstly, com-posite indicators allow the aggregation of a large amount of information. This could make them incapable to reflect complexities of phenomena they want to measure.
Furthermore, composite indicators may suffer from methodological difficulties due to the number of decisions to be taken for their construction (Freudenberg 2003). Each step needed for building composite indicatorshas a number of issues, the most controversial of which concern the selection of indicators and their aggregation.
Regarding the indicators’ selection, there is no a universally agreed set of indicators for any given phe-nomenon. Variables to incorporate in composite indica-tors are, generally, subjective. Furthermore, indicators should be carefully chosen on the basis of their sound-ness, measurability, and relevance to the phenomenon being measured (Saltelli, 2007). However, relevant data maybe not available or not comparable across domains, countries or areas.
Regarding the aggregation of indicators, it is pos-sible to distinguish two approaches: compensatory and non-compensatory. The compensatory approach consid-ers individual indicators as substitutable thus a deficit in one dimension can be compensated by a surplus in another one.
This approach involves the use of linear functions such as the arithmetic mean. The non-compensatory approach is based on the assumption of non-substituta-bility of indicators that implies all the dimensions of the phenomenon must be balanced. In this case, unbalance-adjusted functions are generally applied to take into accountunbalances in terms of penalization.
4. THE THEORETICAL FRAMEWORK
The objective of this paper is to develop a composite indicator of well-being for the agricultural sector in Ita-

60 Mafalda Monda, Giuliano Gabrieli, Matteo Mazziotta
ly. The following paragraphs clarify the concept of agri-cultural well-being adopted for the construction of this indicator, the indicators selected for this purpose and, finally, the method applied for their aggregation.
4.1. The definition of agricultural well-being
The definition of agricultural well-being adopted in this work is based on the explored literature on compos-ite indicators of well-being and sustainability. It refers to the health condition of the Italian agricultural sector measured as its capacity to survive crisis by diversifying farm income, intensifying trade, producing good qual-ity products, using good quality inputs (water resources, soil etc.), regularly employing young people and well educated farmers. Furthermore, well-being in agricul-ture increases thanks to the availability of infrastructur-al services, enabling developing economic activities, the research that supports the agricultural activity’s progress and the efficiency of public services which has positive effects on farm competitiveness.
4.2. The selection of indicators
In order to put into practice the above mentioned definition of agricultural well-being, objective aspects (economy, environmental conditions…) as well as sub-jective aspects of well-being (e.g.: positive judgement of future perspectives) have been taken into account. This led to a selection of 48 indicators1 covering the following four dimensions: economic, social, environmental and institutional.
The economic dimension of well-being takes into account farm performances (e.g. value added) and factor productivity (e.g. capital productivity…) as well as other elements related to the farming activities, for example, the number of farms with quality products (e.g. DOP.). Factors linked to the regional context have been also tak-en into account in this dimension such as: the regional openness to international trade and the firm birth rate.
The environmental dimension includes indicators that focus on physical conditions of the environment (e.g.: regional areas under organic farming, extension of protected natural areas…), as well as the intensity of phytosanitary products’ and fertilizers’ uses. Subjective aspects are included in this dimension for example: citi-zens’ concerns about landscape deterioration and biodi-versity loss, and the level of satisfaction for the environ-mental conditions.
1 See Appendix.
The social dimension of agricultural well-being is composed of indicators that are able to capture ele-ments of the social structure where farmers operate such as: the rate of irregular employment in agriculture, the percentage of women agricultural workers, the number of farmers aged less than 44 and those who operate in disadvantaged rural areas. Subjective elements have also been considered such as: the level of generalized trust in people and the level of people’s involvement in social activities (meetings with cultural and ecological associa-tions…).
Finally, the institutional dimension is based on indi-cators taking into account the level of public support to farmers, the farmers’ access to credit, as well as the amount of public expenditures in infrastructural ser-vices, agricultural research and technical assistance. Ele-ments concerning the regional context are also included in this dimension such as: the level of accessibility to regional services and irregularities in electric power dis-tribution. Individual indicators also capture subjective factors for example: the level of trust in Institutions and the political and civic participation.
The choice of indicators included in the composite index was limited by the data available in years 2013 and 2016 at regional level. Indeed, data used mainly derived from the database of the Italian National Institute of Statistics (ISTAT). It provides information on the Ital-ian agricultural sector coming from official data (e.g.: national account data) and specific surveys (e.g. labor force survey; survey on aspects of daily life). Other data sources were also used (e.g.: farm accounting data net-work…).
4.3. The method
The method applied for building the composite indicator of well-being for the Italian agriculture is the Adjusted Mazziotta-Pareto (AMPI)2. It is a non-compen-satory approach that is an extension of the Mazziotta-Pareto Index (MPI+/-).
The Mazziotta-Pareto Index (MPI) is based on a standardization of the individual indicators, at the ref-erence time, that makes the indicators independent of the variability3 allowing only relative comparisons over
2 We used the software COMIC for the calculation of the compos-ite indicator of agricultural well-being. COMIC was developed by the working group on the composite indicator of equitable and sustain-able well-being within the Italian Institute of statistics. Its application requires the basic version of SAS System (ver. 9.1). The software allows the construction, analysis and validation of composite indicators. 3 The normalized indicators have a mean of 100 and a standard devia-tion of 10.

61An indicator of well-being for Italian agriculture
time. The Adjusted Mazziotta-Pareto (AMPI) performs absolute comparison over time by re-scaling individual indicators in the range (70; 130) according to two goal posts, i.e., a minimum and a maximum value which rep-resent the possible range of each indicator for all time periods and for all units (Mazziotta, 2016).
Given the matrix X={xij} with n rows (units) and m columns (indicators), we calculate the matrix R of nor-malized scores rij as follow:
where xij is the value of the indicator j for the unit i and Minxj
and Maxxj are the “goalposts” for the indica-
tor j. Denoting with Infxj and Supxj
the overall minimum and maximum of the indicator j across all units and all years and with Refxj
the reference value for the indicator j, the “goalposts” are defined as:
where: ∆=(Supxj-Infxj
)/2
Values will fall approximately in the range (70; 130) while 100 represents the reference value (the Italian aver-age in a given year). Denoting with , and respectively, the mean, the standard deviation and the coefficient of variation for the normalized values for the unit i, the generalized form of the Adjusted MPI is given by:
Where:
The sign of the indicator depends on the nature of the phenomenon. The negative sign is applied if the composite indicator is positively related to the construct of well-being while the positive sign is used when the indicator is negatively related to the well-being (Mazzi-otta, Pareto, 2016).
The composite indicator is the arithmetic average to which a penalty is applied with the objective to penalize statistical units that show unbalanced distribution of val-ues in each dimension and over time. Two components
explain together the indicator’s results: the first one cap-tures the average effect (additive component); the second one is the penalty effect (due to unbalance). The penalty coefficient takes into account the horizontal variability of each indicator j per unit i by applying a penalty to units that show more unbalanced values than others.
4.4. Limitations of the method
A composite indicator is a measure, generally expressed in quantitative form and composed of several variables, capable of summarizing the trend of the phe-nomenon to which it refers. The composite indicator is not the phenomenon, but it represents and summarizes the behavior of the more complex phenomenon that we must monitor and evaluate. An example that gives the idea: the individual indicator is the finger reach-ing towards the sky … but the phenomenon is the star! (Terzi et al., 2021). In general, when you decide to reduce the dimensions in space, you have few certainties: an approximation error is being made and the perfect com-posite index does not exist (Mazziotta, Pareto, 2020).
However, in the literature composite indices are widely used as they help to better read the complex real-ity and therefore to make relevant decisions for citizens. As mentioned, every composite indicator has strengths and weaknesses: the role of the researcher is to adapt the methodology to the phenomenon being measured.
The growing diffusion of AMPI method demon-strates that the methodology is robust and adaptable to many scientific contexts. As mentioned, AMPI is par-ticularly recommended when the individual indicators are not substitutable and therefore it is essential that there is no compensation between them (De Muro et al., 2011). The only precaution that must be kept under control is the choice of the base year if the data are in time series. Since the penalty occurs according to the variability with respect to the reference year, it seems desirable that the latter present a stable situation and that, therefore, is not subject to shocks that could affect the results of the entire time series. In the event that the base year is stable, it is easier to appreciate the trend of the composite index over time when the penalties due to the imbalances of the individual indicators are applied (Mazziotta, Pareto, 2016).
5. RESULTS
The results obtained for each dimension are reported in the following paragraphs together with the description of their aggregation in one composite indicator.

62 Mafalda Monda, Giuliano Gabrieli, Matteo Mazziotta
5.1. The economic dimension
In 2013, results for the economic dimension (Tab. 1) show how both northern and southern regions are in the top ten of the regional classification.
In particular, in the south, Apulia and Sicily occupy, respectively, the first and second positions, followed by Calabria in 4th position. In the north, Veneto (3rd), Emil-ia Romagna (5th) and Trentino-South Tirol (6th) have the highest positions.
This is according to the combined effect of four indi-cators which are the most influential: farms with owned land, trade openness, number of quality products and producers which assume values particularly high in the above mentioned areas. However, the northern regions show higher penalties than southern ones due to the unbalanced values of their individual indicators. This is because indicators belonging to the economic dimen-sion reflect structural factors of regional economies (e.g.: extension of utilized agricultural area) as well as farm performances (e.g.: agricultural value added).
Furthermore, indicators are affected by the eco-nomic cycle and natural events (e.g.: climate change) that are responsible for the variability of regional posi-
tion between 2013 and 2016. Indeed, in 2016, southern regions were getting worse with Apulia shifting to the second position, Sicily which moved into 5th position and Campania which moved from 7th to 9th. Analogous-ly, in the north, Veneto moved to 6th position and Tren-tino-South Tirol to 13th. The only exception is Emilia Romagna which moved up 4 positions, upgrading from the 5th to 1st.
5.2. The environmental dimension
In 2013 the environmental dimension of agricul-tural well-being (Tab. 2) shows the best results in south-ern regions (Calabria 2nd, Apulia 3rd, Sicily 4th, Molise 5th, Basilicata 6th and Abruzzo 7th) while the worst ones are those attributable to northern territories (Lombardy 21st, Veneto 20th, Liguria 19th and Emilia Romagna 18th). This is ascribable to production varieties and methods applied but also to opinions about regional environmen-tal conditions that are among the most influential indi-cators.
In particular, regional livestock numbers are respon-sible for positions occupied by northern regions. Live-
Tab. 1. Results for the economic dimension.
REGIONAMPI RANK
2013 2016 2013 2016
Abruzzo 93.9 92.7 16 19Basilicata 93.3 98.1 18 15Calabria 104.2 108.6 4 3Campania 103.1 103.7 7 9Emilia-Romagna 103.7 112.3 5 1Friuli-Venezia Giulia 91.6 94.9 19 18Lazio 101.2 105.6 10 7Liguria 95.0 100.2 14 14Lombardy 101.9 105.0 9 8Marche 93.7 95.1 17 17Molise 91.1 92.6 20 20Piedmont 97.6 102.6 13 11Apulia 106.0 110.6 1 2Sardinia 98.3 101.0 12 12Sicily 105.5 106.5 2 5Tuscany 102.4 107.2 8 4Trentino-South Tyrol 103.5 100.8 6 13Umbria 94.2 96.1 15 16Aosta Valley 89.3 85.6 21 21Veneto 105.2 106.4 3 6
ITALY 100.0 102.6 - -
Source: Authors’ elaboration on ISTAT and CREA data.
Tab. 2. Results for the environmental dimension.
REGIONAMPI RANK
2013 2016 2013 2016
Abruzzo 102.2 99.9 7 5Basilicata 102.6 101.3 6 4Calabria 103.9 102.9 2 2Campania 98.3 97.6 14 16Emilia-Romagna 94.3 97.0 18 17Friuli-Venezia Giulia 94.5 95.5 17 18Lazio 97.3 97.6 16 15Liguria 93.9 87.1 19 21Lombardy 92.7 93.5 21 19Marche 99.7 98.6 12 11Molise 103.4 103.1 5 1Piedmont 102.0 97.8 9 14Apulia 103.9 102.9 3 3Sardinia 98.3 98.6 13 10Sicily 103.7 99.2 4 7Tuscany 102.0 98.7 8 9Trentino-South Tyrol 100.2 99.8 10 6Umbria 98.2 98.1 15 13Aosta Valley 105.0 98.4 1 12Veneto 93.5 90.6 20 20
ITALY 100.0 99.0 - -
Source: Authors’ elaboration on ISTAT and CREA data.

63An indicator of well-being for Italian agriculture
stock productions are widespread in those territories thus negatively impacting on the environmental dimen-sion of agricultural well-being. This is in addition to production methods which require more use of phy-tosanitary products per hectare of cultivated land in northern regions. Penalties show higher values in north-ern regions and, in particular, in Aosta Valley as a con-sequence of non-homogeneous values of their individual indicators.
On the opposite side, southern regions show a bet-ter score of subjective indicators related to the concerns for the loss of biodiversity and degradation of land. This suggests that an improved quality of life and a better conservation of natural resources are among the major advantages for farms which operate in these areas. An upgrade in the positions of southern regions is observed in 2016, with Molise shifting from 5th to 1st position, Basilicata moving from 6th to 4th and Sardinia from 13th to 10th mainly as result of a minor concerns for the loss of biodiversity.
5.3. The social dimension
In 2013, Tuscany occupied the first position in the regional classification related to the social dimensionof the agricultural well-being (Tab. 3), followed by Umbria and Lazio. In general, central regions show better results of the social dimension of the agricultural well-being. This is the consequence of the high number of farmers that operate in disadvantaged rural areas, thus contrib-uting to their social and economic development, as well as the high percentage of people who believe their per-sonal situation will improve in the next 5 years.
The indicator related to the percentage of farms with family labor also contributes to increase agricul-tural well-being in the above mentioned regions togeth-er with the high number of farmers aged less than 44 years. On the opposite side, the majority of southern regions (Calabria, Campania, Molise, Apulia and Sic-ily) show low values of the social dimension of agricul-tural well-being. Northern regions have medium values of well-being except for Trentino-South Tirol and Emil-ia Romagna that are in the 4th and 6th positions of the regional classification.
These results are confirmed in 2016, with central regions reporting the best results for the agricultural well-being while the southern ones showed a further worsening. Basilicata shifted from 7th to 9th position, Abruzzo lost 5 positions (from 5th to 10th) and Sardinia shifted from 8th to 14th position mainly due to the reduc-tion in the number of farmers that operate in disadvan-tages rural areas.
5.4. The Institutional dimension
The Institutional dimension of the agricultural well-being (Tab. 4) shows values particularly high in the northern regions where, in 2013, they led the regional classification with Piedmont occupying first position, fol-lowed by Lombardy (2nd) and Trentino-South Tirol (3rd).
This result is ascribable to the regional level of expenditure related to agricultural research and develop-ment as well as the expenditure related to infrastructural services provided to farmers that are the most influential indicators.
Furthermore, in southern regions the observed high level of agricultural public expenditure (e.g.: Sicily) is offset by a higher degree of technical problems that farmers have to cope with, for example: irregularities in electric power distribution and difficulties to reach some basic services, thus placing these regions at the bottom of the regional classification.
These positions are confirmed by 2016’s results with few changes due to the economic cycle’s effects and pub-lic expenditure dynamics at regional level (e.g.: commit-ments and co-financing mechanisms) which also reflect into penalties attributed to Italian regions.
Tab. 3. Results for the social dimension.
REGIONAMPI RANK
2013 2016 2013 2016
Abruzzo 101.6 100.9 5 10Basilicata 100.6 101.0 7 9Calabria 96.5 94.6 17 19Campania 94.3 97.4 19 17Emilia-Romagna 100.9 99.9 6 12Friuli-Venezia Giulia 97.0 99.5 16 13Lazio 102.9 103.8 3 3Liguria 99.1 102.3 11 5Lombardy 99.9 98.4 10 16Marche 98.5 102.1 14 7Molise 98.2 101.4 15 8Piedmont 99.1 100.5 12 11Apulia 95.3 96.0 18 18Sardinia 100.5 99.2 8 14Sicily 92.7 90.6 20 20Tuscany 109.0 108.0 1 1Trentino-South Tyrol 102.6 103.6 4 4Umbria 106.0 106.9 2 2Aosta Valley 100.2 102.1 9 6Veneto 98.8 99.1 13 15
ITALY 100.0 99.9 - -
Source: Authors’ elaboration on ISTAT and CREA data.

64 Mafalda Monda, Giuliano Gabrieli, Matteo Mazziotta
5.5. The composite indicator of agricultural well-being for 2013 and 2016
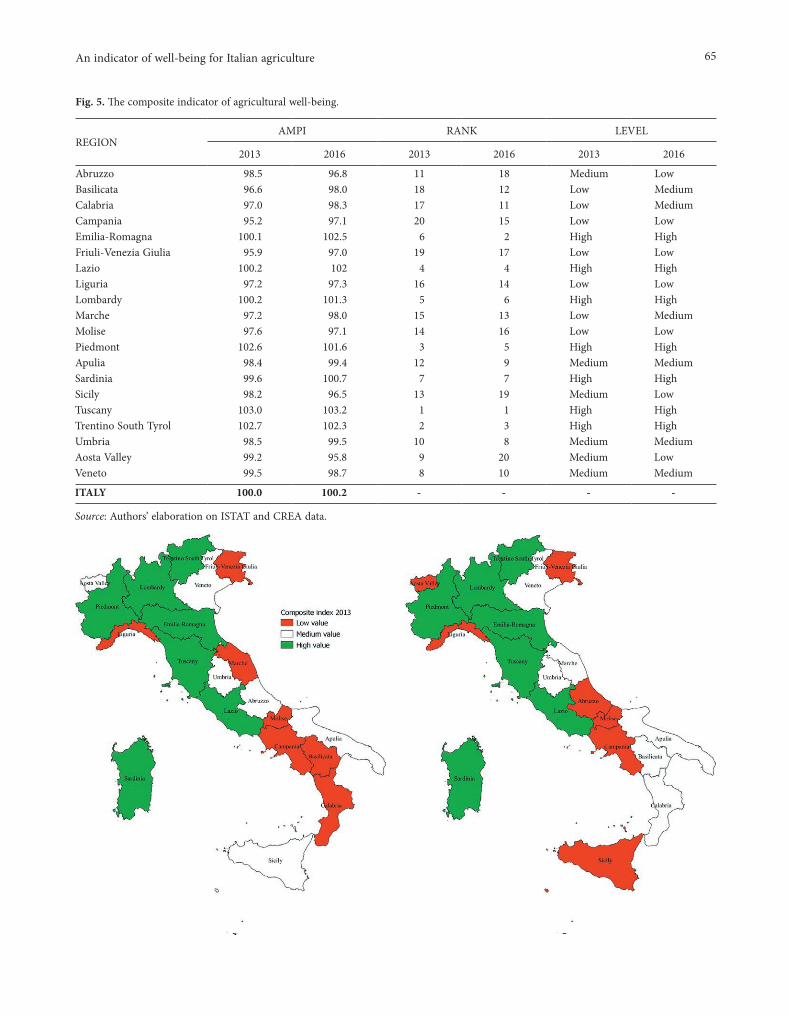
By synthetizing the four dimensions (economic, envi-ronmental, social and institutional) we obtain the compos-ite indicator of agricultural well-being for 2013 and 2016 (Tab. 5). Tuscany is in the first position of the regional classification in both years, followed by Trentino-South Tirol in 2013 and Emilia Romagna in 2016. In general, the composite indicator shows better performances in central and northern regions than southern ones, with the excep-tion of Sardinia which held the 7th position in both years.
The presence of the same regions in the top ten of the regional classifications in 2013 and 2016 indicates that the agricultural well-being is stable and high in the above mentioned territories, despite climate change and other challenges affecting the primary sector. Fur-thermore, many elements contribute to this result, such as the social structure, the efficiency of local adminis-tration and the quality of regional expenditures. They-impact positively on the quality of farmers’ life and the development of their activities.
This is why southern regions such as Sicily, Apulia and Calabria with good performances in more than one
dimension of the agricultural well-being (economic and environmental) don’t find good positions in the final classification.
6. DISCUSSION
The composite indicator for the Italian agricultural well-being allows us to understand trends in agricultural well-being at regional level, emphasizing its main deter-minants.
Results are comparable to those emerged in a study (Greco et al., 2013) that assesses the multifunctionality4 of agriculture in Italian regions by building a composite indicator of multifunctionality. Even if the latter meas-ures a different concept than the indicator of well-being, the two indicators have some commonalities that are worth exploring in a comparative perspective.
Specifically, the composite indicator of multi-functionality is built on 5 pillars/dimensions such as: 1. Landscape conservation 2. Diversification of farm activities 3. Environment 4. Food quality 5. Land protection. Analogously, the composite indicator of agricultural well-being is based on 4 dimensions: eco-nomic, environmental, social and institutional. Some of them include and group individual indicators belong-ing to different pillars of the composite indicator of multifunctionality.
The composite indicator of multifunctionality uses the MPI (+) method (De Muro et al., 2011) that is based on a penalized mean of standardized values. The com-posite indicator of agricultural well-being is based on the AMPI (+) which represents an extension of the MPI (+) method since it allows time comparisons.
Results for the composite indicator of multifunc-tionality show that northern and central regions display better results that southern ones. Analogously happens for the composite indicator for agricultural well-being. This is attributable to the role of disadvantaged rural areas in northern and central regions that contribute to the development of farm activities’ diversification for the composite indicator of multifuncitionality. The high number of farmers that operate in disadvantaged rural areas is responsible for the good performances of the composite indicator of agricultural well-being in north-ern and central regions.
4 Multifunctional agriculture refers to the fact that “beyond its prima-ry function of producing food and fibre, agricultural activity can also shape the landscape, provide environmental benefits such as land con-servation, the sustainable management of renewable natural resources and the preservation of biodiversity, and contribute to the socio-eco-nomic viability of many rural areas” (OECD, 2001).
Fig. 4. Results for the Institutional dimension.
REGIONAMPI RANK
2013 2016 2013 2016
Abruzzo 96.7 94.1 14 14Basilicata 90.8 92.2 17 16Calabria 85.8 89.4 20 20Campania 86.6 90.6 19 18Emilia-Romagna 102.0 102.3 5 5Friuli-Venezia Giulia 100.9 98.0 9 11Lazio 99.6 101.5 10 6Liguria 100.9 101.1 8 7Lombardy 107.4 109.7 2 1Marche 97.1 96.6 13 13Molise 98.5 92.2 12 15Piedmont 113.4 105.9 1 2Apulia 90.0 90.4 18 19Sardinia 101.4 104.1 7 4Sicily 92.5 91.5 16 17Tuscany 99.3 99.5 11 9Trentino-South Tyrol 104.5 105.1 3 3Umbria 96.5 97.4 15 12Aosta Valley 104.0 98.5 4 10Veneto 101.5 100.0 6 8
ITALY 100.0 99.4 - -
Source: Authors’ elaboration on ISTAT and CREA data.
65An indicator of well-being for Italian agriculture
Fig. 5. The composite indicator of agricultural well-being.
REGIONAMPI RANK LEVEL
2013 2016 2013 2016 2013 2016
Abruzzo 98.5 96.8 11 18 Medium LowBasilicata 96.6 98.0 18 12 Low MediumCalabria 97.0 98.3 17 11 Low MediumCampania 95.2 97.1 20 15 Low LowEmilia-Romagna 100.1 102.5 6 2 High HighFriuli-Venezia Giulia 95.9 97.0 19 17 Low LowLazio 100.2 102 4 4 High HighLiguria 97.2 97.3 16 14 Low LowLombardy 100.2 101.3 5 6 High HighMarche 97.2 98.0 15 13 Low MediumMolise 97.6 97.1 14 16 Low LowPiedmont 102.6 101.6 3 5 High HighApulia 98.4 99.4 12 9 Medium MediumSardinia 99.6 100.7 7 7 High HighSicily 98.2 96.5 13 19 Medium LowTuscany 103.0 103.2 1 1 High HighTrentino South Tyrol 102.7 102.3 2 3 High HighUmbria 98.5 99.5 10 8 Medium MediumAosta Valley 99.2 95.8 9 20 Medium LowVeneto 99.5 98.7 8 10 Medium Medium
ITALY 100.0 100.2 - - - -
Source: Authors’ elaboration on ISTAT and CREA data.
66 Mafalda Monda, Giuliano Gabrieli, Matteo Mazziotta
Furthermore, the composite indicator of multifunc-tionality shows better results in northern regions for the pillars related to farm activities’ diversification. This is due to farms with activities such agritourism, pro-duction of renewable energy and other activities that assume values particularly high in the above mentioned areas. The same happens for the composite indicator of multifunctionality food quality’s pillar due to the high number of quality products and producers operating in northern regions.
The composite indicator for agricultural well-being accounts for farm activities’ diversification and food quality in the economic dimension. However, other ele-ments are also taken into consideration in it such as: farm performances (e.g.: agricultural value added) and structural factors of regional economies (e.g.: extension of utilized agricultural area, trade openness). This is why the composite indicator of agricultural well-being shows that some southern regions as well as northern regions are in good positions in the regional classification for the economic dimension.
Furthermore, a part of southern regions hold high-er positions for the pillar “landscape conservation” and “biodiversity protection” for the composite indicator of multifuctionality. These results are partially in line with those of the composite indicator of agricultural well-being that includes individual indicators for landscape conservation and biodiversity protection in the environ-mental dimension.
Indeed, results show that southern regions are at the top of the regional classification for this dimension of agricultural well-being. However, this is due to a better score displaying for subjective indicators such as the con-cerns for the loss of biodiversity and land degradation.
Subjective aspects have not been taken into account in the composite indicator of multifunctionality, rep-resenting the main difference between the two indica-tors. In addition the composite indicator of multifunc-tionality does not consider the institutional dimension, which is conversely included in the composite indicator of agricultural well-being. This dimension accounts for the efficiency of public administration and other ele-ments able to impact on the development of farmers’ activities at regional level. This offers a broader per-spective of the well-being in agriculture from the farm-ers’ point of view.
7. CONCLUSIONS
The experience of well-being indicators has been largely developed for many years starting from the defi-
nition of well-being in a broader sense as a multidimen-sional phenomenon which emphasizes the human/citi-zen perspective.
Recently, it has become a central topic for research institutions and national and international organiza-tions due to the fact they are easy to understand and are a good communication tool, allowing aggregation of a huge amount of information in only one measure.
However, composite indicators may be incapable to reflect complexities of phenomena such as well-being. In this sense, the construction of a well-being indicator at sectorial level, is something new in the research arena that may help to complementthe multisectorial perspec-tive offered by the traditional well-being measures.
The example of a composite indicator of well-being for the Italian agriculture, presented in this paper, allows stakeholders to focus on points of strengths and weak-nesses of the agricultural sector.
Results for the composite indicator underline the presence of the same regions in the top ten of the regional classifications in 2013 and 2016. This indicates that the agricultural well-being is stable among regions and variabilities in their positions are mainly attribut-able to external factors affecting the primary sector (cli-mate change, economic cycle…).
This is in line with the results of equitable and sus-tainable well-being indicators, published by the Italian National Institute of Statistics, that shows how southern regions are at the bottom of the regional classification for quality of life as a consequence of structural prob-lems affecting those living in the south of Italy.
This indicator could be further refined by including new dimensions other than economic, social, environ-mental and institutional. It could be developed by taking into account subjective aspects of well-being such as: the satisfaction for the farming job, access to land and farm bureaucratic burden.
New indicators and dimensions should be able to capture elements of the agricultural well-being that have not been covered yet, and would provide deeper under-standing of sector-related problems in order to intervene in an appropriate manner.
Sectorial indicators of well-being could assume a relevant role in the near future, considering the chal-lenges that economic sectors are facing worldwide such as: climate change, pandemic crisis, depletion of natural resources. They may allow policy makers to find targeted solutions by taking into account needs, problems and perceptions of operators working in economic sectors, helping to improve public policies.

67An indicator of well-being for Italian agriculture
REFERENCES
Bacchini F., Baldazzi B., Morrone A., Savioli M., Sorvillo M. P., Tinto A. (2016). Un framework integrato per la misurazione del benessere e la sostenibilità in Italia. Working papers Urban@it, 2/2016.
Becker B. (1997). Sustainability assessment: a review of values, concepts, and methodological approaches. Issues in agriculture, 10. The World Bank, Washing-ton D.C.
Binder C.R., Feola G., Steinberger J.K. (2010). Consid-ering the Normative, Systematic and Procedural Dimensions in Indicator-Based Sustainability Assess-ments in Agriculture. Environmental Impact Assess-ment Review, 30(2): 71-81. https://doi.org/10.1016/j.eiar.2009.06.002
Comer S., Ekanem E., Muhammad S., Singh S. P., Tegeg-ne F. (1999). Sustainable and conventional farmers: A comparison of socio-economic characteristics, atti-tude and beliefs. Journal of Sustainable Agriculture, 15(1): 29-45. https://doi.org/10.1300/J064v15n01_04
De Muro P., Mazziotta M., Pareto, A. (2011). Composite Indices of Development and Poverty: An Applica-tion to MDGs. Social Indicators Research 104: 1-18. https://doi.org/10.1007/s11205-010-9727-z
Greco M., Fusco D., Giordano P., Moretti V., Broccoli M. (2013). Misurare la multifunzionalità in agricoltura: proposta di un indice sintetico, Agriregionieuropa, 9(34).
Hamilton K. (1994). Green Adjustments to GDP. Resources Policy, 20(3): 155-168. https://doi.org/10.1016/0301-4207(94)90048-5
Hamilton K. (1996). Pollution and Pollution Abate-ment in the National Accounts. Review of Income and Wealth, 42(1): 13-33. https://doi.org/10.1111/j.1475-4991.1996.tb00143.x
Hayati D. (1995). Factors influencing technical knowledge, sustainable agricultural knowledge and sustainabil-ity of farming system among wheat producers, in Fars province, Iran M. Sc. Thesis presented in College of agriculture, Shiraz University Iran.
Hayati D., Ranjbar Z., Karami E. (2010). Measuring agri-cultural sustainability. Biodiversity, Biofuels, Agrofor-estry and Conservation Agriculture, 5: 73-100. https://doi.org/10.1007/978-90-481-9513-8_2
Herzog F., Gotsch N. (1998). Assessing the sustainabil-ity of smallholder tree crop production in the trop-ics: A methodological outline. Journal of Sustainable Agriculture, 11(4): 13-37. https://doi.org/10.1300/J064v11n04_04
Ikerd J.E. (1993). The need for a systems approach to sustainable agriculture. Agriculture Ecosystems Envi-
ronment, 46(1/4): 147-160. https://doi:10.1016/0167-8809(93)90020-P
Ingels C., Campbell D., George M.R., Bradford E. (1997). What is sustainable agriculture? Available at: www.sarep.ucdavis.edu/concept.htm
ISTAT, 2018. BES Report 2018: equitable and sustainable well-being in Italy. ISTAT, Rome
Karami E. (1995). Agricultural extension: The question of sustainable development in Iran. Journal of Sustaina-ble Agriculture, 5(1/2): 61-72. https://doi.org/10.1300/J064v05n01_05
Lebacq T., Baret P.V., Stilmant D. (2013). Sustainability indicators for livestock farming. A review. Agronomy for sustainable development, 33(2): 311-327. https://doi.org/10.1007/s13593-012-0121-x
Lockeretz W. (1988). Open questions in sustainable agriculture. American Journal of Alternative Agri-culture, 3(04): 174-181.https://doi.org/10.1017/S0889189300002460
Lynam J.K., Herdt R.W. (1989). Sense and sustainability: sustainability as an objective in international agricul-tural research. Agricultural Economics, 3(4): 381-398. https://doi.org/10.1016/0169-5150(89)90010-8
Mazziotta M., Pareto A. (2016). On a Generalized Non-compensatory Composite indicator for Measur-ing Socioeconomic Phenomena. Social Indicators Research, 127(3): 983-1003. https://doi.org/10.1007/s11205-015-0998-2
Mazziotta M., Pareto A. (2018). Use and Misuse of PCA for Measuring Well-being. Social Indicators Research, 142(2): 451-476. https://doi.org/10.1007/s11205-018-1933-0
Mazziotta M., Pareto A. (2020). Gli indici sintetici. Torino, Giappichelli editore
Morris D. M. (1979). Measuring the condition of the world’s poor: the physical quality of life index. New York, Pergamon Press.
Nambiar K.K.M., Gupta A.P., Qinglin F., Li S. (2001). Biophysical, chemical and socio-economic indicators for assessing agricultural sustainability in the Chinese coastal zone. Agriculture, Ecosystems and Environ-ment, 87(2): 209-214. https://doi.org/10.1016/S0167-8809(01)00279-1
Neumayer E. (2004). Sustainability and well-being indica-tors. WIDER Research Papers, 2004/23. Available at: http://eprints.lse.ac.uk/30851/.
Nijkamp P., Vreeker R. (2000). Sustainability assessment of development scenarios: methodology and applica-tion to Thailand. Ecological Economics, 33(1): 7-27. https://doi.org/10.1016/S0921-8009(99)00135-4
OECD (1999). Environmental indicators for agriculture. Issues and Design. OECD Publishing, Paris.

68 Mafalda Monda, Giuliano Gabrieli, Matteo Mazziotta
OECD (2001). Multifunctionality: Towards an Analyti-cal Framework. OECD Publishing, Paris, https://doi.org/10.1787/9789264192171-en.
OECD (2001). Environmental indicators for agriculture: Methods and Results. OECD Publishing, Paris.
Osberg L., Sharpe A. (2002). An Index of Economic Well-Being for Selected OECD Countries. Review of Income and Wealth, 48(3): 291-316. https://doi.org/10.1111/1475-4991.00056
Rasul G., Thapa G.B. (2004). Sustainability of ecologi-cal and conventional agricultural systems in Bang-ladesh: An assessment based on environmental, economic and social perspectives. Agricultural Sys-tems, 79(3): 327-351. https://doi.org/10.1016/S0308-521X(03)00090-8
Rigby D., Woodhouse P., Young T., Burton M. (2001). Constructing a farm-level indicator of sustain-able agricultural practice. Ecological Economics, 39(3): 463-478. https://doi.org/10.1016/S0921-8009(01)00245-2
Saltelli A. (2007). Composite Indicators between Analy-sis and Advocacy. Social Indicators Research, 81(1): 65-77. https://doi.org/10.1007/s11205-006-0024-9
Sands G.R., Podmore H. (2000). A generalized environ-mental sustainability index for agricultural systems. Agriculture, Ecosystems and Environment, 79(1): 29-41. https://doi.org/10.1016/S0167-8809(99)00147-4
Stiglitz J.E., Sen A., Fitoussi J.P. (2009). Report by the Commission on the Measurement of Economic Perfor-mance and Social Progress. Paris.
Tellarini V., Caporali F. (2000). An input/output meth-odology to evaluate farm as sustainable ecosys-tems: an application of indicators to farms in cen-tral Italy. Agricultural ecosystems and environment, 77(1/2): 11-123. https://doi.org/10.1016/S0167-8809(99)00097-3
Terzi S., Otoiu A., Grimaccia E., Mazziotta M., Pareto A. (2021). Open Issues in Composite Indicators. Roma TrE-Press. DOI: 10.13134/979-12-5977-001-1
United Nations Conference on Sustainable Development (2001). Indicators of Sustainable Development: Guide-lines and methodologies. http://www.un.org/esa/sust-dev/publications/indisd-mg2001.pdf
United Nations Development Programme (1998). Human Development Report 1998. Oxford University Press, New York.
United Nations Development Programme (2001). Human Development Index (HDI). http://hdr.undp.org/en/statistics/hdi/
Valkó G. (2016). Developing the Indicator System of Sus-tainable Agriculture – Application of Composite Indi-
cators Proceedings. ICAS VII Seventh International Conference on Agricultural Statistics I Rome 24-26 October 2016. https.//doi:10.1481/icasVII.2016.b14
Van Cauwenbergh N., Biala K., Bielders C., Brouckaert V., Franchois L., Cidad V.G., Hermy M., Mathijs E., Muys B., Reijnders J., Sauvenier X., Valckx J., Van-clooster M., Der Veken B.V., Wauters E., Peeters A. (2007). SAFE: a hierarchical framework for assessing the sustainability of agricultural systems. Agriculture, Ecosystems and Environment, 120(2/4): 229-242. htt-ps://doi.org/10.1016/j.agee.2006.09.006
Webster P. (1999) The challenge of sustainabil-ity at the farm level: Presidential address. Jour-nal Agricultural Economics, 50: 371-387. https.//doi:10.1111/j.1477-9552.1999.tb00888.x
World Commission on Environment and Development (1987). Our Common Future. United Nations, New York.
Zhen L., Routray J.K. (2003). Operational indicators for measuring agricultural sustainability in developing countries. Environmental Management, 32(1): 34-46. https://doi.org/10.1007/s00267-003-2881-1

69An indicator of well-being for Italian agriculture
APPENDIX
Economic Dimension
Yields Polarity1 Agricultural value added per ha (crop -specialist holdings) + Data source Farm Accounting data network (Italy)
Livestock productivity Polarity2 Agricultural value added per livestock unit (livestock-specialist holdings) + Data source Farm Accounting data network (Italy)
Labour productivity Polarity3 Agricultural value added per work unit(LU) + Data source Farm Accounting data network (Italy)
Capital productivity Polarity4 Agricultural value added/ Farm Net Capital + Data source Farm Accounting data network (Italy)
Agricultural value added Polarity5 Agricultural value added at basic prices (mil. Euros) + Data source National account data (Italian National Institute of Statistics)
Openness to international trade index Polarity
6 (Import + Export) / Agricultural value added + Data source COMTRADE database and National account data (Italian National Institute of Statistics)
Farm birth rate Polarity7 Number of new farms in a given yearas a percentage of the total number farms + Data source Infocamere, Firmregister
Agricultural workers’ wages Polarity8 Wagesin euros + Data source National account data (Italian National Institute of Statistics)
Quality products Polarity8 Number of quality products + Data source Quality products’ database (Italian National Institute of Statistics)
Farms with quality products Polarity10 Number of farms with quality products + Data source Quality producers’ database (Italian National Institute of Statistics)
Farms with own land Polarity11 Number of farms with own land as a percentage of the total + Data source Survey on farm structure (Italian National Institute of Statistics)
Farms with other farming-related activities Polarity
12 Number of farms with other farming-related activitiesas a percentage of the total + Data source Survey on farm structure (Italian National Institute of Statistics)
Environmental Dimension
Satisfaction for the environmental conditions Polarity
1 Percentage of people aged 14 and over very or quite satisfied of the environmental situation (air, water, noise) of the area where they live on total population aged 14 and over +
Data source Survey on every-day life aspects (Italian National Institute of Statistics)

70 Mafalda Monda, Giuliano Gabrieli, Matteo Mazziotta
Energy from renewable sources Polarity2 Percentage of energy consumptions coveredby renewable sources + Data source Terna
Fertilizer use Polarity3 Quantity of fertilizers (Ton) / Utilized agricultural area (ha) - Data source Fertilizer database (Italian National Institute of Statistics)
Phytosanitary use Polarity4 Quantity of phytosanitary products (Ton) / Utilized agricultural area (ha) - Data source Fertilizer database (Italian National Institute of Statistics)
Regional area under organic farming Polarity
5 Extension of agricultural areaunder organic farming (ha) + Data source SINAB
Livestock Polarity6 Livestock units (LSU) - Data source Italian Farm structure Survey (Italian National Institute of Statistics)
Protected naturalareas Polarity
7 Percentage share of terrestrial protected natural areas included in Italian Official List of Protected Areas (Euap) and Natura 2000 Network +
Data source Annex of environmental data, ISPRA
Utilizedagricultural area Polarity8 Extension of utilized agricultural area (ha) + Data source Farm Accounting data network (Italy)
Farms with renewable energy production Polarity
9 Number of farms with renewable energy production as a percentage of the total number of farms + Data source Italian Farm structure Survey (Italian National Institute of Statistics)
Irrigated agricultural area Polarity10 Irrigated agricultural area as a percentage of Irrigable agricultural area + Data source Italian Farm structure Survey (Italian National Institute of Statistics)
Impact of forest fires Polarity11 Burnt forest area (wooded and non-wooded) per 1,000 sq.km - Data source Equitable and sustainable well-being indicators (Italian National Institute of Statistics)
Concern aboutlandscapedeterioration Polarity
12 Proportion of population reporting, among the environmental problems for which they express more concern, the decay of landscape due to overbuilding -
Data source Equitable and sustainable well-being indicators, Italian National Institute of Statistics
Concern for biodiversity loss Polarity
13 Percentage of people aged 14 and over who believe that biodiversity loss is among the five most important environmental problems on total population aged 14 and over -
Data source Equitable and sustainable well-being indicators, Italian National Institute of Statistics
Social dimension
Farmers agedlessthan 44 Polarity1 Number of farmers aged less than 44 + Data source Tax return data, (Italian Ministry of economics and finance)
Agricultural workers Polarity2 Number of agricultural workers + Data source National account data, (Italian National Institute of Statistics)
71An indicator of well-being for Italian agriculture
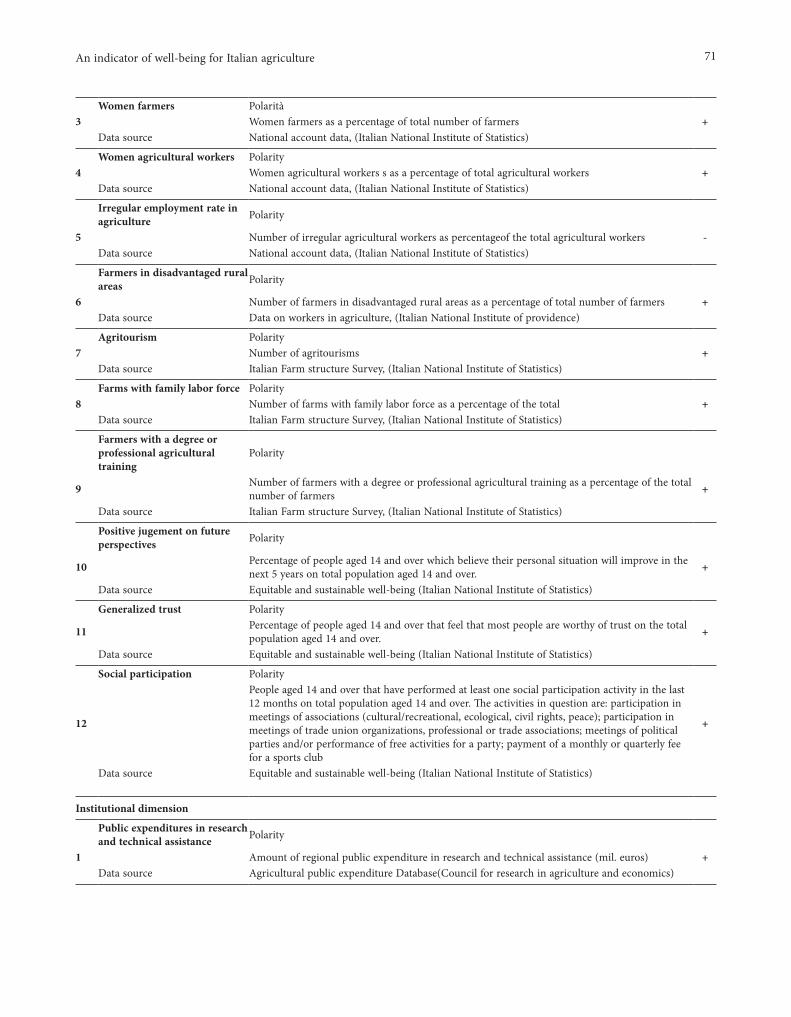
Women farmers Polarità3 Women farmers as a percentage of total number of farmers + Data source National account data, (Italian National Institute of Statistics)
Women agricultural workers Polarity4 Women agricultural workers s as a percentage of total agricultural workers + Data source National account data, (Italian National Institute of Statistics)
Irregular employment rate in agriculture Polarity
5 Number of irregular agricultural workers as percentageof the total agricultural workers - Data source National account data, (Italian National Institute of Statistics)
Farmers in disadvantaged rural areas Polarity
6 Number of farmers in disadvantaged rural areas as a percentage of total number of farmers + Data source Data on workers in agriculture, (Italian National Institute of providence)
Agritourism Polarity7 Number of agritourisms + Data source Italian Farm structure Survey, (Italian National Institute of Statistics)
Farms with family labor force Polarity8 Number of farms with family labor force as a percentage of the total + Data source Italian Farm structure Survey, (Italian National Institute of Statistics)
Farmers with a degree or professional agricultural training
Polarity
9 Number of farmers with a degree or professional agricultural training as a percentage of the total number of farmers +
Data source Italian Farm structure Survey, (Italian National Institute of Statistics)
Positive jugement on future perspectives Polarity
10 Percentage of people aged 14 and over which believe their personal situation will improve in the next 5 years on total population aged 14 and over. +
Data source Equitable and sustainable well-being (Italian National Institute of Statistics)
Generalized trust Polarity
11 Percentage of people aged 14 and over that feel that most people are worthy of trust on the total population aged 14 and over. +
Data source Equitable and sustainable well-being (Italian National Institute of Statistics)
Social participation Polarity
12
People aged 14 and over that have performed at least one social participation activity in the last 12 months on total population aged 14 and over. The activities in question are: participation in meetings of associations (cultural/recreational, ecological, civil rights, peace); participation in meetings of trade union organizations, professional or trade associations; meetings of political parties and/or performance of free activities for a party; payment of a monthly or quarterly fee for a sports club
+
Data source Equitable and sustainable well-being (Italian National Institute of Statistics)
Institutional dimension
Public expenditures in research and technical assistance Polarity
1 Amount of regional public expenditure in research and technical assistance (mil. euros) + Data source Agricultural public expenditure Database(Council for research in agriculture and economics)

72 Mafalda Monda, Giuliano Gabrieli, Matteo Mazziotta
Farm support Polarity2 Amount offarm support as a percentage ofagricultural value added +
Data source Agricultural public expenditure Database (Council for research in agriculture and economics), national account data (Italian Institute of Statistics)
Long-term loans for farm investments Polarity
3 Amount oflong-term loans for farm investments (mil. euros) + Data sources Bank of Italy
Public expenditures in infrastructural services for farmers
Polarità
4 Amount of regional public expendituresin infrastructural services for farmers (mil. euros) + Data source Agricultural public expenditure Database on (Council for research in agriculture and economics)
Regional public expenditures Polarity5 Amount of regional public expenditure (mil.euros) + Data source Agricultural public expenditure Database (Council for research in agriculture and economics)
Irregularities in electric power distribution Polarity
6 Unit Frequency of accidental long lasting electric power cuts (cuts without notice longer than 3 minutes) (average number per consumer). -
Data source Authority for Electricity gas and water system
Impact of knowledge workers on employment Polarity
7 Percentage of employees with tertiary education (ISCED 5-6-7-8) in scientific-technological occupations (ISCO 2-3) on total employees +
Data source Labour force survey, (Italian National Institute of Statistics)
Trust in other institutions Polarity
8 Average score of trust in the police and the fire brigade (on a scale from 0 to 10) expressed by people aged 14 and over +
Data source Survey on Aspects of daily life (Italian National Institute of Statistics)
Civic and politicalparticipationPolarity
9
People aged 14 and over who perform at least one of the activities of civic and political participation on total population aged 14 and over. The activities in question are: The activities in question are: to speak about politics at least once a week; to inform of the facts of Italian politics at least once a week; to attend online consultation or voting on social issues (civic) or political (e.g. urban planning, sign a petition) at least once in the 3 months prior to the interview, to read and to post opinions on social or political issues on the web at least once in the 3 months preceding the interview.
+
Data source Survey on Aspects of daily life (Italian National Institute of Statistics)
Trust in other institutions Polarity
10 Average score of trust in the police and the fire brigade (on a scale from 0 to 10) expressed by people aged 14 and over +
Data source Survey on Aspects of daily life (Italian National Institute of Statistics)
Composite indicator of service accessibility Polarity
11Percentage of households who find very difficult to reach some basic services (pharmacy, emergency room, post office, police, municipal offices, crèches, nursery, primary and secondary school, market and supermarket).
-
Data source Survey on Aspects of daily life (Italian National Institute of Statistics)