an increase of 35 cases from last month. - nm human services · highlights x the snap caseload in...
TRANSCRIPT

Highlights
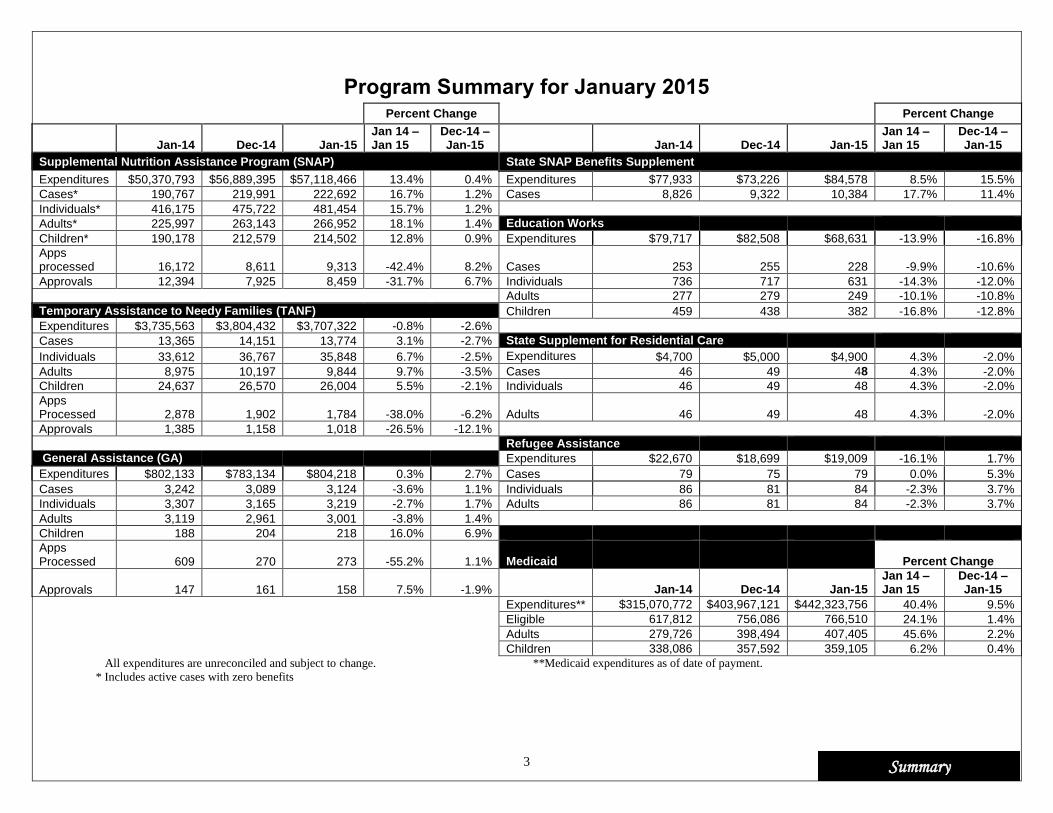
The SNAP caseload in January 2015 was 222,692, a 16.7 percent increase from one year ago. The SNAP caseload
has risen by 2,701 cases, or 1.2 percent, since last month.
The TANF caseload was 13,774 in January 2015, a 3.1 percent increase from January 2014. The TANF caseload
had 377 cases less than December 2014, a decrease of 2.7 percent.
The caseload for General Assistance was 3,124 in January 2015, a decrease of 3.6 percent from one year ago and
an increase of 35 cases from last month.
Susana Martinez, Governor
Brent Earnest, Cabinet Secretary-Designate

CONTENTS PAGE
Summary 3-4
SNAP 5-6
State SNAP Benefits Supplement 7
TANF 8-9
ICARE 10
NMWorks 11-12
Diversion 13
Education Works 14-15
General Assistance 16-17
GA Interim Assistance Reimbursements 18
Refugee Assistance 19
State Supplement for Residential Care 20
Applications 21-23
Child Support Enforcement 24-25
Child Care Assistance 26-27
Sean Pearson, Acting Deputy Secretary
Prepared by Income Support Division PO Box 2348
Santa Fe, NM 87504-2348 505-827-7250
Marilyn Martinez, Acting Division Director
Vida Tapia-Sanchez, Deputy Director Laura Galindo, Deputy Director
We’ve moved!
http://www.hsd.state.nm.us/monthly-statistical-reports.aspx
Centralized Units include the following offices: Albuquerque Indian Hospital; ASD Restitutions; Customer Service; Mescalero; Quality Assessment Bureau; San Miguel County CSU; SIPI; SMU Torrance; St. Vincent’s Hospital. Tallies include data from ISD2 (through February 2014) and ASPEN (beginning July 2013). Regions reported as follows beginning January 2015: Region 1: San Juan, McKinley, Cibola, Catron, Socorro, Sierra, Valencia Region 2: Rio Arriba, Sandoval, Los Alamos, Santa Fe, Taos, Colfax, Mora, San Miguel, Guadalupe, De Baca, Quay, Harding, Union, Quay Region 3: Bernalillo, Torrance Region 4: Lincoln, Chaves, Eddy, Lea, Roosevelt, Curry Region 5: Grant, Hidalgo, Luna, Dona Ana, Otero
The Mission of the Human Services
Department
To reduce the impact of poverty on
people living in New Mexico by
providing support services that help
families break the cycle of
dependency on public assistance
3
Summary
Program Summary for January 2015
Percent Change
Percent Change
Jan-14 Dec-14 Jan-15
Jan 14 –Jan 15
Dec-14 –Jan-15
Jan-14 Dec-14 Jan-15
Jan 14 –Jan 15
Dec-14 –Jan-15
Supplemental Nutrition Assistance Program (SNAP) State SNAP Benefits Supplement
Expenditures $50,370,793 $56,889,395 $57,118,466 13.4% 0.4% Expenditures $77,933 $73,226 $84,578 8.5% 15.5%
Cases* 190,767 219,991 222,692 16.7% 1.2% Cases 8,826 9,322 10,384 17.7% 11.4%
Individuals* 416,175 475,722 481,454 15.7% 1.2%
Adults* 225,997 263,143 266,952 18.1% 1.4% Education Works
Children* 190,178 212,579 214,502 12.8% 0.9% Expenditures $79,717 $82,508 $68,631 -13.9% -16.8%
Apps processed 16,172 8,611 9,313 -42.4% 8.2% Cases 253 255 228 -9.9% -10.6%
Approvals 12,394 7,925 8,459 -31.7% 6.7% Individuals 736 717 631 -14.3% -12.0%
Adults 277 279 249 -10.1% -10.8%
Temporary Assistance to Needy Families (TANF) Children 459 438 382 -16.8% -12.8%
Expenditures $3,735,563 $3,804,432 $3,707,322 -0.8% -2.6%
Cases 13,365 14,151 13,774 3.1% -2.7% State Supplement for Residential Care
Individuals 33,612 36,767 35,848 6.7% -2.5% Expenditures $4,700 $5,000 $4,900 4.3% -2.0%
Adults 8,975 10,197 9,844 9.7% -3.5% Cases 46 49 48 4.3% -2.0%
Children 24,637 26,570 26,004 5.5% -2.1% Individuals 46 49 48 4.3% -2.0%
Apps Processed 2,878 1,902 1,784 -38.0% -6.2% Adults 46 49 48 4.3% -2.0%
Approvals 1,385 1,158 1,018 -26.5% -12.1%
Refugee Assistance
General Assistance (GA) Expenditures $22,670 $18,699 $19,009 -16.1% 1.7%
Expenditures $802,133 $783,134 $804,218 0.3% 2.7% Cases 79 75 79 0.0% 5.3%
Cases 3,242 3,089 3,124 -3.6% 1.1% Individuals 86 81 84 -2.3% 3.7%
Individuals 3,307 3,165 3,219 -2.7% 1.7% Adults 86 81 84 -2.3% 3.7%
Adults 3,119 2,961 3,001 -3.8% 1.4%
Children 188 204 218 16.0% 6.9%
Apps Processed 609 270 273 -55.2% 1.1% Medicaid Percent Change
Approvals 147 161 158 7.5% -1.9% Jan-14 Dec-14 Jan-15 Jan 14 –Jan 15
Dec-14 –Jan-15
Expenditures** $315,070,772 $403,967,121 $442,323,756 40.4% 9.5%
Eligible 617,812 756,086 766,510 24.1% 1.4%
Adults 279,726 398,494 407,405 45.6% 2.2%
Children 338,086 357,592 359,105 6.2% 0.4%
All expenditures are unreconciled and subject to change. **Medicaid expenditures as of date of payment.
* Includes active cases with zero benefits

April Summary
4
Summary
Expenditures Year to Date
SFY 2015 FFY 2015 CY 2015
Supplemental Nutrition Assistance Program (SNAP) $388,992,889 $225,939,715 $57,118,466
Temporary Assistance for Needy Families (TANF) $27,768,422 $15,198,131 $3,707,322
General Assistance $5,217,638 $3,076,967 $804,218
Education Works $478,173 $277,562 $68,631
DEMOGRAPHIC PROFILE FOR DECEMBER 2014 SNAP* TANF General Assistance Education
Works Refugee Cash
Assistance
Average # persons per case: 2.16 2.60 1.03 2.77 1.06
Gender of Recipients:
Male 218,748 15,198 1,863 221 53
Female 262,706 20,650 1,356 410 31
Ethnicity:
Hispanic 275,282 25,264 1,789 365 55
Not Hispanic 206,172 10,584 1,430 266 29
Race:
Native American or Alaskan Native 77,634 2,747 181 71 -
Asian 5,504 396 31 10 2
African American 11,758 1,316 115 27 8
Native Hawaiian or Pacific Islander 871 49 - 1 -
White 379,947 30,840 2,854 514 42
Unknown/not declared 3,450 186 13 4 7
More than one race 2,290 314 25 4 25
* Includes active cases with zero benefits
5 SNAP
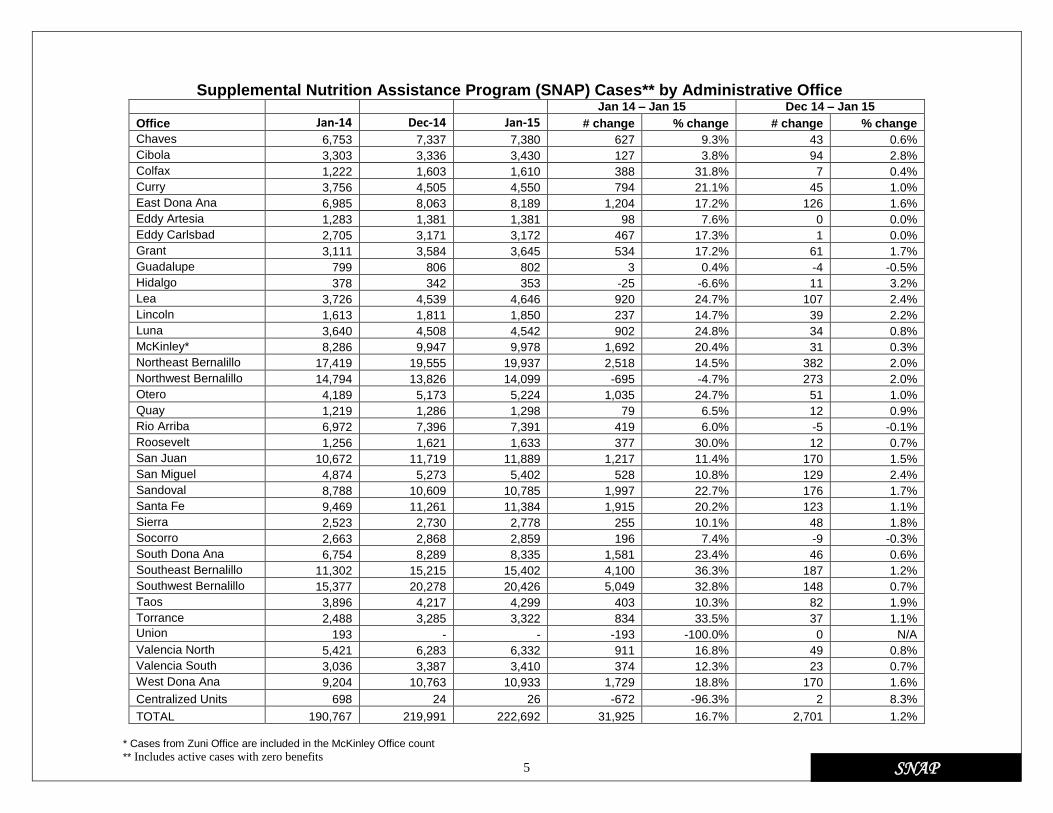
Supplemental Nutrition Assistance Program (SNAP) Cases** by Administrative Office
Jan 14 – Jan 15 Dec 14 – Jan 15
Office Jan-14 Dec-14 Jan-15 # change % change # change % change
Chaves 6,753 7,337 7,380 627 9.3% 43 0.6%
Cibola 3,303 3,336 3,430 127 3.8% 94 2.8%
Colfax 1,222 1,603 1,610 388 31.8% 7 0.4%
Curry 3,756 4,505 4,550 794 21.1% 45 1.0%
East Dona Ana 6,985 8,063 8,189 1,204 17.2% 126 1.6%
Eddy Artesia 1,283 1,381 1,381 98 7.6% 0 0.0%
Eddy Carlsbad 2,705 3,171 3,172 467 17.3% 1 0.0%
Grant 3,111 3,584 3,645 534 17.2% 61 1.7%
Guadalupe 799 806 802 3 0.4% -4 -0.5%
Hidalgo 378 342 353 -25 -6.6% 11 3.2%
Lea 3,726 4,539 4,646 920 24.7% 107 2.4%
Lincoln 1,613 1,811 1,850 237 14.7% 39 2.2%
Luna 3,640 4,508 4,542 902 24.8% 34 0.8%
McKinley* 8,286 9,947 9,978 1,692 20.4% 31 0.3%
Northeast Bernalillo 17,419 19,555 19,937 2,518 14.5% 382 2.0%
Northwest Bernalillo 14,794 13,826 14,099 -695 -4.7% 273 2.0%
Otero 4,189 5,173 5,224 1,035 24.7% 51 1.0%
Quay 1,219 1,286 1,298 79 6.5% 12 0.9%
Rio Arriba 6,972 7,396 7,391 419 6.0% -5 -0.1%
Roosevelt 1,256 1,621 1,633 377 30.0% 12 0.7%
San Juan 10,672 11,719 11,889 1,217 11.4% 170 1.5%
San Miguel 4,874 5,273 5,402 528 10.8% 129 2.4%
Sandoval 8,788 10,609 10,785 1,997 22.7% 176 1.7%
Santa Fe 9,469 11,261 11,384 1,915 20.2% 123 1.1%
Sierra 2,523 2,730 2,778 255 10.1% 48 1.8%
Socorro 2,663 2,868 2,859 196 7.4% -9 -0.3%
South Dona Ana 6,754 8,289 8,335 1,581 23.4% 46 0.6%
Southeast Bernalillo 11,302 15,215 15,402 4,100 36.3% 187 1.2%
Southwest Bernalillo 15,377 20,278 20,426 5,049 32.8% 148 0.7%
Taos 3,896 4,217 4,299 403 10.3% 82 1.9%
Torrance 2,488 3,285 3,322 834 33.5% 37 1.1%
Union 193 - - -193 -100.0% 0 N/A
Valencia North 5,421 6,283 6,332 911 16.8% 49 0.8%
Valencia South 3,036 3,387 3,410 374 12.3% 23 0.7%
West Dona Ana 9,204 10,763 10,933 1,729 18.8% 170 1.6%
Centralized Units 698 24 26 -672 -96.3% 2 8.3%
TOTAL 190,767 219,991 222,692 31,925 16.7% 2,701 1.2%
* Cases from Zuni Office are included in the McKinley Office count
** Includes active cases with zero benefits
.

6
SNAP
Supplemental Nutrition Assistance Program (SNAP) Cases** by Region Jan 14 – Jan 15 Dec 14 – Jan 15
Region Jan-14 Dec-14 Jan-15 # change % change # change % change
NW Region 1 35,904 29,661 29,891 -6,013 -16.7% 230 0.8%
NE Region 2 37,432 53,060 53,756 16,324 43.6% 696 1.3%
Central Region 3 61,380 72,159 73,186 11,806 19.2% 1,027 1.4%
SE Region 4 21,092 24,365 24,612 3,520 16.7% 247 1.0%
SW Region 5 34,261 40,722 41,221 6,960 20.3% 499 1.2%
Centralized Units 698 24 26 -672 -96.3% 2 8.3%
TOTAL 190,767 219,991 222,692 31,925 16.7% 2,701 1.2%
** Includes active cases with zero benefits
.

7 State SNAP
State SNAP Benefits Supplement
SFY 2011 SFY 2012 SFY 2013 SFY 2014 SFY 2015
Cases Expenditures Cases Expenditures Cases Expenditures Cases Expenditures Cases Expenditures
July 4,056 $50,241 4,395 $34,773 5,157 $42,552 5,767 $48,040 9,635 $88,859
Aug 4,088 $50,502 4,477 $35,360 5,200 $42,797 5,841 $48,417 9,559 $87,757
Sept 4,139 $50,946 4,591 $36,455 5,223 $43,023 5,841 $48,732 9,688 $87,372
Oct 4,284 $52,530 4,384 $34,850 5,071 $41,752 5,575 $46,610 9,136 $70,490
Nov 4,381 $53,820 4,436 $35,260 5,088 $42,074 8,219 $69,564 9,152 $69,955
Dec 4,296 $52,649 4,474 $35,619 5,202 $42,829 8,310 $71,839 9,322 $73,226
Jan 3,984 $31,897 5,050 $41,519 5,548 $45,769 8,826 $77,933 10,384 $84,578
Feb 4,006 $31,970 5,102 $41,900 5,645 $46,700 9,024 $84,758
Mar 4,113 $33,226 5,119 $41,960 5,677 $47,117 8,916 $80,597
April 4,290 $34,599 5,099 $41,988 5,654 $47,118 9,098 $84,599
May 4,236 $34,892 5,109 $43,587 5,706 $47,528 9,226 $85035
June 4,351 $29,199 5,154 $42,442 5,720 $47,625 9,264 $84,239
TOTAL 50,314 $528,062 57,390 $465,713 64,891 $536,884 93,907 $830,454 66,876 $562,237
Monthly average
4,193 $44,005 4,783 $38,809 5,408 $44,740 7,526 $69,204 9,554
$80,320

8
TANF
Temporary Assistance of Needy Families (TANF) Cases by Administrative Office
Jan 14 – Jan 15 Dec 14 – Jan 15
Office Jan-14 Dec-14 Jan-15 # change % change # change % change
Chaves 565 610 586 21 3.7% -24 -3.9%
Cibola 224 221 212 -12 -5.4% -9 -4.1%
Colfax 94 99 98 4 4.3% -1 -1.0%
Curry 429 574 547 118 27.5% -27 -4.7%
East Dona Ana 648 621 590 -58 -9.0% -31 -5.0%
Eddy Artesia 130 114 120 -10 -7.7% 6 5.3%
Eddy Carlsbad 245 268 267 22 9.0% -1 -0.4%
Grant 209 262 238 29 13.9% -24 -9.2%
Guadalupe 51 41 38 -13 -25.5% -3 -7.3%
Hidalgo 26 20 18 -8 -30.8% -2 -10.0%
Lea 361 406 404 43 11.9% -2 -0.5%
Lincoln 141 104 95 -46 -32.6% -9 -8.7%
Luna 310 276 253 -57 -18.4% -23 -8.3%
McKinley* 77 108 109 32 41.6% 1 0.9%
Northeast Bernalillo 986 1,155 1,131 145 14.7% -24 -2.1%
Northwest Bernalillo 951 874 872 -79 -8.3% -2 -0.2%
Otero 292 281 265 -27 -9.2% -16 -5.7%
Quay 97 84 83 -14 -14.4% -1 -1.2%
Rio Arriba 516 499 490 -26 -5.0% -9 -1.8%
Roosevelt 106 152 146 40 37.7% -6 -3.9%
San Juan 236 227 233 -3 -1.3% 6 2.6%
San Miguel 286 294 297 11 3.8% 3 1.0%
Sandoval 558 660 626 68 12.2% -34 -5.2%
Santa Fe 560 638 643 83 14.8% 5 0.8%
Sierra 131 112 112 -19 -14.5% 0 0.0%
Socorro 159 140 140 -19 -11.9% 0 0.0%
South Dona Ana 940 913 881 -59 -6.3% -32 -3.5%
Southeast Bernalillo 875 938 926 51 5.8% -12 -1.3%
Southwest Bernalillo 1,154 1,521 1,477 323 28.0% -44 -2.9%
Taos 154 178 168 14 9.1% -10 -5.6%
Torrance 247 204 202 -45 -18.2% -2 -1.0%
Union 16 0 0 -16 -100.0% 0 N/A
Valencia North 377 439 419 42 11.1% -20 -4.6%
Valencia South 213 226 221 8 3.8% -5 -2.2%
West Dona Ana 974 891 866 -108 -11.1% -25 -2.8%
Centralized Units 27 1 1 -26 -96.3% 0 0.0%
TOTAL 13,365 14,151 13,774 409 3.1% -377 -2.7%
*Cases from Zuni Office are included in the McKinley Office count.

9 TANF
Temporary Assistance of Needy Families (TANF) Cases by Region
Jan 14 – Jan 15 Dec 14 – Jan 15
Region Jan-14 Dec-14 Jan-15 # change % change # change % change
NW Region 1 1,417 813 820 -597 -42.1% 7 0.9%
NE Region 2 2,332 3,153 3,069 737 31.6% -84 -2.7%
Central Region 3 4,213 4,692 4,608 395 9.4% -84 -1.8%
SE Region 4 1,977 2,228 2,165 188 9.5% -63 -2.8%
SW Region 5 3,399 3,264 3,111 -288 -8.5% -153 -4.7%
Centralized Units 27 1 1 -26 -96.3% 0 0.0%
TOTAL 13,365 14,151 13,774 409 3.1% -377 -2.7%

10
NMWorks
Intensive Case Management, Recovery and Employment (ICARE)
The ICARE program began as a pilot program in Albuquerque and is designed to address substance use barriers to
employment in TANF Recipients. The ICARE program now provides services in Albuquerque and Rio Arriba County.
It is a new approach that combines 12 weeks of Intensive Case Management with job readiness classes and job development.
TANF recipients identified as having substance use issues that prevent them from obtaining and retaining employment are referred to
the ICARE program. The program includes motivational interviewing to motivate change and decrease substance use; relapse
prevention to build skills; family management to improve family functioning; job readiness classes to enhance employment skills and
increase retention; and job development to secure employment. A program evaluation component will be used to determine the
effectiveness of this program in addressing substance use disorders among TANF recipients.
Feb-14 Mar-14 Apr-14 May-14 Jun-14 Jul-14 Aug-14 Sep-14 Oct-14 Nov-14 Dec-14 Jan-15
ICARE
Expenditures$148,154 $70,063 $152,947 $96,771 $222,332 $51,805 $78,513 $75,415 $75,354 $128,591 $131,348 $120,972
# of Screenings for
Substance Use390 523 587 451 16 489 333 387 343 274 373 380
# of Referrals to
ICARE resulting
from screenings
22 55 110 27 8 5 13 14 18 10 32 22
11
NMWorks
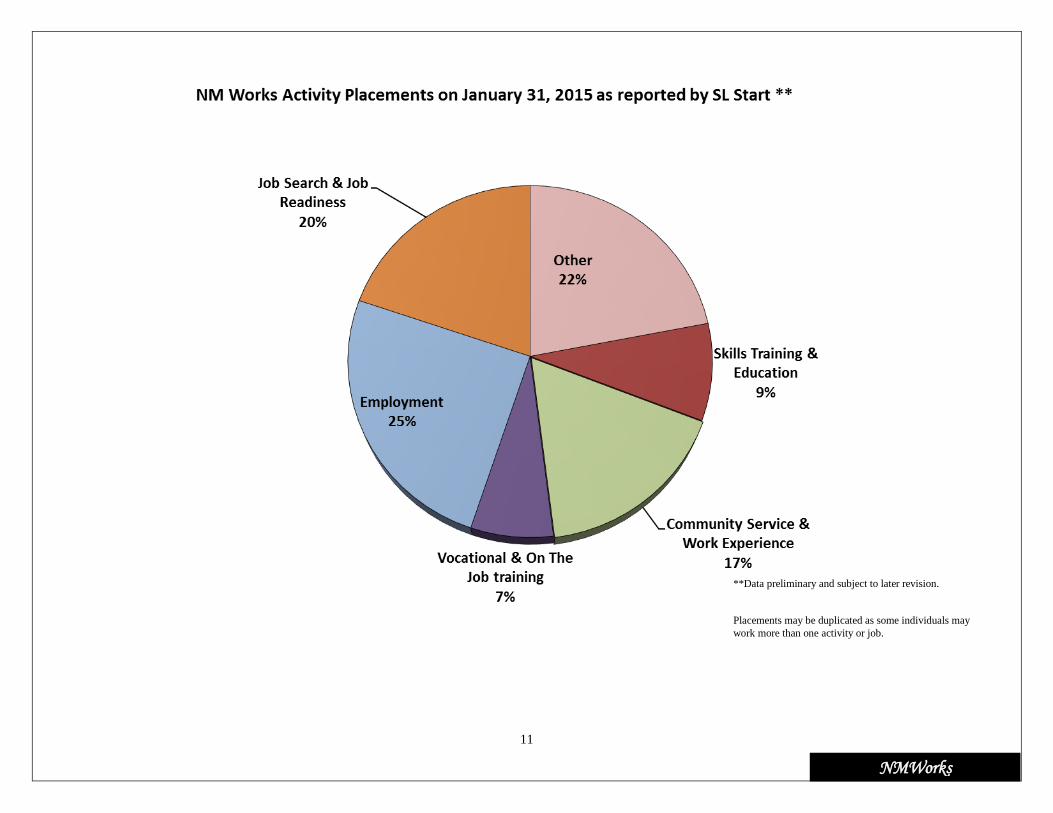
**Data preliminary and subject to later revision.
Placements may be duplicated as some individuals may
work more than one activity or job.

12
NMWorks
Employment placements may be duplicated as some individuals
may work more than one job.
13 Diversion
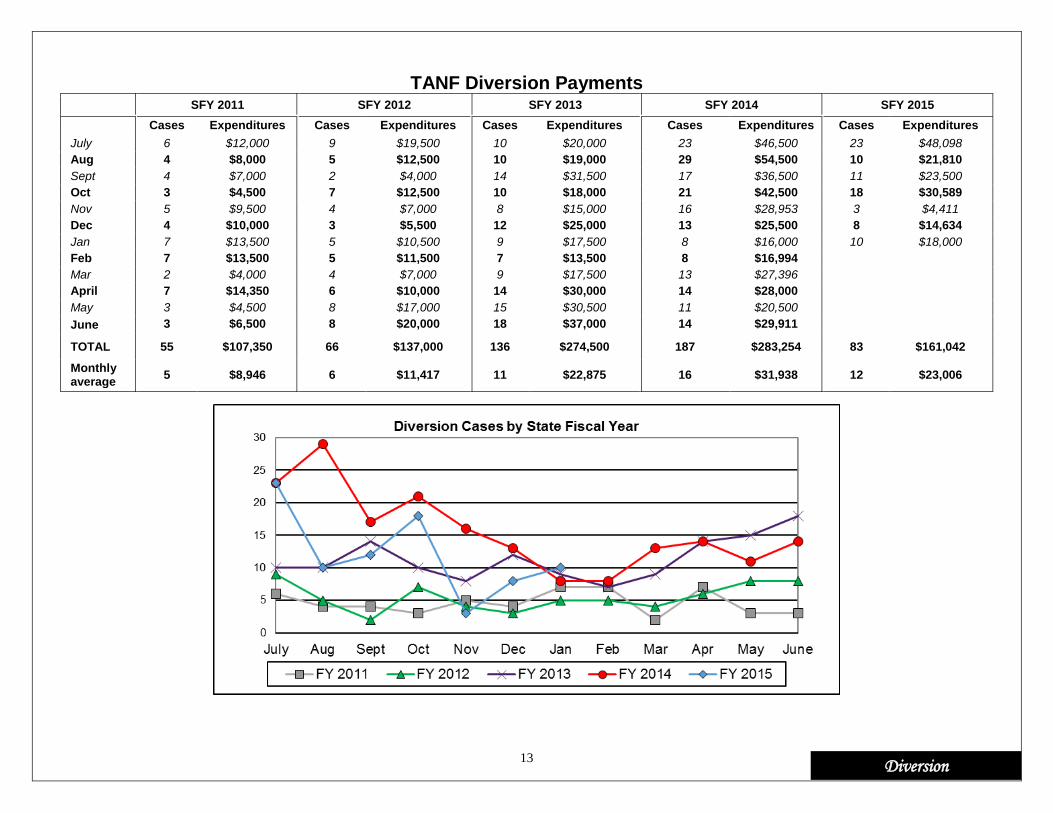
TANF Diversion Payments SFY 2011 SFY 2012 SFY 2013 SFY 2014 SFY 2015
Cases Expenditures Cases Expenditures Cases Expenditures Cases Expenditures Cases Expenditures
July 6 $12,000 9 $19,500 10 $20,000 23 $46,500 23 $48,098
Aug 4 $8,000 5 $12,500 10 $19,000 29 $54,500 10 $21,810
Sept 4 $7,000 2 $4,000 14 $31,500 17 $36,500 11 $23,500
Oct 3 $4,500 7 $12,500 10 $18,000 21 $42,500 18 $30,589
Nov 5 $9,500 4 $7,000 8 $15,000 16 $28,953 3 $4,411
Dec 4 $10,000 3 $5,500 12 $25,000 13 $25,500 8 $14,634
Jan 7 $13,500 5 $10,500 9 $17,500 8 $16,000 10 $18,000
Feb 7 $13,500 5 $11,500 7 $13,500 8 $16,994
Mar 2 $4,000 4 $7,000 9 $17,500 13 $27,396
April 7 $14,350 6 $10,000 14 $30,000 14 $28,000
May 3 $4,500 8 $17,000 15 $30,500 11 $20,500
June 3 $6,500 8 $20,000 18 $37,000 14 $29,911
TOTAL 55 $107,350 66 $137,000 136 $274,500 187 $283,254 83 $161,042
Monthly average
5 $8,946 6 $11,417 11 $22,875 16 $31,938 12 $23,006
14
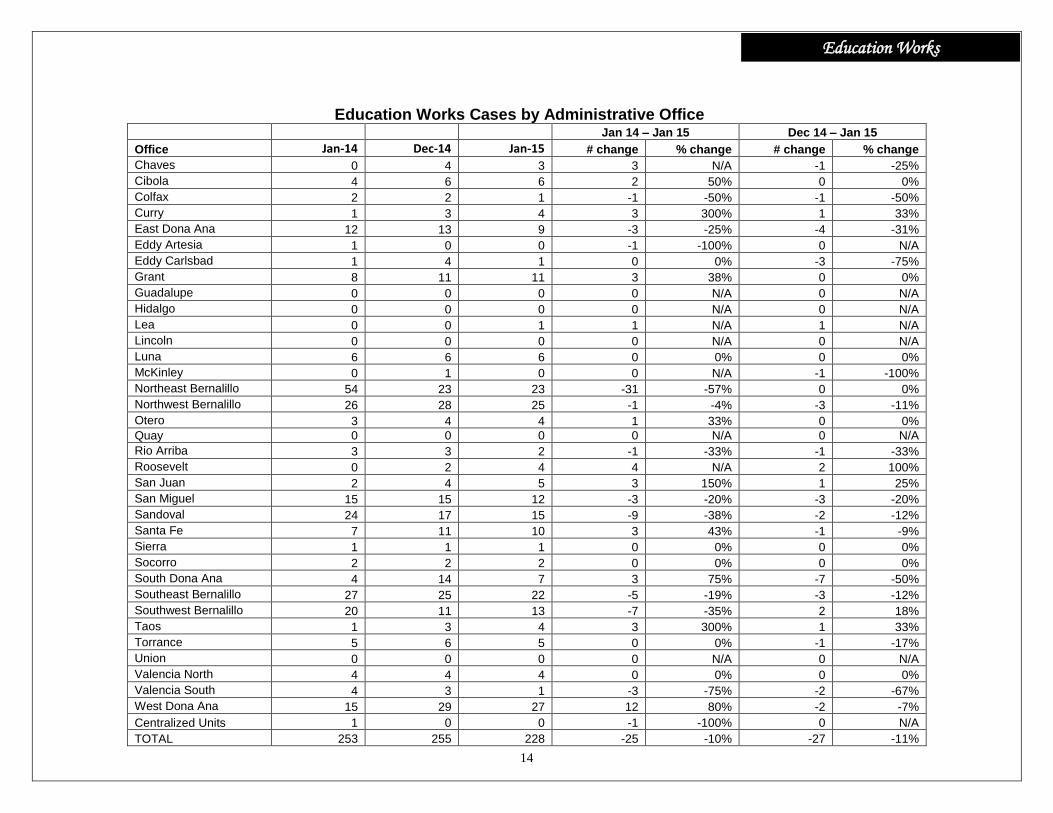
Education Works
Education Works Cases by Administrative Office Jan 14 – Jan 15 Dec 14 – Jan 15
Office Jan-14 Dec-14 Jan-15 # change % change # change % change
Chaves 0 4 3 3 N/A -1 -25%
Cibola 4 6 6 2 50% 0 0%
Colfax 2 2 1 -1 -50% -1 -50%
Curry 1 3 4 3 300% 1 33%
East Dona Ana 12 13 9 -3 -25% -4 -31%
Eddy Artesia 1 0 0 -1 -100% 0 N/A
Eddy Carlsbad 1 4 1 0 0% -3 -75%
Grant 8 11 11 3 38% 0 0%
Guadalupe 0 0 0 0 N/A 0 N/A
Hidalgo 0 0 0 0 N/A 0 N/A
Lea 0 0 1 1 N/A 1 N/A
Lincoln 0 0 0 0 N/A 0 N/A
Luna 6 6 6 0 0% 0 0%
McKinley 0 1 0 0 N/A -1 -100%
Northeast Bernalillo 54 23 23 -31 -57% 0 0%
Northwest Bernalillo 26 28 25 -1 -4% -3 -11%
Otero 3 4 4 1 33% 0 0%
Quay 0 0 0 0 N/A 0 N/A
Rio Arriba 3 3 2 -1 -33% -1 -33%
Roosevelt 0 2 4 4 N/A 2 100%
San Juan 2 4 5 3 150% 1 25%
San Miguel 15 15 12 -3 -20% -3 -20%
Sandoval 24 17 15 -9 -38% -2 -12%
Santa Fe 7 11 10 3 43% -1 -9%
Sierra 1 1 1 0 0% 0 0%
Socorro 2 2 2 0 0% 0 0%
South Dona Ana 4 14 7 3 75% -7 -50%
Southeast Bernalillo 27 25 22 -5 -19% -3 -12%
Southwest Bernalillo 20 11 13 -7 -35% 2 18%
Taos 1 3 4 3 300% 1 33%
Torrance 5 6 5 0 0% -1 -17%
Union 0 0 0 0 N/A 0 N/A
Valencia North 4 4 4 0 0% 0 0%
Valencia South 4 3 1 -3 -75% -2 -67%
West Dona Ana 15 29 27 12 80% -2 -7%
Centralized Units 1 0 0 -1 -100% 0 N/A
TOTAL 253 255 228 -25 -10% -27 -11%
15
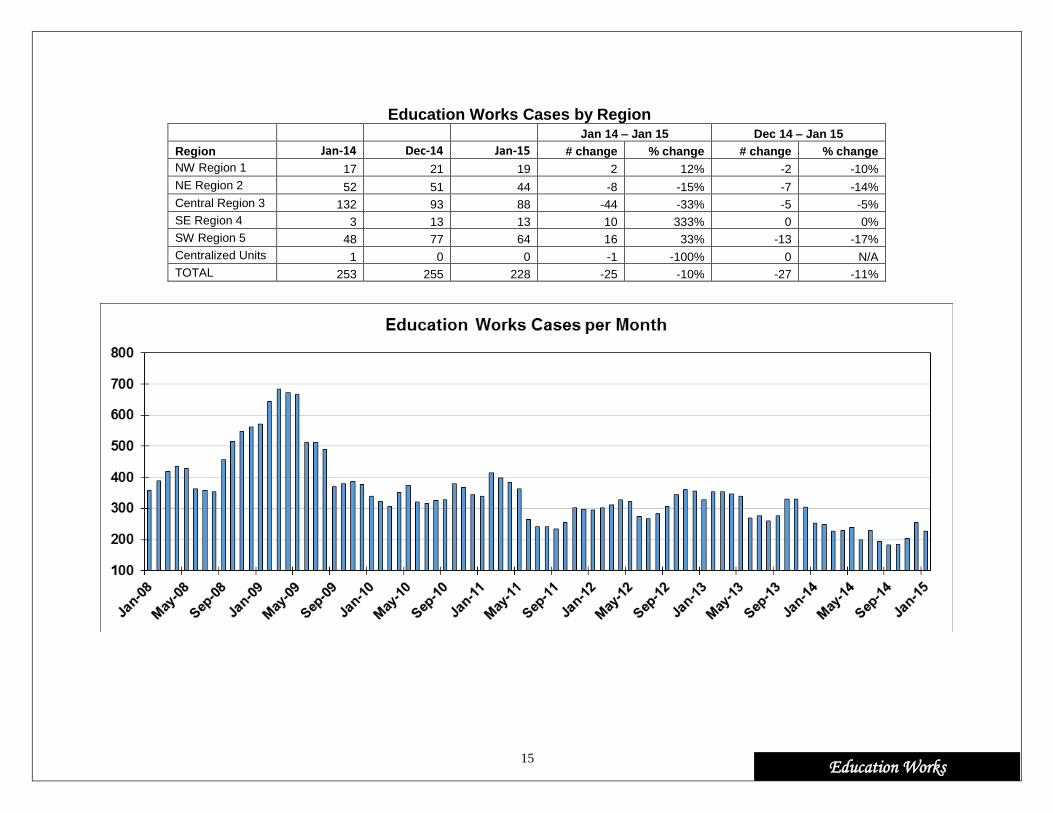
Education Works
Education Works Cases by Region Jan 14 – Jan 15 Dec 14 – Jan 15
Region Jan-14 Dec-14 Jan-15 # change % change # change % change
NW Region 1 17 21 19 2 12% -2 -10%
NE Region 2 52 51 44 -8 -15% -7 -14%
Central Region 3 132 93 88 -44 -33% -5 -5%
SE Region 4 3 13 13 10 333% 0 0%
SW Region 5 48 77 64 16 33% -13 -17%
Centralized Units 1 0 0 -1 -100% 0 N/A
TOTAL 253 255 228 -25 -10% -27 -11%

16
GA
General Assistance (GA) Cases by Administrative Office Jan 14 – Jan 15 Dec 14 – Jan 15
Office Jan-14 Dec-14 Jan-15 # change % change # change % change
Chaves 82 101 96 14 17% -5 -5%
Cibola 51 49 55 4 8% 6 12%
Colfax 39 46 46 7 18% 0 0%
Curry 60 72 75 15 25% 3 4%
East Dona Ana 85 93 88 3 4% -5 -5%
Eddy Artesia 16 17 18 2 13% 1 6%
Eddy Carlsbad 59 76 74 15 25% -2 -3%
Grant 54 76 74 20 37% -2 -3%
Guadalupe 29 30 32 3 10% 2 7%
Hidalgo 12 3 7 -5 -42% 4 133%
Lea 47 48 49 2 4% 1 2%
Lincoln 21 27 30 9 43% 3 11%
Luna 39 41 42 3 8% 1 2%
McKinley 21 15 15 -6 -29% 0 0%
Northeast Bernalillo 470 357 383 -87 -19% 26 7%
Northwest Bernalillo 353 232 234 -119 -34% 2 1%
Otero 51 46 51 0 0% 5 11%
Quay 36 31 30 -6 -17% -1 -3%
Rio Arriba 137 131 127 -10 -7% -4 -3%
Roosevelt 14 13 16 2 14% 3 23%
San Juan 70 72 69 -1 -1% -3 -4%
San Miguel 127 128 132 5 4% 4 3%
Sandoval 127 135 131 4 3% -4 -3%
Santa Fe 265 217 221 -44 -17% 4 2%
Sierra 32 26 26 -6 -19% 0 0%
Socorro 56 59 57 1 2% -2 -3%
South Dona Ana 37 39 42 5 14% 3 8%
Southeast Bernalillo 200 222 204 4 2% -18 -8%
Southwest Bernalillo 239 261 266 27 11% 5 2%
Taos 93 72 78 -15 -16% 6 8%
Torrance 33 61 63 30 91% 2 3%
Union 8 - - -8 -100% 0 N/A
Valencia North 89 72 74 -15 -17% 2 3%
Valencia South 56 65 67 11 20% 2 3%
West Dona Ana 125 155 152 27 22% -3 -2%
Centralized Units 9 1 - -9 -100% -1 -100%
TOTAL 3,242 3,089 3,124 -118 -4% 35 1%

17
GA
General Assistance (GA) Cases by Region
Jan 14 – Jan 15 Dec 14 – Jan 15
Region Jan-14 Dec-14 Jan-15 # change % change # change % change
NW Region 1 375 223 232 -143 -38% 9 4%
NE Region 2 861 925 928 67 8% 3 0%
Central Region 3 1,295 1,133 1,150 -145 -11% 17 2%
SE Region 4 299 354 358 59 20% 4 1%
SW Region 5 403 453 456 53 13% 3 1%
Centralized Units 9 1 0 -9 -100% -1 -100%
TOTAL 3,242 3,089 3,124 -118 -4% 35 1%

18
GA IAR
GA Interim Assistance Reimbursements
SFY 12 SFY 13 SFY 14 SFY 15
Cases Amount Cases Amount Cases Amount Cases Amount
July 77 $224,022 105 $254,087 87 $185,368 67 $144,679
August 100 $256,766 88 $248,471 70 $184,639 77 $244,233
September 68 $159,712 101 $233,341 102 $268,243 78 $168,421
October 60 $158,539 101 $293,784 87 $165,578 68 $182,265
November 60 $158,596 72 $193,152 65 $139,197 45 $134,482
December 74 $183,600 84 $236,221 49 $147,853 84 $239,926
January 91 $341,348 79 $209,922 63 $178,944 68 $227,066
February 113 $307,090 77 $178,441 53 $130,352
March 77 $186,834 85 $229,599 79 $176,756
April 102 $357,392 92 $240,540 56 $155,245
May 90 $230,243 126 $346,079 62 $138,827
June 57 $215,729 90 $225,355 108 $241,016
SFY Total 969 $2,779,871 1,100 $2,888,992 881 $2,112,017 487 $1,341,072
Monthly Average 81 $231,656 92 $240,749 73 $176,001 70 $191,582
IAR case figures reflect those with expected reimbursement amounts
above $0. Figures unreconciled and subject to change.

19
Refugee
Refugee Cash Assistance
SFY 12 SFY 13 SFY 14 SFY 15
Cases Payments Cases Payments Cases Payments Cases* Payments
July 15 $6,428 23 $7,155 48 $12,013 50 $11,679
August 9 $4,433 27 $7,742 58 $16,129 48 $11,760
September 5 $2,930 32 $8,267 68 $19,061 55 $13,094
October 5 $1,519 31 $9,803 75 $20,962 58 $13,726
November 10 $2,675 31 $9,552 70 $21,880 65 $16,461
December 9 $3,380 40 $10,435 73 $22,053 75 $18,699
January 12 $3,285 36 $11,489 79 $22,670 79 $19,009
February 13 $3,210 27 $11,107 90 $23,227
March 13 $3,739 30 $8,678 86 $21,808
April 23 $5,654 26 $9,410 79 $20,109
May 26 $7,579 26 $8,901 61 $15,703
June 22 $7,496 33 $9,535 61 $14,783
SFY Total 162 $52,328 363 $112,074 848 $230,398 430 $104,428
Monthly Average 14 $4,361 30 $9,340 71 $19,200 61 $14,918
* The RCA caseload has been updated.
20664
State Supplement for RC
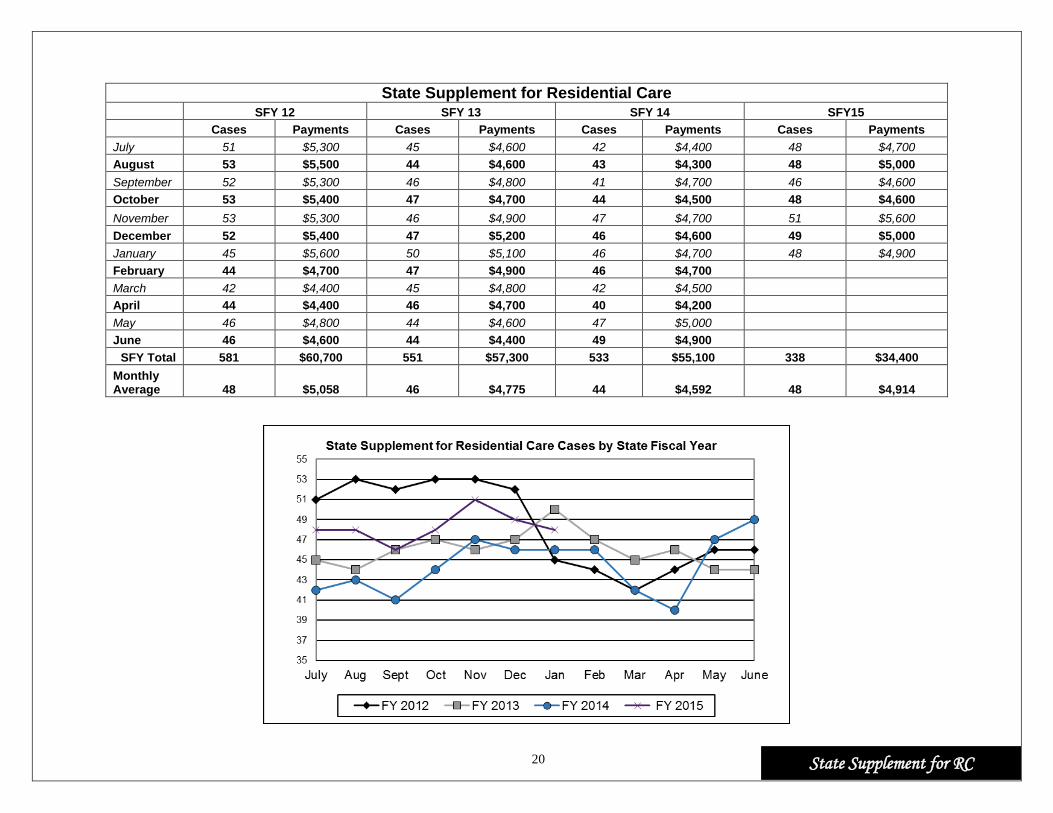
State Supplement for Residential Care
SFY 12 SFY 13 SFY 14 SFY15
Cases Payments Cases Payments Cases Payments Cases Payments
July 51 $5,300 45 $4,600 42 $4,400 48 $4,700
August 53 $5,500 44 $4,600 43 $4,300 48 $5,000
September 52 $5,300 46 $4,800 41 $4,700 46 $4,600
October 53 $5,400 47 $4,700 44 $4,500 48 $4,600
November 53 $5,300 46 $4,900 47 $4,700 51 $5,600
December 52 $5,400 47 $5,200 46 $4,600 49 $5,000
January 45 $5,600 50 $5,100 46 $4,700 48 $4,900
February 44 $4,700 47 $4,900 46 $4,700
March 42 $4,400 45 $4,800 42 $4,500
April 44 $4,400 46 $4,700 40 $4,200
May 46 $4,800 44 $4,600 47 $5,000
June 46 $4,600 44 $4,400 49 $4,900
SFY Total 581 $60,700 551 $57,300 533 $55,100 338 $34,400
Monthly Average 48 $5,058 46 $4,775 44 $4,592 48 $4,914
L2163EAP
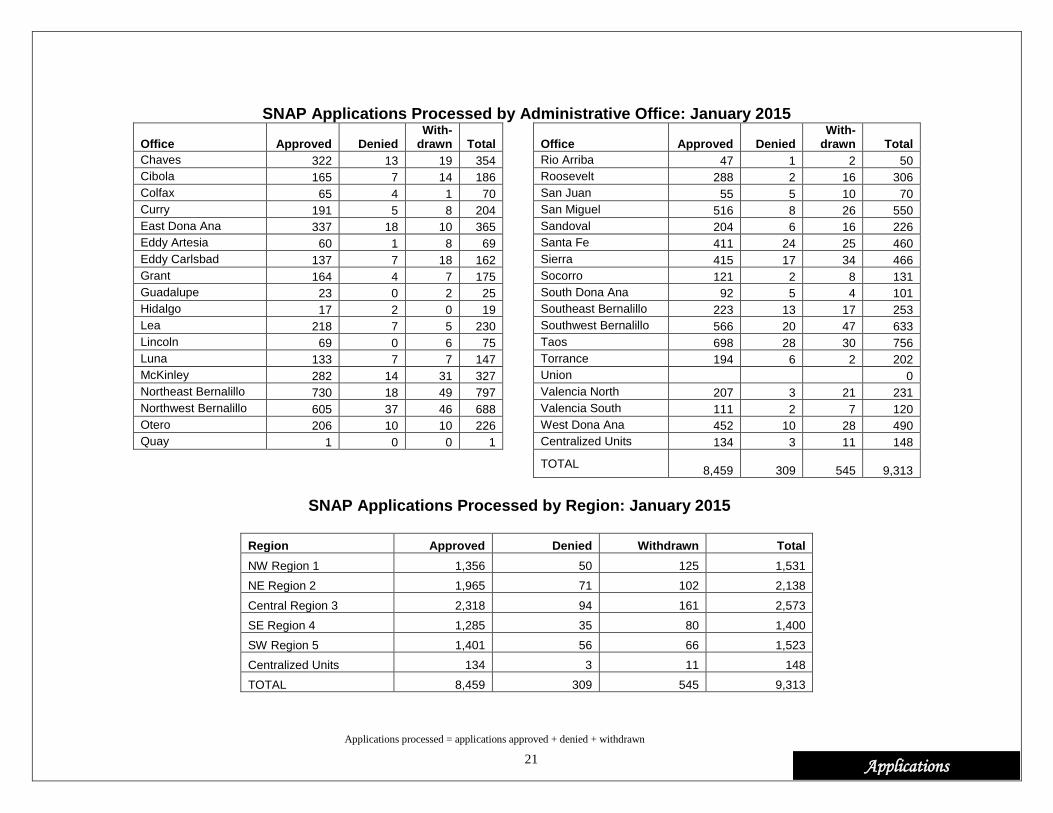
Applications
SNAP Applications Processed by Administrative Office: January 2015
Office Approved Denied With-
drawn Total Office Approved Denied With-
drawn Total
Chaves 322 13 19 354 Rio Arriba 47 1 2 50
Cibola 165 7 14 186 Roosevelt 288 2 16 306
Colfax 65 4 1 70 San Juan 55 5 10 70
Curry 191 5 8 204 San Miguel 516 8 26 550
East Dona Ana 337 18 10 365 Sandoval 204 6 16 226
Eddy Artesia 60 1 8 69 Santa Fe 411 24 25 460
Eddy Carlsbad 137 7 18 162 Sierra 415 17 34 466
Grant 164 4 7 175 Socorro 121 2 8 131
Guadalupe 23 0 2 25 South Dona Ana 92 5 4 101
Hidalgo 17 2 0 19 Southeast Bernalillo 223 13 17 253
Lea 218 7 5 230 Southwest Bernalillo 566 20 47 633
Lincoln 69 0 6 75 Taos 698 28 30 756
Luna 133 7 7 147 Torrance 194 6 2 202
McKinley 282 14 31 327 Union 0
Northeast Bernalillo 730 18 49 797 Valencia North 207 3 21 231
Northwest Bernalillo 605 37 46 688 Valencia South 111 2 7 120
Otero 206 10 10 226 West Dona Ana 452 10 28 490
Quay 1 0 0 1 Centralized Units 134 3 11 148
TOTAL
8,459 309 545
9,313
SNAP Applications Processed by Region: January 2015
Region Approved Denied Withdrawn Total
NW Region 1 1,356 50 125 1,531
NE Region 2 1,965 71 102 2,138
Central Region 3 2,318 94 161 2,573
SE Region 4 1,285 35 80 1,400
SW Region 5 1,401 56 66 1,523
Centralized Units 134 3 11 148
TOTAL 8,459 309 545 9,313
Applications processed = applications approved + denied + withdrawn
L22H63EAP
Applications
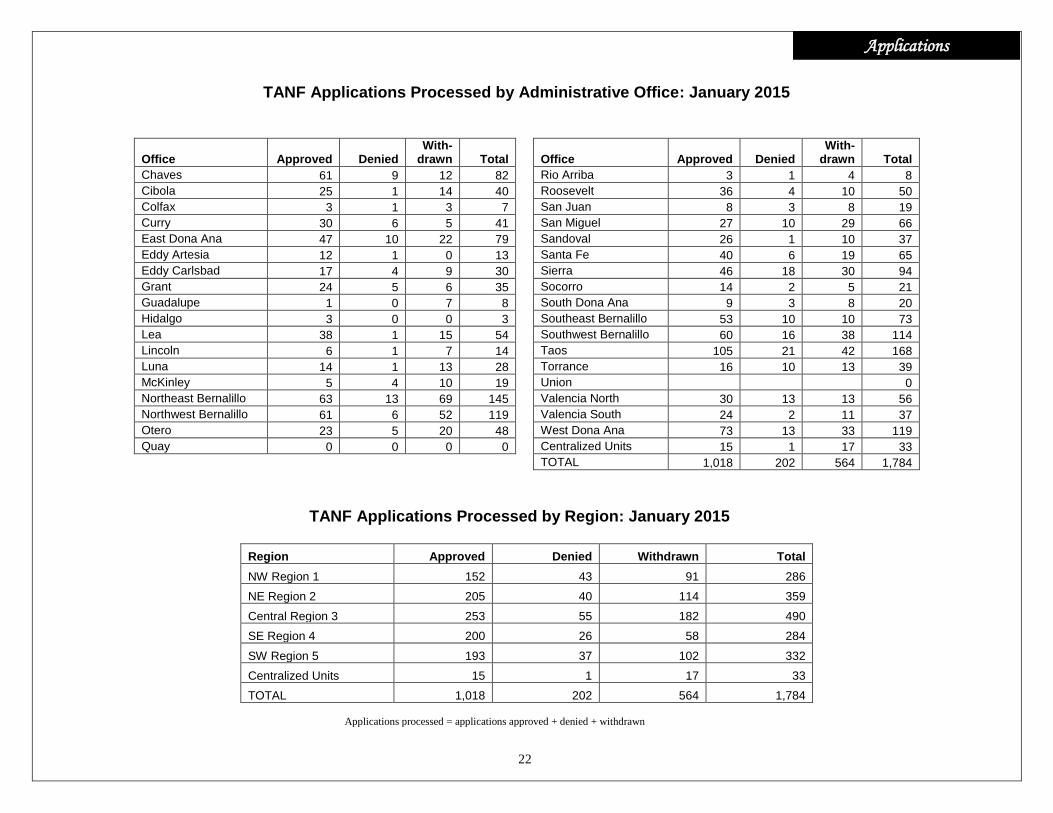
TANF Applications Processed by Administrative Office: January 2015
Office Approved Denied With-
drawn Total Office Approved Denied With-
drawn Total
Chaves 61 9 12 82 Rio Arriba 3 1 4 8
Cibola 25 1 14 40 Roosevelt 36 4 10 50
Colfax 3 1 3 7 San Juan 8 3 8 19
Curry 30 6 5 41 San Miguel 27 10 29 66
East Dona Ana 47 10 22 79 Sandoval 26 1 10 37
Eddy Artesia 12 1 0 13 Santa Fe 40 6 19 65
Eddy Carlsbad 17 4 9 30 Sierra 46 18 30 94
Grant 24 5 6 35 Socorro 14 2 5 21
Guadalupe 1 0 7 8 South Dona Ana 9 3 8 20
Hidalgo 3 0 0 3 Southeast Bernalillo 53 10 10 73
Lea 38 1 15 54 Southwest Bernalillo 60 16 38 114
Lincoln 6 1 7 14 Taos 105 21 42 168
Luna 14 1 13 28 Torrance 16 10 13 39
McKinley 5 4 10 19 Union 0
Northeast Bernalillo 63 13 69 145 Valencia North 30 13 13 56
Northwest Bernalillo 61 6 52 119 Valencia South 24 2 11 37
Otero 23 5 20 48 West Dona Ana 73 13 33 119
Quay 0 0 0 0 Centralized Units 15 1 17 33
TOTAL 1,018 202 564 1,784
TANF Applications Processed by Region: January 2015
Region Approved Denied Withdrawn Total
NW Region 1 152 43 91 286
NE Region 2 205 40 114 359
Central Region 3 253 55 182 490
SE Region 4 200 26 58 284
SW Region 5 193 37 102 332
Centralized Units 15 1 17 33
TOTAL 1,018 202 564 1,784
Applications processed = applications approved + denied + withdrawn
LH63EAP
23 Applications
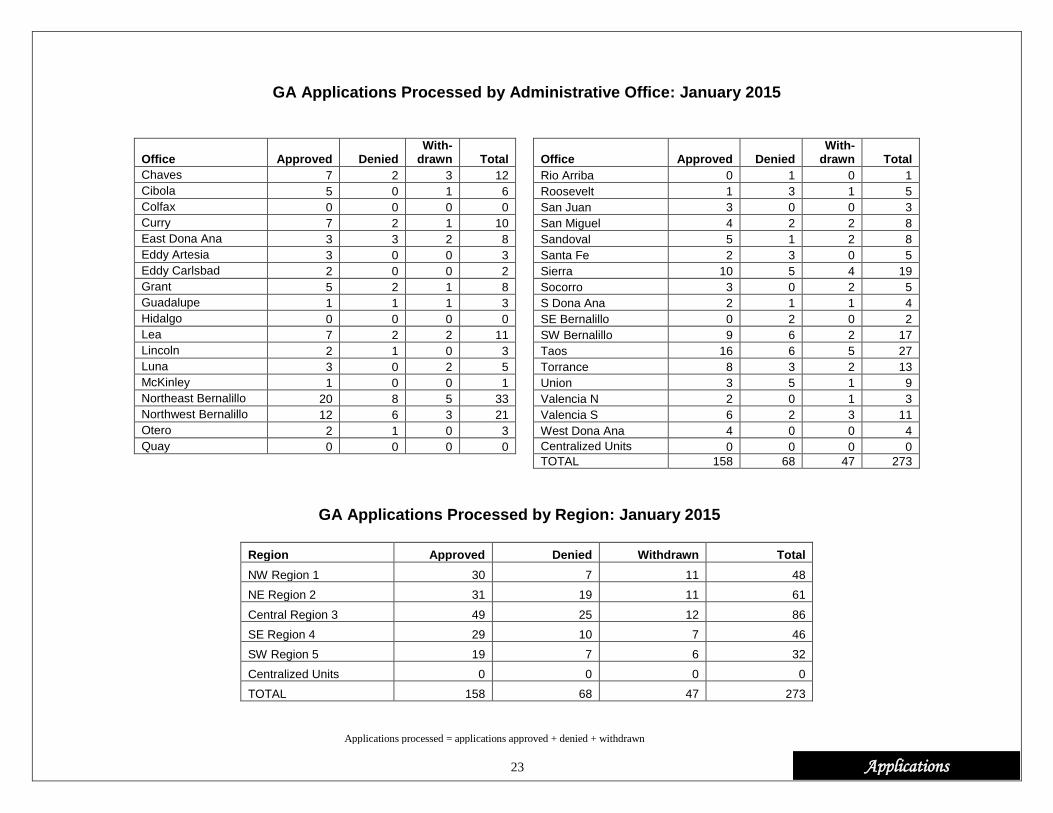
GA Applications Processed by Administrative Office: January 2015
Office Approved Denied With-
drawn Total Office Approved Denied With-
drawn Total
Chaves 7 2 3 12 Rio Arriba 0 1 0 1
Cibola 5 0 1 6 Roosevelt 1 3 1 5
Colfax 0 0 0 0 San Juan 3 0 0 3
Curry 7 2 1 10 San Miguel 4 2 2 8
East Dona Ana 3 3 2 8 Sandoval 5 1 2 8
Eddy Artesia 3 0 0 3 Santa Fe 2 3 0 5
Eddy Carlsbad 2 0 0 2 Sierra 10 5 4 19
Grant 5 2 1 8 Socorro 3 0 2 5
Guadalupe 1 1 1 3 S Dona Ana 2 1 1 4
Hidalgo 0 0 0 0 SE Bernalillo 0 2 0 2
Lea 7 2 2 11 SW Bernalillo 9 6 2 17
Lincoln 2 1 0 3 Taos 16 6 5 27
Luna 3 0 2 5 Torrance 8 3 2 13
McKinley 1 0 0 1 Union 3 5 1 9
Northeast Bernalillo 20 8 5 33 Valencia N 2 0 1 3
Northwest Bernalillo 12 6 3 21 Valencia S 6 2 3 11
Otero 2 1 0 3 West Dona Ana 4 0 0 4
Quay 0 0 0 0 Centralized Units 0 0 0 0
TOTAL 158 68 47 273
GA Applications Processed by Region: January 2015
Region Approved Denied Withdrawn Total
NW Region 1 30 7 11 48
NE Region 2 31 19 11 61
Central Region 3 49 25 12 86
SE Region 4 29 10 7 46
SW Region 5 19 7 6 32
Centralized Units 0 0 0 0
TOTAL 158 68 47 273
Applications processed = applications approved + denied + withdrawn
L24IH63EAP
Child Support
0
5,000
10,000
15,000
20,000
25,000
30,000
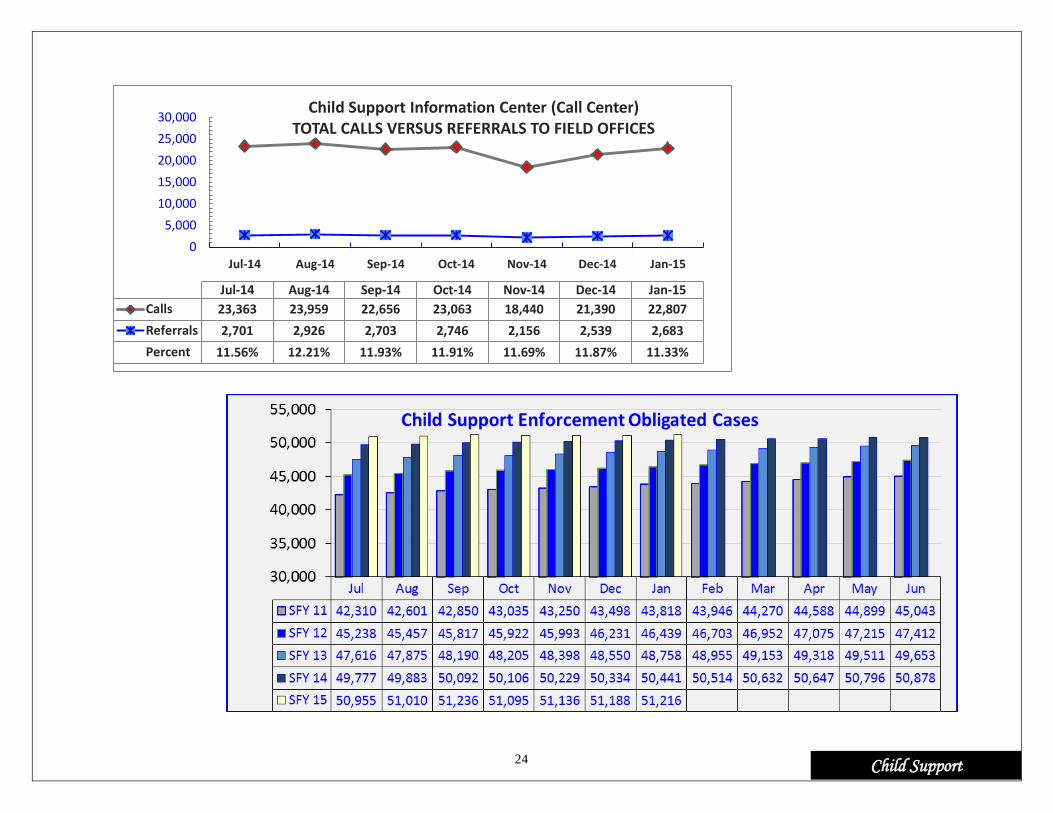
Jul-14 Aug-14 Sep-14 Oct-14 Nov-14 Dec-14 Jan-15
Jul-14 Aug-14 Sep-14 Oct-14 Nov-14 Dec-14 Jan-15
Calls 23,363 23,959 22,656 23,063 18,440 21,390 22,807
Referrals 2,701 2,926 2,703 2,746 2,156 2,539 2,683
Percent 11.56% 12.21% 11.93% 11.91% 11.69% 11.87% 11.33%
Child Support Information Center (Call Center) TOTAL CALLS VERSUS REFERRALS TO FIELD OFFICES
L25IH63EAP
Child Support

26
Child Care
Jan Feb Mar Apr May June July Aug Sep Oct Nov Dec Jan Change Fr. Last Year
County 2014 2014 2014 2014 2014 2014 2014 2014 2014 2014 2014 2014 2015 Cases Percent
Bernalillo 6,379 6,307 6,269 6,403 6,441 6,506 6,074 6,005 6,490 6,363 6,522 6,494 6,386 7 0.1%
Catron 2 0 0 0 0 0 0 0 0 0 0 0 0 -2 0.0%
Chaves 690 703 700 694 688 741 660 664 718 685 673 684 700 10 1.4%
Cibola 244 236 224 224 216 225 201 193 231 242 264 247 265 21 8.6%
Colfax 57 57 54 61 58 63 54 56 58 63 68 66 64 7 12.3%
Curry 423 388 399 397 399 408 411 413 416 393 397 380 377 -46 -10.9%
De Baca 15 13 17 19 15 13 9 9 18 23 21 24 27 12 80.0%
Dona Ana 4,520 4,310 4,389 4,373 4,391 4,438 3,777 3,729 3,938 4,003 4,068 4,004 3,922 -598 -13.2%
Eddy 242 221 229 249 230 250 238 255 260 233 219 213 220 -22 -9.1%
Grant 302 257 283 284 263 275 186 188 245 209 217 206 201 -101 -33.4%
Guadalupe 24 28 25 25 24 26 25 34 32 33 33 34 36 12 50.0%
Harding 0 0 0 0 0 0 0 0 0 0 0 0 0 0 0.0%
Hidalgo 33 29 31 30 29 27 24 21 22 22 16 17 28 -5 -15.2%
Lea 588 590 567 565 578 604 540 558 623 573 581 533 576 -12 -2.0%
Lincoln 154 138 132 133 122 135 111 110 121 141 133 130 119 -35 -22.7%
Los Alamos 16 14 15 15 14 13 11 11 12 11 12 10 11 -5 -31.3%
Luna 152 156 160 155 154 162 146 142 157 149 141 146 158 6 3.9%
McKinley 209 187 185 174 171 176 125 133 180 178 178 187 182 -27 -12.9%
Mora 20 19 19 17 15 17 17 17 19 20 22 15 12 -8 -40.0%
Otero 488 481 490 490 491 481 428 435 464 480 471 463 458 -30 -6.1%
Out of State 4 4 3 3 7 3 3 3 3 1 1 1 1 -3 -75.0%
Quay 19 15 15 19 18 19 22 25 23 29 35 32 24 5 26.3%
Rio Arriba 113 102 102 105 110 119 123 123 133 114 117 127 128 15 13.3%
Roosevelt 145 128 127 126 133 129 120 126 131 117 118 114 107 -38 -26.2%
San Juan 658 654 680 681 696 695 636 605 756 699 723 732 717 59 9.0%
San Miguel 375 355 351 354 354 337 319 310 286 343 365 357 343 -32 -8.5%
Sandoval 702 680 658 674 689 729 686 670 713 645 646 656 660 -42 -6.0%
Santa Fe 397 368 395 407 398 416 333 320 374 383 419 411 414 17 4.3%
Sierra 69 60 67 72 73 79 65 63 51 47 48 65 67 -2 -2.9%
Socorro 59 44 42 42 42 48 39 47 52 51 44 48 44 -15 -25.4%
Taos 96 92 97 105 102 108 91 89 100 90 96 95 87 -9 -9.4%
Torrance 66 73 69 73 74 81 73 77 67 73 74 70 61 -5 -7.6%
Union 6 8 8 9 9 8 7 7 7 7 8 9 9 3 50.0%
Valencia 584 577 557 557 572 572 502 480 532 502 517 514 511 -73 -12.5%
Totals 17,851 17,294 17,359 17,535 17,576 17,903 16,056 15,918 17,232 16,922 17,247 17,084 16,915 -936 -5.2%
Children Youth and Families Department
Children Receiving Child Care Assistance Subsidies By County
Source: Children Youth and Families Department

L27IH63EAP
Child Care
Child Care Assistance Eligibility Programs
MONTH FEB'14 MAR'14 APR'14 MAY'14 JUNE'14 JULY'14 AUG'14 SEP'14 OCT'14 NOV'14 DEC'14 JAN'15
TANF (Child Care Priority 1 Clients)
CLIENTS
1,983 1,904 1,899 1,847 1,828 1,735 1,694 1,887 1,893 1,890 1,861 1,830
COST
$684,343 $700,476 $712,766 $688,357 $625,723 $701,198 $764,547 $763,225 $846,366 $837,139 $828,334 $772,268
TANF AVERAGE COST
$345 $368 $375 $373 $342 $404 $451 $404 $447 $443 $445 $422
TRANSITION OFF TANF (Child Care Priority 2 Clients)
CLIENTS
264 233 205 189 169 124 139 139 134 153 155 170
COST
$86,531 $82,137 $69,991 $64,610 $54,026 $47,325 $62,594 $51,195 $59,203 $65,672 $69,196 $70,745
TRAN OFF TANF AVG COST
$328 $353 $341 $342 $320 $382 $450 $368 $442 $429 $446 $416
TANF ELIGIBLE (Child Care Priority 1B Clients at or below 100% of the Federal Poverty Level)
CLIENTS
8,201 8,233 8,388 8,442 8,654 7,404 7,330 8,105 7,951 8,089 7,943 7,794
COST
$2,802,076 $2,988,010 $3,037,173 $3,075,650 $2,875,589 $2,983,688 $3,252,127 $3,088,000 $3,518,430 $3,514,892 $3,466,510 $3,096,046
TANF ELIGIBLE AVG COST
$342 $363 $362 $364 $332 $403 $444 $381 $443 $435 $436 $397
INCOME ELIGIBLE (Child Care Priority 3, and Priority 4 Clients )
CLIENTS
6,160 6,256 6,305 6,309 6,427 5,918 5,850 6,194 6,069 6,228 6,270 6,293
COST
$1,900,390 $1,952,541 $1,981,965 $1,986,620 $2,034,462 $2,149,148 $2,369,758 $2,168,501 $2,295,516 $2,333,389 $2,379,418 $2,334,419
INCOME ELIG AVG COST
$309 $312 $314 $315 $317 $363 $405 $350 $378 $375 $379 $371
CHILD PROTECTIVE SERVICES (Child Care CPS Clients)
CLIENTS
686 733 738 789 825 875 905 907 875 887 855 828
COST
$303,886 $314,658 $332,742 $354,961 $356,258 $395,879 $459,913 $463,513 $459,023 $456,941 $448,469 $436,323
CPS AVG COST
$443 $429 $451 $450 $432 $452 $508 $511 $525 $515 $525 $527
GRAND TOTAL - ALL CHILD CARE PROGRAMS
CLIENTS
17,294 17,359 17,535 17,576 17,903 16,056 15,918 17,232 16,922 17,247 17,084 16,915
COST
$5,777,227 $6,037,822 $6,134,637 $6,170,197 $5,946,058 $6,277,239 $6,908,940 $6,534,435 $7,178,539 $7,208,033 $7,191,927 $6,709,801
ALL PROGRAMS AVG COST $334 $348 $350 $351 $332 $391 $434 $379 $424 $418 $421 $397
Notes: 1. This table is provided by the Children, Youth and Families Department. 2. All costs in the table are average costs 3. Clients served and cost reflects total CYFD program funds and are not limited to funding provided by the Human Services Department.
28
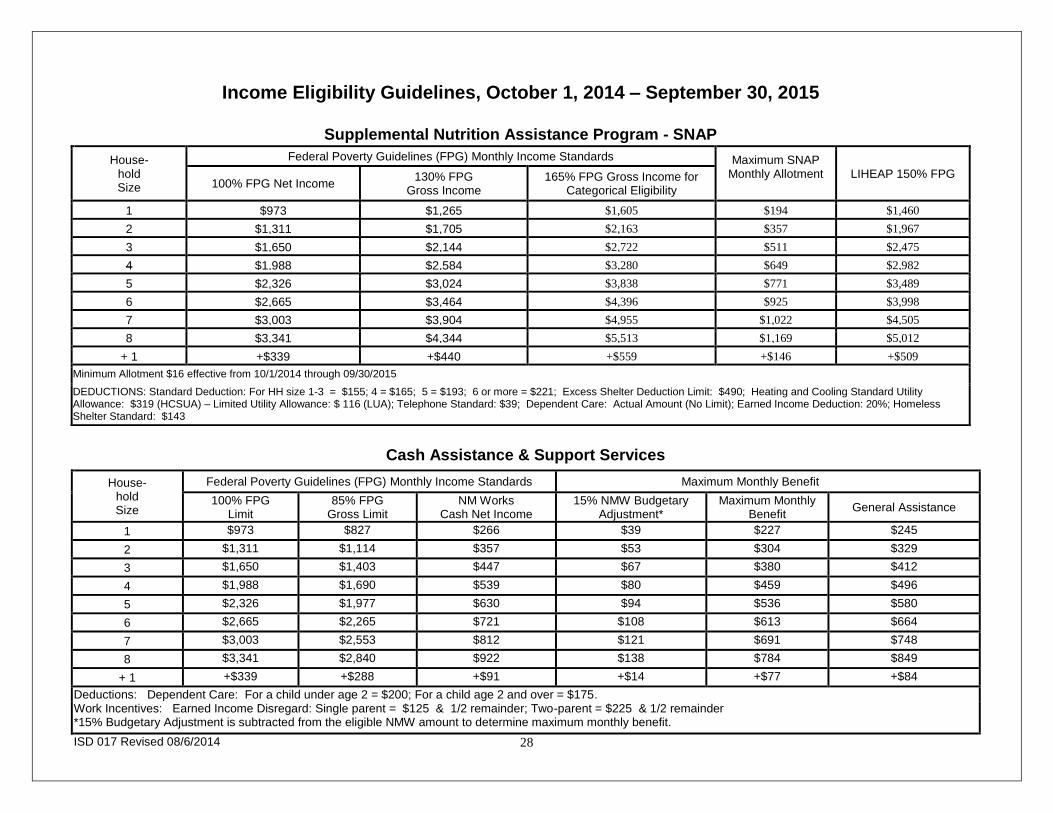
Income Eligibility Guidelines, October 1, 2014 – September 30, 2015
Supplemental Nutrition Assistance Program - SNAP
House- hold Size
Federal Poverty Guidelines (FPG) Monthly Income Standards Maximum SNAP Monthly Allotment
LIHEAP 150% FPG
100% FPG Net Income 130% FPG
Gross Income 165% FPG Gross Income for
Categorical Eligibility
1 $973 $1,265 $1,605 $194 $1,460
2 $1,311 $1,705 $2,163 $357 $1,967
3 $1,650 $2,144 $2,722 $511 $2,475
4 $1,988 $2,584 $3,280 $649 $2,982
5 $2,326 $3,024 $3,838 $771 $3,489
6 $2,665 $3,464 $4,396 $925 $3,998
7 $3,003 $3,904 $4,955 $1,022 $4,505
8 $3,341 $4,344 $5,513 $1,169 $5,012
+ 1 +$339 +$440 +$559 +$146 +$509
Minimum Allotment $16 effective from 10/1/2014 through 09/30/2015
DEDUCTIONS: Standard Deduction: For HH size 1-3 = $155; 4 = $165; 5 = $193; 6 or more = $221; Excess Shelter Deduction Limit: $490; Heating and Cooling Standard Utility Allowance: $319 (HCSUA) – Limited Utility Allowance: $ 116 (LUA); Telephone Standard: $39; Dependent Care: Actual Amount (No Limit); Earned Income Deduction: 20%; Homeless Shelter Standard: $143
Cash Assistance & Support Services
House- hold Size
Federal Poverty Guidelines (FPG) Monthly Income Standards Maximum Monthly Benefit
100% FPG Limit
85% FPG Gross Limit
NM Works Cash Net Income
15% NMW Budgetary Adjustment*
Maximum Monthly Benefit
General Assistance
1 $973 $827 $266 $39 $227 $245
2 $1,311 $1,114 $357 $53 $304 $329
3 $1,650 $1,403 $447 $67 $380 $412
4 $1,988 $1,690 $539 $80 $459 $496
5 $2,326 $1,977 $630 $94 $536 $580
6 $2,665 $2,265 $721 $108 $613 $664
7 $3,003 $2,553 $812 $121 $691 $748
8 $3,341 $2,840 $922 $138 $784 $849
+ 1 +$339 +$288 +$91 +$14 +$77 +$84
Deductions: Dependent Care: For a child under age 2 = $200; For a child age 2 and over = $175. Work Incentives: Earned Income Disregard: Single parent = $125 & 1/2 remainder; Two-parent = $225 & 1/2 remainder *15% Budgetary Adjustment is subtracted from the eligible NMW amount to determine maximum monthly benefit.
ISD 017 Revised 08/6/2014
29
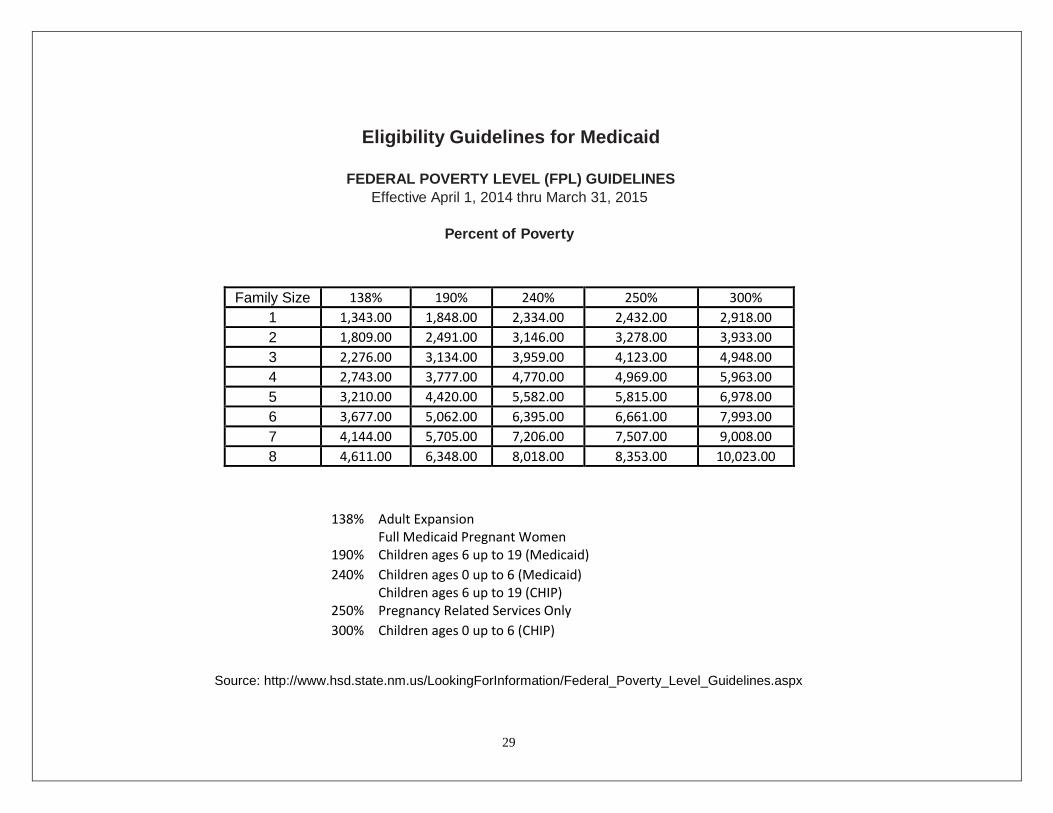
Eligibility Guidelines for Medicaid
FEDERAL POVERTY LEVEL (FPL) GUIDELINES
Effective April 1, 2014 thru March 31, 2015
Percent of Poverty
138% Adult Expansion
190% Full Medicaid Pregnant Women Children ages 6 up to 19 (Medicaid)
240% Children ages 0 up to 6 (Medicaid)
250% Children ages 6 up to 19 (CHIP) Pregnancy Related Services Only
300% Children ages 0 up to 6 (CHIP)
Source: http://www.hsd.state.nm.us/LookingForInformation/Federal_Poverty_Level_Guidelines.aspx
Family Size 138% 190% 240% 250% 300%
1 1,343.00 1,848.00 2,334.00 2,432.00 2,918.00
2 1,809.00 2,491.00 3,146.00 3,278.00 3,933.00
3 2,276.00 3,134.00 3,959.00 4,123.00 4,948.00
4 2,743.00 3,777.00 4,770.00 4,969.00 5,963.00
5 3,210.00 4,420.00 5,582.00 5,815.00 6,978.00
6 3,677.00 5,062.00 6,395.00 6,661.00 7,993.00
7 4,144.00 5,705.00 7,206.00 7,507.00 9,008.00
8 4,611.00 6,348.00 8,018.00 8,353.00 10,023.00

For a complete listing of field offices and other government and community resources: http://www.hsd.state.nm.us/LookingForAssistance/Field_Offices_1.aspx
New Mexico Human Services Department
Field Offices
Central Office (1)
Income Support Division County
Office (35)
Income Support Division Satellite
Office (2)
Child Support Enforcement Regional
Office (16)
Child Support Enforcement Satellite
Office (1)
Quality Control Office (8)
Indian Health Services (7)
Hospital Site (3)