an expert system-driven method for parametric … expert system-driven method for parametric...
TRANSCRIPT
An Expert System-Driven Method for Parametric
Trajectory Optimization During Conceptual Design
Patrick D. Dees∗ and Mathew R. Zwack†
Jacobs ESSSA Group, Huntsville, AL, 35806, United States
Michael Steffens‡, Stephen Edwards§, Manuel J. Diaz¶
Georgia Institute of Technology, Aerospace Systems Design Laboratory, Atlanta, GA, 30312, United States
James B. Holt‖
NASA, George C. Marshall Space Flight Center, AL, 35812, United States
During the early phases of engineering design, the costs committed are high, costsincurred are low, and the design freedom is high. It is well documented that decisionsmade in these early design phases drive the entire design’s life cycle cost. In a traditionalparadigm, key design decisions are made when little is known about the design. As thedesign matures, design changes become more difficult in both cost and schedule to en-act. The current capability-based paradigm, which has emerged because of the constrainedeconomic environment, calls for the infusion of knowledge usually acquired during laterdesign phases into earlier design phases, i.e. bringing knowledge acquired during prelim-inary and detailed design into pre-conceptual and conceptual design. An area of criticalimportance to launch vehicle design is the optimization of its ascent trajectory, as theoptimal trajectory will be able to take full advantage of the launch vehicle’s capability todeliver a maximum amount of payload into orbit. Hence, the optimal ascent trajectoryplays an important role in the vehicle’s affordability posture yet little of the informationrequired to successfully optimize a trajectory is known early in the design phase. Thus,the current paradigm of optimizing ascent trajectories involves generating point solutionsfor every change in a vehicle’s design parameters. This is often a very tedious, manual, andtime-consuming task for the analysts. Moreover, the trajectory design space is highly non-linear and multi-modal due to the interaction of various constraints. When these obstaclesare coupled with the Program to Optimize Simulated Trajectories (POST), an industrystandard program to optimize ascent trajectories that is difficult to use, expert trajectoryanalysts are required to effectively optimize a vehicle’s ascent trajectory. Over the courseof this paper, the authors discuss a methodology developed at NASA Marshall’s AdvancedConcepts Office to address these issues. The methodology is two-fold: first, capture theheuristics developed by human analysts over their many years of experience; and secondly,leverage the power of modern computing to evaluate multiple trajectories simultaneouslyand therefore enable the exploration of the trajectory’s design space early during the pre-conceptual and conceptual phases of design. This methodology is coupled with design ofexperiments in order to train surrogate models, which enables trajectory design space visu-alization and parametric optimal ascent trajectory information to be available when earlydesign decisions are being made.
∗Trajectory Engineer, Advanced Concepts Office, George C. Marshall Space Flight Center/ED04, Huntsville, AL, AIAAMember.†Systems Engineer, Advanced Concepts Office, George C. Marshall Space Flight Center/ED04, Huntsville, AL, AIAA
Member.‡PhD Candidate, School of Aerospace Engineering, 270 Ferst Drive, Mail Stop 0150, AIAA Student Member.§Research Engineer, School of Aerospace Engineering, 270 Ferst Drive, Mail Stop 0150, AIAA Member.¶Graduate Student, School of Aerospace Engineering, 270 Ferst Drive, Mail Stop 0150, AIAA Student Member.‖Lead Aerospace Engineer, Advanced Concepts Office, George C. Marshall Space Flight Center/ED04, Huntsville, AL
1 of 14
American Institute of Aeronautics and Astronautics
https://ntrs.nasa.gov/search.jsp?R=20150021408 2018-06-18T14:08:51+00:00Z

Nomenclature
DOE Design of ExperimentsPOST Program to Optimize Simulated TrajectoriesRSE Response Surface EquationSLS Space Launch SystemV &V Verification and Validation
I. Introduction
Launch vehicles are complex systems used to transport expensive, often one-of-a-kind payloads to earthorbit and beyond. Due to the challenges associated with earth to orbit launch, these vehicles frequentlyrequire billions of dollars to develop.1 Large development costs then translate to high prices to launch agiven payload, which can range from $50M-$500M per launch or $20k-$30k per kilogram.1,2 In today’sincreasingly budget-constrained environment, affordability is tantamount to the successful progression of anew launch vehicle program.
The Department of Defense Acquisition Guidebook defines affordability as the “degree to which thecapability benefits are worth the system’s total life-cycle cost”.3 In this sense, an affordable vehicle is onethat provides sufficient capability to meet the program requirements at a cost that will fit within budgetand schedule constraints. Improvement in affordability can thus be achieved by finding a balance betweenmaximum capability and minimum cost.
During early conceptual design, decisions are made to begin identification of a baseline vehicle. Withthe selection of a baseline concept the maximum expected performance of the vehicle will essentially belocked-in. Other vehicle metrics such as reliability, safety, manufacturability, and operations cost will alsobe impacted by concept down selection.4–7 Due to the broad effect of these early design decisions, upwardsof 80% of the vehicle’s life-cycle cost is committed during early design.4 Since affordability is a function oflife-cycle cost it will be profoundly impacted by the decisions made during conceptual design.
To improve vehicle affordability it is important that concept down selection be made using more designknowledge. Improvement in design knowledge can be achieved in multiple ways including the use of higherfidelity tools, a broader suite of disciplinary tools, and exploration of a large number of concepts. As anexample, for launch vehicles, exploration of large trade spaces can be achieved using the rocket equation forperformance estimation.6 This analysis simplifies the trajectory and structural analysis into a mass ratio andgravity constant. Thousands of vehicle concepts can be evaluated in this manner, but an accurate pictureof the expected vehicle performance requires the use of higher fidelity trajectory tools to accurately captureascent losses.
During conceptual design the trajectory analysis becomes a bottle-neck for all the other disciplines. Thisis due in part to the fact that the trajectory is heavily dependent upon these other disciplines. It is also dueto the complex nature of trajectory optimization tools, which more accurately capture ascent losses. Suchtrajectory tools do not offer a solution in a closed form like the rocket equation. Instead they require thesolution of an optimal control problem along the entire ascent trajectory, which can be very time consumingfor large trade spaces. For this reason, a middle ground is sought between the closed form rocket equationand more accurate but time consuming trajectory optimization tools. The desired approach will provide aclosed form solution in order to enable rapid evaluation of large trade spaces, while accurately accountingfor ascent losses.
The concept of surrogate modeling was identified as a candidate for representation of the trajectory dis-cipline. A surrogate model is a mathematical approximation of a set of data, usually from a computationallyexpensive analysis code.8 It utilizes a closed form equation to provide rapid estimates of the output of thedetailed analysis. Creation of a surrogate model for a trajectory optimization program will allow for theexploration of large design spaces, as done with the rocket equation, while simultaneously capturing ascentlosses.
2 of 14
American Institute of Aeronautics and Astronautics

II. Background
Prior to generating a surrogate model for the trajectory discipline the tool of interest must be identified.For launch vehicle conceptual design, trajectory optimization is typically performed using one of two tools:Program to Optimize Simulated Trajectories (POST) and Optimal Trajectories By Implicit Simulation(OTIS). These tools are both widely accepted by the launch vehicle design community and utilize directshooting and direct collocation optimization schemes, respectively.9 The POST tool will be used in thispaper because it is currently applied within the Advanced Concepts Office at Marshall Space Flight Centerto evaluate conceptual launch vehicles.10
In order to generate a surrogate model, data from POST is required. The amount of data required forthe model depends heavily upon the number of input variables of interest and the desired accuracy of themodel. Application of the model across a large trade space will require a data set that captures the behaviorof POST within the space. Since the trajectory space is expected to be highly multi-modal, it is expectedthat on the order of 1,000 points will be required to generate a surrogate model with an acceptable level ofaccuracy.
The primary challenge for creating a surrogate model lies in the generation of the initial data set. Thischallenge is due to the difficulty associated with closing cases in POST. For an experienced POST analystit may be possible to close up to 5 unique vehicles in one day. At this rate, generating enough data for aPOST surrogate would take many months. Therefore, the goal of this work is to develop an approach forautomating the closure of unique vehicle cases in POST. This will ultimately enable creation of a POSTsurrogate for use during a conceptual design study.
To begin the development of a POST automation approach, requirements for the method will be derived.As noted above, closing cases by hand in POST can prove to be difficult due to failed trajectories andprogram crashes. Therefore the first requirement states that the automation method must be able to handlefailed trajectories and POST crashes without requiring an expert in the loop.
The second requirement states that the method must be able to run a broad range of vehicle concepts.This requirement stems from the desire to generate a surrogate model that can be used for design spaceexploration. In order to maximize the utility of the surrogate in this application the data set must capturethe behavior of POST for a variety of input variables and ranges.
The third requirement also stems from the desire to use the surrogate model during conceptual design.Typical conceptual design studies are carried out in a short time frame; on the order of weeks.11 Since aPOST surrogate model may require thousands of points to achieve an acceptable fit the automation methodmust be able to close cases in a rapid manner. Generically stated, the method must be able to provide thedata set in a time frame that is reasonable for a conceptual design study.
The previous requirements call for a method that can produce many POST cases without including anexpert in the loop. This implies that the automation will produce closed cases in the same manner asan expert. However, due to the multi-modal nature of trajectory optimization the expert and automatedsolutions are not guaranteed to match for each vehicle. Therefore a final requirement must be added, whichstates that the method must be transparent and provide an easy means for validation and verification.Completing Verification and Validation (V&V) on the automated approach is a vital step towards producingdata that will ultimately be used for concept down selection. The final list of method requirements areitemized below.
• Method must handle failed trajectories and POST crashes
• Method must be able to run a broad range of vehicle concepts
• Method must generate data set in a timeframe that is reasonable for a conceptual design study
• Method must be transparent and provide easy means for validation and verification
3 of 14
American Institute of Aeronautics and Astronautics
III. Approach
In the following section, the requirements previously placed upon the work are explored. At each step,another piece of the final tool is incorporated and justified, and any pitfalls associated with their inclusionpresented. In the end their synthesis results in the creation of a tool called multiPOST, whose parts arediscussed in further detail in the following section.
III.A. Sampling
In order to create a surrogate model of POST which can represent any class of vehicle within a trade study’sbounds, the targeted design space must be thoroughly sampled. In order to do so in a quick turnaroundtimeframe (on the order of one month), the sampling must be executed as efficiently as possible. Design ofExperiments (DOE) is thus utilized to maximize the information gained on the outputs while simultaneouslyminimizing effort (i.e. cases run) by mathematically structuring the selection of inputs. There are manydifferent DOE schemes to choose from, and the algorithm by which points are calculated will vary from onescheme to the next. While the vehicle design space is most easily expressed in a Cartesian system of variableswith upper and lower bounds, the majority of the reasonable designs are expected to come from the interiorof the design space rather than from the edges or corners. In addition, there is a desire to avoid the cornersof this Cartesian space, as trajectory optimization tools like POST tend to have difficulty finding feasibletrajectories for extreme combinations of vehicle designs. These considerations lead naturally to the selectionof a space-filling DOE.
Among space-filling DOEs, there are a variety of approaches to sampling, including such strategies asSphere-Packing, Latin Hypercube, and Maximum Entropy designs, among others.12 Each strategy is basedon a different mathematical formulation or figure of merit, so depending on the particular application, certainstrategies may be more appropriate than others. As mentioned previously, getting certain trajectories toconverge in POST can sometimes be difficult to the point where it may be desirable to move on and marka particular case as failed. This is an undesirable outcome in DOEs based on the optimization of somestatistical metric, as failing to gather data at the selected points represents a compromise of the originalsample design. If too many cases fail this can become problematic, as the failures may introduce appreciablecorrelation in the sample. However, Uniform DOEs do not suffer as quickly from failed cases, as removingpoints at random does not compromise the statistical nature of the design. For this reason, a Uniform DOEwas used in this work.
For the trajectory discipline, there are two levels of inputs required to fly the vehicle. The first, vehicle-level parameters, is the collection of masses, thrusts, etc. which describes the vehicle on the pad. As thedesired surrogate model will be a function of these physical parameters, the DOE scheme chosen above isto be used for selecting this level of inputs. The second, control-level parameters, is the collection of pitchrates, launch conditions, etc. which describes how the vehicle flies. These control-level parameters are notexplicitly known, and while hypothetically one would expect there to be a relationship between the vehicle-level parameters and the optimal set of control-level parameters, previous efforts to elicit a mapping betweenthe two have met with difficulty.13 Combining knowledge of previous difficulties with the expectation thatoutput response to control-level inputs is nonlinear, a complex relationship between vehicle-level and control-level inputs is anticipated. Motivated by this expected correlative complexity, sampling of the vehicle-leveland control-level inputs have been separated into a two-level problem.
The sampling approach applied to the control-level parameter space is based on an understanding ofthe characteristics and behaviors of POST. Due to the difficulties that arise occasionally in getting POSTto converge, there is often a particular sensitivity to the initial control parameters provided as an initialguess. If the feasible region in the control-level parameter space for a desired orbit and particular selectionof vehicle-level parameters is small, then a single set of control-level inputs (DOE set) can completely missthe feasible region, giving the false impression that a vehicle cannot fly the mission specified. Also, sincePOST employs a gradient-based (local) optimizer,14 it has the drawback of finding only local minima; thisposes a problem, as previous efforts15,16 have shown that the trajectory output space is multimodal. It isundesirable to get stuck using suboptimal data, even though POST may have returned it as optimized.
Thus, with no explicit a priori knowledge of the control parameters, the expectation that the correspond-ing output space will be nonlinear and multimodal, and the knowledge that the optimizer in use is local,some method to enable a broader, if not global, search is needed. A statistically rigorous process is appliedto meet this need, which will be published in a separate paper at a later date; however, the essence of the
4 of 14
American Institute of Aeronautics and Astronautics

approach proceeds as follows: A minimum to maximum range is identified for each parameter in the controls,loosely leveraging expected values and correlations set forward by a subject matter expert; and random casesare selected and evaluated from these ranges until specific statistical thresholds are achieved. The responseof interest is then extracted from the resulting data set.
III.B. Heuristics
For a given vehicle attempting to achieve a given orbit, flying with randomly selected controls can be quitedisastrous. POST experts apply heuristics to the trajectory inputs between runs to move arbitrarily chosencontrols to a locally optimal neighborhood so that POSTs internal optimizer can take over. These heuristicswere applied in the tool and verification was conducted via interviews with current analysts in ACO tofine-tune operations. In this manner, the developed tool can be thought of as simply an automated versionof the current method. Historically a human analyst has used their best guess at a vehicle’s flight path astheir initial guess, then used their best judgment to nudge the path this way or that in order to producean acceptable trajectory. This issue is a consequence of the fact that POST employs a direct shootingmethod.14 Examples of these heuristics are pitching up if a vehicle goes below a certain altitude; pitchingdown if the maximum altitude is violated; and adjust pitch events in opposing directions if there is anegative mass error. These adjustments are achieved by multiplying the control-level parameter inputs byuser-specified constants. Feasible trajectories (i.e. trajectories which achieve the desired orbital parameterswithin acceptable tolerances) that are satisfactorily optimized are recorded and then re-optimized. Thisprocess is repeated until an absolute tolerance on the difference between iteration results is satisfied, atwhich point the trajectory is recorded as converged.
Many of the difficulties of working with POST in particular can be summed up by the statement thatPOST is only as good as the algorithms it contains. It is an optimizer, not a pilot. An example of thisbehavior can be seen in Figure 1. The chart represents the collection of over 30 feasible trajectories, plottedon the left as altitude versus time, and on the right as dynamic pressure versus time. The lighter bluetrajectories are less desirable (based on the final mass injected into orbit) while the lighter purple are moredesirable. The optimizer in POST led to an optimal trajectory that was actually infeasible in reality. Inthis case the manner in which the optimizer achieved a higher optimized variable was to dip back into theatmosphere, subjecting the vehicle to intense aeroheating. To POST this is the peak of efficiency, but thistrajectory will never be physically flown, and reporting metrics from this trajectory would lead to inaccurateconclusions. In order to restrict this behavior, these trajectories are removed by filtering the data afterit is generated. In this case the dynamic pressure is limited to a specified value after the gravity turn hascompleted, and to a lower specified value after upper stage ignition. Violating the former of these constraintsis a good indicator that the vehicle has dipped back into the atmosphere, and violating the latter of theseconstraints could constitute thermal damage to the payload. In addition, the time history of the altitude isexamined to ensure that if the vehicle reaches a local maximum, no more than 1000ft of altitude is lost beforereaching a local minimum. Another way POST can lead to inaccurate results is when the optimized variablevalue is traded for a better orbit. In the case where the optimized variable is the payload, which normally isdesired maximized, POST will sometimes decrease this value in order to get the vehicle to the desired orbit.This behavior has been found primarily in situations where the combination of vehicle and steering-levelparameters is poor, such as a vehicle with a low thrust-to-weight flying a sharp gravity turn. In order toexclude this behavior the history of runs for a particular repetition is tracked, and if the payload decreasestwice in a row, or decreases by a large amount the trajectory is considered unacceptable and discarded.
5 of 14
American Institute of Aeronautics and Astronautics

Time (s) Time (s)
Alt
itu
de
(ft)
Dyn
amic
Pre
ssu
re (
psf
)
Figure 1: March of POST
In addition there are some POST-specific errors for which any automated tool must be able to handle.The first case is when POST simply gets stuck somewhere in its calculations. The user would simply seeno more output coming back from the program over command line and after waiting a certain amount oftime would simply end execution. Another similar error is the ‘georate’ error, which is caused by an errorin a specific POST-internal calculation. The user would simply see that word show up in command lineand nothing more coming after, and so would end execution. Finally, a ‘Run-time Error’ can occur when avehicle stage achieves a negative mass during a phase. When transitioning from one phase to another, thenegative mass will cause a logarithmic domain error and end the run. In this case, the user would see this asanalogous to a trajectory ending with ‘Negative Mass’ in the Failed Case Summary and adjust the controlparameters accordingly. For each of these error cases, the heuristics are designed to act in exactly the samemanner as a human analyst.
III.C. Automation
The set of cases within the vehicle-level parameters chosen for analysis by DOE, coupled with the arbitrarilylarge random selection of points within the control-level parameters represents a large amount of informationgathering. The philosophy employed for automation of trajectory analysis has been to mimic the manualprocess by which a human POST expert will evaluate a given vehicle. In this manner the current state-of-the-art in terms of discipline analysis knowledge is preserved, while now leveraging computer time over humantime. However, a POST expert is still required in the design loop for the verification and validation of bothinputs and outputs of the tool. Since the tool is simply a set of scripts running an existing tool, verificationwas performed by running test cases via arbitrary selection of vehicle and control-level parameters boththrough the tool and manually. The heuristics, which were derived from interviews with POST analystsincluding the first author, were verified in the same manner as the overall execution of the tool, by manuallystepping through the same process as the tool. Manually running POST requires the POST executable, aproperly formatted text input file, and any external files required. These external files can include atmosphereand winds models, thrust traces for SRBs, etc. The POST executable will only read in a file named s.inpand any specified include files within its current directory, and outputs files in its current directory. Due tothis limitation, parallel runs of the program require separate directories housing copies of the executable andany required files. Motivated by this capability for parallelization, the tool is designed to take advantageof parallel processing. Each parallel run of POST requires some agent to shepherd it, analyze the output,make any adjustments to the inputs necessary, and repeat the process as necessary.
IV. multiPOST
This section will give an overview of the tool, named multiPOST, which deploys multiple agents approx-imating human analysts. Although there have been previous efforts to apply multiprocessing to POST,17
this effort focuses on parallelizing the entire program instead of internal algorithms. This parallelization
6 of 14
American Institute of Aeronautics and Astronautics
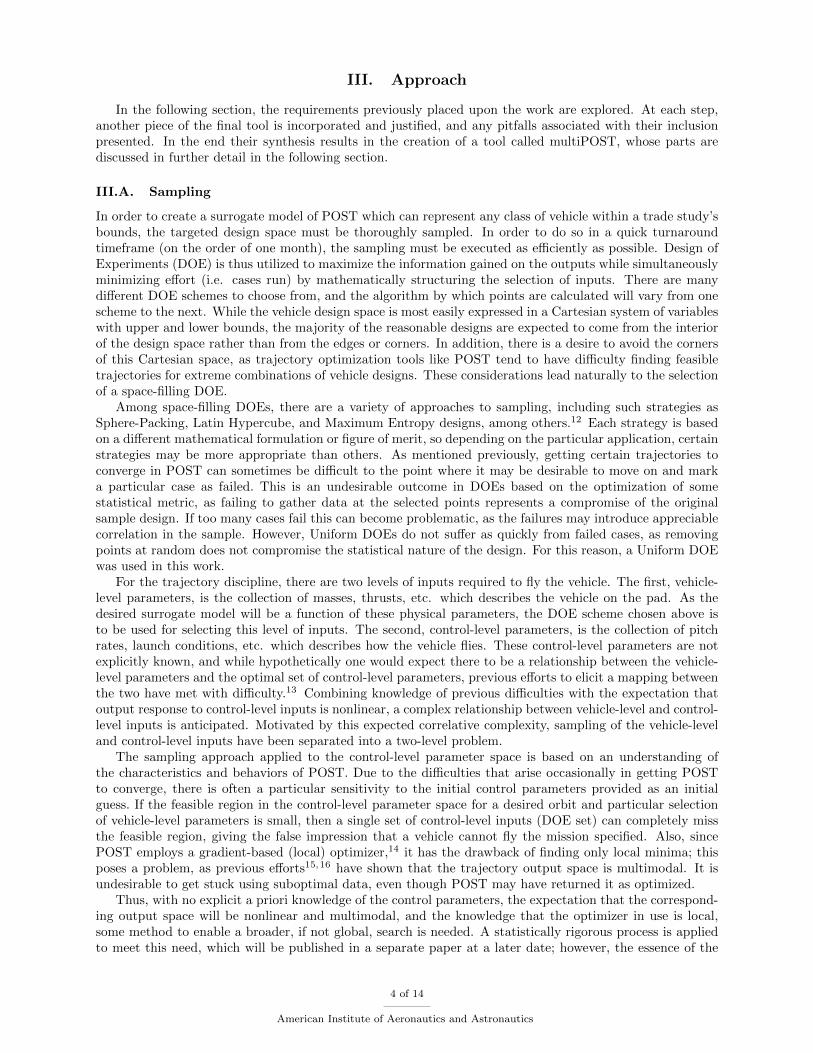
takes the form of executing many instances of POST. The tool was thus designed to have automated agentsnamed ChildPOST working in separate directories with separate copies of the POST executable and orches-trating the runs of each repetition as heuristics dictate, receiving repetitions from a central agent namedMotherPOST which also handles parsing the results of successful trajectories. Some detail on these codeswill be presented next. In addition to the codes, an Excel document named POSTInputs is used to storethe DOE cases and specific MotherPOST execution flags which shape how the user wishes to use the tool,and a text input file (which must be named s.inp) which can be altered to represent different vehicles withinthe trade study bounds. An overview of the tool can be seen in Figure 2 below.
MotherPOST
DoE
ChildPOSTInput Deck
𝑂𝑢𝑡𝑝𝑢𝑡𝑠
𝑦1…𝑦𝑚
𝐼𝑛𝑝𝑢𝑡𝑠
𝑥1…𝑥𝑛
Results
Figure 2: multiPOST Overview
IV.A. POSTInputs
The only portion of the tool the user must alter is an Excel file called POSTInputs, which houses allthe important inputs and output definitions. One sheet contains the DOE information on vehicle-levelparameters, another contains a table of output variables to retrieve from each vehicle trajectory, and anothercontains inputs such as the ranges through which to randomly select control-level parameters, what kind ofvehicle to fly, and how many times a vehicle configuration must achieve a converged orbit before the case isconsidered done.
IV.B. MotherPOST
One of the two main codes of the program, MotherPOST, is responsible for reading in all the informationcontained in the POSTInputs document. The inputs contained therein define how the program is to executeanalysis. MotherPOST then creates a certain number of ChildPOST child processes to handle individualruns of POST. For each case of the DOE, MotherPOST creates randomly selected repetitions, which are thecontrol-level parameters. These are joined with the vehicle-level parameters and fed into a queue of runsfrom which the child processes pull jobs. As results come back from ChildPOST processes, the MotherPOSTprocess is responsible for parsing output files and converting them into a comma-separated values table.
IV.C. ChildPOST
An instance of ChildPOST pulls from the queue created by MotherPOST and performs the repetition by firstcreating a POST input deck with the gathered inputs, activating the POST executable, and finally partiallyparsing the output data. The heuristics then determine the next step. A ChildPOST instance will iterate ona particular repetition until either convergence criteria are satisfied, or the repetition is flagged as unusable.If over a few runs a repetition achieves convergence, its identifying data is sent back to MotherPOST, andthe output file moved to a results folder for further parsing. An overview of this code can be found in Figure3 below.
7 of 14
American Institute of Aeronautics and Astronautics

ChildPOST_i
POST
𝑂𝑢𝑡𝑝𝑢𝑡𝑠
𝑦1…𝑦𝑚
𝐼𝑛𝑝𝑢𝑡𝑠
𝑥11…𝑥𝑛1
Outputs Converged?
Creates Read By
Input Deck
Output File
Parsed By Creates
𝐼𝑛𝑝𝑢𝑡𝑠
𝑥1𝑘…𝑥𝑛𝑘
Heuristics
No
Yes
Figure 3: ChildPOST Detail
V. Example Problem
The example problem is based on the Space Launch System (SLS). The SLS is currently being developedby NASA as the next generation heavy lift launch vehicle, which will enable manned exploration missionsto the moon and beyond.18 The SLS was chosen as a relevant example because design trade studies arecurrently being performed for future block upgrades of the vehicle. These upgrades will ultimately affectthe vehicle’s boosters and upper stage. Changes to these elements represent a wide variety of architectureoptions that will have an effect on the vehicle’s trajectory. Thus, the SLS was deemed to be a good examplevehicle for application of the method.
The SLS is a 2.5 stage vehicle with liquid hydrogen and liquid oxygen core and upper stages.18 Thebaseline SLS vehicle utilizes two STS derived five-segment solid rocket boosters, but advanced solid andliquid boosters have been proposed for future versions. In order to narrow the scope of the example problemno modifications will be made to the solid rocket boosters. In addition, the core stage of the vehicle willbe fixed to the baseline configuration with 4 RS-25 engines. Therefore, the example problem will focus oncapturing design trades for the upper stage of an SLS-like vehicle.
Trades of interest for the upper stage include number of engines, thrust per engine, specific impulse,engine mass, engine dimensions, and component materials. The POST input deck was parameterized tocapture the effects of these parameters on the payload delivered to orbit. In order to minimize the requirednumber of DOE cases, the number of input variables was reduced. Due to dependencies between the variablesit was possible to reduce the number of input parameters while maintaining the capture of the desired trades.
First, the mass of the upper stage was represented as a gross mass. This variable is dependent upon manyother parameters such as number of engines, engine mass, and component materials. Note that the grossmass of the upper stage also includes the payload being delivered to orbit. Although the gross mass effectivelyabsorbs multiple variables, trades such as component materials and engine mass can still be incorporatedusing the appropriate mass differences.
Instead of representing the total thrust of the upper stage as number of engines times the thrust perengine, a total thrust to weight was used. This was done to remove a discrete numeric variable, numberof engines, from the list of DOE inputs. Including discrete inputs within a DOE will rapidly increase thenumber of points required to achieve an acceptable surrogate model fit. The range for total thrust to weightof the upper stage was set up to represent a three to five engine configuration with thrust per engine between20,000 and 40,000 pounds.
The next two input variables, Isp and total exit area, represent the upper stage engine selection. The Isprange was created based upon reasonable levels for a liquid hydrogen, liquid oxygen upper stage engine. Thevalues for total exit area are related to the exit diameter of the engine as well as the number of engines onthe stage. The range for this variable was set up to capture three to five engines with exit diameters similarto existing upper stage engines.
As noted above, the core of the vehicle will be fixed in terms of number of engines, thrust per engine,and propellant loading. However, a variable upper stage mass will have an effect on the structural design ofthe core vehicle. A heavier upper stage will ultimately require a bulkier core structure to support it on thepad and early in the trajectory. Therefore, core burnout mass was included in the list of DOE inputs. Therange for core burnout was developed using structural mass estimates for the lightest and heaviest upper
8 of 14
American Institute of Aeronautics and Astronautics

stage configurations.The last two DOE input variables for the example problem are structural constraints on the trajectory.
The max G variable limits the acceleration during the ascent, while max Q limits the aerodynamic loadingon the vehicle. The ranges for max G and max Q were derived from prior experience with running SLS-likevehicles within POST.
The final set of DOE inputs and ranges can be seen in Table 1. In addition to these variables, multipleother parameters were fixed while carrying out the example problem. Table 2 gives a list of fixed valuesused during the DOE runs. The core engine parameters were derived from RS-25 specifications publishedby Aeroject Rocketdyne.19 The booster parameters in Table 2 were taken from the 5 segment reusable solidrocket motor shown in the ATK space propulsion products catalog.20
Table 1: POST DOE Inputs
Variable Range
Upper stage gross mass 340,000 - 640,000 lbs
Upper stage T/W 0.2 - 0.75
Upper stage Isp 440 - 470 sec
Upper stage total exit area 35 - 235 ft2
Core burnout mass 240,000 - 308,000 lbs
Max G 3 - 4
Max Q 540 - 700 psf
Table 2: POST Fixed Parameters
Parameter Value
Core number of engines 4
Core engine sea level Isp 366 sec
Core sea level thrust per engine 418,000 lbf
Core propellant mass SLS Baseline
Booster burnout mass 181,000 lbs
Booster propellant mass 2,800,000 lbs
Payload fairing type 90 ft w/ogive nose
Payload fairing mass 20,000 lbs
After identifying the inputs and ranges of interest a DOE can be set up. As discussed in Section III.A,many options exist for generating a DOE including space filling, factorial, and composite designs. A Uniformspace filling design was ultimately selected for use in the example problem.
Due to known issues with closing cases in POST a large uniform DOE of 2,500 design points was used.This ensured that a sufficient sampling of the design space was completed despite a very low pass rate.For each of the 2,500 design points 25 repetitions were run using multiPOST. These repetitions representrandomly generated initial control parameter guesses. The number of repetitions was selected to balancethe required runtime of the DOE and the number of successful cases. Increasing the repetitions increasesthe probability of returning a closed trajectory for each DOE point, however, it also greatly increases theruntime. To complete this DOE a total of 62,500 unique POST runs were required.
9 of 14
American Institute of Aeronautics and Astronautics

VI. Results
The uniform DOE runs were split over two workstations, each with 24 cores. Approximately 48 hours ofruntime was required to complete the DOE. Out of 62,500 unique repetitions, around 42,000 were successful.However, as discussed in Section III.B, not all of these trajectories can be realistically flown by the vehicle.Therefore, filters were applied to the raw data set to remove unrealistic trajectories.
Following the filtering, 31,000 successful repetitions remained, which were then grouped by case number.Out of the original 2,500 DOE points, 1,644 had at least 1 successful repetition. For cases with multiplesuccessful repetitions the maximum injected mass was taken as the output for the vehicle. The maximum wastaken to more closely replicate the results from an analyst running POST by hand. Many of the successfultrajectories that fell below the maximum injected mass for that vehicle could easily be adjusted by an expertto achieve a more optimal value. Therefore, they were ignored for surrogate model fitting purposes.
The surrogate model fitting was performed using the statistical software JMP. This software providestools for fitting many types of surrogates including neural networks, Gaussian process models, and responsesurface equations. A response surface equation (RSE) was selected as the desired fit for the example problemdata. An RSE was selected primarily because of its compact form in comparison to a neural net or Gaussianprocess model.
Multiple different options are provided in JMP for fitting response surface equations. Because of thenonlinear nature of the data, a stepwise regression was used to fit the RSE. Stepwise regression within JMPuses a statistical significance level to determine which terms in the regression model are most beneficial tothe model’s ability to predict the data. At each step during the model fitting, the significance levels arerecalculated and terms are added or removed. This operation is performed until a pre-selected stoppingcriterion is met. Using this approach allows for the use of only the significant terms within the model.
Following the stepwise regression, multiple goodness of fit tests must be applied to ensure the RSE isaccurate enough for use during a conceptual design study. First, the R2 value measures how well the modelcaptures the variability of the data. Based upon the authors’ experience an R2 value of 0.99 or better isachievable using POST data produced by the multiPOST tool. For the example problem, the R2 of the fitfor injected mass was 0.9981.
Another goodness of fit test involves the residual by predicted plot. This plot shows the value predictedby the RSE plotted versus the error of each point. The desired pattern in the residual by predicted plot isa “shotgun spread”, which can be seen in Figure 4 below. Curved patterns or clustering on the residual bypredicted plot typically indicate higher order terms are needed. Note that the residual and predicted valueshave been normalized prior to plotting.
From the residual by predicted plot a very quick estimate for the percent error can be derived. Due tothe normalization of the data in Figure 4 it is especially easy to derive as the y-axis essentially shows thepercent error. Figure 5 shows the distribution of the percent error of the injected mass model. As seen in thefigure the maximum absolute value of the error is 2.79 percent. The distribution shows that approximately95% of the cases fall within 1% error. The standard deviation and mean of the percent error distributionare typically used to accept or reject the model. A standard deviation of less than 1 is desired, with a meanof nearly zero. In this case, the model is well below a standard deviation of 1 and has a mean of nearly 0.
10 of 14
American Institute of Aeronautics and Astronautics

Inje
cted
Mas
s R
esid
ual
-0.05
-0.04
-0.03
-0.02
-0.01
0.00
0.01
0.02
0.03
0.04
0.50 0.55 0.60 0.65 0.70 0.75 0.80 0.85 0.90 0.95 1.00
Predicted Injected Mass
Figure 4: Residual by predicted plot for injected mass fit
-2.5
-2
-1.5
-1
-0.5
0
0.5
1
1.5
2
2.5
3 Quantiles100.0%99.5%97.5%90.0%75.0%50.0%25.0%10.0%2.5%0.5%0.0%
maximum
quartilemedianquartile
minimum
2.793491.512220.929360.570930.298620.02348
-0.256-0.5655-1.177
-1.7472-2.457
Summary StatisticsMeanStd DevStd Err MeanUpper 95% MeanLower 95% MeanN
0.00269520.506618
0.01249480.0272026-0.021812
1644
Figure 5: Percent error distribution for injected mass fit
During goodness of fit testing, Figure 4 above typically represents the model fit error, which is the errorbetween the model prediction and the output of the points used to fit the model. Another percent error plotis produced for the model representation error, which is the error between the prediction and the output ofpoints not used to fit the model. In this case the model representation error distribution is not necessarydue to the method used to fit the model.
As discussed above, the stepwise personality was utilized in JMP to fit an RSE for injected mass. Anoption called k-folds cross validation was implemented during the fit. This option splits the set of cases intok number of subsets. A model is then fit to the points in k-1 subsets, while the last subset is held backfor validation. This operation is performed for all combinations of the subsets. For example, using 3 foldswould require 3 models be fit. These models would use the following subsets as fit data, A/B, B/C, A/Cwith the remaining set held back for validation. The implementation of k-fold cross validation therefore rollsthe model representation error goodness of fit test into the fitting of the model itself.
The goodness of fit tests were successfully implemented on the RSE for the example problem. The percenterror of the response was deemed to be within acceptable tolerances for conceptual design. An illustrationof the usefulness of the trajectory surrogate will be given below.
11 of 14
American Institute of Aeronautics and Astronautics

Now that an RSE has been generated, it can be put to use. Figure 6 gives a JMP profiler illustration ofthe POST surrogate model for the example problem. In this figure, the POST surrogate inputs are listedin separate boxes along the x-axis with the predicted injected mass on the y-axis. These inputs are theburnout mass of the Core stage, exit area of the upper stage engines, gross mass of the upper stage, specificimpulse of the upper stage engines, Thrust-to-Weight ratio of the upper stage, maximum axial loading inunits of surface gravity g, and maximum dynamic pressure in units of psf, respectively. The curves in eachbox depict the predicted output over the range of settings for the specific input. Note that each curve isgenerated with all other inputs fixed.
The profiler very quickly provides the sensitivity of the injected mass to the various input parameters.As seen in the figure, the upper stage exit area, max acceleration, and max dynamic pressure have verylittle effect on the output. The upper stage thrust to weight shows the largest effect on the injected mass,decreasing drastically at the lower end of the input range.
In addition to providing sensitivities the profiler enables setup and execution of a Monte Carlo simulationusing the surrogate model. This allows for the generation of very large data sets for further exploration of thedesign space. Such simulations can be used for technology evaluation, risk analysis, and inverse design.21,22
Figure 7 shows the Monte Carlo simulation setup in the JMP profiler window. The distributions on eachof the inputs can be fully customized and the number of cases can be selected by the user. After runningthe simulation the expected injected mass given the input distributions is shown to the right of the originalprofiler. Note that the points can also be exported to a new JMP table for further investigation and plotting.The profiler examples give only a small glimpse at the analyses that can be performed after fitting a POSTsurrogate.
0.550.6
0.650.7
0.750.8
0.850.9
0.951
Pre
d.
Inje
cted
Mas
s
0.958128
2500
00
2750
00
3000
00
273750
CoreBO
50 100
150
200
135
EUSEA
4000
00
5000
00
6000
00
490000
EUSGross
440
450
460
470
455
EUSIsp
0.2
0.3
0.4
0.5
0.6
0.7
0.475
EUSTW 3
3.5 4
3.5
MaxG
550
600
650
700
620
MaxQ
Figure 6: Prediction profiler for POST injected mass surrogate
0.550.6
0.650.7
0.750.8
0.850.9
0.951
Pre
d.
Inje
cted
Mas
s
0.963391
2500
00
2750
00
3000
00
270000
CoreBO Random
Normal
MeanSD
2700008000
50 100
150
200
135
EUSEA Random
Uniform
LowerUpper
55.032214.968
4000
00
5000
00
6000
00
490000
EUSGross Random
Triangular
LowerPeakUpper
446866490000609808
440
450
460
470
455
EUSIsp Random
Normal
MeanSD
4552.53731
0.2
0.3
0.4
0.5
0.6
0.7
0.475
EUSTW Random
Uniform
LowerUpper
0.255440.69456
3
3.5 4
3.5
MaxGRandom
Uniform
LowerUpper
3.100323.89968
550
600
650
700
620
MaxQRandom
Uniform
LowerUpper
556.077683.923
Figure 7: Prediction profiler with Monte Carlo simulation
12 of 14
American Institute of Aeronautics and Astronautics

VII. Conclusion
The primary goal of this paper was to develop a method for automating the execution of the POSTtrajectory optimization tool. Automating POST was motivated by the desire to generate a surrogate modelfor rapid trade space exploration, which requires large sets of data for fitting. In Section III a heuristicsbased approach was developed for automatically closing cases in POST. This method was demonstrated onan example problem in Section VI to illustrate its ability to successfully accomplish the initial goal and meetthe method requirements defined in Section II.
The example problem utilized an SLS like vehicle with a parameterized upper stage. The multiPOSTtool was implemented using the variables and ranges listed in Table 1. It successfully completed 31,000out of 62,500 total repetitions defined by the DOE. Throughout the DOE execution, the multiPOST toolevaluated a large upper stage design space while successfully handling failed trajectories and POST programcrashes. The example problem illustrated the time required for DOE completion. Using two computers,the multiPOST tool completed the DOE cases in approximately 48 hours. Including extra time for postprocessing this means, for a reasonable trade space, a POST surrogate can be completed in less than aweek. This is well within the bounds of a typical conceptual design study, which meets the third methodrequirement.
The final requirement in Section II touched on validation and verification of the multiPOST tool. Ap-plying V&V is a very important step to ensure that an accurate surrogate model is produced. Withoutperforming this step the surrogate model may grossly misrepresent the trade space. In section III heuristicswere built into the multiPOST tool in order to capture expert knowledge. For every new trade study theheuristics can be adjusted to appropriately handle new vehicle configurations. In addition, the POST analystmust set up a parameterized input deck prior to DOE execution. These steps represent verification exercisesthat are built into the tool execution. Prior to running DOE cases the analyst is required to verify thesuccessful operation of the input deck along with the heuristics.
Validation of the multiPOST tool execution can also be accomplished in multiple ways. First, thedetailed input and output data for each case in the DOE can be saved as the tool executes. This allows theanalyst to select any number of points from the DOE to validate via a comparison to the same case run byhand. Additional validation can be performed following the response surface fitting. This would involve acomparison between an analyst run case and the output of the surrogate model.
The multiPOST tool successfully meets the requirements stated in Section II. It allows for the generationof trajectory surrogate models for rapid design space exploration during conceptual design. Although thesurrogate in Figure 7 provides a small number of variables to play with, it can capture more detailed tradesby including other analysis tools. The Advanced Concepts Office at NASA Marshall Spaceflight Center iscurrently implementing the sizing and structural analysis tools, INTROS and LVA, in complement to POST.These sizing tools can capture the effects of parameters such as number of engines, engine mass, mixtureratio, and component materials on the burnout and gross masses in the POST surrogate. Linking surrogatesof the sizing tools to the POST surrogate via core and upper stage masses can therefore support moredetailed trades during conceptual design. Completion of these trades signifies an improvement in designknowledge that can be used for concept down selection, which ultimately contributes to the production ofmore affordable space launch vehicles.
13 of 14
American Institute of Aeronautics and Astronautics

References
1Hertzfeld, H., Williamson, R., and Peter, N., “Launch Vehicles: An Economic Perspective,” Tech. rep., The GeorgeWashington University Space Policy Institute, Washington, D.C., September 2005.
2Ryan, R. S. and Townsend, J. S., “Fundamentals and issues in launch vehicle design,” Journal of Spacecraft and Rockets,Vol. 34, No. 2, 1997, pp. 192 – 198.
3Department of Defense, Defense Aquisition Guidebook , September 2013. https://dag.dau.mil/Pages/Default.aspx.4Blair, J., Ryan, R., Schutzenhofer, L., and Humphries, W., “Launch Vehicle Design Process: Characterization, Technical
Integration, and Lessons Learned,” Tech. rep., National Aeronautics and Space Administration, May 2001.5Dulac, N. and Leveson, N., “Incorporating safety risk in early system architecture trade studies,” Journal of Spacecraft
and Rockets, Vol. 46, No. 2, 2009, pp. 430 – 437.6Ullah, R., Zhou, D.-Q., Zhou, P., Hussain, M., and Amjad Sohail, M., “An approach for space launch vehicle conceptual
design and multi-attribute evaluation,” Aerospace Science and Technology, 2011.7Zwack, M., A Conceptual Reliability Growth Approach for Comparison of Launch Vehicle Architectures, Ph.D. thesis,
Georgia Institute of Technology, Atlanta, GA, December 2014.8Simpson, T., Booker, A., Ghosh, D., Giunta, A., Koch, P., and Yang, R., “Approximation Methods in Multidisciplinary
Analysis and Optimization: A Panel Discussion,” 9th AIAA/ISSMO Symposium on Multidisciplinary Analysis & Optimization,Atlanta, GA, September 2002.
9Steffens, M., A Combined Global and Local Methodology for Launch Vehicle Trajectory Design-space Exploration andOptimization, Master’s thesis, Georgia Institute of Technology, 2014.
10Waters, E., Garcia, J., Beers, B., Philips, A., Holt, J., and Threet, G., “NASA Advanced Concepts Office, Earth-To-OrbitTeam Design Process and Tools,” AIAA SPACE 2013 Conference & Exposition, 2013.
11Mulqueen, J., Maples, D., and Fabisinski, L., “Tailoring Systems Engineering Processes in a Conceptual Design Envi-ronment: A Case study at NASA Marshall Spaceflight Center’s ACO,” INCOSE International Symposium, Rome, Italy, July2012.
12Ryan, T. P., Modern Experimental Design, Wiley Series in Probability and Statistics, 2007.13Braun, R., Moore, A., and Kroo, I., “Use of the Collaborative Optimization Architecture for Launch Vehicle Design,”
6th AIAA/USAF/NASA/ISSMO Symposium on Multidisciplinary Analysis and Optimization, 1996.14Powell, R., Striepe, S., Desai, P., Braun, R., Brauer, G., Cornick, D., Olson, D., Peterson, F., and Stevenson, R., Program
To Optimize Simulated Trajectories (POST) Vol II: Utilization Manual , 1997.15Nelson, D., Qualitative and Quantitative Assessment of Optimal Trajectories by Implicit Simulation (OTIS) and Program
to Optimize Simulated Trajectories (POST), Master’s thesis, Georgia Institute of Technology, April 2001.16Steffens, M. J., Edwards, S. J., and Mavris, D. N., “Capturing the Global Feasible Design Space for Launch Vehicle
Ascent Trajectories,” AIAA SciTech, Kissimmee, FL, January 2015.17Hammond, D. P., “Parallelization of Program to Optimize Simulated Trajectories (POST3D),” Cr-2001-211250, NASA,
November 2001.18National Aeronautics and Space Administration, “NASA facts: Space Launch System,” June 2012.
http://www.nasa.gov/pdf/664158main sls fs master.pdf.19Aerojet Rocketdyne, “RS-25 Engine,” Online, http://www.rocket.com/rs-25-engine.20Alliant Techsystems Inc., “ATK Space Propulsion Products Catalog,” September 2012. http://www.orbitalatk.com/flight-
systems/propulsion-systems/launch-abort-motor/docs/orbital atk motor catalog (2012).pdf.21Biltgen, P., Ender, T., and Mavris, D., “Development of a Collaborative Capability-Based Tradeoff Environment for
Complex System Architectures,” 44th AIAA Aerospace Sciences Meeting and Exhibit , Reno, Nevada, January 2006.22Kirby, M., A Methodology for Technology Identification, Evaluation, and Selection in Conceptual and Preliminary Air-
craft Design, Ph.D. thesis, Georgia Institute of Technology, May 2001.
14 of 14
American Institute of Aeronautics and Astronautics