an experimental study of the fracture behaviour of ... · overheight compact tension (oct) test...
TRANSCRIPT

An Experimental Study of the Fracture Behaviour of Stitched RFI Composites –
Evaluation of the Damage Process Zone to Calibrate a Strain-Softening Model
Jason Mitchell and Anoush Poursartip
Department of Materials Engineering The University of British Columbia,
Vancouver, British Columbia, Canada
Corresponding author:Anoush PoursartipE-mail: [email protected]: +1(604)822-3665Fax: +1(604)822-3619
AcknowledgementsAcknowledgements
Natural Sciences and Engineering Research Council of CanadaThe Boeing Company
Mr. Roger Bennett, UBCDr. Reza Vaziri, UBCDr. Göran Fernlund, UBCDr. William Avery, The Boeing Company
*copyright Tourism Vancouver

OutlineOutline
IntroductionMaterialsOCT TestingPost OCT TestsDamagePreview of Numerical PredictionsConclusionsFuture Work
Stitched Resin Film Infused MaterialsStitched Resin Film Infused Materials
S/RFI is one approach to compensate for poor out-of-plane properties of composite laminatesThe aim is to improve damage tolerance to a level competitive with metallic materials, as well as other benefits

Flow
Tool Resin Preform Dam
Flow
Tool Resin Preform Dam
Stitched Resin Film Infused MaterialsStitched Resin Film Infused Materials
Produced by stitching a preformResin is infused via vacuum and heat from a partially cured film placed under the preformS/RFI material used here developed by The Boeing Company under the NASA ACT Program
Stitched Resin Film Infused MaterialStitched Resin Film Infused MaterialAdvantages of stitching– Shown to improve delamination resistance under low velocity
impact loading– Large stitched preforms easier to handle, cost effective– Removes the need for traditional mechanical fasteners
Disadvantage of stitching– Imparts fibre damage; spreading and breakage
Elongated Stitch 2.0 mmElongated Stitch 2.0 mm
Top of Stitch
1.48 mm1.48 mm
Side of Stitch
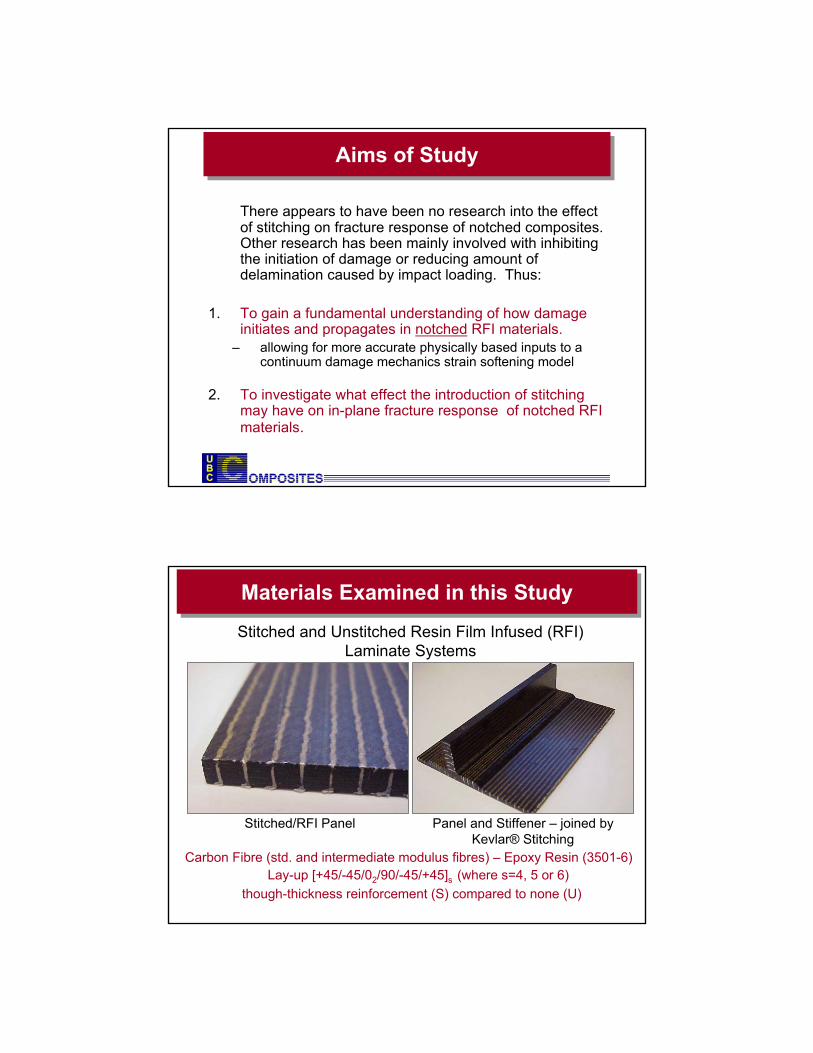
Aims of StudyAims of Study
There appears to have been no research into the effect of stitching on fracture response of notched composites. Other research has been mainly involved with inhibiting the initiation of damage or reducing amount of delamination caused by impact loading. Thus:
1. To gain a fundamental understanding of how damage initiates and propagates in notched RFI materials.
– allowing for more accurate physically based inputs to a continuum damage mechanics strain softening model
2. To investigate what effect the introduction of stitching may have on in-plane fracture response of notched RFI materials.
Materials Examined in this StudyMaterials Examined in this Study
Stitched and Unstitched Resin Film Infused (RFI) Laminate Systems
Carbon Fibre (std. and intermediate modulus fibres) – Epoxy Resin (3501-6)
though-thickness reinforcement (S) compared to none (U)Lay-up [+45/-45/02/90/-45/+45]s (where s=4, 5 or 6)
Stitched/RFI Panel Panel and Stiffener – joined by Kevlar® Stitching

Experimental MethodOverheight Compact Tension (OCT) Tests
Experimental MethodOverheight Compact Tension (OCT) Tests
Overheight Compact Tension (OCT) test methodology based on work of Kongshavn and Poursartip1.Loaded from pins on notch flanksSaw-cut slightly blunt notchLines inscribed to measure local surface displacements (line analysis)Extensometer records crack mouth opening displacement (CMOD) of notch
Applied Displacement
Notch
Inscribed LinesCMOD
GaugeGuide
Loading Pins
y
x1 Kongshavn and Poursartip, 1999
Why use the OCT?Why use the OCT?
Geometry has been shown to promote stable damage growth in tape compositesSmall specimen size– 207× 104 mm– Material waste kept to a
minimumDamage includes fibre fracture in a small specimen– usually only seen in large
specimensFracture Process Zone (FPZ) is large enough for post-test analysis.
FPZ

Test ApparatusTest Apparatus
Specimen loaded in InstronUniversal Testing Machine
y
x
Typical Stitched 5-stack Material Behaviour(Test # SS67-s0)
Load – Crack Mouth Opening Displacement Curve
05
101520253035404550
0 1 2 3 4 5 6 7CMOD (mm)
Load
(kN
)
Photographs
Tests ConductedTests Conducted
Specimens were tested in both the primary principal (0°) and the transverse principal (90°) directionsFewer unstitched experiments were performed as results compared favourably with data from previous research
90°90°
32 102
0°0°
134
Stitched (4/5/6)Unstitched (4/6)
17 Tests Performed

Test OrientationsTest Orientations
Applied Displacement, δ
Direction of 0ºplies
Applied Displacement, δ
Direction of 0ºplies
0°
Applied Displacement, δ
Direction of 0ºplies
Applied Displacement, δ
Direction of 0ºplies
90°
Specimens were tested in both the primary principal (0°) and the transverse principal (90°) directions.
Test Directions (Stitching)Test Directions (Stitching)Kevlar® stitching is oriented in direction of 0° plies
90°
Stitching oriented
parallel to load
Stitching oriented
perpendicular to load
0°

Effect of Thickness and Stitching on 90ºSpecimens
Effect of Thickness and Stitching on 90ºSpecimens
6-stack 90° (SS81-u90)
6-stack 90° (SS78-s90)
4-stack 90° (SS76-s90)
4-stack 90° (SS83-u90)
5-stack 90° (SS77-s90)
0
0.2
0.4
0.6
0.8
1
1.2
1.4
1.6
1.8
2
0 1 2 3 4 5CMOD (mm)
Load
/Thi
ckne
ss (k
N/m
m)
6-stack 90° (SS81-u90)
6-stack 90° (SS78-s90)
4-stack 90° (SS76-s90)
4-stack 90° (SS83-u90)
5-stack 90° (SS77-s90)
0
0.2
0.4
0.6
0.8
1
1.2
1.4
1.6
1.8
2
0 1 2 3 4 5CMOD (mm)
Load
/Thi
ckne
ss (k
N/m
m)
a/W = 0.40
Effect of Thickness and Stitching on 0ºSpecimens
Effect of Thickness and Stitching on 0ºSpecimens
0
1
2
3
4
5
6
0 1 2 3 4 5 6CMOD (mm)
Load
/Thi
ckne
ss (k
N/m
m)
5-stack 0° (SS70-s0)
4-stack 0° (SS82-u0)
5-stack 0° (SS69-s0)
6-stack 0° (SS79-s0)
4-stack 0° (SS71-s0)
4-stack 0° (SS72-s0)
6-stack 0° (SS80-u0)
6-stack 0° (SS73-s0)
0
1
2
3
4
5
6
0 1 2 3 4 5 6CMOD (mm)
Load
/Thi
ckne
ss (k
N/m
m)
5-stack 0° (SS70-s0)
4-stack 0° (SS82-u0)
5-stack 0° (SS69-s0)
6-stack 0° (SS79-s0)
4-stack 0° (SS71-s0)
4-stack 0° (SS72-s0)
6-stack 0° (SS80-u0)
6-stack 0° (SS73-s0)
a/W ~ 0.40-0.43

Summary of P-δ Response TypesSummary of P-δ Response Types
BABA6--BB5BABA4
90°0°90°0°UnstitchedStitched
BABA6--BB5BABA4
90°0°90°0°UnstitchedStitched
Bδ
P
A
P
δB
δ
P
A
P
δ
Post Test AnalysisPost Test Analysis
Used to evaluate the fracture response– Damage initiation and propagation
To investigate the damage evolved in Fracture Process Zone:– Sectioning -- (fibre damage, delamination, matrix
damage)– Deplying -- (fibre damage, fracture path)
To investigate progression of damage across specimen width– Surface Line Displacement Analysis
measures material displacement in front of notch tip

SectioningSectioning
Sectioned Area
Process ZoneNotch
Loading Pins Sectioned Area
Process ZoneNotch
Loading Pins
Sectioning (Example)Sectioning (Example)
0
7.50
-7.50
NotchM.P
-5.63
-1.88
-3.75
5.63
3.75
1.88
7.00 mm
90 90 90 90 90
TopF B TopF B
0
7.50
-7.50
NotchM.P
-5.63
-1.88
-3.75
5.63
3.75
1.88
7.00 mm
90 90 90 90 90
TopF B TopF B
0
7.50
-7.50
NotchM.P
-5.63
-1.88
-3.75
5.63
3.75
1.88
7.00 mm
90 90 90 90 90
TopF B TopF B
Cross-sectioning technique performed on a stitched 5-stack 0°specimen (SS70-s0-B) at 2.00 mm in front of the notch tip.
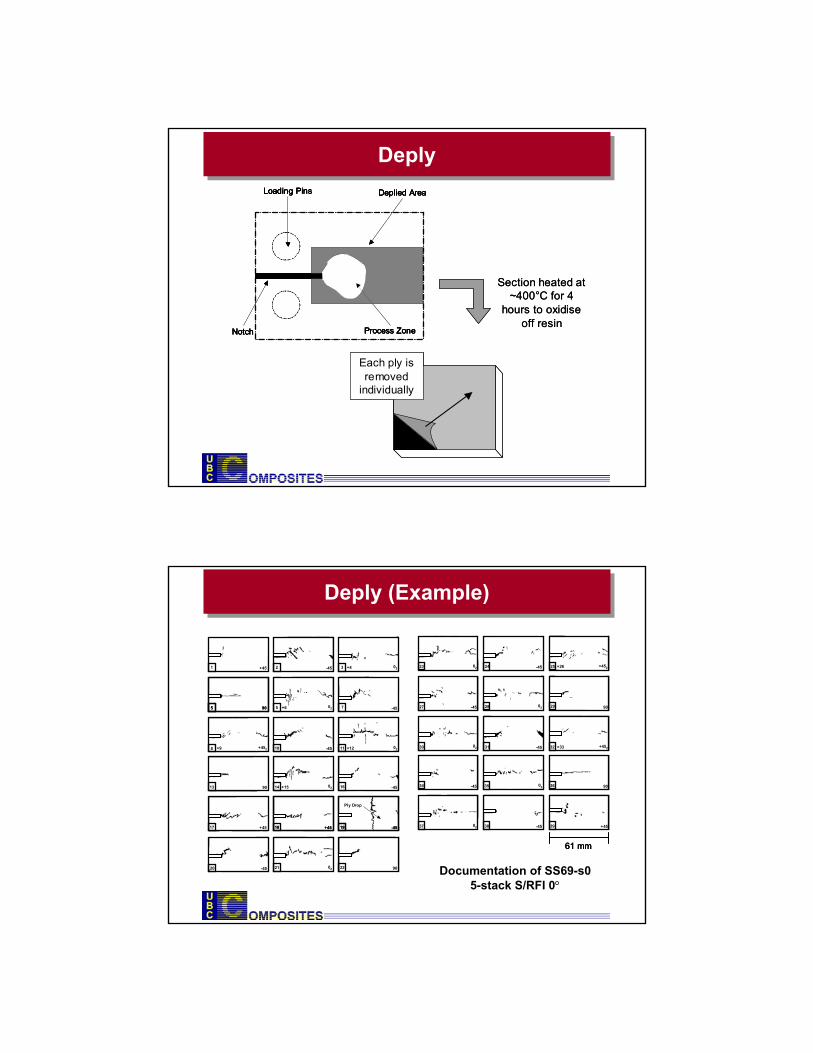
DeplyDeplyDeplied Area
Process ZoneNotch
Loading Pins Deplied Area
Process ZoneNotch
Loading Pins
Each ply is removed
individually
Section heated at ~400°C for 4
hours to oxidise off resin
Deplied Area
Process ZoneNotch
Loading Pins Deplied Area
Process ZoneNotch
Loading Pins
Each ply is removed
individually
Section heated at ~400°C for 4
hours to oxidise off resin
Deply (Example)Deply (Example)
+452
-45
02
02
-45+45
-45 02
90 02 -45
1 2 3
7
8 10 11
13 14 16
+4518
0221
905 5
+4517 -4519
9022-4520
Ply Drop
+4
+6
+9 +12
+15
+452
-45
02
02
-45+45
-45 02
90 02 -45
1 2 3
7
8 10 11
13 14 16
+4518 +4518
0221
905 905 5
+4517 -4519 -4519
9022-4520
Ply Drop
+4
+6
+9 +12
+15
9002
-4502
-45
23 24 25
29
30 31 32
34 35 36
38
27 28
37 39
+452+26
-45
02 +452+33
-45 02 90
02 -45 +45
61 mm
9002
-4502
-45
23 24 25
29
30 31 32
34 35 36
38
27 28
37 39
+452+26
-45
02 +452+33
-45 02 90
02 -45 +45
9002
-4502
-45
23 24 25
29
30 31 32
34 35 36
38
27 28
37 39
+452+26
-45
02 +452+33
-45 02 90
02 -45 +45
61 mm61 mm
Documentation of SS69-s05-stack S/RFI 0°

Significant Fibre BreakageSignificant Fibre Breakage
Notch mid-plane
Fibre Damage
11.75 mm
Notch mid-planeNotch mid-plane
Fibre Damage
11.75 mm
Notch mid-plane
Damage at 45°
11.75 mm
Notch mid-plane
Damage at 45°
11.75 mm
This example: 5-stack 0°
damage growth in 0° plies damage growth in -45° plies
Surface Line AnalysisSurface Line Analysis

0
5
10
15
20
25
30
35
40
45
50
0 1 2 3 4 5 6 7CMOD (mm)
Load
(kN
)
Photographs (See Line Analysis SS69-s0)
3
0.0
0.2
0.4
0.6
0.8
1.0
1.2
1.4
-10 0 10 20 30 40 50Position in front of notch tip (mm)
Dis
plac
emen
t of l
ine
#5(1
2.5
mm
from
NM
P) (m
m)
Photo 3
Back End of specimen
NOTCH
Relating P-CMOD curves to Surface Line
Analysis Plots
Load- CMOD
Line Analysis
Specimen Surface
0
5
10
15
20
25
30
35
40
45
50
0 1 2 3 4 5 6 7CMOD (mm)
Load
(kN
)
Photographs (See Line Analysis SS69-s0)
3
6
0.0
0.2
0.4
0.6
0.8
1.0
1.2
1.4
-10 0 10 20 30 40 50Position in front of notch tip (mm)
Dis
plac
emen
t of l
ine
#5(1
2.5
mm
from
NM
P) (m
m)
Photo 3
Photo 6
Back End of specimen
NOTCH
Relating P-CMOD curves to Surface Line
Analysis Plots
Photo 6

0
5
10
15
20
25
30
35
40
45
50
0 1 2 3 4 5 6 7CMOD (mm)
Load
(kN
)
Photographs (See Line Analysis SS69-s0)
3
67
0.0
0.2
0.4
0.6
0.8
1.0
1.2
1.4
-10 0 10 20 30 40 50Position in front of notch tip (mm)
Dis
plac
emen
t of l
ine
#5(1
2.5
mm
from
NM
P) (m
m)
Photo 3
Photo 6
Photo 7
Back End of specimen
NOTCH
Relating P-CMOD curves to Surface Line
Analysis Plots
Photo 7
0
5
10
15
20
25
30
35
40
45
50
0 1 2 3 4 5 6 7CMOD (mm)
Load
(kN
)
Photographs (See Line Analysis SS69-s0)
3
8
67
0.0
0.2
0.4
0.6
0.8
1.0
1.2
1.4
-10 0 10 20 30 40 50Position in front of notch tip (mm)
Dis
plac
emen
t of l
ine
#5(1
2.5
mm
from
NM
P) (m
m)
Photo 3
Photo 6
Photo 7
Photo 8
Back End of specimen
NOTCH
Relating P-CMOD curves to Surface Line
Analysis Plots
Photo 8

0
5
10
15
20
25
30
35
40
45
50
0 1 2 3 4 5 6 7CMOD (mm)
Load
(kN
)
Photographs (See Line Analysis SS69-s0)
9
3
8
67
0.0
0.2
0.4
0.6
0.8
1.0
1.2
1.4
-10 0 10 20 30 40 50Position in front of notch tip (mm)
Dis
plac
emen
t of l
ine
#5(1
2.5
mm
from
NM
P) (m
m)
Photo 3
Photo 6
Photo 7
Photo 8
Photo 9
Back End of specimen
NOTCH
Relating P-CMOD curves to Surface Line
Analysis Plots
Photo 9
0
5
10
15
20
25
30
35
40
45
50
0 1 2 3 4 5 6 7CMOD (mm)
Load
(kN
)
Photographs (See Line Analysis SS69-s0)
9
3
12
8
67
0.0
0.2
0.4
0.6
0.8
1.0
1.2
1.4
-10 0 10 20 30 40 50Position in front of notch tip (mm)
Dis
plac
emen
t of l
ine
#5(1
2.5
mm
from
NM
P) (m
m)
Photo 3
Photo 6
Photo 7
Photo 8
Photo 9
Photo 12
Back End of specimen
NOTCH
Relating P-CMOD curves to Surface Line
Analysis Plots
Photo 12

0
5
10
15
20
25
30
35
40
45
50
0 1 2 3 4 5 6 7CMOD (mm)
Load
(kN
)
Photographs (See Line Analysis SS69-s0)
9
3
1412
8
67
0.0
0.2
0.4
0.6
0.8
1.0
1.2
1.4
-10 0 10 20 30 40 50Position in front of notch tip (mm)
Dis
plac
emen
t of l
ine
#5(1
2.5
mm
from
NM
P) (m
m)
Photo 3Photo 6Photo 7Photo 8Photo 9Photo 12Photo 14
Back End of specimen
NOTCH
Relating P-CMOD curves to Surface Line
Analysis Plots
Photo 14
0
5
10
15
20
25
30
35
40
45
50
0 1 2 3 4 5 6 7CMOD (mm)
Load
(kN
)
Photographs (See Line Analysis SS69-s0)
9
3
221412
8
67
0.0
0.2
0.4
0.6
0.8
1.0
1.2
1.4
-10 0 10 20 30 40 50Position in front of notch tip (mm)
Dis
plac
emen
t of l
ine
#5(1
2.5
mm
from
NM
P) (m
m)
Photo 3Photo 6Photo 7Photo 8Photo 9Photo 12Photo 14Photo 22
Back End of specimen
NOTCH
Relating P-CMOD curves to Surface Line
Analysis Plots
Photo 22

0
5
10
15
20
25
30
35
40
45
50
0 1 2 3 4 5 6 7CMOD (mm)
Load
(kN
)
Photographs (See Line Analysis SS69-s0)
9
3
2214
24
12
8
67
0.0
0.2
0.4
0.6
0.8
1.0
1.2
1.4
-10 0 10 20 30 40 50Position in front of notch tip (mm)
Dis
plac
emen
t of l
ine
#5(1
2.5
mm
from
NM
P) (m
m)
Photo 3Photo 6Photo 7Photo 8Photo 9Photo 12Photo 14Photo 22Photo 24
Back End of specimen
NOTCH
Relating P-CMOD curves to Surface Line
Analysis Plots
Photo 24
0
5
10
15
20
25
30
35
40
45
50
0 1 2 3 4 5 6 7CMOD (mm)
Load
(kN
)
Photographs (See Line Analysis SS69-s0)
9
3
2214
24
28
12
8
67
0.0
0.2
0.4
0.6
0.8
1.0
1.2
1.4
-10 0 10 20 30 40 50Position in front of notch tip (mm)
Dis
plac
emen
t of l
ine
#5(1
2.5
mm
from
NM
P) (m
m)
Photo 3Photo 6Photo 7Photo 8Photo 9Photo 12Photo 14Photo 22Photo 24Photo 28
Back End of specimen
NOTCH
Relating P-CMOD curves to Surface Line
Analysis Plots
Photo 28

0
5
10
15
20
25
30
35
40
45
50
0 1 2 3 4 5 6 7CMOD (mm)
Load
(kN
)
Photographs (See Line Analysis SS69-s0)
9
3
2214
24
28
29
12
8
67
0.0
0.2
0.4
0.6
0.8
1.0
1.2
1.4
-10 0 10 20 30 40 50Position in front of notch tip (mm)
Dis
plac
emen
t of l
ine
#5(1
2.5
mm
from
NM
P) (m
m)
Photo 3Photo 6Photo 7Photo 8Photo 9Photo 12Photo 14Photo 22Photo 24Photo 28Photo 29
Back End of specimen
NOTCH
Relating P-CMOD curves to Surface Line
Analysis Plots
Photo 29
Correlation of P-CMOD Curves and Line Analysis
Correlation of P-CMOD Curves and Line Analysis
Self-similar damage growth is associated with:
– load-softening behaviour in P-CMOD– steady moving damage front in Line Analysis
plot
05
101520253035404550
0 1 2 3 4 5 6 7CMOD (mm)
Load
(kN
)
0.0
0.2
0.4
0.6
0.8
1.0
1.2
1.4
-10 0 10 20 30 40 50
Position in front of notch tip (mm)
Dis
plac
emen
t of l
ine
#5(1
2.5
mm
from
NM
P) (m
m)
Photo 3Photo 6Photo 7Photo 8Photo 9Photo 12Photo 14Photo 22Photo 24Photo 28Photo 29
SS69-s0 Stitched 5-stack

Techniques are consistentTechniques are consistent
Deply
Compliance
Line Analysis
Heavy Fibre Damage
Light Fibre Damage
27 mm
26.6 mm
34 mm
4mm
Notch Tip
Notch
Notch
Notch
Deply
Compliance
Line Analysis
Heavy Fibre Damage
Light Fibre Damage
27 mm
26.6 mm
34 mm
4mm
Notch Tip
Notch
Notch
Notch
Self-similar Crack Growth (A)Self-similar Crack Growth (A)
Notch Crack Process Zone
Virgin MaterialNotch Crack Process
ZoneVirgin
MaterialNotch Crack Process Zone
Virgin Material
All 90º and 5-stack 0º materials

0º Behaviour: 4 and 6-stack vs. 5-stack0º Behaviour: 4 and 6-stack vs. 5-stack
Only the stitched 4 and 6-stack 0°did not show significant amount of fibre damage
– delamination damage, blunting few millimeters from notch tip
4 and 6-stack 0º
BehaviourStitched and Unstitched
5- stack (and 4, 5 and 6-stack 90º
Behaviour)
Applied displacement,δ
Stitching (Perpendicular to Load/applied displacement)
ii)
Applied displacement,δ
Stitching (Perpendicular to Load/applied displacement)
ii)
Correlation of P-CMOD Curves and Line Analysis
Correlation of P-CMOD Curves and Line Analysis
Blunting (Delamination) fracture response is associated with:
– absence of load-softening in P-CMOD– characteristic kinks in the Line Analysis plot
0.0
0.2
0.4
0.6
0.8
1.0
1.2
-10 0 10 20 30 40 50
Position in front of notch tip (mm)
Dis
plac
emen
t of l
ine
#5(1
2.5
mm
from
NM
P) (m
m)
0.0
1.0
2.0
3.0
4.0
5.0
6.0
7.0
8.0
9.0
10.0
Equi
vale
nt S
trai
n (%
)
Photo 15
Photo 23
Photo 28
Photo 34
Photo 36
SS73-s0 Stitched 6-stack
0
5
10
15
20
25
30
35
40
45
50
0 1 2 3 4 5 6 7CMOD (mm)
Load
(kN
)
Photographs (See Line Analysis SS73-s0)
15
2328
3436
0
5
10
15
20
25
30
35
40
45
50
0 1 2 3 4 5 6 7CMOD (mm)
Load
(kN
)
Photographs (See Line Analysis SS73-s0)
15
2328
3436

Blunting and Specimen Size EffectBlunting and Specimen Size Effect
There was no self-similar crack growth in the OCT specimen for the 4 and 6-stack 0º materialsHowever, this is because the damage height is 60-70 mm as opposed to the ~5 mm seen for the all 90ºspecimens and 5-stack 0ºmaterialTo get self-similar crack growth, specimen size must be large enough
2-5 mm
~60-70 mm
Delamination in 4- and 6-stack Specimens
2-5 mm
~60-70 mm
Delamination in 4- and 6-stack Specimens
Surface Loops in stitched/RFI materialSurface Loops in stitched/RFI material
4-stack4-stack
6-stack6-stack
5-stack5-stack
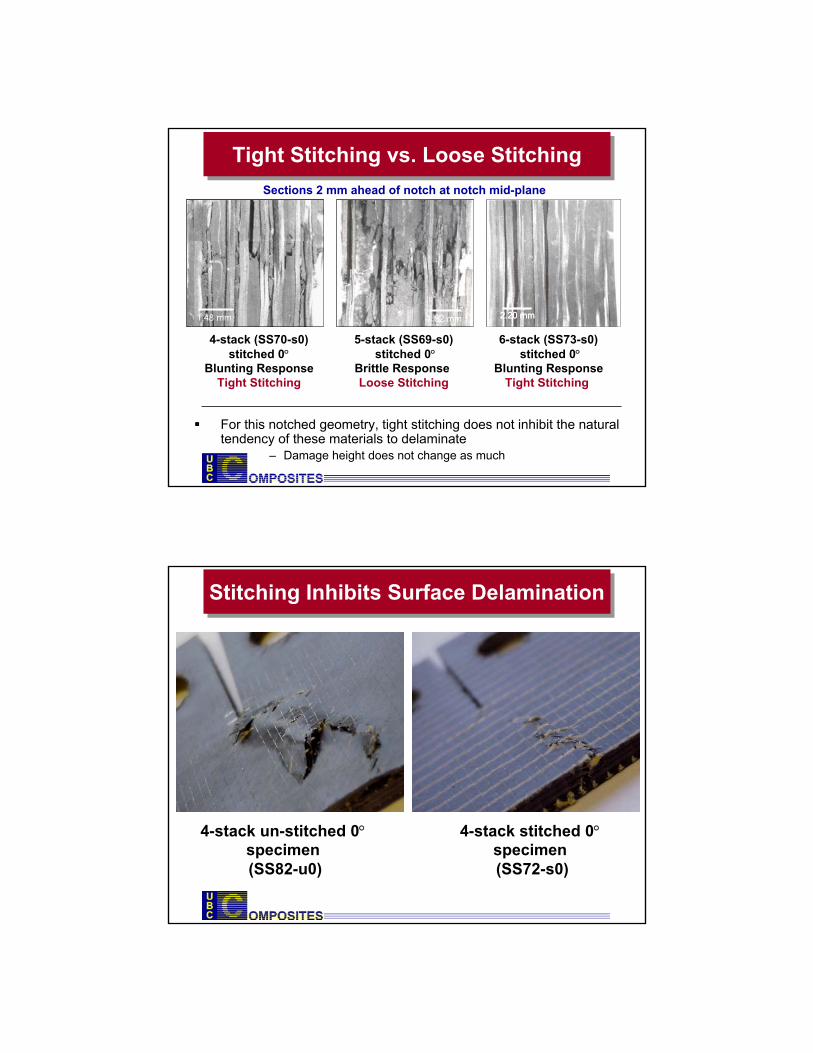
Tight Stitching vs. Loose StitchingTight Stitching vs. Loose Stitching
For this notched geometry, tight stitching does not inhibit the natural tendency of these materials to delaminate
– Damage height does not change as much
4-stack (SS70-s0)stitched 0°
Blunting ResponseTight Stitching
5-stack (SS69-s0)stitched 0°
Brittle Response Loose Stitching
6-stack (SS73-s0)stitched 0°
Blunting ResponseTight Stitching
Sections 2 mm ahead of notch at notch mid-plane
1.48 mm1.48 mm 1.82 mm1.82 mm 2.20 mm2.20 mm2.20 mm
Stitching Inhibits Surface DelaminationStitching Inhibits Surface Delamination
4-stack un-stitched 0°specimen(SS82-u0)
4-stack stitched 0°specimen(SS72-s0)

Strain-softening material modelStrain-softening material model
Three parameter input:fracture energy release rate GF
material tensile strength σpeak or strain at σpeak
initial modulus E0
A simple bilinear damage model has been implemented in ABAQUS finite element code.
• implicit solution scheme allows efficient solution of quasi-static tests
• orthotropic → parameters defined in each direction
G (J/m2) = γ x he
σ
εεpeak
σpeak
γ
εf
McClennan M.A.Sc work 2004
Numerical Predictions: Parametric StudyNumerical Predictions: Parametric Study
0
2
4
6
8
10
12
14
16
0 0.5 1 1.5 2 2.5 3 3.5 4 4.5CMOD (mm)
Load
(kN
)
Increasing σ peak
(420, 440, 460, 480 MPa)
Increasing G c
(70, 75, 80, 85 kJ/m2)
McClennan M.A.Sc work 2004

Load - CMOD ResultsLoad - CMOD Results
0
2
4
6
8
10
12
14
16
0.0 1.0 2.0 3.0 4.0 5.0
CMOD (mm)
Load
(kN
)
0
2
4
6
8
10
12
14
16
0.0 1.0 2.0 3.0 4.0 5.0
CMOD (mm)
Load
(kN
)ρ = 1 mm
ρ = 4 mm
E0 = 32 GPa
GF = 80 kJ/m2
σpeak = 460 MPa
Input Parameters:
McClennan M.A.Sc work 2004
Input Parameters:
0
2
4
6
8
10
12
14
16
18
0.0 1.0 2.0 3.0 4.0 5.0
CMOD (mm)
Load
(kN
)
Load - CMOD ResultsLoad - CMOD Results
ρ = 32 mm
ρ = 38 mm
E0 = 32 GPa
GF = 80 kJ/m2
σpeak = 460 MPa0
2
4
6
8
10
12
14
16
18
0.0 1.0 2.0 3.0 4.0 5.0
CMOD (mm)
Load
(kN
)
McClennan M.A.Sc work 2004

ConclusionsConclusions
Self-similar crack growth consisting of a process zone that coalesces into a through crack observed
– For 3 out of 4 cases tested using OCT geometry– Damage height was ~5 mm, consisting of fibre breakage,
matrix cracking and delaminationOne case (0º 4 and 6-stack) did not show self-similar growth, and blunted in this OCT geometry
– Much larger damage height at ~65 mm, and thus unable to grow in self-similar manner in this OCT geometry
In this OCT geometry, tight stitching had no effect on behaviour of 0º specimens
– Large delamination height leading to blunting.– Fibre damage due to stitching present but did not affect
measured behaviour
Conclusions (2)Conclusions (2)
However, loose stitching, as observed in 5-stack panel, had an effect, inhibiting delamination and leading to self-similar crack growth– Poses question regarding stitch tension control and quality
controlCombination of P-δcurves, line analysis, sectioning, and deply provides very coherent and consistent picture of response– Combined with other tests such as tensile and bend tests,
allows for calibration of damage and strain-softening modelsA simple strain-softening model does good job of predicting response– Including transition from stable to unstable response