an experiment with peer instruction in computer science · pdf file1 an experiment with peer...
TRANSCRIPT
1
An Experiment with Peer Instruction in Computer Science to Enhance
Class Attendance
C. M. Keet
University of Cape Town, South Africa
Class attendance of computer science courses in higher education is typically not
overwhelming. Anecdotal reports and the authors’ experiences with a low-resource mode
of peer instruction indicated increased class attendance after a lecture with such concept
tests. This has been evaluated systematically with a 3rd-year computer science module
using a medium-resource, software-based, Audience Response System (‘clickers’). Results
show there is neither a positive nor a negative relation between lectures with peer
instruction (PI) and class attendance. The student participation rate in software-based
voting decreased and some decline in lecture attendance was observed. Thus, PI itself
could not be shown to be a useful strategy to enhance class attendance. Notwithstanding,
the students’ evaluation of the use of PI was a moderately positive.
Introduction
Decreasing class attendance has been noted as a problem for most computer science
modules in the Computer Science Department at UCT, and it has been observed
(anecdotally) at other institutions of higher education as well. Various hypotheses and
opinions exist to explain why this is the case. Among others, it may be because of the
standard practice of the ‘sage on a stage’ adopted due to the theoretical, abstract, nature of
the material, which can make a lecture dull. Lectures and lecturers do add value in various
ways, however, and students miss out not attending them1. The assumption is that a
different set-up of the lecture, being a more interactive way of knowledge transfer and
learning, will increase attendance. The challenge, then, is how to make the lectures at least
less dry and passive ‘sponge’-like so as to make students want to come to lectures.
Several possibilities to change the lecture format exist, such as the “flipped classroom”
(Tucker, 2012), converting at least part of the lecture into a tutorial to give students a
feeling of hands-on experience compared to a set of slides, peer instruction (Crouch and
Mazur, 2001), and other research-based options (Borrego et al., 2013). Peer instruction
(PI) not only encourages students to be active participants in class, but—moreover—it has
been shown that students will learn the concepts better (Crouch and Mazur, 2001). PI has
been used in computer science education, with positive results both regarding student
learning outcomes and grades and their predominantly positive opinion of lectures with PI,
and it is gaining momentum in education research for computer science and engineering
(Bailey Lee et al., 2013; Borrego et al., 2013; Koppen et al., 2013; Simon et al., 2013;
Zingaro & Porter, 2014), with as main online resource http://www.peerinstruction4cs.org.
The authors’ personal experiences with peer instruction in a low resource setting have
been positive, most notably the students’ joy of doing quizzes and it generated an increase
in lecture attendance each lecture after such quizzes were held. However, those numbers of
participation and attendance were only estimated, for they were carried out in a low-
1 Reasons for what they ‘miss out on’ is a separate line of investigation, not pursued here.

2
resource setting2. There are only few other works mentioning PI and lecture attendance
(Duncan, 2006; Kaleta & Joosten, 2007), with unclear results. The hypothesis, then, is that
peer instruction in computer science increases lecture attendance.
To examine the effect of peer instruction on lecture attendance, a subset of the lectures of a
large 3rd-year computer science course on networks each had 2 concept tests (‘quiz
questions’) with PI, where class attendance was counted at the commencement of each
lecture and during the first concept test. To obtain a measure of results, medium-resource
software-based ‘clickers’ (Audience Response Systems, ARS) were used, befitting a
course on computer networks. The results show that peer instruction did not increase class
attendance among the computer networks students after a lecture with PI, and percentage
of voting in the questions declined with each instalment despite that peer discussion had a
beneficial effect on voting results. Notwithstanding the measured decline, course
evaluation revealed a moderately positive opinion of PI.
Literature review: PI in CS
Peer instruction, in short and procedurally, is about students teaching each other (their
peers), where first a multiple choice question (concept test) is posed by the lecturer in
class, students vote on an answer, they then discuss the question and answers with their
neighbours in the lecture, then they vote again on the same question, and finally there is a
class-wide discussion of the question. This makes a lecture at least more active compared
to knowledge transfer by means of a monologue by the lecturer (also referred to
colloquially ‘sage on a stage’). Such a general shift toward the implementation of the
theory of active learning may have been encouraged by the ARS technologies, but
experiments to date, which are mostly carried out in STEM fields, focus more on the
implementation and effects of ASR for PI on learning outcomes and student perception
rather than pedagogical theories or what the right conditions are for using ARSs (Good,
2013). A recent literature review by Good (2013) on the use of ARS for PI notes its overall
positive effects, albeit with various ifs and buts. Regardless, peer instruction in Computer
Science (CS) is gaining momentum after its successful introduction in physics (Crouch &
Mazur, 2001) and elsewhere, such as genetics, astronomy, and veterinary dermatology
(Duncan, 2006; Good, 2013; Smith et al., 2009).
PI in CS is still at the stage of having to argue its usefulness. This is in particular for
higher-level CS courses that typically deal with very abstract ideas and concepts, with
complex judgement of design trade-offs, and advanced mathematics that does not seem to
lend itself well for bite-sized quizzes. Bailey Lee et al. (2013) validated empirically
repeatable student gains and overwhelming positive feedback with the courses they
experimented with, being the engineering-oriented computer architecture and
mathematics-oriented theory of computation (though the latter is taught only to a very
limited extent in South Africa (Keet, 2013)). Although the quiz questions (available from
peerinstruction4cs.org) are not as deep as the Gradiance multiple-choice questions based
on “root questions” (Ullman, 2005), they demonstrate that concept questions for such
advanced theoretical courses are feasible. To the best of our knowledge, no such resources
exist for the topic we focus on (computer networks). While the setting of experiments on
2 That is, without ‘clickers’ to measure participation: it proceeds by using the fingers of one’s hand
against one’s chest to indicate a vote so that the lecturer can get an impression of the votes. In
practice, it also occurred that students said their vote aloud.

3
PI in CS typically occurs at large research-led universities, it also has been shown to be
effective at small so-called ‘liberal arts colleges’ (Porter et al., 2013).
Students generally have a positive opinion of students about PI (e.g., Duncan (2006), Good
(2013) and references therein). Simon et al. (2013) investigated in a targeted experiment
on students’ perceptions of PI for CS as well. They concluded that students find lectures
with peer instruction overwhelmingly “interactive” (argue/explain concepts, learn from or
teach partner) as compared to plain “active” (listening and/or note-taking), with the former
decidedly deemed positive by the students for a broad range of reasons, such as valuing the
interaction in the classroom with peers, higher perceived approachability of the lecturer,
and a community spirit.
Besides the basic or ‘classic’ process of PI as outlined at the start of this section, several
variations exist that have been shown to improve the overall positive effects of PI, such as
PI for marks (Zingaro & Porter, 2014) and the measured added benefits of lecturer-led
class-wide discussion (Zingaro & Porter, 2014). Further, group discussion works best
when between 35-70% of the students give a correct answer during the first vote (Crouch
& Mazur, 2001), although voting for a wrong answer with subsequent discussion is
beneficial to learning anyway (Smith et al., 2009). Other modifications have to do with the
actual voting. Besides the tried-and-tested hardware-based ARSs, medium resource
software-based ARSs are being used (e.g., Koppen et al., 2013), which are typically
conducted with the students’ laptop or smartphone and a wireless connection to an online
resource. This may be considered exceedingly applicable in CS courses, because CS
students tend to have mobile devices more often than in other disciplines. Some decline in
quiz participation with the online voting systems have been observed over the duration of a
course in the semester, but 75% of the students still actively participate in answering the
question even though not pressing the button to vote (Koppen et al., 2013).
Thus, there are several initial experiments and results with PI in CS that focus on
feasibility, improved student learning, and student experience. To the best of our
knowledge, no experiment has been conducted to assess whether PI in CS will increase
lecture attendance (or at least not decrease it). Duncan (2006) does state it can be used to
increase class attendance, but a reference to the study claiming an increase from 60-70% to
80-90% attendance after the introduction of clickers at the University of Colorado is
missing. Kaleta & Joosten (2007) indirectly indicate that PI may increase class attendance,
as students like the active learning and 64% of the students would sign up for another
course that uses clickers; similar indirect indications can be found elsewhere (see, e.g.,
Duncan (2006) and references therein). Thus, this still leaves open whether including
concept questions will increase class attendance, or at least not decrease it.
Materials and Methods
We first describe the set-up of the experiment, and subsequently describe the setting of the
course where the experiment was conducted.
Set-up, running, and evaluation of the peer instruction
This section outlines the overall set up and the motivation of selection of the PI technology
chosen.
The methodology can be summarised as follows.
1. Decide on medium-resource (wifi and software) PI set up, comprising: a) Examine
options and choose which online tool to use; b) Devise a back-up solution if either
4
it does not work in the venue for some reason or too many students do not have a
laptop or smartphone to participate.
2. Select the lectures when to use PI: given that there will be 19 lectures (see below):
lectures 3, 7, 11, and 15.
3. Create questions for the relevant sections of the course material, given the
indication when to use PI.
4. Record the number of students in class for each of the 19 lectures by silent manual
headcount by the lecturer.
5. Make any other notes that may be relevant; e.g., the lecture is on a day between
public holidays, how the quiz participation is perceived, etc.
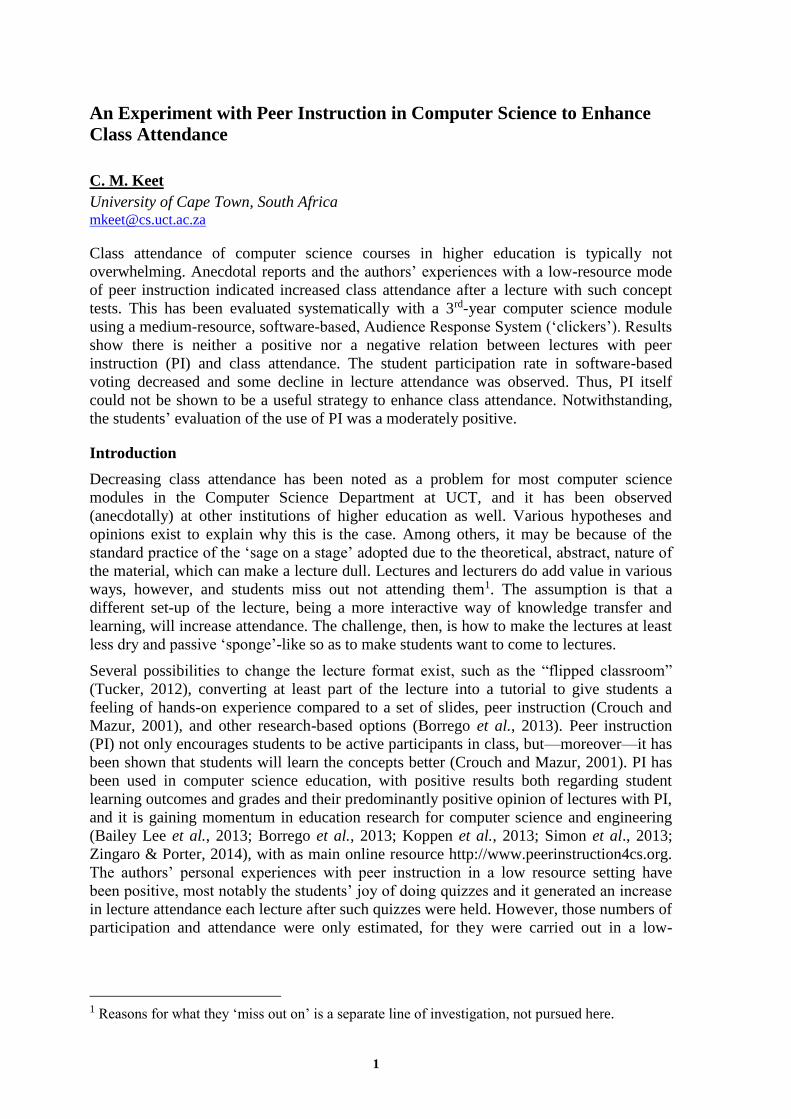
6. Conduct PI and record participation in the quiz and the answers, being both the
first answer and, where applicable, the repeat answer after the peer discussion. The
process is modified slightly to incorporate the observations by Crouch & Mazur
(2001) that peer discussion is most effective when 35-75% had the question correct
in the first vote, and that class-wide discussions do contribute to understanding
(Zingaro & Porter, 2014) and to stimulate discussion for the <30% correct answer
instances; see Figure 1.
7. Evaluate the data in standard spreadsheet software, including the number of
students attending, number of votes cast, average number of votes cast, and the
percentage of participation in the quizzes (calculated as [avg no. of votes for
instalment]/[no. of students attending that lecture]*100).
8. Use the general course and lecturer evaluation forms to obtain feedback about the
PI specifically:
o Lecturer evaluation: One closed question is added, being “Quizzes: To what
extent did they make the lectures more interesting or useful? (1: not at all
… 5: very interesting and/or useful)”, and the question-associated
“comments” section.
o Course evaluation: The standard question on quizzes is used, being
“Quizzes: were you satisfied with the content and frequency of quiz
questions in the lectures?”, which has as answer options ‘poor’, ‘below
average’, ‘average’, ‘good’, ‘excellent’.
Figure 1. PI in the classroom. A: original version; B: slightly modified PI process (with input from
experiences and suggestions by Crouch & Mazur (2001) and Zingaro & Porter (2014)).
Concerning the materials, the wireless connection and online voting with a ‘software-
based clicker’ will be used. In order to determine suitable ‘clicker software’, several
sources were consulted and tools explored. This concerns principally the clicker software
evaluation by the Princeton University Educational Technologies (McGraw Centre for

5
Teaching & Learning, 2012), covering 19 different software-based ARSs. Several software
ARSs did not appear to meet the basic requirements upfront (Socrative3 and eClicker4),
and four were selected for evaluation, being Google Forms5, Mentimeter6, Pinnion7, and
Qurio8 that all have a free version. Google Forms and Pinnion are too cumbersome for
releasing the individual questions to the students in a classroom setting and Qurio had an
annoying website. This left Mentimeter as best option for this experiment. It has a limited
free version, the backend administrator side is easy, and each question can be released on
the fly with a simple URL, and has an easy reset button for the revote. The free version
does not permit export of the results, which can be remedied by taking a screenshot of the
results page. Limitations for which there are no workarounds are that it does not allow for
pictures in the question, and the answer options have a maximum of 100 characters. For
those questions where the answers were longer than 100 characters or had a diagram, the
‘offline’ version of the question was projected on screen during voting.
The time-consuming aspect for the set-up is the generation of good concept test questions,
most of which have to be developed specifically for this experiment. The questions will be
developed ‘offline’ in a separate file, which functions as backup in case of a network
outage, and subsequently copied into Mentimeter for use in the lecture. A selection of the
full set of prepared questions is included in the Appendix, and one is depicted in Figure 2
and explained afterward.
Figure 2. One of the more advanced concept questions later in the course.
This question for lecture 15 (Figure 2) tests whether students can apply the Address
Resolution Protocol (ARP) and, more importantly, understand the conceptualization of the
division between, and separation of, data link layer and network layer services, which has
3 http://www.socrative.com/ 4 http://eclicker.com/ 5 http://docs.google.com 6 http://www.mentimeter.com 7 http://www.pinnion.com/ 8 http://www.qurio.co/
6
as further underlying principle the idea of layering (which is part of the “great principles in
CS”). Option A can be true, because of host A’s broadcast, which is a basic ARP
operation, and so is what is described in option B. Option C versus D is really about the
separation of link and higher-level network layer services, for which a basic understanding
of ARP is required. Link layer MAC addresses (like 49-BD-D2-C7-56-2A) only operate
within that subnet cf. IP addresses (like 111.111.111.111) that operate at the network layer
and, unlike MAC addresses, can pass through router R. Thus, the IP address of hosts A and
B can pass through R, but the MAC addresses remain on each subnet, i.e., D is correct.
The consequence of this separation is that when router R receives a packet addressed to
449-BD-D2-C7-56-2A, it will discard it before even looking at the IP address, because its
address on that side is E6-E9-00-17-BB-4B (evaluating that that packet is not for itself),
thus C is the correct answer: a packet with those destination addresses can never arrive at
host B.
Setting of the course
The experiment will be conducted in the “Networks course” in 2014, which is the third
block of the larger course CSC3002F taught in the first semester. CSC3002F is split into a
block on operating systems, one on functional programming, and, last, computer networks.
Practically, this means that computer networks is taught from mid-April to the end of May
over 19 lectures, one each working day from 9:00-9:45. With the current academic
timetable, there are many public holidays in that period. Class attendance is highly
recommended, but not compulsory, and there are no attendance registers. Labs are largely
self-directed, and students are expected to spend two afternoons each week on the
exercises and the assignment. The course is compulsory for all computer science students
at level 3, and it is elective for computer engineering students, comprising typically about
100 registered students.
Computer networks is a regular course and is internationally not known for being
comparatively easy or hard. The course content consists of chapters 1-6 of the textbook
(Kurose and Ross, 2013), which amounts to roughly 3 lectures per chapter. The book’s
instructor materials has 90-140 slides per chapter, which would amount to 1 minute per
slide if used in full. The number of slides were reduced, creating time for interaction with
the class whilst ensuring maintaining compliance with the ACM curriculum guidelines for
computer science (Joint Task Force ACM & IEEE, 2013).
Results
We describe first the results on PI and class attendance, then the course and lecturer
evaluation, and close with some observations on the PI learning curve for students.
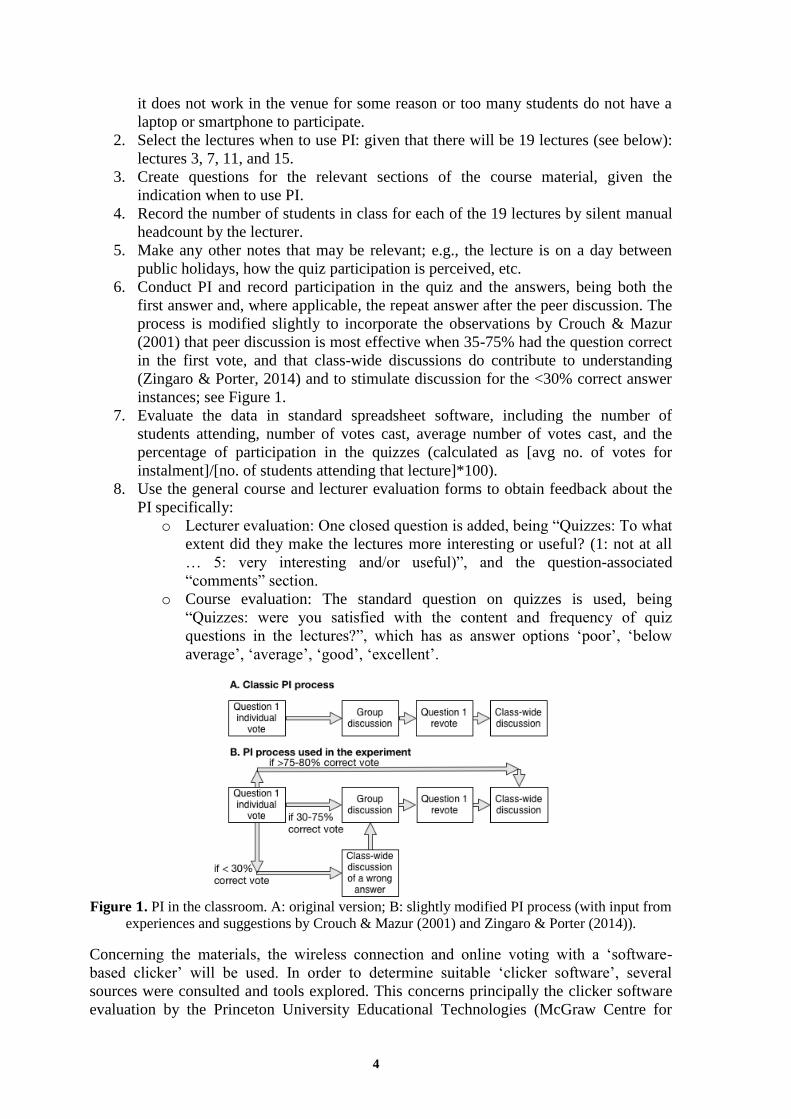
Peer Instruction and class attendance. 104 students are registered for the course, and at the
first networks lecture, about 60 students attended. Student attendance per lecture is
depicted in Figure 3; they are rounded up from the count at the start because several
students typically arrive in the first 5-10 minutes of the lecture. The relative dip in
attendance of lecture 6 may be due to it being on Friday, May 2, where May 1 was a public
holiday, suggesting an extended weekend, and lecture 12 (May 14) was at the same date as
the assignment deadline. A “topical relevance” email was sent after lecture 9 about net
neutrality, which had its main relevance for lecture 11, and a slight increase in attendance
was noted, but this may also be because it was the lecture before the assignment deadline.
7
Figure 3. Student attendance (Y-axis) at each lecture (X-axis), and averages of amount of votes for
the concept questions.
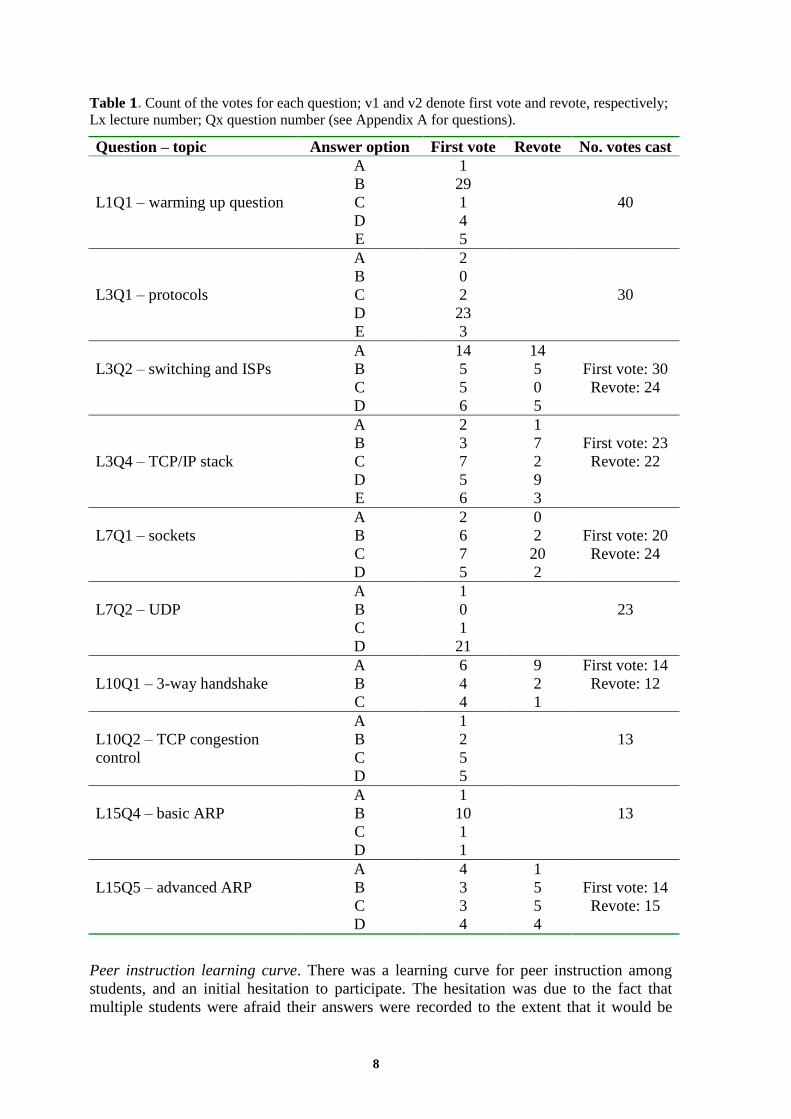
The schedule set out for the quiz questions—lectures 3, 7, 11, and 15—was not fully
adhered to due to being out of step with sensible PI times with respect to the material
covered. Peer instruction was used during lectures 3, 7, 10, and 15. Because the material
was covered at a slightly different pace than initially planned, overall, 22 questions were
prepared and 10 have been used. Table 1 shows the voting response rates by question. The
average amount of votes per question for an entire PI session is included in Figure 3. It can
be calculated form this data that the percentage of students participating in the concept
tests shows a gradual decline: from 67% for the test question in the first lecture, to 57% in
lecture 3, 50% in lecture 7, 43% in lecture 10, down to 40% in the final instalment during
lecture 15. No increase in attendance after the more interactive lecture with peer
instruction can be observed. There is also no substantial decrease after the lecture with
peer instruction, although there is a slow gradual decline in attendance from about 45% to
about 25-30%.
Course evaluations. There were 43 answers for the question about quizzes. Aggregating
the 5 options to three, then 11 considered it below average, most students considered it
average (n = 22, i.e., 51%), and 10 above average, which is overall slightly positive. The
lecturer evaluation form’s question about the quizzes had 26 answers (of which 7 chose
N/A) with a mean of 3.38 out of 5. A total of 6 students considered it below average, 7
average, and 13 above average (i.e., chose 4 or 5 on the 5-point Likert scale), which is
overall more positive than the course evaluation feedback. Furthermore, there were PI-
specific comments on the PI-question and overall comments sections in line with
observations by others (see Discussion):
- “I liked the quizzes, they made the lectures more interactive.”
- “It was good to see a computer science lecturer actually make use of technology
other than powerpoint.”
- “The online voting tool that [xxx] used made the lectures more interesting and
useful, as it encouraged class participation.”
- “Using GoVote really added to the lectures.”
- “enjoyed the online classes quizzes helped me stay awake!”
There were three comments in the open-ended comments section of the type “those
lectures were quite boring”, but it cannot be determined whether those students had
attended the PI lectures (their self-reported lecture attendance was 0-50% or 50-80%).
8
Table 1. Count of the votes for each question; v1 and v2 denote first vote and revote, respectively;
Lx lecture number; Qx question number (see Appendix A for questions).
Question – topic Answer option First vote Revote No. votes cast
L1Q1 – warming up question
A 1
40
B 29
C 1
D 4
E 5
L3Q1 – protocols
A 2
30
B 0
C 2
D 23
E 3
L3Q2 – switching and ISPs
A 14 14
First vote: 30
Revote: 24
B 5 5
C 5 0
D 6 5
L3Q4 – TCP/IP stack
A 2 1
First vote: 23
Revote: 22
B 3 7
C 7 2
D 5 9
E 6 3
L7Q1 – sockets
A 2 0
First vote: 20
Revote: 24
B 6 2
C 7 20
D 5 2
L7Q2 – UDP
A 1
23
B 0
C 1
D 21
L10Q1 – 3-way handshake
A 6 9 First vote: 14
Revote: 12
B 4 2
C 4 1
L10Q2 – TCP congestion
control
A 1
13
B 2
C 5
D 5
L15Q4 – basic ARP
A 1
13
B 10
C 1
D 1
L15Q5 – advanced ARP
A 4 1
First vote: 14
Revote: 15
B 3 5
C 3 5
D 4 4
Peer instruction learning curve. There was a learning curve for peer instruction among
students, and an initial hesitation to participate. The hesitation was due to the fact that
multiple students were afraid their answers were recorded to the extent that it would be

9
revealed who answered what, and the syllabus of the course as a whole announced that
quizzes may be for marks. It had to be repeated several times it was not for marks and that
Mentimeter does not log who voted what9. Regarding the learning curve of peer instruction
itself, the results of L3Q2 compared to L7Q1 show this well (see Table 1). For the first real
instalment, L3Q2, it still was about voting, then waiting and chatting, and then re-voting.
Form the voting pattern it can be seen that the students who had it wrong the first time
(option C, which was explained why it was not correct) simply did not vote the second
time—30 votes versus 24 votes, where 5 had been given to option C—with the rest voting
as they had voted before. In contrast, in lecture 7 they were very explicitly instructed they
really had to convince their neighbours of their answer and not use the opportunity to catch
up with what they did in the weekend or chat about other things like the previous time
(L3Q2). This had the desired effect, as can be seen by comparing the First vote and Revote
of L7Q1 in Table 1, and it generated joy and laughter in class when the results of the re-
vote were shown (see Figure 4). While peer instruction in the sense of enhancing concept
understanding was not the aim, its beneficial effect is nicely illustrated with L7Q1’s vote
and revote results, which was also observed with L10Q1 and its revote. L15Q5 (recall
Figure 2) had too few correct answers in the first vote—it was almost a random distribution
(see Table 1)—and, as observed elsewhere (Crouch & Mazur, 2001), peer discussion is
then fruitful to find the correct answer only to a very limited extent.
Figure 4. Screenshot of the results of Lecture 7, Question 1, re-vote after discussion.
Discussion
The low first-lecture attendance of about 60%, and from the second lecture 45% of the
registered students, indicate that a majority is ‘lost’ upfront and likely will not even have
been aware peer instruction was being used. It suggests that a core of students diligently
attends lectures regardless the quality of the lectures, and it might not make a difference
what is done during the lectures. Either way, PI specifically did not increase lecture
attendance. The comments in the lecturer and course evaluations, however, do suggest PI
is deemed an improvement. The type of feedback obtained from the evaluation, including
different motivations for the positive opinions, concurs with Simon et al.’s (2013) data
9 Mentimeter most probably does log usage (IP address, at least), but this information is not
available to Mentimeter users.
10
about the wide range of reasons for liking peer instruction and suggests it may be useful to
continue with peer instruction, even if only for the benefit of the minority who attends
lectures.
It cannot be excluded that PI was not explained sufficiently well, which is known to
contribute to lack of enthusiasm to participate (see Good (2013) and references therein),
and it could be that it has not been used often enough so that its effects would be too
limited to note (Duncan, 2006), which can be evaluated with successive instalments of the
course. Also, one could conjecture that the book may be clear enough so that students may
be able to master its contents without attending the lectures; however, testing such a
hypothesis would be unethical, and the exam results were not very good. Overall, it
remains guesswork as to why many students do not attend lectures and there are many
other research-based instructional strategies one can choose from, such as Think-aloud-
paired problem solving and Think-pair-share (Borrego et al., 2013). To better choose
interventions to increase lecture attendance, it would be useful to first find out why
attending students do attend, and why those who do not, stay away, compared to more in-
depth PI evaluation, such as validating the known Normalised Gain of PI (about 34%-45%
(Bailey Lee et al., 2013)).
Several other useful observations can be made based on the data obtained. First, decline in
participation as measured by Mentimeter in first instance might indicate that the students
got bored with ‘quizzes’ and they were unfamiliar with them in this form. The more likely
reasons probably have to do with the more mundane aspects of timeously logging on to the
wireless network or the mobile device being low on battery, which were observed by
Koppen et al. (2013), but they also found out that in the absence of a mobile device to
vote, only 1% “didn’t think along”, some thought about the question and the vast majority
worked together with their neighbour(s), having validated results obtained elsewhere
(Smith et al., 2009). Thus, a lower measured voting rate does not imply lower
participation rate.
Second, none of the tested software ARSs was ideal. Mentimeter’s artificial limit on
question and answer lengths does not fit CS well, and an option to use diagrams will make
the presentation better compared to the clumsy dual view of the voting page online and the
‘offline’ question in OpenOffice Writer. The need for more characters and diagrams is
implicitly also present in the computer architecture and theory of computation PI
questions—9 of the 11 questions in (Bailey Lee et al., 2013) go beyond Mentimeter’s
question capabilities—and theory of computation and several other CS courses also need
mathematics symbols. Failing extant software-based ARSs, we plan to design our own one
for the next instalment.
Third, reflections can be made on the so-called “fidelity of implementation” of the
research-based instructional strategy, which varies widely in general (Borrego et al.,
2013). This experiment also had one of the many possible permutations that stay faithful to
the classic PI process (recall Figure 1). Besides the emphasis on lecture attendance and the
observation that discussion among students improves their understanding, it may be that
some of the questions were not as good as they should have been. Unlike in physics, a
concept inventory does not exist for CS, and, to the best of our knowledge, no concept
tests existed yet for networks and thus had to be created for this course. The quality of
Concept Tests, then, rely in part on knowing all common misconceptions and to have those
woven into the answer sets. Some of the questions prepared could possibly be categorised
under, and pushed into, pre-lecture readings and self-tests (see Appendix for a selection of
the prepared questions). Although adding pre-lecture quizzes to the overall PI process may
11
be beneficial (Crouch & Mazur, 2001), it will require a substantial change in learning
pattern of the students and such pre-lecture quizzes have the danger that when a student
does perform well on them, it may give a false sense of security of knowing all testable
content. Notwithstanding, the textbook is quite detailed in its explanations, and it may be
tried out for the next instalment. Further, the amount and difficulty of the concept test
questions and PI intervention will be extended for the next instalment of the course—if not
for increased attendance, then at least a better grade for the course, which in turn may
motivate students to come to the lectures.
Conclusions
Using peer instruction has not resulted in increased class attendance. It has not resulted
into a stark decline due to the quizzes either. The student participation rate in voting
decreased from 57% to 40% and an overall decline in attendance was observed from about
45% to 25-30%. Whether the participation is thanks to the peer instruction, or because a
hard-core group of students diligently attend lectures anyway, is unclear. Student
evaluations indicate a moderately positive opinion of the use of peer instruction. Together
with noted improvements in course grades elsewhere, the results are in favour of
continuation of peer instruction. Nevertheless, it would be useful to determine why
students stay away so as to devise an experiment that may have a higher likelihood to be
effective in increasing lecture attendance.
References
Bailey Lee, C., Garcia, S. & Porter, L. (2013). Can Peer Instruction Be Effective in Upper-Division
Computer Science Courses? ACM Transactions on Computing Education, 13(3), 12-22.
Borrego, M., Cutler, S., Prince, M., Henderson, C & Froyd, J.E. (2013). Fidelity of Implementation
of Research-Based Instructional Strategies (RBIS) in Engineering Science Courses. Journal of
Engineering Education, 102(3), 394-425.
Crouch, C.H. & Mazur, E. (2001). Peer Instruction: Ten years of experience and results. American
Journal of Physics, 69, 970-977.
Duncan, D. (2006). Clickers: A new teaching aid with exceptional promise. Astronomy Education
Review, 1(5), 70-88.
Good, K.C. (2013). Audience Response Systems in higher education courses: A critical review of
the literature. International Journal of Instructional Technology and Distance Learning, 10(5),
19-34.
McGraw Centre for Teaching & Learning. (2012). Alternatives to physical clickers in the
classroom. Princeton University Educational Technologies blog. Online:
http://blogs.princeton.edu/etc/2012/04/10/alternatives-to-physical-clickers-in-the-classroom/.
Published: 10-4-2012; last accessed: 17-3-2014.
Joint Task Force on Computing Curricula Association for Computing Machinery (ACM) and IEEE
Computer Society. (2013). Computer Science Curricula 2013—Curriculum Guidelines for
Undergraduate Degree Programs in Computer Science. December 20, 2013. 518p. Online:
http://dx.doi.org/10.1145/2534860; last accessed: 19-1-2014.
Kaleta, R. & Joosten, T. (2007). Student Response Systems: A University of Wisconsin system
study of clickers. EDUCAUSE Center for Applied Research, 10, 1-12.
Keet, C.M. (2013). An Assessment of Theory of Computation in Computer Science Curricula. 21st
Annual Meeting of the Southern African Association for Research in Mathematics, Science, and
Technology Education (SAARMSTE'13). BellVille, South Africa, January 14-17, 2013.
Koppen, E., Langie, G. & Bergervoet, B. (2013). Replacement of a clicker system by a mobile
device audience response system. 41st SEFI Conference. 16-20 September, 2013, Leuven,
Belgium.
12
Kurose, J. & Ross, K. (2013). Computer Networking—A top-down approach. Harlow, UK:
Pearson, 6th ed. (international ed.). 888p.
Porter, L., Garcia, S., Glick, J., Matusiewicz, A. & Taylor, C. (2013). Peer Instruction in Computer
Science at Small Liberal Arts Colleges. ITiCSE’13, ACM Conference Proceedings, July 1–3,
2013, Canterbury, England, UK.
Simon, B., Esper, S., Porter, L. & Cutts, Q. (2013). Student experience in a student-centered peer
instruction classroom. Proceedings of the International Computing Education Research
Conference (ICER’13), ACM Conference Proceedings. 129-136.
Smith, M.K., Wood, W.B., Adams, W.K., Wieman, C., Knight, J.K., Guild, N. & Su, T.T. (2009).
Why peer discussion improves student performance on in-class concept questions. Science, 323,
122-124.
Tucker, B. (2012). The flipped classroom—online instruction at home frees class time for
learning. Education Next, Winter 2012, 82-83.
Ullman, J.D. (2005). Gradiance on-line accelerated learning. Proceedings of the 28th Australasian
Conference on Computer Science. CRPIT vol. 38, 3-6. Newcastle, Australia, 2005.
Zingaro, D. & Porter, L. (2014). Peer instruction in computing: the value of instructor intervention.
Computers & Education, 71, 87-96.
Appendix A: Selection of the Quiz Questions
Notation for the questions numbers: LecturenumberQuestionnumber, boldface: question used during that
lecture, plaintext: not used; italics: correct answer.
L3Q4: Consider the IP stack. Which of the following is true?
A. Application layer: networked applications, like FaceBook
B. Transport layer: process-process data transfer
C. Network layer: packets sent through various ISPs from source to destination
D. Link layer: data transfer between neighbouring routers
E. Physical layer: bits on the transmission medium
Many new terms have been introduced at this stage, and this question is about putting the right ones together
and to go over the notion services at each layer. Hence, this is essentially a recall question.
L7Q2: Which of the following statements is true about UDP?
A. UDP does not do demux
B. UDP uses a selective repeat as part of its protocol, to make sure all the packets arrive
C. The connection-oriented aspect for UDP is handled by the lower (network) layer
D. There is no handshaking between sender and receiver in UDP
The underlying issue is that UDP is connection-less, unlike TCP, which has several processes and
consequences, no handshaking is one of them.
L10Q1. Why is a three-way handshake needed for TCP connections, rather than a two-way handshake?
Choose the best option.
A. With a two-way handshake, then if the client terminated after the SYN message, but the server
receives and accepts the SYN message, connections are left open but there is no client anymore,
which is an undesirable state and is prevented by 3-way handshake.
B. The three-way handshake is needed because the server needs to know whether the client accepts the
sequence number proposed by the server, which is not guaranteed to with only a two-way
handshake.
C. The server needs to know from the client whether the client has received its SYNACK message
correctly, so that it can open the port it has reserved for the client, whereas with a two-way
handshake it would never open the port because there is no guarantee that the client is still alive for
the connection.
This question probes deeper into handshaking, and understanding the reasons behind it.
L10Q5. BGPs. Consider the network below in which network W is a customer of ISP A, network Y is a
customer of ISP B, and network X is a customer of both ISPs A and C. What routes will X advertise to A?
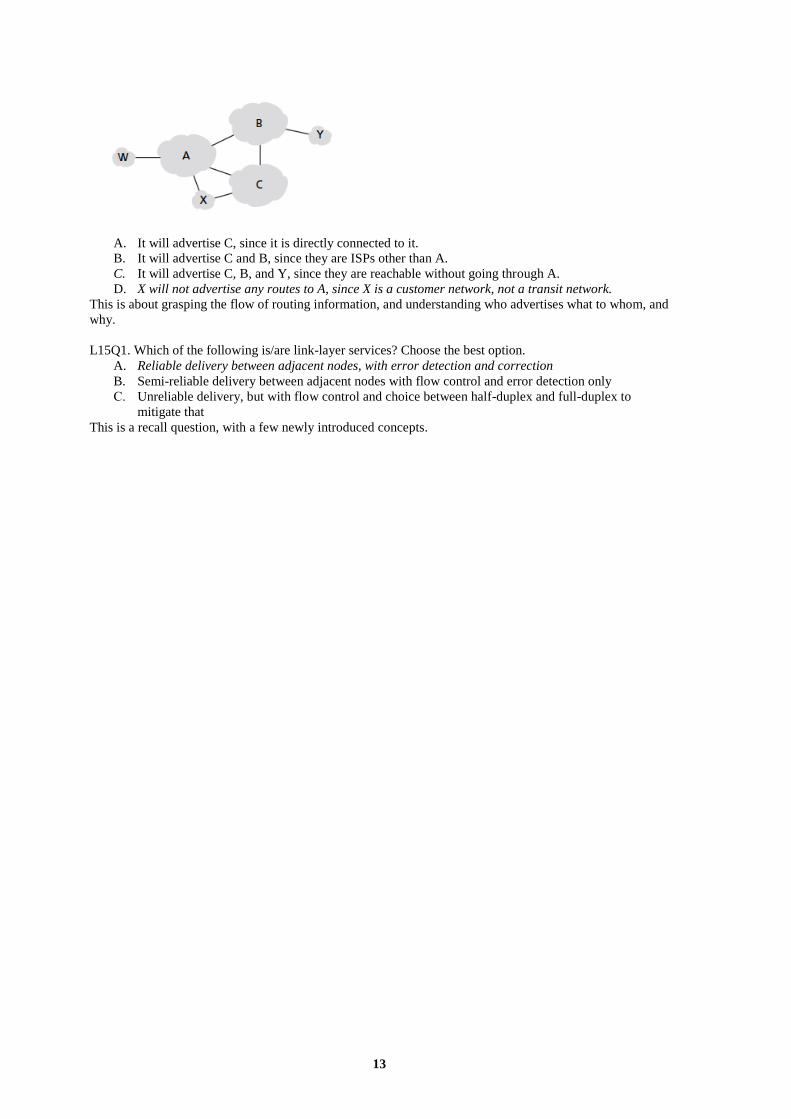
13
A. It will advertise C, since it is directly connected to it.
B. It will advertise C and B, since they are ISPs other than A.
C. It will advertise C, B, and Y, since they are reachable without going through A.
D. X will not advertise any routes to A, since X is a customer network, not a transit network.
This is about grasping the flow of routing information, and understanding who advertises what to whom, and
why.
L15Q1. Which of the following is/are link-layer services? Choose the best option.
A. Reliable delivery between adjacent nodes, with error detection and correction
B. Semi-reliable delivery between adjacent nodes with flow control and error detection only
C. Unreliable delivery, but with flow control and choice between half-duplex and full-duplex to
mitigate that
This is a recall question, with a few newly introduced concepts.