an empirical study of recent face alignment methods an empirical study of recent face alignment...
TRANSCRIPT

1
An Empirical Study of RecentFace Alignment Methods
Heng Yang, Xuhui Jia, Chen Change Loy and Peter Robinson
Abstract—The problem of face alignment has been intensively studied in the past years. A large number of novelmethods have been proposed and reported very good performance on benchmark dataset such as 300W. However, thedifferences in the experimental setting and evaluation metric, missing details in the description of the methods makeit hard to reproduce the results reported and evaluate the relative merits. For instance, most recent face alignmentmethods are built on top of face detection but from different face detectors. In this paper, we carry out a rigorousevaluation of these methods by making the following contributions: 1) we proposes a new evaluation metric for facealignment on a set of images, i.e., area under error distribution curve within a threshold, AUCα, given the fact that thetraditional evaluation measure (mean error) is very sensitive to big alignment error. 2) we extend the 300W databasewith more practical face detections to make fair comparison possible. 3) we carry out face alignment sensitivity analysisw.r.t. face detection, on both synthetic and real data, using both off-the-shelf and re-retrained models. 4) we study factorsthat are particularly important to achieve good performance and provide suggestions for practical applications. Most ofthe conclusions drawn from our comparative analysis cannot be inferred from the original publications.
Index Terms—Face alignment, face detection, sensitivity
F
1 INTRODUCTION
THE study of face alignment, or faciallandmarks localisation, has made rapid
progresses in recent years. Several methodshave reported close-to-human performance onbenchmark datasets, e.g. the Automatic Fa-cial Landmark Detection in-the-Wild Challenge(300W), of which the images that are acquiredfrom unconstrained environments. However,while there is much ongoing research in com-puter vision approaches for face alignment,varying evaluation protocols, lack descriptionsof critical details and the use of different ex-perimental setting or datasets makes it hard toshed light on how to make an assessment oftheir cons and pros, and what are the importantfactors influential to performance.
Face alignment is often served as an inter-mediate step in commonly used face analysispipeline (face detection ⇒ face alignment ⇒
Yang and Robinson are with Computer Laboratory, University ofCambridge, England.Jia is with the University of Hong Kong, Hong Kong.C.C. Loy is with Multimedia Laboratory, Chinese University of HongKong, Hong Kong.Project: https://www.cl.cam.ac.uk/ hy306/FaceAlignment.html
face recognition). Despite the fact that mostcurrent face alignment methods [52], [49], [48],[5], [28], [40] build on top of face detection,few of them have discussed the face align-ment sensitivity w.r.t face detection variation.In Fig. 1, we show some face alignment ex-amples of several state of the art models. Inthe first row, the Headhunter [25] is appliedfor face detection given its state of the artface detection performance. In the second row,face detection is from the best face detector. Ascan be seen, the methods struggle to obtainreasonable alignment results while face detec-tion changes. Moreover, face detection jitteris a very common phenomenon in reality. Asshown in Fig. 2, face detection jitters severalpixels in consecutive frames even there is noface movement at all, which might be due tovery tiny lighting noise. Thus we believe it isvery meaningful to study the face alignmentsensitivity w.r.t face detection changes.
In this paper, we attempt to study recentface alignment methods regarding above men-tioned concerns in an empirical manner. Wefirst extend the 300W benchmark dataset andform the 300W++ dataset by providing several
arX
iv:1
511.
0504
9v1
[cs
.CV
] 1
6 N
ov 2
015

2
Fig. 1: Face alignment results given differentface detections. The upper row shows the re-sults from HeadHunter [25] while the the lowerrow shows the results from the best face de-tection. From left to right, SDM [40], CFAN[48], TREES [20], their corresponding best facedetection: Viola-Jones [34], IBUG [29] and dlib[21].
Fig. 2: Viola-Jones Face detection jitter. Left,sequence of still live face; right, sequence ofstatic face photo.
types of popular face detections, in addition toits impractical tight face bounding boxes. Forthe samples with missing face detections, wefulfil them by using a deep ConvNet regressionmodel. We also point out the issue of usingoverall mean error as an evaluation criterionas it is too sensitive to big erroneous samplesand propose a new evaluation criterion, AUCα.The extended dataset and the new evaluationcriterion will enable future comparison moreconvenient and consistent. Then we focus onperformance evaluation and sensitivity analy-sis of recent face alignment methods and makethe following contributions:
First, we compare the performance of pub-licly available off-the-shelf face alignment mod-
els on the 300W++ dataset, on both their bestface detection and other face detections. Wecarry out synthesised experiments by addingartificial noises on the face detection (face cen-tre shifts and scale changes) and study thesensitivity w.r.t face detection (initialisation)variation. In total, we have run more than 1000groups of experiments on 11 representativemethods and demonstrate their relative meritsas well as their sensitivity w.r.t initialisationchanges.
Second, to have a fair comparison, we re-train several best performing and typical meth-ods by using the same data (training samplesand face detection), and by making other set-tings such as augmentation number as similaras possible. Then we compare their alignmentperformance and their robustness against ini-tialisation changes. In this way, we can havea unbiased look at these methods and drawuseful and comparative conclusions.
Third, we revisit a typical cascaded facealignment, Explicit Shape Regression (ESR)[39], which brought a breakthrough record offace alignment in both accuracy and speed. Inthe spirit of the devil is in the detail, we studyhow the performance is influenced by some im-portant factors like initialisations and numberof cascades. Those findings are also useful toother cascaded face alignment methods.
From our empirical study and in-depth com-parison, it is able to have an overall pictureof the performance of recent face alignmentmethods and to identify the aspects of thedifferent constructions which are important forperformance and which are not. Most of theresults/conclusions in this paper cannot beinferred from the original publications alone.For further comparison, we will release thesource code and 300W++ dataset and describeall the implementation details (including somethat were omitted in the original publicationsand that were obtained from personal commu-nications with the authors). With the release ofthe code and dataset, we wish to encourage:1) the use the practical 300W++ benchmark tomake a fair evaluation of new contribution; 2)the application of AUCα as a evaluation metricover a testing set; 3) sensitivity analysis of aface alignment model.

3
2 FACE ALIGNMENT METHODS
Papers on face alignment have flourished inrecent years. Based on whether a method usesspecific detector (local expert) for an individ-ual landmark or not, we roughly group themethods into two categories: local-based meth-ods and holistic-based methods. The formerusually has explicit local expert model whilethe latter does not. We investigate on recentstate of the art methods in both categories andreview some hybrid methods as well. Moreholistic-based methods are studied as they aremore dominant in recent years. We attemptto include as many as possible of the recentadvances, but it is hard to cover all of themdue to implementation difficulty and spacelimit. Readers interested in other representa-tive methods such as the original Active Ap-pearance Models (AAM) [11] and others arereferred to [36], [9].
2.1 Local-based methodsLocal-based methods usually consist of twoparts: local experts and spatial shape models.The former describes how image around eachfacial landmark looks like while the latter de-scribes how face shape varies. There are threemain types of local experts: 1) Classification-based approaches , e.g. SVMs [27], [7], [35]based on various image features such as Gabor[35], SIFT [23], Discriminative Response MapFitting (DRMF) by dictionary learning (Dict.L)[4] and multichannel correlation filter (CF) re-sponses [17]; 2) Regression-based approacheslike Support Vector Regressors (SVRs) [24],Continuous Conditional Neural Fields (CCNF)[6]; 3) Voting-based approaches, including re-gression forests based voting [12], [15], [45] andexemplar based voting [31], [30]. One typicalshape model is the Constrained Local Model(CLM) [13], which has been widely adaptedwith various local expert models. There aresome other shape models such as RANSAC in[7], graph-matching in [50], Gaussian NewtonDeformable Part Model (GNDPM) [33], mix-ture of trees [51] and Hierarchical ProbabilisticModel (HPM) [38]. Local-based method hasthe advantage of making alignment assessmentthrough local likelihood. However, due to the
nature of model design, local-based methodsare computationally expensive especially whenthe number of facial landmarks is high. More-over, in such a method, it is usually a trickytask to balance the local responses and globalconstraints. In this paper we select three rep-resentative local-based methods, namely theCCNF [6], the GNDPM [33] and the DRMF[4] for evaluation given their state of the artperformance among local-based methods.
2.2 Holistic-based methodsHolistic-based methods have gained higherpopularity than local-based methods in re-cent years. Most of them work in a cascadedway similar to the classical Active AppearanceModel (AAM) [11]. In such methods, the faceshape is often represented as a vector of land-mark locations, i.e., S = (x1, ..., xk, ..., xK) ∈R2K , where K is the number of landmarks.xk ∈ R2 is the 2D coordinates of the k-thlandmark. Most current holistic-based methodswork in a coarse-to-fine fashion, i.e., shapeestimation starts from an initial shape S0 andprogressively refines the shape by a cascade ofT regressors, R1...T . Each regressor refines theshape by producing an update, ∆S, which isadded up to the current shape estimate. It issummarized in Algorithm 1 [16].
Algorithm 1 Cascaded Pose Regression
Require: Image I , initial pose S0
Ensure: Estimated pose ST1: for t=1 to T do2: f t = ht(I, St−1) . Shape-indexed
features3: ∆S = Rt(f t) . Apply regressor Rt
4: St = St−1 + ∆S . update pose5: end for
Despite different strategies are proposed inrecent years, most of them share the abovedescribed framework. They differ from eachother mainly in three aspects: strategy of set-ting initialisation; 2) shape-indexed features; 3)regressor. Feature extraction and regression areusually interdependent.
There are mainly three initialisation schemes:random, mean pose, and supervised. The ran-dom method usually selects one or several face

4
TABLE 1: Local-based methods
Local Expert SVMs [27], [7], [50] Dict.L [4] SVRs [24] CF [17] RF [12], [15], [45] CCNF [6]Shape Model CLM [13], [6], [12] Mix.Tree [51], [18], [47] DPM [33] GraphMatch. [50] RANSAC [7] HPM [38]
TABLE 2: Holistic-based methods and their properties.
Methods ESR [5] SDM [40] RCPR [8] IFA [5] TREES [20] CFAN [48] TCDCN [42] LBF [28] CFSS[52]initialization random mean pose random mean pose mean pose supervised supervised mean pose randomfeatures pixel diff. SIFT pixel diff. HOG pixel diff. auto-encoder pixel LBF SIFTregressor random ferns linear random ferns linear random trees linear ConvNet linear linear
shapes from a set of training samples and thenrescale them w.r.t the provided face boundingbox via similarity transformation. The meanpose initialization method calculates a meanshape within the face box. The supervisedscheme usually calculate a initialisation shapeby using an auxiliary model (e.g. ConvNet)that usually takes the image content in the facebounding box as input.
A large variety of image features are utilizedas the shape indexed features, that include greyscale pixel value comparison (e.g., [16], [39],[8], [20]), hand-crafted features (like SIFT [23]in [40], [52], [32] and HOG [14] in [46]) andlearned features (using Auto-encoders [48] orConvNet [42]).
The regressors also vary a lot in differentmethods that include random ferns [16], [39],[8], random forests [20], Support Vector Regres-sor [5], [43] and Supervised Descent Method(SDM) and its extensions [40], [5], [41], [52].Recently, deep learning framework has alsobeen applied in the problem of face alignment,which usually also works in a holistic andcoarse-to-fine manner for instance [42]. It hasbeen improved by Tasks Constrained DeepConvolutional Network (TCDCN) [49], whichjointly optimises face alignment and correlatedtasks such as head pose estimation in a singleConvNet framework. We list the recent holistic-based methods that are going to be investigatedin this work and their corresponding propertiesin Table 2. It is interesting to note that the com-bination of features and regressors are eithernon-linear features + linear regression or linearfeatures + non-linear regression, due to the factthat the mapping from raw image to face poseis a non-linear process.
2.3 Hybrid methodsThere are several other hybrid face alignmentapproaches such as occlusion detection basedmethods [18], [44], combined local and holistic-based method in [1], [44], weakly supervisedmethod [26], unified face detection and align-ment method [10], Active Pictorial Model [3],etc. Due to their different setting and limitedspace, we leave their comparison as futurework.
3 DATA PREPARATION AND EVALUA-TION METRIC
3.1 An extended dataset: 300W++300W [29], created for Automatic Facial Land-mark Detection in-the-Wild Challenge, hasbeen widely used as a benchmark dataset forface alignment in recent years. As it only pro-vides the training images for the challenge,we follow the experiment setting of recentmethods [52], [28] for training/testing parti-tion. More specifically, the training part consistsof AFW, the training images of LFPW and thetraining images of HELEN, with 3148 samplesin total. The testing set consists of the testimages of LFPW, the test images of HELEN andthe images in the IBUG set, with 689 samples intotal. 300W provides the ground truth locationsof 68 facial landmarks.
It provides two types of ground truth facebounding boxes. One is the tight boundingbox of the facial landmarks, and the otheris the detection outputs from the mixture oftrees model [51], which is very close to thetight bounding box. In practice, it is difficult toobtain such tight bounding box since the themixture of trees [51] model is very slow andnot very effective. Furthermore, many publicly
5
available models are using more practical facedetectors, e.g. SDM uses Viola-Jones [34] facedetector. Many publications are lack of detailswhen comparing to other models. Thus we pro-vide face bounding boxes from several popularface detectors including the Viola-Jones [34]detector from Matlab, the HeadHunter [25] andHOG+SVM detector from dlib [21]. The groundtruth detection is called IBUG.
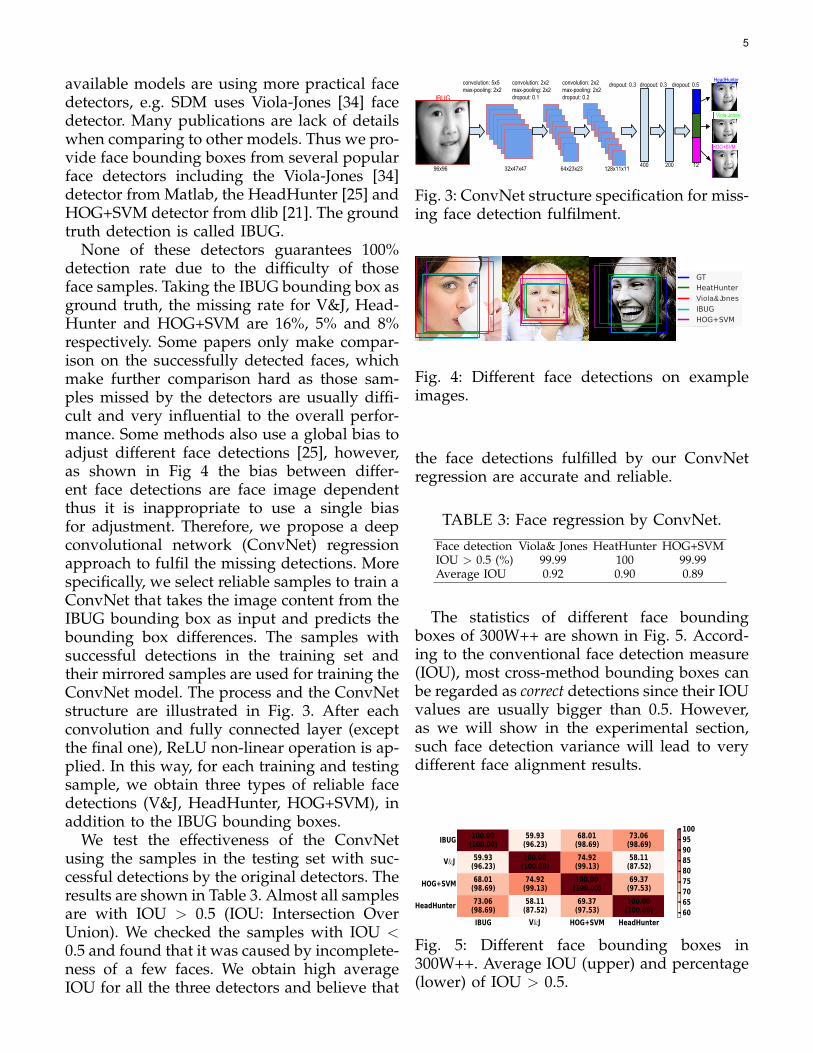
None of these detectors guarantees 100%detection rate due to the difficulty of thoseface samples. Taking the IBUG bounding box asground truth, the missing rate for V&J, Head-Hunter and HOG+SVM are 16%, 5% and 8%respectively. Some papers only make compar-ison on the successfully detected faces, whichmake further comparison hard as those sam-ples missed by the detectors are usually diffi-cult and very influential to the overall perfor-mance. Some methods also use a global bias toadjust different face detections [25], however,as shown in Fig 4 the bias between differ-ent face detections are face image dependentthus it is inappropriate to use a single biasfor adjustment. Therefore, we propose a deepconvolutional network (ConvNet) regressionapproach to fulfil the missing detections. Morespecifically, we select reliable samples to train aConvNet that takes the image content from theIBUG bounding box as input and predicts thebounding box differences. The samples withsuccessful detections in the training set andtheir mirrored samples are used for training theConvNet model. The process and the ConvNetstructure are illustrated in Fig. 3. After eachconvolution and fully connected layer (exceptthe final one), ReLU non-linear operation is ap-plied. In this way, for each training and testingsample, we obtain three types of reliable facedetections (V&J, HeadHunter, HOG+SVM), inaddition to the IBUG bounding boxes.
We test the effectiveness of the ConvNetusing the samples in the testing set with suc-cessful detections by the original detectors. Theresults are shown in Table 3. Almost all samplesare with IOU > 0.5 (IOU: Intersection OverUnion). We checked the samples with IOU <0.5 and found that it was caused by incomplete-ness of a few faces. We obtain high averageIOU for all the three detectors and believe that
convolution: 5x5max-pooling: 2x2
96x96 32x47x47 64x23x23 128x11x11
convolution: 2x2max-pooling: 2x2dropout: 0.1
convolution: 2x2max-pooling: 2x2dropout: 0.2
dropout: 0.3 dropout: 0.3 dropout: 0.5
400 200 12
IBUG
HeadHunter
Viola-Jones
HOG+SVM
Fig. 3: ConvNet structure specification for miss-ing face detection fulfilment.
GTHeatHunterViola&Jones
IBUGHOG+SVM
Fig. 4: Different face detections on exampleimages.
the face detections fulfilled by our ConvNetregression are accurate and reliable.
TABLE 3: Face regression by ConvNet.
Face detection Viola& Jones HeatHunter HOG+SVMIOU > 0.5 (%) 99.99 100 99.99Average IOU 0.92 0.90 0.89
The statistics of different face boundingboxes of 300W++ are shown in Fig. 5. Accord-ing to the conventional face detection measure(IOU), most cross-method bounding boxes canbe regarded as correct detections since their IOUvalues are usually bigger than 0.5. However,as we will show in the experimental section,such face detection variance will lead to verydifferent face alignment results.
IBUG V&J HOG+SVM HeadHunter
IBUG
V&J
HOG+SVM
HeadHunter
100.00 (100.00)
59.93 (96.23)
68.01 (98.69)
73.06 (98.69)
59.93 (96.23)
100.00 (100.00)
74.92 (99.13)
58.11 (87.52)
68.01 (98.69)
74.92 (99.13)
100.00 (100.00)
69.37 (97.53)
73.06 (98.69)
58.11 (87.52)
69.37 (97.53)
100.00 (100.00) 60
65707580859095100
Fig. 5: Different face bounding boxes in300W++. Average IOU (upper) and percentage(lower) of IOU > 0.5.

6
3.2 A new evaluation metric: AUCα
Similar to other methods in the literature,landmark-wise face alignment error is first nor-malised in the following way to make it scaleinvariant:
ex =||x− xGT ||DIOD
(1)
where ||x − xGT || is the Euclidean distancebetween the estimated location x and the truelocation xGT . DIOD is the inter-ocular distance,i.e. Euclidean distance between two eye cen-tres.
In recent years, with the rapid progress offace alignment, most of the recent approachesreport a error level of e at around 0.05 orsmaller, that is close to human performance.This is a proper error metric for one land-mark or one face image. In order to evaluatethe performance of a set of images, there aremainly two methods. One is the mean error,sample-wise, landmark-wise or overall. Theother one is the Cumulative Error Distribution(CED) curve, which is the cumulative distri-bution function of the normalized error. Usingmean error to measure the performance is verystraightforward and intuitive given its singlevalue form. However, this measure is heavilyimpacted by the presence of some big failures,i.e., outliers, in particular when the average er-ror level is very low. In other words, the meanerror measure is very fragile even if there arejust a few images with big errors. For example,given a set of 500 evaluation samples, if thereare 5 failures with mean error at 1.0 and the restof them are with average mean error at 0.03,then the overall mean error increases from 0.03to 0.04, which is equivalent to 33% of increase.Thus we argue that though the mean error iswidely used for face alignment evaluation like[19], [3], [22], [28], [38], [49], [8], [37], [42], itdoes not provide a big picture on which casesthe errors occur (minor big alignment error ormany inaccuracies). We will further validatethis argument in Section 4.1.
In terms of outliers handling, CED is a betterway. However, it is not intuitive given its curverepresentation. It is also hard to use it in sen-sitivity analysis. Therefore, we propose a new
0.00 0.05 0.10 0.15 0.20 0.25Normalized error
0.0
0.2
0.4
0.6
0.8
1.0
Prop
orti
on o
f de
tect
ed la
ndm
arks
AUC0.1=0.056
AUC0.2=0.14
AUC0.1=0.044
AUC0.2=0.12
AUC0.1=0.037
AUC0.2=0.10
AUC0.1=0.029
AUC0.2=0.08
AUC0.1=0.020
AUC0.2=0.06
AUC0.1=0.014
AUC0.2=0.04
Fig. 6: The evaluation metric AUCα with vari-ous values given α = 0.1 and α = 0.2.
evaluation metric called AUCα. It is defined as:
AUCα =∫ α
0f(e)de (2)
where e is the normalized error, f(e) is the cu-mulative error distribution (CED) function andα is the upper bound that is used to calculatethe definite integration. Given the definition ofthe CED function, the value is AUCα lies in therange of [0, α]. The value of AUCα will not beinfluenced by points with error bigger than α.In Fig. 6, we plot the several example valuesof AUCα and their corresponding CED curvesto give readers an idea of our proposed metric.In the rest of the paper, we will use AUCα asthe main metric for performance evaluation.
4 EXPERIMENTS
4.1 Basic comparison of off-the-shelf mod-elsWe first make a comparison of the state of theart methods based on their off-the-shelf mod-els, i.e., the models provided by the authors.These models might trained in different set-tings (e.g. the use of face detection, the numberof facial landmarks and training samples) andsome of them are lack of detailed descriptions.It makes fair comparison of the model perfor-mance difficult. However, it is still valuableto evaluate their relative merits on the sametesting data and carry out sensitivity analysisof these models w.r.t face detection variation.We first identify the best face detection for

7
each model either by the information providedby the original paper, or by comparing theirperformance or by communication with theauthors. The related information of each modelis shown in Table. 4. We note that the trainedmodel and the code of LBF 1 and RCPR 2 isfrom open source implementation, not from theoriginal authors. The rest of the models areall from the original authors. We also recordthe run-time performance in the table. Sincethe methods are implemented in different lan-guages, the comparison here might not be veryfair. Most of the methods have comparablespeed to the original description, except theLBF, possibly due to the re-implementation inMatlab. As most of the models are trained todetect 68 facial landmarks and some of themdetect a sub-set of them, we record and cal-culate the landmark-wise error of all detectedlandmarks, instead of using their common 49landmarks. This gives a slight advantage to themethods that detect only the inner points as thelandmarks along the face contour are generallyregarded more difficult. We do so in order tokeep consistent with the baseline dataset, alsoto make future comparison more convenient.
We first plot the CED in Fig. 7 (a). As canbe seen, for methods that have very close per-formance, it is not intuitive to evaluate themusing the curve plots. We plot our proposedAUCα (with α = 0.2) in Fig. 7 (b), it is verystraightforward to illustrate the performanceof different methods. TREES model performsthe best, followed by CFAN, and three models(RCPR, IFA, CFSS) have very similar perfor-mance. We also plot the overall mean errorin Fig. 7 (c). As can be seen, the order is notconsistent with the reverse order of AUCα. Forexample, the mean error of RCPR, CFSS andTCDCN is lower than CFAN, however, fromthe curve plot, we can observe CFAN performsbetter than them when the error level is below0.1, based on fact that a detection is usuallyregarded as successful when error is smallerthan 0.1. CFAN and IFA have the similar meanerror value (7.66 vs. 7.90) but their performanceis quite different from each other. We further
1. LBF: https://github.com/jwyang/face-alignment2. RCPR: https://github.com/ChrisYang/RCPR
conduct an experiment to show that the meanerror can be very easily influenced by big errorsamples, even a small number of them. Morespecifically, for each method, we excluded 5top erroneous samples (they are all failures tothe method) out of 689 and then re-calculatedthe mean error. The result is plotted in Fig. 7(d). As can be seen, despite only 5 erroneoussamples are excluded (less than 1%), the valueof mean error changes very significantly, 0.73in average, which is even much bigger thanthe difference between several methods (e.g.0.55 for CFAN vs. RCPR, 0.45 for TCDCN vs.CFSS, 0.29 for SDM vs. LBF). It validates ourargument that mean error is not a effectiveevaluation measure: 1) it sometimes does notreveal the actual relative merits; 2) it is verysensitive to big alignment error, especially ondataset like 300W with some challenging sam-ples that might result in big alignment errors.On the contrary, our proposed AUCα is a moreeffective and consistent metric.
4.2 Sensitivity analysis of off-the-shelfmodels4.2.1 Face centre shiftsWe first evaluate the impact of face centre shiftson the face alignment. Given a face bound-ing box, we make random permutation of thebounding box centre. More specifically, we seta range of radius on how much the centreshifts from the original location. The radius are[0.01 : 0.02 : 0.21] of the face bounding boxscale (mean value of width and hight), which isdemonstrated by the circles in different coloursin Fig. 8 (11 radius in total). We keep the facebounding box size unchanged. For each radius,we randomly select 10 locations on the arc asthe new face centre to get 10 different boundingboxes. We note that for a given method, theshift is carried out on its best face bounding boxdescribed in Table 4, and for the methods thatshare the same best face bounding box, we usethe same set of randomly generated boundingboxes for a fair comparison. The new boundingboxes are fed to the face alignment models,together with the image content to get thealignment output. In this way, for each radius,we get 10 groups of detection results. Then

8
TABLE 4: Evaluated face alignment methods and their properties. (NC: Not Clear)
Methods SDM RCPR IFA LBF TREES CFAN TCDCN GNDPM DRMF CCNF CFSSBest BB V& J V& J HOG+SVM IBUG HOG+SVM IBUG IBUG IBUG V& J IBUG IBUGLandmarks # 49 68 49 68 68 68 68 49 66 68 68Training set NC 300W 300W 300W NC NC CelebA + 300W 300W NC 300W+MPIE 300WRun-time (FPS) 40 80 20 10 300 20 50 70 0.5 30 10
0.00 0.05 0.10 0.15 0.20Normalised error
0.0
0.2
0.4
0.6
0.8
1.0
Prop
ortio
n of
faci
al la
ndm
arks
(a)
TREES
CFAN
RCPR
IFA
CFSS
TCDCN
SDM
LBF
CCNF
GNDPM
DRMF
TREESCFAN
RCPR IFACFSS
TCDCNSDM LBF
CCNF
GNDPMDRMF
0.10
0.11
0.12
0.13
0.14
0.15
0.16
AU
C0.2
0.1492
0.1452
0.1402 0.1401 0.1395
0.1333 0.13270.1294
0.1223
0.1159
0.1109
(b)
TREESCFAN
RCPR IFACFSS
TCDCNSDM LBF
CCNF
GNDPMDRMF
0
5
10
15
Over
all n
orm
alise
d m
ean
erro
r (%
)
6.19
7.667.11
7.90
6.58 7.03
9.04 8.75
12.05
16.50
11.40
(c)
TREESCFAN
RCPR IFACFSS
TCDCNSDM LBF
CCNF
GNDPMDRMF
0
2
4
6
8
10
12
14
16
Over
all n
orm
alise
d m
ean
erro
r (%
)
5.57
6.786.32
7.086.20
6.78
8.20 7.96
10.93
15.67
10.69
(d)
Fig. 7: Performance comparison of different methods based on the best face detectors. (a)cumulative error distribution. (b) plot of AUC0.2. (c) Mean error on all test images. (d) Meanerror on test set excluding the top 5 erroneous images.
we calculate the overall performance usingAUC0.2. For each radius, we calculate a meanvalue from 10 runs. Thus for the 11 evaluatedmethods, we ran 11x11x10 groups of experi-ments for sensitivity analysis. The comparisonis shown in Fig. 8 (b). The performance of allthe evaluated methods drops while the faceshifts. Some methods like SDM, RCPR, CFSS,CCNF are robust than others to small rangeof face centre shits (less than 5% of the facescale, which is very common in real scenarios).There are some methods, e.g. CFAN, is verysensitive to even a small amount of face centreshifts. AUC0.2 value drops from 0.145 (original)to 0.137 (3% shift), to 0.130 (5% shift) and to0.121 (7% shifts). With 10% of face shift, itsperformance drops from second best to secondworst. One can refer to Fig. 6 with curve plotson various AUCα values to get an idea about
how much such change represents. GNDPM isthe second sensitive model while TREES modelbecomes very sensitive w.r.t shift bigger than10%.
Viola&Jones
Shift -0.10Shift -0.21
(a)
0.00 0.05 0.10 0.15 0.20Face centre shift
0.04
0.06
0.08
0.10
0.12
0.14
AU
C0.
2
TREES
CFAN
RCPR
IFA
CFSS
TCDCN
SDM
LBF
CCNF
GNDPM
DRMF
(b)
Fig. 8: Experiments on synthesised face centreshifts. (a) Face centre shift synthesis. (b) AUC0.2
values vs. face centre shifts.

9
4.2.2 Face scale changesWe then evaluate the impact of face scalechanges on the face alignment. We re-scalea face bounding box by a ratio that rangesfrom 0.8 to 1.2, as shown in Fig. 9 (a). Again,the rescaling is carried out on the best facebounding box for each method. Compared tothe results on face centre shifts, most of theevaluated models demonstrate better robust-ness against scale changes, especially the bestperforming methods, like TREES, RCPR andSDM. However, similar to situation on facecentre shifts, CFAN is the most sensitive meth-ods. The AUCα against the decreasing scalesor increasing scales forms a steep line. Forexample, when the face scale is 10% smaller(the IOU is still 0.8), AUC0.2 drops from 0.145to 0.127. LBF model is also very sensitive toscale changes, especially when scale increases.RCPR, CFSS and IFA has similar original per-formance but RCPR shows better robustnessvs. scale changes.
1.2
0.8
(a)
0.80 0.85 0.90 0.95 1.00 1.05 1.10 1.15 1.20Scales
0.07
0.08
0.09
0.10
0.11
0.12
0.13
0.14
0.15
AU
C0.
2
TREES
CFAN
RCPR
IFA
CFSS
TCDCN
SDM
LBF
CCNF
GNDPM
DRMF
(b)
Fig. 9: Experiments on synthesised face scalechanges. (a) Face scaling, with original facebounding box highlighted by red shadow. (b)AUC0.2 vs. face scale.
4.2.3 Experiments on real face detection shiftsIn this section, we evaluate the face alignmentmethods on various face detection results fromdifferent real face detectors.
The results are shown in Fig. 10. As canbe seen, when the face detection is switchedaway from the best detector, the performancedeteriorates in certain amount. The results fromsimilar face bounding boxes (like HOG+SVMand Viola-Jones, with 75% average IOU) are
TREES SDM RCPR CCNF CFAN GNDPM IFA LBF TCDCN DRMF CFSS
IBUG
V&J
HOG+SVM
HeadHunter
0.1282 0.0823 0.1014 0.1223 0.1452 0.1159 0.1230 0.1294 0.1333 0.0608 0.1395
0.1432 0.1327 0.1402 0.1047 0.0481 0.0100 0.1308 0.0483 0.1058 0.1109 0.0899
0.1492 0.1325 0.1401 0.1180 0.0924 0.0717 0.1401 0.0972 0.1137 0.1097 0.1231
0.1346 0.1112 0.1300 0.1188 0.1108 0.0863 0.1263 0.1188 0.1060 0.0803 0.1340
0.0150.0300.0450.0600.0750.0900.1050.1200.135
Fig. 10: Face alignment performance (AUC0.2)of different models on various face detectionresults. The result from best face box is high-lighted in light blue.
close for most of the methods like TREES, SDM,IFA and DRMF. But for sensitive methods likeCFAN and LBF, the results from similar facebounding boxes are still very different (0.0924vs. 0.0482 for CFAN and 0.0972 vs. 0.0483 forLBF). In the extreme case, like the model ofGNDPM, when the face detector changes frombest IBUG to Viola-Jones, it hardly gives anyreliable result. The models trained with IBUGshow better results on HeadHunter than onHOG+SVM and Viola-Jones due to their similarbounding box definition. In general, none ofthe evaluated method is able to keep its per-formance when face detection shifts from itsbest face detector, despite that fact that mostof them have high overlap ratio accordingonly from the perspective of face detection.HeadHunter is one of the best performing facedetectors in the literature, nevertheless, sincenone of the face alignment models are trainedwith it, their performance degrades, especiallyfor those trained with Viola-Jones detectorslike SDM (0.1327 vs. 0.1113), RCPR (0.1402 vs.0.1300) and DRMF (0.1110 vs. 0.0803). There-fore, it is essential to keep the same face detec-tor in training and testing stage, for either per-formance evaluation or practical application.
4.3 Sensitivity analysis of re-trained mod-elsBy using the off-the-shelf model, we are un-able to make a fair comparison cross differentmethods due to the difference in experimentalsetting, training data, and face detection. Weselect four representative methods for a fairercomparison by re-training their models usingtheir default setting on the same training data

10
0.00 0.05 0.10 0.15 0.20Face center shift radius
0.02
0.04
0.06
0.08
0.10
0.12
0.14
AU
C0.2
CFSSSDMTREESESR
0.80 0.85 0.90 0.95 1.00 1.05 1.10 1.15 1.20 1.25Scales
0.100
0.105
0.110
0.115
0.120
0.125
0.130
0.135
0.140
AU
C0.2
CFSS
SDM
TREES
ESR
Fig. 11: Sensitivity w.r.t centre shift (Left) andface scale (Right) of re-trained models.
and the same data setting. They are CFSS [52],TREES [20], SDM [40] (re-implemented by [52])and ESR [39]. The first two methods show verygood performance in our previous comparison.The later two are the most popular methodsin recent years. We re-train the models on300W++ training set using the HOG+SVM facedetection. We chose this as it is a very goodtrade-off between effectiveness and efficiency.As all of them are cascaded methods, we set therandom initialisation number to 20. We carryout sensitivity analysis in a similar way as wedid before. The sensitivity against face centreshift and face scale changes are demonstratedin Fig. 11.
As can be seen, CFSS shows the best per-formance in both localisation accuracy androbustness against the initialisation variation.TREES and SDM has very close performance,better than the ESR. Similar to what we foundin previous experiment, face centre shift hashigh influence on the performance while thatof scale change is lower.
By comparing to the performance of theoff-the-shelf models in Fig.7, we can furtherobserve that 1) the training setting has verysignificant impact on performance as well, e.g.,for TREES, the AUC0.2 drops from 0.149 to0.123 due to different setting and possiblytraining data difference; 2) the relative rankingorder of CFSS and TREES changes as CFSSsurpasses TREES in AUC0.2 under the samesetting. However, the computational expenseand model complexity of CFSS is much higherthan TREES as shown in Table 4.
4.4 Important factorsWe study the important factors in holistic-based methods. We choose Explicit Shape Re-
gression (ESR), as it is regarded as a break-through face alignment method in both accu-racy and efficiency and widely adapted eversince. Two factors, namely initialisation methodand cascade level, are studied below.
4.4.1 Initialisation
ESR proposed a multiple-random-initialisationscheme for performance boost. As we dis-cussed in Sec.2.2, another (unsupervised) ini-tialisation scheme is using Mean Shape (MS).We carry out experiments to study how differ-ent they are in practice. We trained two mod-els, with the same augmentation number (20)and one (RD) with all RD initialisations, theother (MS) with 1 MS + 19 RD initialisations. At testing stage, we recorded the results ofusing N initialisations (final result is calculatedas the median value) in two schemes, one(RD) with N RD and the other (MS) with1 MS and N -1 RD. Thus we get 4 combi-nations: RD(train)-RD(test), RD(train)-MS(test),MS(train)-RD(test), MS(train)-MS(test). Sincerandomness was involved in this process, werepeated this experiment for 5 times. The re-sults for N = {1, ..., 15} are shown in Fig. 12a.We can draw three useful conclusions from theresults: 1) using MS in testing is always useful,regardless how the model is trained (RD orMS); 2) increasing the number of initialisationsleads to non-decreasing performance; 3) usingMS during training time has little impact onthe performance. Therefore in practical appli-cations we suggest to always use MS as one ofthe initialisations, given the fact that using justone MS has similar performance to that from 4RDs while being 4 times faster.
1 2 3 4 5 6 7 8 9 10 11 12 13 14 15# of initialisations
0.100
0.105
0.110
0.115
0.120
0.125
AU
C0.2
RD(train)_RD(test)
MS(train)_RD(test)
RD(train)_MS(test)
MS(train)_MS(test)
(a) Initialisation
1 2 3 4 5 6 7 8 9 10 11 12 13 14 15Cascade levels
0.06
0.07
0.08
0.09
0.10
0.11
0.12
0.13
0.14
AU
C0.
2
TREES
ESR
(b) Cascade level
Fig. 12: Important factors evaluation.

11
4.4.2 Cascade levelsWe further study the impact of cascade levels.We first train model with deep cascade. Thenwe test the performance of the model with var-ious levels of cascade. The results for ESR andTREES are shown in Fig. 12b. As can be seen,deeper cascade can lead to non-decreasing per-formance boost, at a cost of bigger model sizeand longer run-time. This is opposed to thefinding of feature based AAMs [2], that deeperiteration might lead to over-fitting. For prac-tical application, using 10 cascade levels willlead to a reasonable performance for both ESRand TREES.
5 CONCLUSION
In this paper, we have presented our empiricalstudy on recent face alignment methods. Wefirst extended the 300W dataset and formedthe 300W++ dataset with more practical facedetections. We then proposed a new face align-ment evaluation criterion AUCα that is veryeffective in measuring the performance witha single value. Based on this, we carried outsensitivity analysis and comparative study ofseveral representative face alignment methodsincluding their off-the-shelf models and re-trained models. We also studied several influ-ential aspects in cascaded face alignment. Froma comprehensive empirical study, we drewuseful conclusions of current face alignmentmethods and made insightful suggestions forpractical applications.
Due to limited space, a few aspects in facealignment have not been studied in this paper,e.g, what is the impact of training data tomodel performance? How scalable and exten-sible of a method? How to enhance the robust-ness against initialisation variation? They areall interesting and we will investigate in ourfuture work.
REFERENCES
[1] J. Alabort-i Medina and S. Zafeiriou. Unifying holistic andparts-based deformable model fitting. In Proc. IEEE Conf.Comput. Vis. Pattern Recognit., pages 3679–3688, 2015.
[2] E. Antonakos, J. Alabort-i Medina, G. Tzimiropoulos,and S. Zafeiriou. Feature-based lucas-kanade and activeappearance models. IEEE Trans. Image Processing, 2015.
[3] E. Antonakos, J. Alabort-i Medina, and S. Zafeiriou. Ac-tive pictorial structures. In Proc. IEEE Conf. Comput. Vis.Pattern Recognit., pages 5435–5444, 2015.
[4] A. Asthana, S. Zafeiriou, S. Cheng, and M. Pantic. Robustdiscriminative response map fitting with constrained localmodels. In Proc. IEEE Conf. Comput. Vis. Pattern Recognit.,pages 3444–3451, 2013.
[5] A. Asthana, S. Zafeiriou, S. Cheng, and M. Pantic. Incre-mental face alignment in the wild. In Proc. IEEE Conf.Comput. Vis. Pattern Recognit., pages 1859–1866, 2014.
[6] T. Baltrusaitis, P. Robinson, and L.-P. Morency. Contin-uous conditional neural fields for structured regression.In Proc. Eur. Conf. Comput. Vis., pages 593–608. Springer,2014.
[7] P. Belhumeur, D. Jacobs, D. Kriegman, and N. Kumar.Localizing parts of faces using a consensus of exemplars.In Proc. IEEE Conf. Comput. Vis. Pattern Recognit., pages545–552, 2011.
[8] X. P. Burgos-Artizzu, P. Perona, and P. Dollar. Robust facelandmark estimation under occlusion. In Proc. IEEE Int.Conf. Comput. Vis., pages 1513–1520, 2013.
[9] O. Celiktutan, S. Ulukaya, and B. Sankur. A comparativestudy of face landmarking techniques. EURASIP Journalon Image and Video Processing, 2013(1):13, 2013.
[10] D. Chen, S. Ren, Y. Wei, X. Cao, and J. Sun. Joint cascadeface detection and alignment. In Proc. European Conf.Comput. Vis., 2014.
[11] T. Cootes, G. Edwards, and C. Taylor. Active appearancemodels. IEEE Trans. Pattern Anal. Mach. Intell., 23(6):681–685, 2001.
[12] T. Cootes, M. C. Ionita, and S. P. Robust and accu-rate shape model fitting using random forest regressionvoting. In Proc. Eur. Conf. Comput. Vis., pages 278–291.Springer, 2012.
[13] D. Cristinacce and T. Cootes. Feature detection andtracking with constrained local models. In Proc. Brit.Mach. Vis. Conf., volume 2, page 6, 2006.
[14] N. Dalal and B. Triggs. Histograms of oriented gradientsfor human detection. In Proc. IEEE Conf. Comput. Vis.Pattern Recognit., volume 1, pages 886–893, 2005.
[15] M. Dantone, J. Gall, G. Fanelli, and L. Van Gool. Real-time facial feature detection using conditional regressionforests. In Proc. IEEE Conf. Comput. Vis. Pattern Recognit.,pages 2578–2585, 2012.
[16] P. Dollar, P. Welinder, and P. Perona. Cascaded pose re-gression. In Proc. IEEE Conf. Comput. Vis. Pattern Recognit.,pages 1078–1085, 2010.
[17] H. K. Galoogahi, T. Sim, and S. Lucey. Multi-channelcorrelation filters. In Proc. IEEE Int. Conf. Comput. Vis.,pages 3072–3079, 2013.
[18] G. Ghiasi and C. C. Fowlkes. Occlusion coherence: Local-izing occluded faces with a hierarchical deformable partmodel. In Proc. IEEE Conf. Comput. Vis. Pattern Recognit.,pages 1899–1906, 2014.
[19] A. Jourabloo and X. Liu. Pose-invariant 3d face alignment.In Proc. IEEE Int. Conf. Comput. Vis., 2015.
[20] V. Kazemi and J. Sullivan. One millisecond face alignmentwith an ensemble of regression trees. In Proc. IEEE Conf.Comput. Vis. Pattern Recognit., pages 1867–1874. IEEE,2014.
[21] D. E. King. Dlib-ml: A machine learning toolkit. Journalof Machine Learning Research, 10:1755–1758, 2009.
[22] D. Lee, H. Park, and C. D. Yoo. Face alignment usingcascade gaussian process regression trees. In Proc. IEEEConf. Comput. Vis. Pattern Recognit., 2015.
[23] D. G. Lowe. Distinctive image features from scale-invariant keypoints. Int. J. Comput. Vis., 60(2):91–110, 2004.

12
[24] B. Martinez, M. Valstar, X. Binefa, and M. Pantic. LocalEvidence Aggregation for Regression Based Facial PointDetection. IEEE Trans. Pattern Anal. Mach. Intell., pages1149–1163, 2012.
[25] M. Mathias, R. Benenson, M. Pedersoli, and L. Van Gool.Face detection without bells and whistles. In Proc. Eur.Conf. Comput. Vis., pages 720–735. Springer, 2014.
[26] M. Pedersoli, R. Timofte, T. Tuytelaars, and L. V. Gool.Using a deformation field model for localizing faces andfacial points under weak supervision. In Proc. IEEE Conf.Comput. Vis. Pattern Recognit., pages 3694–3701. IEEE,2014.
[27] V. Rapp, T. Senechal, K. Bailly, and L. Prevost. Multiplekernel learning svm and statistical validation for faciallandmark detection. In Proc. IEEE Int’l Conf. on Autom.Face Gesture Recognit., pages 265–271, 2011.
[28] S. Ren, X. Cao, Y. Wei, and J. Sun. Face alignment at 3000fps via regressing local binary features. In Proc. IEEE Conf.Comput. Vis. Pattern Recognit., pages 1685–1692, 2014.
[29] C. Sagonas, G. Tzimiropoulos, S. Zafeiriou, and M. Pantic.300 faces in-the-wild challenge: The first facial landmarklocalization challenge. In Proc. IEEE Int. Conf. Comput.Vis., pages 397–403, 2013.
[30] X. Shen, Z. Lin, J. Brandt, and Y. Wu. Detecting andaligning faces by image retrieval. In Proc. IEEE Conf.Comput. Vis. Pattern Recognit., pages 3460–3467, 2013.
[31] B. M. Smith, J. Brandt, Z. Lin, and L. Zhang. Nonpara-metric context modeling of local appearance for pose-andexpression-robust facial landmark localization. In Proc.IEEE Conf. Comput. Vis. Pattern Recognit., pages 1741–1748,2014.
[32] G. Tzimiropoulos. Project-out cascaded regression withan application to face alignment. In Proc. IEEE Conf.Comput. Vis. Pattern Recognit., 2015.
[33] G. Tzimiropoulos and M. Pantic. Gauss-newton de-formable part models for face alignment in-the-wild. InProc. IEEE Conf. Comput. Vis. Pattern Recognit., pages 1851–1858, 2014.
[34] P. Viola and M. Jones. Rapid object detection using aboosted cascade of simple features. In Proc. IEEE Conf.Comput. Vis. Pattern Recognit., pages I–511, 2001.
[35] D. Vukadinovic and M. Pantic. Fully automatic facialfeature point detection using gabor feature based boostedclassifiers. In Proc. IEEE Int’l Conf. Systems, Man, andCybernetics, pages 1692–1698, 2005.
[36] N. Wang, X. Gao, D. Tao, and X. Li. Facial featurepoint detection: A comprehensive survey. arXiv preprintarXiv:1410.1037, 2014.
[37] Y. Wu, Z. Wang, and Q. Ji. Facial feature trackingunder varying facial expressions and face poses basedon restricted boltzmann machines. In Proc. IEEE Conf.Comput. Vis. Pattern Recognit., pages 3452–3459, 2013.
[38] Y. Wu, Z. Wang, and Q. Ji. A hierarchical probabilisticmodel for facial feature detection. In Proc. IEEE Conf.Comput. Vis. Pattern Recognit., pages 1781–1788. IEEE,2014.
[39] C. X., Y. Wei, F. Wen, and J. Sun. Face alignment by explicitshape regression. In Proc. IEEE Conf. Comput. Vis. PatternRecognit., pages 177–190. Springer, 2012.
[40] X. Xiong and F. De la Torre. Supervised descent methodand its applications to face alignment. In Proc. IEEE Conf.Comput. Vis. Pattern Recognit., pages 532–539, 2013.
[41] X. Xiong and F. De la Torre. Global supervised descentmethod. In Proc. IEEE Conf. Comput. Vis. Pattern Recognit.,pages 2664–2673, 2015.
[42] X. W. Y. Sun and X. Tang. Deep convolutional networkcascade for facial point detection. In Proc. IEEE Conf.
Comput. Vis. Pattern Recognit., pages 3476–3483, 2013.[43] J. Yan, Z. Lei, D. Yi, and S. Z. Li. Learn to combine
multiple hypotheses for accurate face alignment. In Proc.IEEE Int. Conf. Comput. Vis. Workshop, pages 392–396, 2013.
[44] H. Yang, X. He, X. Jia, and I. Patras. Robust face alignmentunder occlusion via regional predictive power estimation.IEEE Trans. Image Processing, 2015.
[45] H. Yang and I. Patras. Sieving regression forests votesfor facial feature detection in the wild. In Proc. Int’l Conf.Computer Vision. IEEE, 2013.
[46] H. Yang, C. Zou, and I. Patras. Face sketch landmarkslocalization in the wild. IEEE Signal Processing Letters,2014.
[47] X. Yu, J. Huang, S. Zhang, W. Yan, and D. N. Metaxas.Pose-free facial landmark fitting via optimized part mix-tures and cascaded deformable shape model. In Proc.IEEE Int. Conf. Comput. Vis., pages 1944–1951, 2013.
[48] J. Zhang, S. Shan, M. Kan, and X. Chen. Coarse-to-fineauto-encoder networks (cfan) for real-time face alignment.In Proc. Eur. Conf. Comput. Vis., pages 1–16. Springer, 2014.
[49] Z. Zhang, P. Luo, C. C. Loy, and X. Tang. Facial landmarkdetection by deep multi-task learning. In Proc. Eur. Conf.Comput. Vis., pages 94–108. Springer, 2014.
[50] F. Zhou, J. Brandt, and Z. Lin. Exemplar-based graphmatching for robust facial landmark localization. In Proc.IEEE Int. Conf. Comput. Vis., pages 1025–1032, 2013.
[51] D. Zhu, X. Ramanan. Face detection, pose estimation andlandmark localization in the wild. In Proc. IEEE Conf.Comput. Vis. Pattern Recognit., pages 2879–2886, 2012.
[52] S. Zhu, C. Li, C. C. Loy, and X. Tang. Face alignment bycoarse-to-fine shape searching. In Proc. IEEE Conf. Comput.Vis. Pattern Recognit., 2015.