an empirical investigation of consumer price perception ...140487/fulltext01.pdf · an empirical...
TRANSCRIPT

AN EMPIRICAL INVESTIGATION OF CONSUMER PRICE
PERCEPTION AND REPUTATION DIMENSIONS’ EFFECTS ON
ATTITUDE TOWARD PRIVATE LABEL BRANDS
Umeå School of Business and Economics Umeå University MSc in Marketing Research and Analysis Management Master thesis Spring semester 2007 Supervisor: Maria Bengtsson Authors: Haidong Chen Saalem Sadeque

“Private brands separate the quick from the dead”
– Mark Husson, Analyst, JP Morgan1
“The key is quality…the price brings them back”
– Dan Raftery, President of Raftery Resource Network Inc. 2
1 http://www.coriolisresearch.com/pdfs/coriolis_responding_to_private_label_in_new_zealand.pdf 2 http://www.privatelabelbuyer.com/content.php?s=PB/2006/03&p=7

ACKNOWDGEMENT
Taking the opportunity, I would like to thank Umeå University for her excellent environment and teaching. I would also give the gratitude to my parents for their persistent understanding and support. Also, thanks to Dr. Maria Bengtsson for her great supervision and to all my friends who helped me during this study.
Haidong Chen 6th May, 2007
Umeå, Sweden First, I like to thank Allah for giving me the opportunity to come to Umeå and completing the Masters degree. I like to thank my parents and sisters for their constant encouragements. I like to specially thank my wife for her understanding and constant support during our stay in Umeå. I also like to thank our wonderful supervisor, Dr. Maria Bengtsson, for her superb guidance during our thesis work. Lastly, I like to thank all those lecturers at Umeå University who allowed us to visit to their classes and collect data.
Saalem Sadeque 6th May, 2007
Umeå, Sweden

ABSTRACT
The study empirically investigated the effects of consumer price perception dimension and reputation dimension on attitude toward private label brands among young Swedish consumers. Consumer price perception dimension includes value consciousness, price consciousness, and price-quality association factors. Reputation dimension includes retailer’s reputation, existence of word-of-mouth (WOM), positive WOM, and negative WOM. Previous studies have found that factors under the consumer price perception dimension have an impact on attitude toward private label brands. The current study argues, based on theoretical framework, reputation dimension could also be considered as having an impact on attitude toward private label brands but that this has not been investigated before. Measurement scales for consumer price perception dimensions were taken from Baltas (1997) and Burton et al. (1998). New measurement scales were developed for factors under the reputation dimension. The reliability and validity of all the factors used in the study have been discussed. A multiple regression analysis was conducted where the private label attitude was the dependent variable and all factors under the two dimensions investigated in the study were the independent variables. The results of the analysis showed that value consciousness and price consciousness factors under the consumer price perception dimension have significant relationships with attitude toward private label brands. Similarly, retailer’s reputation, positive WOM, and negative WOM under the reputation dimension have significant relationships with attitude toward private label brands. Specifically, these three reputation dimension factors were found to have more influence on attitude toward private label brands among young Swedish consumers than the two factors found significant under the consumer price perception dimension. The major implication for the Swedish retailers is that they should put more emphasis on their own reputation (retailer’s reputation factor) and on positive WOM to develop favorable attitude toward private label brands among young Swedish consumers. They should also fight any negative WOM about their private label brands. In addition, the Swedish retailers should try to promote the quality aspect of their private label brands to the young Swedish consumers as value consciousness was found to be a significant determinant across the most of the demographic variables studied here. Key words: attitude, private label brands, consumer price perception dimension, reputation dimension

TABLE OF CONTENTS
1. INTRODUCTION .......................................................................................................1
1.1 Background..............................................................................................................1 1.2 Research Problem....................................................................................................2 1.3 Research Question....................................................................................................3 1.4 Research Purpose.....................................................................................................3 1.5 Outline of the thesis..................................................................................................5
2. SCIENTIFIC IDEAL AND PARADIGM ..................................................................6
2.1 Ontological orientation............................................................................................6 2.2 Epistemological orientation.....................................................................................6 2.3 Scientific approach...................................................................................................7 2.4 Research approach...................................................................................................7
3. THEORETICAL FRAMEWORK................................................................................8
3.1 Introduction to private label brands.......................................................................8 3.2 Importance of private label brands to the retailing industry .................................8 3.3 Private label brands’ attributes affecting consumer purchase decisions...............9 3.4 Consumers’ attitude formation toward private label brands...............................10
3.4.1 What is attitude?.............................................................................................10 3.4.2 Individual attitude to brand attribute ............................................................10 3.4.3 External stimuli affecting on individual attitude ...........................................11
3.5 Factors influencing attitude toward private label brands....................................11 3.5.1 Consumer price perception dimension...........................................................11
3.5.1.1 Price consciousness...................................................................................12 3.5.1.2 Value consciousness..................................................................................12 3.5.1.3 Price-quality association...........................................................................13
3.5.2 Reputation dimension.....................................................................................13 3.5.2.1 Word-of-mouth (WOM)...........................................................................13 3.5.2.2 Retailer’s reputation.................................................................................14
3.6 Proposed model for the current study...................................................................15 4. RESEARCH METHODOLOGY...............................................................................17
4.1 Development of measurement scale.......................................................................17 4.2 Questionnaire design..............................................................................................18 4.3 The sample selection and data collection procedure.............................................19 4.4 Pre-test....................................................................................................................20 4.5 Data analysis procedure.........................................................................................20

5. EMPIRICAL FINDINGS ..........................................................................................21
5.1 Profile of respondents............................................................................................21 5.2 Descriptive statistics...............................................................................................22 5.3 Creation of summated measurement scales..........................................................23
6. ANALYSIS OF DATA...............................................................................................24
6.1 Preliminary Data Analysis.....................................................................................24 6.1.1 Missing value...................................................................................................24 6.1.2 Outliers............................................................................................................24 6.1.3 Normality.........................................................................................................25
6.2 Advanced data analysis..........................................................................................25 6.2.1 Reliability tests................................................................................................25 6.2.2 Validity of the new measures..........................................................................27 6.2.3 Examining differences in means for demographic variables.........................27
6.2.3.1 Gender.......................................................................................................27 6.2.3.2 Age group..................................................................................................29 6.2.3.3 Department studying in............................................................................30 6.2.3.4 Financing sources.....................................................................................32 6.2.3.5 Spending per month (in SEK)..................................................................34
6.2.4 Private label brand purchase proneness........................................................37 6.2.5 Multiple regression analysis............................................................................38
6.2.5.1 Discussion of results of multiple regression analysis...............................39 7. CONCLUSIONS AND MANAGERIAL IMPLICATIONS..................................41 8. LIMITATIONS AND SUGGESTIONS FOR FUTURE RESEARCH..................43 LIST OF REFERENCES.................................................................................................44
Book References...........................................................................................................44 Journal References......................................................................................................44 Internet References......................................................................................................47
APPENDIX A: SWEDISH FOOD RETAILERS .........................................................49 APPENDIX B: QUESTIONNAIRE..............................................................................50

LIST OF TABLES
Table 1: Sources of measurement scales for consumer price perception dimension’s factors from previous studies...................................................................................17
Table 2: Comparison of number of usable cases............................................................20
Table 3: Demographic information of the respondents..................................................21
Table 4: Descriptives of the interval scaled items...........................................................22
Table 5: No. of missing value and percentage.................................................................24
Table 6: Results of reliability tests..................................................................................26
Table 7: Mean values of consumer price perception dimension factors according to gender.......................................................................................................................27
Table 8: Mean values of reputation dimension factors according to gender.................28
Table 9: Mean values of consumer price perception dimension factors according to age groups.......................................................................................................................29
Table 10: Mean values of reputation dimension factors according to age groups........30
Table 11: Mean values of consumer price perception dimension factors according to department studying in............................................................................................31
Table 12: Mean values of retailer’s reputation dimension factors according to department studying in............................................................................................31
Table 13: Mean values of consumer price perception dimension factors according to financing sources......................................................................................................32
Table 14: Mean values of retailer’s reputation dimension factors according to financing sources......................................................................................................33
Table 15: Mean values of consumer price perception dimension factors according to spending per month (in SEK)..................................................................................34
Table 16: Mean values of consumer price perception dimension factors according to spending per month (in SEK)..................................................................................35
Table 17: One-way ANOVA results for value consciousness and price consciousness for three different spending groups.........................................................................36
Table 18: Post-hoc Scheffe test results for value consciousness and price consciousness for three different spending groups.........................................................................37
Table 19: Frequency of private label brands purchase..................................................37
Table 20: Results of multiple regression analysis...........................................................38

LIST OF FIGURES
Figure 1: Three-component Model of Attitude (Rosenberg & Hovland, 1960).............11
Figure 2: Proposed model for the current study............................................................16
Figure 3: Comparison of consumer price perception dimension factors according to gender.......................................................................................................................28
Figure 4: Comparison of reputation dimension factors according to gender................28
Figure 5: Comparison of consumer price perception dimension factors according to age groups................................................................................................................29
Figure 6: Comparison of retailer’s reputation dimension factors according to age groups.......................................................................................................................30
Figure 7: Comparison of consumer price perception dimension factors according to department studying in............................................................................................31
Figure 8: Comparison of retailer’s reputation dimension factors according to department studying in............................................................................................32
Figure 9: Comparison of consumer price perception dimension factors according to financing sources......................................................................................................33
Figure 10: Comparison of retailer’s reputation dimension factors according to department studying in............................................................................................34
Figure 11: Comparison of consumer price perception dimension factors according to spending per month (in SEK)..................................................................................35
Figure 12: Comparison of retailer’s reputation dimension factors according to spending per month (in SEK)..................................................................................36

1
1. INTRODUCTION This chapter introduces the reader to the topic that the thesis will discuss. It begins with a presentation of the background to the thesis topic. Then research problem is detailed followed by research purpose. The chapter ends with an outline of the chapters that the thesis will follow.
1.1 Background
According to the American Marketing Association, a brand is defined as “a name, term, design, symbol, or any other feature that identifies one seller's good or service as distinct from those of other sellers” 1. Brands have been used by the manufacturers since the Roman times to identify and differentiate ones’ own products. Over time branded products have been equated with the sign of differentiated products by the consumers which lead to less perceived risk when purchasing the product. In turn consumers normally develop strong loyalty towards those brands which they were satisfied with. Strong brand loyalty translates into repeated purchasing of the same brand (Solomon 2004). This can in turn mean higher sales volume for the manufacturers. In this era of highly competitive business environment, consumers are constantly facing new brand choices. Competition among the major manufacturers is creating newer brands for the consumers almost on a daily basis. Private label brands, sold under the retailer’s own names, have added more competition to this by offering products which are lower in price compared to that of the major manufacturers. Such increased competition has put burdens on the consumers to make decisions regarding which brands to purchase and at the same time is putting pressure on the major brand manufacturers as well as on the retailers to manage their respective brands properly. The manufacturers of the major brands are feeling the impact of the increased competition, especially from the private label brands. Global sales of private label brands have increased by 5% compared to the manufacturers’ brands which experienced 2% growth rate in 2005 (Nishikawa & Perrin 2005). Tough competition from private label brands was cited as one of the reasons for Kraft’s (a major food item manufacturer) 19% decline in fourth-quarter earnings in 2006 (Carpenter 2007). There has been evidence that an increasing number of consumers in the U.S. are showing more brand loyalty toward the private label brands than before (Boyle 2003). In 2005, Global Consumer Confidence study conducted in 38 countries (including Sweden) by ACNielsen found that two-thirds of the consumers in those countries considered private label brands a good alternative to other brands and that private label brands offered good value for money (Nishikawa & Perrin 2005). Private label brands have traditionally experienced a high level of penetration in Europe. Private label brands represent 23% of all brands sold (in terms of volume) in Europe which is higher than the global figure which is 17% (Nishikawa & Perrin 2005). The market share of private label brands in United Kingdom, Germany, Belgium, and Switzerland are currently over 40% (Private Label Manufacturers Association 2007).
1 http://www.marketingpower.com/mg-dictionary-view329.php
2
Thus, given the changing perception of consumers toward the private label brands coupled with the increasing buying behavior leading to increased market shares of these brands, it would be of interest to further elaborate on the consumers’ attitude toward the private label brands. In the current study this will be investigated in the context of the young Swedish consumers. 1.2 Research Problem
With an increased set of brands to choose from, consumers are deciding the purchase of a particular brand by weighing various factors like price, quality, store image etc. Both the manufacturers’ brands and private label brands are fighting to attract the consumers on these factors. In the past, lower priced private label brands were equated with lower quality products when they were first introduced (Steiner 2004). However, in recent times, major retailers have increased the quality level of their private label brands to near or, in some cases, even better than that of the national brand leaders (Quelch and Harding 1996). There are evidences that quality private label brands can help differentiate a retail store and create store loyalty (Corstjens and Lal 2000, Shudir & Talukdar 2004). Shudir & Talukdar (2004) also find that a retailer’s profit can go up when the sale of private label brands increases. Thus, it is in the interest of the retailers to know which factors can influence the consumers’ attitude toward private label brands and subsequently influence their decision to purchase these brands.
Attitude toward private label brands have been found to influence the actual purchase and the purchase intention of these brands (Burton et al. 1998, Garretson et al. 2002, Jin & Suh 2005). Burton et al. (1998) examined the relationship between consumer price perceptions, marketing constructs, and deal proneness constructs with private label attitude. According to Burton et al. (1998) consumer price perception construct includes price consciousness, value consciousness, and price-quality perception variables. The marketing constructs includes brand loyalty, risk averseness, impulsiveness, and smart shoppers self perceptions and the deal proneness construct includes general deal proneness, price-related deals, non-price deals, and internal reference price reliance. However, Jin & Suh (2005) argue that of these three dimensions, consumer price perception dimension is most linked to private label attitude. In the current study, we will also investigate the variables under this particular dimension along with a new dimension which we call the reputation dimension. This dimension consists of word-of-mouth communication (WOM) and retailer’s reputation. Previous academic studies have not investigated the role of these two factors to attitude toward private label brands but other academic studies have already shown that these factors can have major influence on consumers’ purchase decisions. Previous researches have documented that customers engage in positive WOM when they are satisfied with the product or service (cited in Carpenter & Fairhurst 2005). There are documented evidences that WOM has a strong influence on how consumers view a particular product or service (Harrison-Walker 2001). WOM has been found to be seven times more effective than newspaper and magazine advertisements and four times more effective than personal selling (cited in Harrison-Walker 2001, p. 60). The personal nature of the WOM, which increases trustworthiness, has been identified as the reason for its effectiveness (Murray 1991, as cited in Harrison-Walker 2001). In cases of uncertainty,

3
potential consumers are likely to rely on WOM to make purchase decisions. WOM is only likely to occur when a brand has reached certain level of quality or performance and is a direct result of the reputation attained by the brand. Since quality or performance of private label brands can not be observed directly, it is very much likely that consumers will rely on WOM to form attitude toward private label brands and it is therefore of interest to further study its importance for customer perception of private label brands. A retailer’s good reputation can be expected to form positive attitude toward private label brands as the customers may believe that retailers will not risk their reputation by selling lower quality private label brands. In a study conducted on U.S. consumers by PL buyer magazine, showed that there is a relationship between a store’s reputation and private label confidence with 78.1% of the respondents agreeing that they are “more likely to purchase private label products from a store with an excellent reputation”.2 Gu & Nilsson (2006) also report that retailer’s reputations determined Swedish consumers’ likelihood of buying the private label brands. They cite examples, where their respondents said that they will buy ICA brand (one of the major retailer’s brand in Sweden) because of the retailer’s (i.e. ICA) good reputation. However, their study was conducted on a qualitative level and did not attempt to make any direct connection between retailer’s reputation and attitude toward private label brands. In this study we use “retailer’s reputation” as a factor under the reputation dimension that could determine attitude toward private label brands. 1.3 Research Question What are the effects of consumer price perception dimension and retailers’ reputation dimension on attitude toward private label brands among young Swedish consumers? 1.4 Research Purpose
Although Sweden has traditionally experienced low market share for private label brands, the penetration has been increasing in year 2004 and 2005. The Swedish retailers are withdrawing smaller brands from their shelves and replacing them with their own private label brands (Euromonitor International 2007) to improve profit margins. Generally these retailers have focused on a strategy of lower prices for their private label brands thereby increasing the price gap between these brands and the manufacturers’ brands (Swedish Competition Authority 2006). The importance of private label brands in Sweden can be judged by the fact that two of the largest retailers in Sweden, ICA and Axfood, have targeted to generate 25% of their sales from private label brands by the year 2007 (Berlinski 2005). According to one report, the market share of private label brand has already reached 28% in Sweden (Private Label Manufacturers Association 2007). Furthermore, Chronsell & Nauclèr (2006) reported that Swedish consumers do not view private label brands as having lower quality than the manufacturers’ brands but instead considers them as a good complement for the overall product offering. Appendix A provides a brief introduction to the three big retailers in Sweden and their private label brands. According to one report, private label brands in Europe are gaining strong support from the young consumers up to the age of 25 (Private Label Manufacturers Association 2007). 2 http://www.privatelabelbuyer.com/content.php?s=PB/2006/03&p=7
4
Because of the lower price of private label brands, consumers with low income are expected to purchase them. In Sweden, age group of 20-24 years have been found to earn a disposable income of 137,500 SEK annually on average, which is the second lowest among all age groups3. Therefore, it is expected that with low budget available to this group of young Swedish consumers, they will have favorable attitude toward the private label brands which are generally lower priced. However, another report by ACNielsen documented that 64 % of the Swedish consumers disagreed with the statement that private label brands are“….really meant for people who are on tight budgets and can’t afford the best brands” (ACNielsen Consumer Attitudes Towards Private Label Global Study 2005, p. 27). This study was not specific to young Swedish consumers. Thus there is no information about what attitude the young Swedish consumers have toward the private label brands. Given that the major retailers see consumers as the main driving force for the continued existence and future development of private label brands (Chronsell & Nauclèr 2006), it would be of interest to identify the factors that determine the attitude toward private label brands among young Swedish consumers. Moreover, young Swedish consumers are expected to earn higher income in future and may look for expensive alternatives to private label brands. It is expected that the findings from this study will allow the Swedish retailers to effectively target the young Swedish consumers by managing the important factors that affect the attitude toward the private label brands and consequently make promotional decisions that can create long-term brand loyalty toward these brands. Studies conducted in Sweden have identified some factors that affect consumers’ perception toward private label brands in Sweden. Price and retailer’s reputation were found to be the two most important factors for consumers’ perception toward private label brands (Chronsell & Nauclèr 2006, Gu & Nilsson 2006). These studies revealed that both the consumers and retailers in Sweden shared the same view that private label brands offered good value for money and that these brands offered comparable quality products to that of the manufacturers’ brands. In addition, major retailers were found to rely on word-of-mouth communication (WOM) as a vehicle for promoting private label brands (Chronsell & Nauclèr 2006). However, the studies described above have used qualitative methodology by focusing on in-depth focus interview or case study method. The results of these studies, although valid, cannot be meaningfully generalized to identify the attitude toward private label brands. This is one of the limitations of using qualitative methodology in research (Bryman & Bell 2003). Moreover, these studies have focused on Swedish consumers in general and did not specifically focus on young Swedish consumers. Private label brands are increasingly gaining acceptance from the Swedish consumers. Market penetration of the private label brands have been steadily increasing and retailers are focusing more on these brands than ever before. Despite some research on Swedish consumers’ perception toward private label brands there is no information connecting factors such as value consciousness, price consciousness, price-quality perception, retailer’s reputation, and WOM to the attitude toward the private label brands. The authors aim is to conduct a quantitative study to connect these variables with attitude toward the private label brands among young Swedish consumers.
3 http://www.scb.se/templates/tableOrChart____28884.asp
5
Given the above discussions, the purpose of this research is to investigate the role of factors under the reputation dimension (i.e. WOM and retailer’s reputation) along with the factors under the consumer price perception dimension (i.e. consciousness, price consciousness, and price-quality perception) in developing attitude toward private label brands among young Swedish consumers. 1.5 Outline of the thesis
This thesis is divided into eight chapters. The introductory chapter is followed by Chapter Two, scientific ideal and paradigm. The chapter discusses the scientific ideal that underpins the working of this thesis. A brief discussion is then provided on the ontological and epistemological orientation followed in the thesis.
Chapter Three examines previous studies conducted on private label brands. The chapter starts with an introduction to these brands and their importance to the retailers. It is then followed by brief discussion of private label attributes that affect the purchase decisions of private label brands. The chapter then provides in-depth discussion on factors that affect consumers’ attitude toward private label brands. The proposed model for this thesis is also developed and outlined here.
Chapter Four discusses the how the measurement scale was selected and how the questionnaire was designed. It also covers discussion on sample selection, data collection procedure, and pre-testing. A brief discussion of the data analysis procedure applied in the thesis is also covered.
Chapter Five provides empirical findings of the study. It includes profile of the respondents and descriptive statistics of each of the statements or items used in the study.
In Chapter Six, detailed data analysis procedure is discussed. These includes missing value examination, outliers examination, normality testing, reliability testing, results from several independent samples t-tests, one-way ANOVA tests, and results of multiple regression analysis. A discussion of the multiple regression analysis results are also covered in the chapter.
Chapter Seven concludes the thesis by discussing the major findings of the thesis. It is then followed by discussion of several managerial implications. Chapter Eight covers the limitations of the thesis and suggestions for future researches based on these limitations.

6
2. SCIENTIFIC IDEAL AND PARADIGM This chapter introduces the ontological, epistemological orientations, scientific approach, and research approach chosen for conducting the current study.
When conducting research, the researcher needs to mention about the scientific paradigm that he or she is following. This is important since the paradigm followed determines the direction of the research process including research method followed and data analysis and interpretation. The paradigm can be explained in terms of its ontological and epistemological orientation. 2.1 Ontological orientation
Ontological orientation deals with the nature of reality. It focuses on whether the reality should be considered as given which will then be investigated by the researchers from a distance or that the reality is affected by the perceptions and actions of the social actors and therefore is constantly under construction. The first approach is called the objectivism and the later is called constructionism (Bryman & Bell 2003). In the current study we investigate the decision making process of the consumers with regard to the private label brands. It is our belief that the consumers behave in certain and generalizable way when making purchase decisions; that it is the reality that confronts us. We believe that studies should be conducted to identify the reasons behind this way of decision making. Thus, in our research we focus on how these purchase decisions are made for private label brands by investigating attitude toward private label brands. Accordingly, the current study will be approached from objectivism stand point. 2.2 Epistemological orientation
The epistemology issue is “concerned with the acquisition of knowledge and the relationship between the researcher and the researched” (Penn 2000). There are two broad epistemological stances. These are the positivist epistemology and the interpretive epistemology. Pachauri (2002) mentions that under the positivist epistemology stance, consumers are considered as rational, stable, and knowable entities. She further notes that the emphasis is on observation and testing with the aim of establishing generalizable laws that can be used to predict and control behavior. In addition, positivist stance assumes that a single reality exists and that events can be objectively measured. In the interpretive epistemology, consumers are assumed to be autonomous, free-thinking individuals who can script their own experience and assign meaning to their actions rather than passively respond to the environment. The focus of research in consumer behavior, therefore, becomes an attempt to understand the subjective meanings of the consumer’s individual actions. (Pachauri 2002). Given the focus of the current research, the positivist approach has been adopted. The authors assume that consumers are rational in their purchase decision making about private label brand. Thus, with observation and testing a generalizable relationship could be developed to predict how attitude toward private label brands are formed. The findings of

7
this research can well be challenged if further information comes to light. Nevertheless, until that time arrives the findings of this research can be considered valid. 2.3 Scientific approach
There are two scientific approaches to conducting any research. The researcher could develop a conceptual framework based on existing theories and conduct empirical analysis. The objective is to add to the current theory or it could be to disprove an earlier theory. This approach is called the deductive approach. The other approach starts with observations or findings and attempts to develop the theory. This is known as the inductive approach. (Bryman & Bell 2003). In the current study, findings from previous academic studies have been used to identify the attributes important for consumers’ decision making for purchasing private label brands. After going through the literature it has been discovered that there is no information on young Swedish consumers’ buying behavior of private label brands. There is also no information on whether young Swedish consumers have a favorable or unfavorable view of private label brands. Thus, the authors have approached the current study from deductive point of view. Essentially, the current study partially replicates and extends Burton et al. (1998). It partially replicates by considering only the consumer perception variables (i.e. value consciousness, price consciousness, and price-quality perceptions) and aims to extend the model by adding WOM and retailer’s reputation. Hubbard & Armstrong (1994) argue that successful replication increases confidence in the original findings and may allow the original results to be generalized to different population, products, geographical areas, etc. They also note that replication and extensions are rare in marketing and emphasize that replication with extensions can assess whether the outcomes of a study is equally applicable outside the original context. Madden et al. (1995) also argue that replication should be conducted in every new research. The current study follows this principle by partially replicating Burton et al. (1998) findings in the context of young Swedish consumers and by extending their model by including WOM and retailer’s reputation factors. 2.4 Research approach
There are two methods of research – qualitative and quantitative. Qualitative research is usually applied when the objective is to explore a topic to gain first understanding of the researched area. It is based on the epistemological orientation of interpretivism, ontological orientation of constructionism, and inductive approach. It focuses on words rather than quantification in the collection and analysis of data. (Bryman & Bell 2003). Consistent with the epistemological orientation of positivism, ontological orientation of objectivism, and deductive scientific approach of the current study, the quantitative method of research is undertaken (Bryman & Bell 2003). Based on the existing theories already discussed in the theoretical framework, the current study will attempt to identify relationship among consumer price perception dimension, reputation dimension, and attitude toward private label brands among young Swedish consumers. As Burton et al. (1998) followed a quantitative approach, a similar approach has been deemed appropriate for the current study.

8
3. THEORETICAL FRAMEWORK This chapter begins by providing an introduction to private label brands, their importance to the retailers, and what cues consumers use in deciding the purchase of these brands. The chapter then provides a discussion of two models of attitude formation and how they relate to the private label brands. The chapter ends with discussion of various factors that can influence the attitude toward private label brands. In this section, we also develop our model based on two dimensions: consumer price perception dimension and reputation dimension. 3.1 Introduction to private label brands
American Marketing Association defines a private label brand (also referred to as store brand or distributors’ brand) as “a brand name or label name attached to or used in the marketing of a product other than by the product manufacturers; usually by a retailer”4. Retailers are offering these private label brands as an alternative to national and international brands. By doing so, retailers are moving from a position of being solely a distribution channel member to become direct competitors to the manufacturers. Viewed in another way, the retailers are transforming themselves from the role of pure customers to the manufacturers to the role of direct competitors to the manufactures (Dhar and Hoch, 1997). This has led the major brands manufacturers to be wary of the competition from private label brands which have been mostly lower priced since they were first introduced. Some have argued that sale of private label brands discourages product innovation by the major manufacturers for fear of being copied in the form of private label brands (Chronsell & Nauclèr 2006). However, Steiner (1994) argued that it is the product innovation process that is the strongest competitive weapon against the private label brands since it can leave the retailers with a private label brand that is “imitating yesterday’s favorites” (p. 118). He further suggests that the competition between private label brands and manufacturers’ brands is good for the society by arguing that this “…tends to maximize social welfare in consumer goods industries” (p. 105). Dekimpe, Hanssens, & Silva-Risso (1999) also suggest that this competition may benefit both the manufacturers and the retailers by stimulating primary demand for the underlying product. 3.2 Importance of private label brands to the retailing industry
From the retailers’ point of view there are a number of motivations to introduce private label brands. The retail chains use their advantage in economies of scale in distribution to earn higher retail gross margins by selling both private label and manufacturers’ brands (Richardson 1997). Moreover, the retail chains tend to consider the introduction of the private label brands as a strategic tool for their overall business (Steiner 2004). Specifically, the retail chains expect to gain more control over the brands that they sell and also to leverage the acceptance of a private label brand in one product category as a leverage to introduce new private label brands in other product categories (Steiner 2004). Retailers have also been using successful private label brands as bargaining power when negotiating for price or other concessions with major brands’ manufacturers (Narasimhan and Wilcox 1998, Bergès-Sennou et al. 2003).
4 http://www.marketingpower.com/mg-dictionary-view2532.php

9
Another motivation for introducing private label brands is to create store differentiation. Previous academic studies have found support for this view by documenting that the private label brands allow a retailer to distinguish itself from the other retailers by increasing store loyalty (Corstjens and Lal 2000, Shudir & Talukdar 2004). Collins-Dodd & Lindley (2003) argue that private label brands can be seen as an extension of the store image and can, thus, create store differentiation. This should be a desirable goal for the retailers, as Bonfrer & Chintagunta (2004) documents that the probability of purchasing private label brands is higher for store loyal customers. This implies that consumers need to return to that store to purchase the private label brands which are not available in other store. At the same time, it can also be expected that the overall turnover of the retail store would go up as customers will not only purchase the store brands but also purchase brands of other product categories marketed by other manufacturers thereby increasing the overall revenue of the retail store. However, other academic evidences imply that private label brands may not contribute toward store differentiation. In an experimental study conducted on five different private label brands, Richardson (1997) documented that consumers did not differentiate the quality between different private label brands. Richardson (1997) concluded that this implied that consumers consider private label brands as just another brand. Julh et al. (2006) reported that the consumers are more likely to choose the retail stores before they choose the private label brands. This suggests that the store patronage is a prerequisite condition to the purchase of the private label brands by the consumers. Thus, Juhl et al. (2006) argue that it is important for the retailers to attract the customers to their stores and not rely on the private labels to create store loyalty. One way that retailers could accomplish this is through creating good reputation. Retailer’s reputation has been considered as one of the factors that can affect attitude toward private label brands. A favorable attitude toward private label brands could in turn create store loyalty. 3.3 Private label brands’ attributes affecting consumer purchase decisions
The retail chains generally priced their private label brands lower than that of the major brands (Steiner 2004), which is a characteristic of most private label brands even today. This results in the so called “price gap” between manufacturers’ brands and private label brands. The existence of this “price gap” has important implication as it has been documented that in the absence of familiarity with the private label brands, consumers are more likely to use extrinsic cues such as price, brand name, and packaging to judge the quality of these brands (Dick et al. 1996, Richardson et al. 1996). Thus, traditionally, this “price gap” has been used by the consumers to infer a “quality gap” between the manufacturers’ brands and private label brands leading to the perception that private label brands are of poor quality (Quelch & Harding 1996, Steiner 2004). Moreover, this association is likely to lead consumers to develop unfavorable attitude toward private label brands. However, the perception about private label brands is changing. Major retailers have repositioned the private label brands on quality rather than low price (Richardson 1997). As a result, the perception of “quality gap” between these brands and the manufacturers’ brands has diminished (Quelch & Harding 1996, Burt 2000). Yet consumers are not completely willing to completely trade off manufacturers’ brands for private brands in certain categories. For example, baby food category shows low penetration by private label brands

10
(Bergès-Sennou et al. 2003). This can be attributed to the perceived riskiness of making the wrong brand choice in some product categories (Richardson et al. 1996, Batra & Sinha 2000). 3.4 Consumers’ attitude formation toward private label brands
As the current study focuses on attitude toward private label brands, the following sections discuss how attitude is defined in the consumer behavior context. It is followed by a discussion of two widely used models that discusses how attitude toward an object is formed. These are Fishbein’s model and “Three component model of attitude”. Later in the chapter these models will be associated with the specific factors that are being tested in the current study. 3.4.1 What is attitude?
The concept attitude is a widely used term in contemporary social culture. A popular meaning defined by Oxford Dictionary is “a way of thinking or behaving” (Hornby & Cowie 1992, p.65). In the scientific community, the definition of attitude includes: individual’s evaluations of objects (Gold & Douvan 1997), an association in memory between an attitude object and an evaluation (Fazio 1989), etc. Based on a psychological definition, Solomon (2004) puts attitude in a business perspective and defines attitude as follow; “ the attitude means a lasting, general evaluation of people (including oneself), objects, advertisements, or issues” (p. 224). This is also the definition that has been adopted for the purposes of the current study. To change attitude is viewed upon as a meaningful starting point for modifying behavior, not only in social psychology but also in marketing and everyday life (Hewstone, Stroebe, Codol & Stephenson 1988). 3.4.2 Individual attitude to brand attribute
An attitude can be conceptualized through an equation in the expectancy-value model, also called Fishbein model (Fishbein and Ajzen, 1975), an influential multi-attribute model of attitude. The model describes that an attitude is a function of a person's beliefs about an object and the evaluative responses.
To adapt the expectancy-value model for consumer behavior, the equation is computed as:
Aijk=∑βijk * I ik
Where i is the attribute, j is the brand, k is the consumer, I is the importance weight given attribute i by consumer k, β means consumer k’s belief regarding the extent to which brand j possesses attribute i, and A is a particular consumer’s (k’s) attitude score for brand j (Solomon 2004).
The above model shows how the consumer perceives the attributes of a brand and how this perception leads to an attitude about that brand. Because an attribute is populated to be the key antecedent of attitudinal intention, which reflects a positive or negative value to a brand, the measurement about attribute is a reasonable way to evaluate consumer’s attitude. In this study, the attributes “price”, “value” and “price-quality association” are deemed as the factors affecting on consumer’s attitude towards a private label brand. It can be imagined

11
that the consumer will exhibit a certain attitude when he or she evaluates the brand attribute positively or negatively.
3.4.3 External stimuli affecting on individual attitude
Most researchers agree that an attitude has three components: effect, behavior and cognition (Solomon 2004). These are shown in the three component model of attitude developed by Rosenberg & Hovland (1960) shown in Figure 1.
1Figure 1: Three-component Model of Attitude (Rosenberg & Hovland, 1960)
The model assumes that a consumer’s attitude (evaluation) of an attitude object will depend on the beliefs he or she has about several or many attributes of the object. In this model, the interrelationships among knowing, feeling, and doing are emphasized. When using this model in marketing, researchers imply that an attitude to a product or brand can be predicted by identifying these specific beliefs, identity and values, and use them to derive a measure of the consumer's overall attitude. The external stimuli plays a key role to most extent to influence the consumer’s beliefs and finally can change or lead consumer’s attitude. External stimuli includes situation, social issues, influence of social groups etc. With respect to the current study, word-of-mouth (WOM) and retailer’s reputation can be considered stimuli factors that influence attitude to private label brands. Detailed discussions of these two factors are provided later in the chapter.
3.5 Factors influencing attitude toward private label brands
In the current study, two dimensions have been used to determine attitude toward private label brands. These are consumer price perception dimension and reputation dimension. The latter dimension has been specifically developed for the current study and will be described in detail later in the chapter. 3.5.1 Consumer price perception dimension
The first dimension used in the study is the consumer price perception dimension. This dimension has been used by Burton et al. (1998). There are three factors that constitute this dimension. These are price consciousness, value consciousness, and price-quality

12
association (or perception). These factors can be considered as specific attributes in the Fishbein model (see section 3.4.2) that can lead to attitude formation toward private label brands. The factors are described in detail in the following sections. 3.5.1.1 Price consciousness
American Marketing Association defines price consciousness as “[T]he degree to which buyers are sensitive to differences in price between alternative choices” 5. The conventional wisdom is that private label brands are aimed at consumers who are price consciousness because their prices are lower than that of the manufacturers’ brands. Price consciousness consumers make purchase decisions based solely on price over other factors (Burton et al. 1998). Further, the level of price consciousness has been found to increase with lower income (Batra & Sinha 2000). Therefore, it is reasonable to expect that low price levels of private label brands would be attractive to the group of people with limited budget. Thus, it is expected that young Swedish consumers with low budget will have favorable attitude toward private label brands. Burton et al. (1998) found a positive relationship between price consciousness and private label brand attitude for the grocery items. Sinha & Batra (1999) and Batra & Sinha (2000) also find the relationship between price consciousness and private label brand purchase to be positive but also document that it can vary by different product categories. However, Jin & Suh (2005) did not find any relationship between price consciousness and private label brand attitude. It could be because their study was conducted in Korea, whereas the previous studies were conducted in the U.S. The contradictory findings, however, suggests that the relationship between price consciousness and attitude toward private label may not be straightforward especially when different international markets and different product categories or customers are considered. 3.5.1.2 Value consciousness
Consumers do not buy private label brands solely because it is cheaper. Some consumers consider the quality of the private label brands with respect to the price that they are paying. This group of consumers is defined as value conscious (Lichtenstein et al. 1990, Burton et al. 1998, Garretson et al. 2002, Jin & Suh 2005). Specifically, value conscious consumers consider the ratio of quality-to-price to make a purchase decision. In other words, the consumers judge what they are receiving for the value of money that they are giving up. Sinha & Batra (1999) argue that every consumer has to make price–quality trade-offs regardless of income levels or quality targets. Thus, it can be expected that consumers who are high on value consciousness will engage in quality-price trade-offs in forming attitude toward private label brands. For example, if the consumers perceive that the quality of private label brands is higher with respect to the price, then they are likely to form positive attitude toward private label brands. Previous academic researches have found a positive relationship between value consciousness and private label attitude (Burton et al. 1998, Garretson et al. 2002, Jin & Suh 2005). This implies that consumers who are high on value consciousness tend to have positive attitude toward private label brands.
5 http://www.marketingpower.com/mg-dictionary-view2502.php
13
3.5.1.3 Price-quality association
Price-quality association (or perception) is the tendency by the consumers to use price to infer about the quality of the private label brands (Burton et al. 1998, Sinha & Batra 1999, Batra & Sinha 2000, Garretson et al. 2002). The difference between value consciousness and price-quality association is that in the first case, consumers will only pay a low price if they are getting the minimum quality that they are looking for whereas in the second case, consumers are willing to pay lower price to buy a lower quality product or high price for a high quality product. Previous studies have documented that customers tend to rely on price, one of the external cues, to infer the quality of private label brands in absence of familiarity with these brands (Richardson et al. 1996) or when there is suspicion about the brand-ingredients (Dick et al. 1996). Given the perception of low quality among private label brands, it can be expected that a negative attitudinal relationship exists between these brands and price-quality association. Previous academic studies have documented that there is a negative relationship between price-quality association and attitude toward private label brands (Burton et al. 1998, Garretson et al. 2002). Sinha & Batra (1999) and Batra & Sinha (2000) explain that this negative relationship could be the result of perceived riskiness of making the wrong purchase decisions. At the same time, they document that this negative relationship could vary by the product categories. For example, negative relationship would be stronger in product categories where the consequences of making a wrong decision are high. 3.5.2 Reputation dimension
In addition to the consumer price perception dimension, the current study argues that there is a reputation dimension that can affect attitude toward private label brands. According to Oxford dictionary, reputation is defined as “a widespread belief that someone or something has a particular characteristic” 6. Reputation can be considered as an external stimulus that can affect attitude toward an object consistent with the “Three-component model of attitude” described previously (see section 3.4.3 and Figure 1). It is likely that reputation about private label brands and retailers, who sell these brands, can affect attitude toward private label brands. In the current study, word-of-mouth (WOM) is used to measure reputation about private label brands and retailer’s reputation is used to measure reputation of the retailers who sell these brands. Specifically, it is expected that if private label brands have reached a certain level of reputation, it will be spread through WOM. Similarly, if a retailer is well-known, consumers are likely to trust the private label brands sold by it. Thus, the retailer’s reputation can be considered an important factor in the purchase of private label brands. The following sections discuss these factors in more detail. 3.5.2.1 Word-of-mouth (WOM)
According to the American Marketing Association, WOM communication can be defined as “…sharing of information about products or promotions with friends” 7. WOM has been accepted as having a very persuasive influence on people. WOM has been found to be more effective in influencing behavior of people than other market-controlled sources (Buttle
6 www.askoxford.com 7 http://www.marketingpower.com/mg-dictionary-view3448.php

14
1998). The major advantage of WOM is that it is regarded as a form of personal communication and therefore, considered to be more reliable and trustworthy (Day 1971, Murray 1991; both cited in Buttle 1998). East et al. (2005) found that recommendation had more impact on brand choices than advertising although they also report that the impact can vary by product category. The influence of WOM is found to be stronger when consumers face ambiguous situations (Bone 1995). In a study conducted in Finland, Lybeck et al. (2006) report that heavy users of private label brands rely more on friends’ recommendations when trying out a retailers’ brand of chocolates. The private label brands can be ambiguous to the consumers as they may be uncertain about its overall quality. Thus, consumers are likely to rely on WOM to develop attitude toward private label brands. WOM can be either positive or negative. Positive WOM takes place when good news, testimonials, and endorsements of the brand are given in the way that the company desire whereas negative WOM is defined as the opposite to this notion (Buttle 1998). When consumers are satisfied with a product, they are most likely to engage in positive WOM about that product (Swan & Oliver 1989). Positive WOM are expected to influence others to form positive impression of the product. In an experimental study, Herr et al. (1991) document that a single, favorable WOM communication is effective in forming favorable brand attitude. Negative WOM is likely to occur as a result of dissatisfaction with the product. Negative WOM is found to be more effective than positive WOM (Arndt 1967; cited in Buttle 1998). On the other hand, Bone (1995) reports that positive WOM has stronger effect on pre-usage (pre-purchase) stage than negative WOM. However, East et al. (2005) found that negative WOM had the same impact as positive WOM. Thus, there are some contradictions regarding whether positive or negative WOM has more impact on the potential consumers. In the current study we assume that a positive (negative) WOM received will likely contribute a positive (negative) attitude toward private label brands. However, mere existence of WOM about private label brands could also affect attitude toward private label brands positively. This is because consumers are likely to discuss about private label brands only if they think it is worth discussing with their friends. Recipients of WOM might interpret this discussion as a positive sign toward the private label brands. Thus, in the current study, we investigate WOM in three ways. We will set factors to determine if the existence of WOM has an influence on attitude toward private label brands. In addition, the effects of positive and negative WOM on attitude toward private label brands will be investigated. 3.5.2.2 Retailer’s reputation
Retailer’s reputation is a proxy for the retailer’s credibility and can stand for signal of quality (Boulding & Kirmani 1993, Gupta & Cooper 1992, Shapiro 1982, 1983; all cited in Kukar-Kinney & Grewal 2006). The use of retailer’s reputation is specific when it applies to an assortment of products carried within the store (Dawar & Parker 1994). The retailer’s reputation is a high-scope cue for consumer to judge the product quality and make purchase decision (Purohit & Srivastava 2001). Previous researches have shown that selling the product through a high-quality retailer, a manufacturer can potentially signal its high quality to consumers (Chu & Chu 1994, Purohit & Srivastava 2001).

15
Purohit & Srivastava’s findings (2001) show a low-quality brand cannot convey improvement in product quality through a warranty unless it goes through a reputable retailer. However, previous findings focus more on the relationship between retailer’s reputation and product quality, but do not measure how consumers perceive the influence of retailer reputation towards private label brand. When consumers cannot distinguish between private label brands and manufacturers’ brands, retailer’s reputation might be the deciding factor to attract the consumers to the private label brands. As mentioned earlier, major retailers today have repositioned the private label brands on quality as the key factor to minimize the gap between private label brand and manufacture brand. Thus, it is reasonable that the retailer reputation which delivers the signal of product quality could be an efficient factor to predict the consumer’s attitude towards private label brand. Lau & Lee (1999) argue that consumers’ assessment of a brand could be affected by the knowledge about the company that offers the brand, which can include trust in the company. In the current study, retailer’s reputation factor assumed to be related to trust in the private label brands that the retailer is offering. Lau & Lee (1999) define trust in a brand as “as a consumer’s willingness to rely on the brand in the face of risk because of expectations that the brand will cause positive outcomes” (p. 344). When a company is trusted, the brands offered by the company are also trusted. In their research, Lau & Lee (1999) find support that trust in a brand and trust in a company goes together. In fact, they went on to argue that “one may not be achieved without the other” (p. 362). However, their study did not investigate this relationship with respect to private label brands. Given their general finding and given the previous academic findings that private label brands can be seen as risky by consumers (Dick et al. 1995, Richardson et al. 1996, Batra & Sinha 2000), it can be reasonably expected that trust in retailers would lead the consumers to form positive attitude toward private label brands. 3.6 Proposed model for the current study
Consistent with Burton et al. (1998), this study investigates the private label grocery product as a whole rather than consider any specific private label brand category or different private label brands offered by individual retail chains. The objective is to assess the general consumer attitude toward the private label brands (for example, assessing attitude toward advertising in general rather than attitude toward a particular advertisement) (Burton et al. 1998). Moreover, the current study is limited to the study of the food/grocery industry as a whole and does not investigate the effect of product categories on attitude toward private label brands. This could not be accomplished because of time and financial resource limitation. Burton et al. (1998) and Garretson et al. (2002) investigate how attitude toward private label brands is related to actual private label brand purchase by examining the actual sales receipts of their respondents. They conclude that attitude toward private label brands is positively related to the actual private label purchase. In the absence of actual sales receipts, Jin & Suh (2005) investigate whether there is any relationship between attitude toward private label brands and purchase intention of private label brands. Their study found positive relationship between the two constructs. Since the relationship between attitude toward private label brands and actual purchase or purchase intention of private label brand

16
have been found to exist, the current study will only concentrate on determining the relationships between the attitude toward private label brands and the factors under the consumer price perception and reputation dimensions. This implies that the focus of the current study is not to investigate the relationship between attitude toward private label brands with actual purchase or purchase intentions of these brands. Given the discussions in this chapter the following model has been developed for the current study (see Figure 2). In the proposed model, consumer price perception dimension consists of price consciousness, value consciousness, and price-quality association. The reputation dimension consists of retailer’s reputation, existence of WOM, positive WOM, and negative WOM. The expected directions for each of these factors are also shown in the figure.
2Figure 2: Proposed model for the current study
Reputation dimension � Retailer’s reputation (+) � Existence of WOM (+) � Positive WOM (+) � Negative WOM (-)
Consumer price perception dimension � Price consciousness (+) � Value consciousness (+) � Price-quality association (-)
Private Label
Attitude

17
4. RESEARCH METHODOLOGY This chapter provides information on the choice of method and the approach taken in the questionnaire design stage. It also provides information on the method used to collect the actual data. 4.1 Development of measurement scale
Three statements for measuring private label attitude were taken from Burton et al. (1998). One statement was taken from Baltas (1997). He found that some consumers buy private label brands simply because they prefer these and not solely because of price base (pp. 319-320). Thus the statement “I prefer store brands over other brands” was used in the study. The statements for measuring private label attitude, price consciousness, value consciousness, and price-quality perception factors were taken from Burton et al. (1998). These are summarized in Table 1.
Table 1: Sources of measurement scales for consumer price perception dimension’s
factors from previous studies
Factors Items Sources When I buy a private label brand, I always feel that I am getting a good deal. Buying private label brands makes me feel good. In general, private label brands are poor quality products.*
Burton et al. (1998)
Private label
attitude I prefer store brands over other brands. Baltas (1997) Generally speaking, the higher the price of a product, the higher the quality. The price of a product is a good indicator of its quality. I believe in the statement that "you get what you pay for".
Price-quality association
You always have to pay a bit more to get a better brand.
Burton et al. (1998)
I am very concerned about low prices, but I am equally concerned about product quality. I generally shop around for lower prices on products, but they still must meet quality requirements before I buy them. When grocery shopping, I compare the prices of different brands to be sure I get the best value for the money.
Value Consciousness
When I buy products, I like to be sure that I am getting my money’s worth.
Burton et al. (1998)
I will grocery shop at more than one store to take advantage of low prices The time it takes to find low prices is usually not worth the effort.* The money saved by finding low prices is usually worth the time and effort.
Price Consciousness
I am not willing to go to extra effort to find lower prices.*
Burton et al. (1998)
*items that were reverse coded.
18
However, new statements needed to be developed for the other factors related to WOM and retailer’s reputation under the reputation dimension. These were developed from the theoretical framework developed in Chapter 3 and are described next. From the theoretical framework, it was decided to test the WOM factor in three ways. We tested for the existence of WOM, the effect of positive WOM, and the effect of negative WOM. Since WOM is defined as “…sharing of information about products or promotions with friends”8, we developed the statements (1) “Quality, price or reputation of store brands are a topic of discussion among my friends” and (2) “My friends seldom comment on the value of store brands” to test if WOM related to private label brands actually existed (existence of WOM). The latter statement was treated as a negative statement and recoded in the analysis part. To test positive and negative effects of WOM, we used the concept of influence of these two forms of WOM discussed in chapter 3. Accordingly the two statements developed to test positive WOM: (1) “I generally receive good recommendations about store brands” and (2) “I buy private label brands because of my friends’ recommendations”. To test negative WOM, the statement “I have heard comments about private label brands’ poor quality” was developed. The statements for testing retailer’s reputation were developed following the discussions in Chapter 3. One of the conclusions of that chapter was that trust in a company can affect trust in brands. Following this conclusion, three statements were developed to test the effect of retailer’s reputation on private label brands. These are: (1) “If the retailer is well-known, then I buy its private label brand”; (2) “I will only buy private label brands from a retailer whom I trust”; (3) “A retailer’s reputation is an important factor in choosing between different stores’ brands”. Another significant conclusion in Chapter 3 was that manufacturers could signal higher quality of their products if these are sold through reputable retailers. Accordingly, the statement “The more well-known retailers are, the higher is the quality of the store brands” was developed. 4.2 Questionnaire design
The questionnaire comprised of two parts. The first part of the questionnaire asked background questions about gender, age, department enrolled in, and approximately how much money is spend on grocery/food item in a month. The second part of the questionnaire had twenty-five Likert scaled statements on which the respondents were asked to provide their opinion. Likert statements were chosen because this method was adopted in the previous studies of Burton et al. (1998), Garretson et al. (2002), and Jin & Suh (2005). One of the most important decisions to take is to select the number of scale points to use in the study. There is a direct relationship between the number of scale points and the reliability score (Churchill & Iacobucci 2005, p. 283). For the current study, we followed Burton et al. (1998) and adopted a seven-point scale for the Likert statements. The scale used in the current study was from “1” meaning “strongly disagree” to “7” meaning “strongly agree”. This was also appropriate since statements for four of the constructs (private label attitude, price consciousness, value consciousness, and price-quality perception) were taken from 8 http://www.marketingpower.com/mg-dictionary-view3448.php

19
Burton et al. (1998). All the Likert scaled statements were randomized throughout the questionnaire to reduce any potential bias that could result from answering statements that represented the same concept. Lastly a check question was provided to find out if the respondents purchased private label brands regularly, not regularly, or not at all. This was asked to identify if the private label attitude depended on the frequency of purchase of private label brands. It is to be noted that the term “private label brands” was substituted with the term “store brands” to make it easier for the respondents to answer the questionnaire (see Appendix B). 4.3 The sample selection and data collection procedure
Previous academic studies have used mall-intercept survey method by providing self-administered questionnaire to the shoppers (Burton et al. 1998, Garretson et al. 2002, Jin & Suh 2005). In the study by Burton et al. (1998) and Garretson et al. (2002) the shoppers were then asked to fill-in take-home survey questionnaire and return them by a postage-paid return envelop to the researchers. However, the current study was conducted using a non-probability convenience sample due to limited finance and time-scale. This type of sample allows the researcher to basically choose who, where, and when to research and gather data. One of the disadvantages of this method is that the results may be non-representative of the entire population. However, this method is quite common in business and management research as this can ensure a high response rate whereas probability sampling involves a lot of difficulty and costs (Bryman & Bell 2003). Another departure from the previous study is that the current study specifically focuses on young Swedish consumers. The average age of the population of Umeå city is about 37 years9 . The total population of Umeå city is about 110,000 of which one-third are represented by students. The current study researches on young Swedish consumers who are most likely to be students at the university. Accordingly, for the current study we used self-administered questionnaire to students at Umeå University. For the current study this was quite justified. For data collection we first approached the lecturers who had classes during a particular week and requested them to provide us with two minutes to make a presentation to the students in their classes. All the lecturers approached agreed to this arrangement. Accordingly, we gave two-minute presentation to the students in their classes to explain who we were, what the research was about, and how the completed questionnaires were to be collected at the end of the class. The presentation was followed by distribution of the questionnaire to the class. The questionnaire already had detailed instruction as to how to provide the responses to the questions. Each of the classes were two-hour long with each having 10-15 minutes coffee break. The respondents were requested to complete the questionnaire during the coffee break or when the class ended. It should be noted that we observed a keen interest in answering the questionnaire. We distributed 202 questionnaires and we received 184 questionnaires back. This is equivalent to a response rate of approximately 91%. One of the returned questionnaires was
9 http://www.umea.se

20
incomplete and therefore 183 usable cases were obtained. A comparison of the usable cases from the previous academic studies along with the current study is provided in Table 2.
Table 2: Comparison of number of usable cases
Academic study Usable cases Burton et al. (1998) 333 Garretson et al. (2002) 300 Jin & Suh (2005) 168 Current study 183
4.4 Pre-test
The purpose of the pretest is to identify if the questionnaire is able to provide all the information as expected by the researchers (Aaker et al. 2004, p. 327). The idea is to determine if the respondents are comfortable in answering all the questions, that there are no ambiguous questions, or that the time taken to complete the questionnaire is not too long. For the current study, the questionnaire was developed by the authors. The content and the format of the questionnaire were then discussed with the supervisor. At the end of the discussion, some changes were made to the statements for WOM and retailer’s reputation. Eleven students who fit the characteristics of the intended sample for the current study were invited to answer to the questionnaire at the presence of one of the authors. During this process, all these respondents reported that they had no difficulty in answering the statements except one negatively worded statement which confused few of the respondents. Accordingly, the authors changed it to positively worded statement. A couple of the respondents provided some recommendations to improve the layout of the questionnaire. Accordingly, the questionnaire layout was modified slightly to make it more user-friendly. 4.5 Data analysis procedure
We first start with descriptive statistics for each of the twenty-five statements to describe the respondents. Next we create summated scale to develop the eight factors, under the two dimensions, to be used in subsequent data analysis. We also report the results of the reliability tests for the factors. In addition, we briefly discuss the validity of the new measurement scales developed for the current study. Regression analysis was used to investigate the relationship between private label attitude and the factors under the consumer perception dimension and reputation dimension. Regression analysis is a statistical technique that is used to relate two or more variables (Aaker et al. 2004, p. 509). The objective is to build a regression model or an equation that can be used to describe a dependent variable based on a unit of change in the independent variables. When more than one independent variable is considered in the study it is known as multiple regression analysis. This is also the main regression technique employed in the current study. Here, private label attitude is considered as the dependent variable and the factors under consumer price perception and reputation dimensions are considered independent variables. Considering the fact that we wanted to investigate the relationships discussed in Chapter 3 and shown in Figure 2, a multiple regression analysis was deemed to be appropriate.
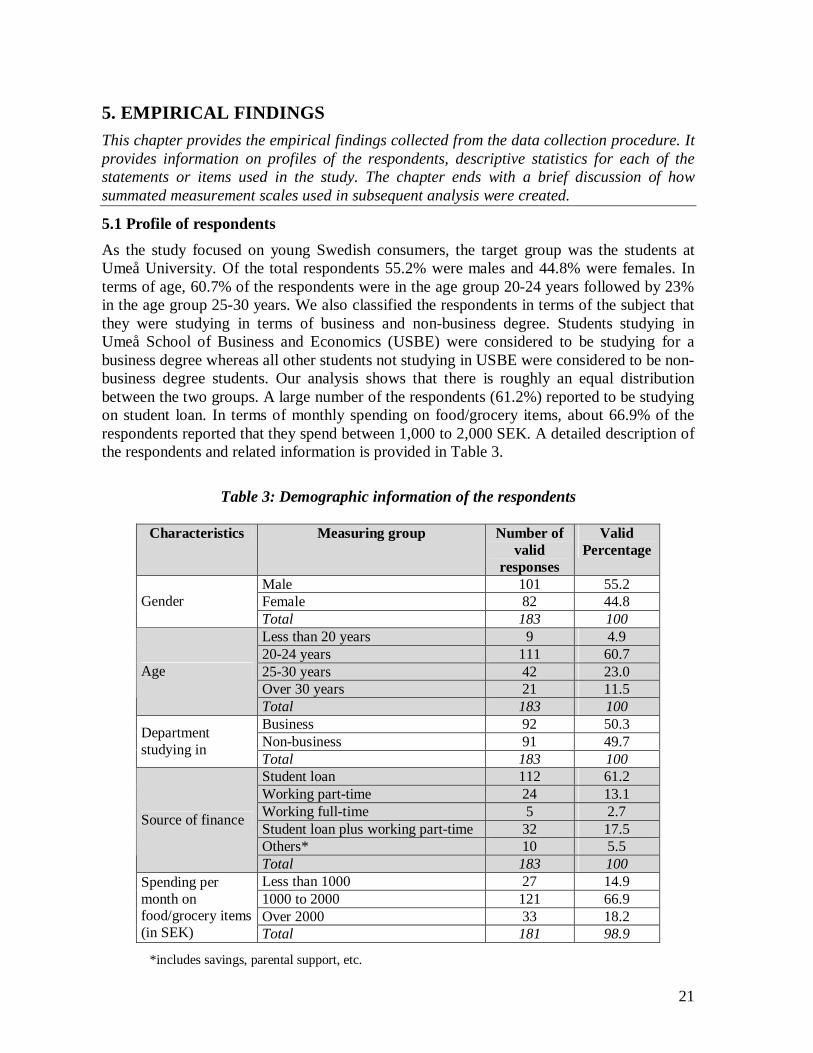
21
5. EMPIRICAL FINDINGS
This chapter provides the empirical findings collected from the data collection procedure. It provides information on profiles of the respondents, descriptive statistics for each of the statements or items used in the study. The chapter ends with a brief discussion of how summated measurement scales used in subsequent analysis were created.
5.1 Profile of respondents
As the study focused on young Swedish consumers, the target group was the students at Umeå University. Of the total respondents 55.2% were males and 44.8% were females. In terms of age, 60.7% of the respondents were in the age group 20-24 years followed by 23% in the age group 25-30 years. We also classified the respondents in terms of the subject that they were studying in terms of business and non-business degree. Students studying in Umeå School of Business and Economics (USBE) were considered to be studying for a business degree whereas all other students not studying in USBE were considered to be non-business degree students. Our analysis shows that there is roughly an equal distribution between the two groups. A large number of the respondents (61.2%) reported to be studying on student loan. In terms of monthly spending on food/grocery items, about 66.9% of the respondents reported that they spend between 1,000 to 2,000 SEK. A detailed description of the respondents and related information is provided in Table 3.
Table 3: Demographic information of the respondents
*includes savings, parental support, etc.
Characteristics Measuring group Number of valid
responses
Valid Percentage
Male 101 55.2 Female 82 44.8 Gender Total 183 100 Less than 20 years 9 4.9 20-24 years 111 60.7 25-30 years 42 23.0 Over 30 years 21 11.5
Age
Total 183 100 Business 92 50.3 Non-business 91 49.7
Department studying in
Total 183 100 Student loan 112 61.2 Working part-time 24 13.1 Working full-time 5 2.7 Student loan plus working part-time 32 17.5 Others* 10 5.5
Source of finance
Total 183 100 Less than 1000 27 14.9 1000 to 2000 121 66.9 Over 2000 33 18.2
Spending per month on food/grocery items (in SEK) Total 181 98.9

22
5.2 Descriptive statistics
The mean and standard deviation were calculated for all the interval scaled items. These are reported in Table 4 along with the skewness and kurtosis of these items. The overall results indicate a good dispersion of the results. The means of twenty-five statements ranged from 3.15 to 5.44 with standard deviation ranging from 1.18 to 1.89. As can be observed from the Table 4, private label attitude is generally neutral or below. The four items under private label attitude have a mean range from 4.52 to 3.15. Other factors also have mean values which are neutral or below except for value consciousness factor. All the items under value consciousness have values greater than 4.0 which is the neutral value. This suggests that respondents are very much value conscious and looking for quality brands. That is, they will only buy a brand if it meets the minimum quality that they are looking for.
Table 4: Descriptives of the interval scaled items
Factors Items Mean Standard deviation Skewness Kurtosis
When I buy a private label brand, I always feel that I am getting a good deal.
4.02 1.26 -0.32 -0.05
Buying private label brands makes me feel good. 3.15 1.53 0.13 -0.56 In general, private label brands are poor quality products.*
4.52 1.41 -0.07 -0.46
Private label
attitude
I prefer store brands over other brands. 3.38 1.38 0.26 -0.15 Generally speaking, the higher the price of a product, the higher the quality.
4.61 1.43 -0.57 -0.29
The price of a product is a good indicator of its quality.
4.31 1.39 -0.51 -0.09
I believe in the statement that “you get what you pay for”.
4.79 1.35 -0.57 -0.05
Price-quality association
You always have to pay a bit more to get a better brand.
4.83 1.46 -0.80 0.25
I am very concerned about low prices, but I am equally concerned about product quality.
5.22 1.55 -0.79 0.67
I generally shop around for lower prices on products, but they still must meet quality requirements before I buy them.
4.70 1.65 -0.50 -0.60
When grocery shopping, I compare the prices of different brands to be sure I get the best value for the money.
5.09 1.46 -0.66 -0.21
Value Consciousness
When I buy products, I like to be sure that I am getting my money’s worth.
5.44 1.18 -0.50 -0.13
I will grocery shop at more than one store to take advantage of low prices
3.58 1.89 0.27 -1.05
The time it takes to find low prices is usually not worth the effort.*
3.92 1.62 -0.05 -0.76
The money saved by finding low prices is usually worth the time and effort.
3.96 1.57 0.02 -0.65
Price Consciousness
I am not willing to go to extra effort to find lower prices.*
4.44 1.52 -0.09 -0.68

23
Factors Items Mean Standard deviation Skewness Kurtosis
The more well-known retailers are, the higher is the quality of the store brands.
4.02 1.49 -0.19 -0.82
I will only buy private label brands from a retailer whom I trust.
4.51 1.46 -0.17 -0.78
If the retailer is well-known, then I buy its private label brand.
4.37 1.35 -0.26 -0.02
Retailer’s reputation
A retailer’s reputation is an important factor in choosing between different stores’ brands.
4.66 1.37 -0.36 -0.01
Quality, price or reputation of store brands are a topic of discussion among my friends 3.45 1.51 0.27 -0.51
Existence of WOM My friends seldom comment on the value of
store brands.* 3.68 1.55 0.03 -0.64
I buy private label brands because of my friends’ recommendations
3.34 1.62 0.00 -1.21 Positive WOM
I generally receive good recommendations about store brands.
3.73 1.35 -0.37 -0.19
Negative WOM I have heard comments about private label brands’ poor quality.
4.63 1.63 -0.53 -0.43
*items that were reverse coded. 5.3 Creation of summated measurement scales
A summated scale is formed by combining several individual items or statements into a single composite measure (Hair et al. 1998). Hair et al. (1998) further notes that a major benefit of summated scale is that it can be used to represent the multiple aspects of a concept in a single measure.
In the current study, the items or variables for each of the factor were used to create composite scores for each of the factor. This was achieved by calculating the average or mean of all the items under a particular factor. SPSS creates a new value for each of the eight factors for each respondent. These new values for the factors were then used in further analysis.

24
6. ANALYSIS OF DATA
This chapter starts by checking for missing values, outliers, and normality. These tests will be followed by reliability test for the factors being investigated. This is followed by a brief discussion of the validity of the new measures created for the study. The factors are then used to compare against the demographic variables. The chapter ends with multiple regression analysis with the objective to develop a regression equation for attitude toward private label brands and discussion of the results.
6.1 Preliminary Data Analysis
6.1.1 Missing value In total 183 retained questionnaires, 161 of them are completely answered. There are 22 questionnaires missing values, among which totally 29 values are missed, 2 nominal-scaled value and 27 internal-scaled value. Most items miss 1 or 2 values, and the highest number of missing value in one item is 5. In Table 5, the number of missing value, type of items with missing value and percentage of missing value have been summarized.
Table 5: No. of missing value and percentage
No. of Missing Value
Type of items with Missing Value
No. of Items with Missing Value
Percentage of Missing Value
1 Interval-scaled 9 4.5% Nominal-scaled 2 2.2%
2 Interval-scaled 2 2.2%
3 Interval-scaled 1 1.6% 4 Interval-scaled 1 2.2% 5 Interval-scaled 1 2.7%
Table 5 shows the percentages of the missing value are comparatively small. To handle the 14 missing interval-scales value, a simple and efficient method is by using Pairwise Option (in SPSS) unless the missing data is required for the specific analysis (Pallant 2005, p. 52). In this study, the single item (subset) contributes to a big factor (full set), so there is little need to use those single items as the analyzed objective. Therefore, all the items with missing value are excluded when they are reproduced to make the factor analysis. 6.1.2 Outliers
It is important to check for any outliers in the data set since these can affect the subsequent analysis and provide spurious relationship (Hair et al. 1998). Outliers can be detected from univariate and multivariate perspectives. In the univariate perspective, outliers are detected by examining the distribution of observations and selecting cases which fall at the outer ranges of the distribution (Hair et al. 1998). In the current study, we examined the Boxplot, extreme values, and 5% trimmed mean to identify if there are any univariate outliers for the twenty-five interval scaled variables used in the question. In the Boxplot analysis, SPSS identifies any outliers that do not fall in the normal range of responses. Extreme values report the five top and bottom responses for each variable. This allows the researchers to check for any unusual entry for the variables. 5% trimmed mean method is reported by

25
SPSS where the mean is recalculated by removing the top and bottom five responses. If the trimmed mean deviates too much from the calculated mean, outlier is said to exist. Boxplot analysis revealed that item “if the retailer is well-known, then I buy its store brands” had three outliers and item “when I buy products, I like to be sure that I am getting my money’s worth” had two outliers. However, an examination of extreme values showed that none of these values could be considered as an outlier because they were within the required range. An examination for the 5% trimmed mean also revealed that this value did not deviate too much from the overall mean calculated for the item. Maximum deviation found was 0.1% for only one item. This suggested that no significant outlier existed. Multivariate detection of outliers is conducted through calculating Mahalanobis Distance or Mahalanobis D2. This is a measure of the distance in multidimensional space of each observation from the mean center of the observation (Hair et al. 1998). It is suggested that a significance level of detecting outliers using Mahalanobis D2 be very conservative, such as 0.001 (Hair et al. 1998, p. 66). In the current study, only three cases were identified as having significance level below 0.001. This can be expected in sample size of 183. Hair et al. (1998) argues that unless there are demonstrable proofs that the outliers are not part of the observation of the population they should not be removed. Since this was not the case, all these values were therefore retained for subsequent analysis. 6.1.3 Normality
Normality assumption is vital for multiple regression analysis and if this is not met then the subsequent result could be invalid (Hair et al. 1998). In the current study, we checked for normality by comparing the skewness and kurtosis of the interval scaled items. Zebal (2003, p. 143) noted that items can be considered having normal distribution if the skewness and kurtosis falls between ±3. As can be seen from Table 4, no item fell outside this range. Therefore, it was determined that all items had normal distribution. Moreover, an examination of the Normal Q-Q plot suggested that all the variables are normally distributed. 6.2 Advanced data analysis
In this section we first examine the reliability of the factors under consideration to determine if all the variables will be retained for subsequent analysis. This is then followed by tests of various factors with respect to the demographic variables. Multiple regression analysis is then carried out with the objective of testing the proposed model for the current study developed in Chapter 3 and shown in Figure 2. 6.2.1 Reliability tests
Reliability refers to the extent to which a scale produces consistent results if repeated measurements are made (Malhotra 2004). Cronbach’s alpha (or coefficient alpha) is the most commonly used measure to judge the internal reliability of factors or constructs (Bryman & Bell 2003). The results of the reliability test are given in Table 6 below.

26
Table 6: Results of reliability tests
Factors Items Cronbach’s alpha
When I buy a private label brand, I always feel that I am getting a good deal. Buying private label brands makes me feel good. In general, private label brands are poor quality products.*
Private label
attitude I prefer store brands over other brands.
0.60
Generally speaking, the higher the price of a product, the higher the quality. The price of a product is a good indicator of its quality. I believe in the statement that "you get what you pay for".
Price-quality association
You always have to pay a bit more to get a better brand.
0.77
I am very concerned about low prices, but I am equally concerned about product quality. I generally shop around for lower prices on products, but they still must meet quality requirements before I buy them. When grocery shopping, I compare the prices of different brands to be sure I get the best value for the money.
Value Consciousness
When I buy products, I like to be sure that I am getting my money’s worth.
0.69
I will grocery shop at more than one store to take advantage of low prices The time it takes to find low prices is usually not worth the effort.* The money saved by finding low prices is usually worth the time and effort.
Price Consciousness
I am not willing to go to extra effort to find lower prices.*
0.75
The more well-known retailers are, the higher is the quality of the store brands. I will only buy private label brands from a retailer whom I trust. If the retailer is well-known, then I buy its private label brand.
Retailer’s reputation
A retailer’s reputation is an important factor in choosing between different stores’ brands.
0.67
Quality, price or reputation of store brands are a topic of discussion among my friends
Existence of WOM
My friends seldom comment on the value of store brands.* 0.52
I buy private label brands because of my friends’ recommendations Positive WOM I generally receive good recommendations about store brands.
0.53
Negative WOM
I have heard comments about private label brands’ poor quality. _
*items that were reverse coded. The Cronbach’s alpha generally varies from 1 to 0 and a value of 0.60 or above is normally regarded as satisfactory for internal reliability (Malhotra 2004, p. 268). The reliability tests show that all the constructs except existence of WOM and positive WOM are at or above this cut-off point. This could be because these constructs have too few items in each of them. In the current study, we have decided to keep this two constructs despite having Cronbach’s alpha level less than the cut-off point. The level of Cronbach’s alpha is not too

27
low to warrant omitting them from further analysis. Also, these two measures have not been tested before and therefore it was considered to be of interest to investigate them further. 6.2.2 Validity of the new measures
A measurement scale has validity if it measures what it is supposed to measure (Aaker et al. 2004). Bryman & Bell (2003) argue that at a minimum, a researcher should establish that new measures developed have face validity. Face validity is invoked when it can be argued that the measurement scale apparently reflects the content of the concept it is trying to measure (Bryman & Bell 2003, Aaker et al. 2004). Section 4.1 in Chapter 4 provides a detailed description of how the new measures for retailer’s reputation, existence of WOM, positive WOM, and negative WOM were developed. In addition, pre-test results indicated that the measures were sufficiently well defined for the respondents to distinguish among the various concepts. We, therefore, believe that at a minimum face validity for the newer measurement scales was established. 6.2.3 Examining differences in means for demographic variables
This section provides descriptive statistics for the factors under the consumer price perception dimension (i.e. value consciousness, price consciousness, and price-quality perceptions) and reputation dimension (i.e. retailer’s reputation, existence of WOM, positive WOM and negative WOM) against all the demographic variables. All differences in mean values identified in the analysis are also tested using independent samples t-tests and one-way ANOVA tests. The objective was to identify if the differences in the mean values are significant. Independent samples t-test is employed to compare between mean values of two different groups. This test was employed for “gender” and “department studying in” variables. One-way ANOVA test is employed to compare mean values among more than two groups. This test was employed for “age group”, “financing sources”, and “spending per month (SEK)” variables. All results are presented in Tables 7 to 16 and Figures 3 to 12. 6.2.3.1 Gender
It can be observed from Table 7 and Figure 3 that females have higher mean value for value consciousness compared to males. The means for price consciousness and price-quality association are higher for males than females.
Table 7: Mean values of consumer price perception dimension factors according to gender
Gender Price-quality association
Value consciousness
Price consciousness
Male 4.70 4.95 4.00 Female 4.56 5.34 3.95

28
3Figure 3: Comparison of consumer price perception dimension factors according to gender
FemaleMale
X1: Gender
6
5
4
3
2
1
0
Mean
Total priceconsciouness
Total valueconsciouness
Total price-qualityassociation
Table 8 and Figure 4, below, show a comparison of means of reputation dimension factors according to gender. It can be observed that males had higher mean scores compared to females on all factors under the reputation dimension.
Table 8: Mean values of reputation dimension factors according to gender
Gender Retailer’s reputation
Existence of WOM
Positive WOM
Negative WOM
Male 4.44 3.58 3.61 4.71 Female 4.37 3.54 3.41 4.52
4Figure 4: Comparison of reputation dimension factors according to gender
FemaleMale
Gender
5
4
3
2
1
0
Mea
n
Negative WOM
Positive WOM
Existence ofWOM
Retailer'sreputation

29
The independent samples t-test involved examining any differences of means between males and females with regard to the factors under the consumer perceptual and reputation dimensions using. All results were found to be non-significant except for value consciousness. Females were found to be more value conscious than males (p<0.01). The mean for females was 5.34 compared to the mean for females which was 4.95. 6.2.3.2 Age group
It can be observed from Table 9 and Figure 5 that all the age groups have high means for value consciousness. The age group “less than 20 years” had higher means for price and value conscious than other age groups.
Table 9: Mean values of consumer price perception dimension factors according to age groups
Age groups Price-quality association
Value consciousness
Price consciousness
Less than 20 years 4.50 5.75 4.97 20-24 years 4.64 5.14 4.04 25-30 years 4.71 5.10 3.75 Over 30 years 4.51 4.83 3.69
5Figure 5: Comparison of consumer price perception dimension factors according to age groups
Over 30 years25-30 years20-24 yearsLess than 20years
Age Group
6
5
4
3
2
1
0
Mea
n
Total priceconsciouness
Total valueconsciouness
Total price-qualityassociation
Table 10 and Figure 6, below, show that age group “less than 20 years” are less affected by retailer’s reputation when buying private label brands compared to the other age groups. However, this group shows higher mean values for existence of WOM, positive WOM, and
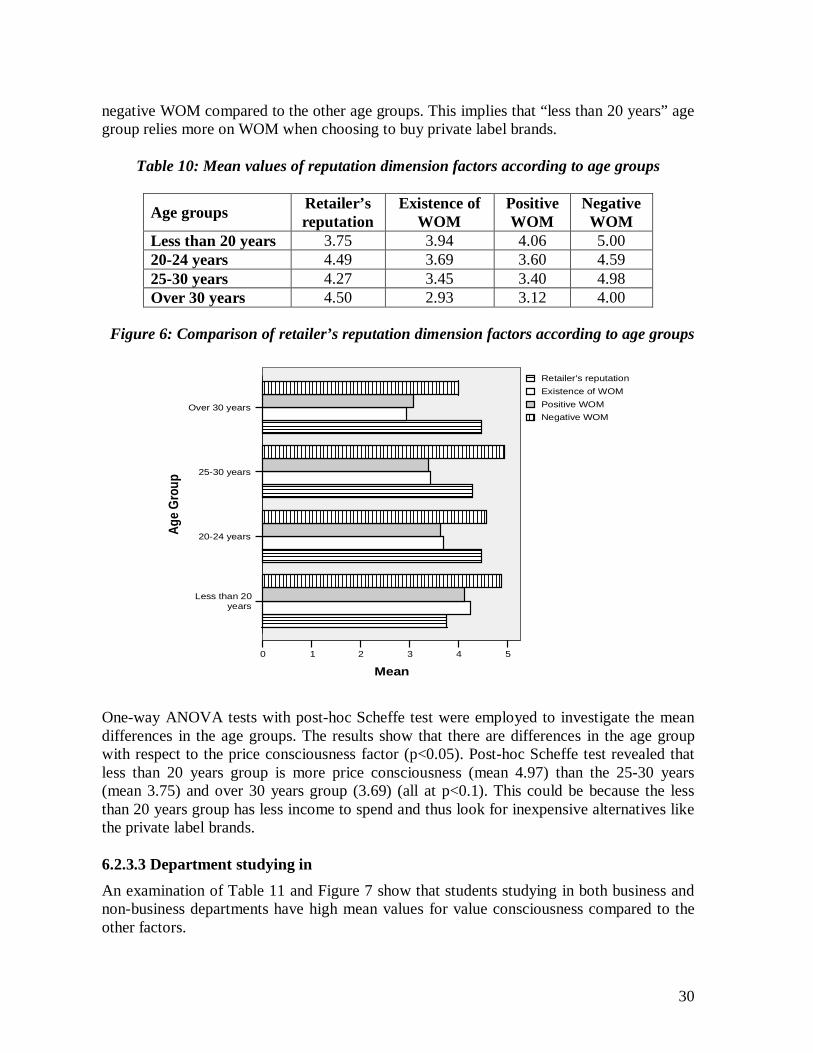
30
negative WOM compared to the other age groups. This implies that “less than 20 years” age group relies more on WOM when choosing to buy private label brands.
Table 10: Mean values of reputation dimension factors according to age groups
Age groups Retailer’s reputation
Existence of WOM
Positive WOM
Negative WOM
Less than 20 years 3.75 3.94 4.06 5.00 20-24 years 4.49 3.69 3.60 4.59 25-30 years 4.27 3.45 3.40 4.98 Over 30 years 4.50 2.93 3.12 4.00
6Figure 6: Comparison of retailer’s reputation dimension factors according to age groups
Over 30 years
25-30 years
20-24 years
Less than 20years
Age
Gro
up
543210
Mean
Negative WOM
Positive WOM
Existence of WOM
Retailer's reputation
One-way ANOVA tests with post-hoc Scheffe test were employed to investigate the mean differences in the age groups. The results show that there are differences in the age group with respect to the price consciousness factor (p<0.05). Post-hoc Scheffe test revealed that less than 20 years group is more price consciousness (mean 4.97) than the 25-30 years (mean 3.75) and over 30 years group (3.69) (all at p<0.1). This could be because the less than 20 years group has less income to spend and thus look for inexpensive alternatives like the private label brands. 6.2.3.3 Department studying in
An examination of Table 11 and Figure 7 show that students studying in both business and non-business departments have high mean values for value consciousness compared to the other factors.

31
Table 11: Mean values of consumer price perception dimension factors according to department studying in
Department Studying in
Price-quality association
Value consciousness
Price consciousness
Business 4.68 5.08 3.95 Non-business 4.59 5.17 4.01
7Figure 7: Comparison of consumer price perception dimension factors according to department
studying in
Non-businessBusiness
Department Studying In
6
5
4
3
2
1
0
Mea
n
Total priceconsciouness
Total valueconsciouness
Total price-qualityassociation
Table 12 and Figure 8 show that among the all the factors under the reputation dimension, the mean value of negative WOM is higher for non-business students compared to the business students. All other factors are approximately same.
Table 12: Mean values of retailer’s reputation dimension factors according to department studying in
Department Studying in
Retailer’s reputation
Existence of WOM
Positive WOM
Negative WOM
Business 4.49 3.54 3.53 4.36 Non-business 4.33 3.59 3.51 4.90
Mean differences for respondents studying in different departments was conducted using independent samples t-test. All results were found to be non-significant except for the effect of negative WOM. The results showed that business students were less affected by negative WOM (mean of 4.36) compared to the non-business students (mean of 4.90) (p<0.05).

32
8Figure 8: Comparison of retailer’s reputation dimension factors according to department studying in
Non-businessBusiness
Department Studying In
5
4
3
2
1
0
Mea
n
Negative WOM
Positive WOM
Existence of WOM
Retailer'sreputation
6.2.3.4 Financing sources
It can be observed from Table 13 and Figure 9, that the mean values for value consciousness had higher values for all different financing groups. It is interesting to note that regardless of financing sources, the mean values for price consciousness were low for all groups.
Table 13: Mean values of consumer price perception dimension factors according to
financing sources
Source of financing
Price-quality association
Value consciousness
Price consciousness
Student loan 4.58 5.15 3.96 Working part-time 4.65 5.08 3.88 Working full-time 4.45 5.05 3.70 Student loan plus working part-time
4.84 5.19 3.95
Others 4.65 4.78 4.63

33
9Figure 9: Comparison of consumer price perception dimension factors according to financing sources
Others
Student loanplus part-time
Working full-time
Working part-time
Student loan
Fin
anci
ng
So
urc
es
6543210
Mean
Total priceconsciouness
Total valueconsciouness
Total price-qualityassociation
An examination of Table 14 and Figure 10 show that there are lower than average mean values for existence of WOM across all types of source of financing groups. However, means for negative WOM was higher than other factors under the reputation dimension. Table 14: Mean values of retailer’s reputation dimension factors according to financing sources
Source of financing
Retailer’s reputation
Existence of WOM
Positive WOM
Negative WOM
Student loan 4.45 3.48 3.55 4.59 Working part-time 4.23 3.77 3.44 4.29 Working full-time 4.10 3.40 4.40 5.60 Student loan plus working part-time
4.43 3.78 3.41 4.91
Others 4.47 3.40 3.22 4.50 One-way ANOVA tests revealed that all the mean differences for all factors for different financing sources were insignificant. Thus, it can be concluded that respondents are not affected by different financing sources when choosing private label brands.

34
10Figure 10: Comparison of retailer’s reputation dimension factors according to department studying in
Others
Student loan pluspart-time
Working full-time
Working part-time
Student loan
Fin
anci
ng
So
urc
es
6543210
Mean
Negative WOM
Positive WOM
Existence of WOM
Retailer's reputation
6.2.3.5 Spending per month (in SEK)
Table 15 and Figure 11 show that groups that spend lower amounts of money on grocery/food items tend to be more value conscious and less price consciousness. This is expected as people with more money to spend are more likely to be less concerned about price and put more emphasis on searching for and purchasing brands they deem as having better quality.
Table 15: Mean values of consumer price perception dimension factors according to spending per month (in SEK)
Spending per month (in SEK)
Price-quality association
Value consciousness
Price consciousness
Less than 1000 4.65 5.60 4.69 1000 to 2000 4.55 5.05 3.88 Over 2000 4.96 4.98 3.75

35
11Figure 11: Comparison of consumer price perception dimension factors according to spending per month (in SEK)
Above 20001000 to 2000Less than 1000
Spending per month (SEK)
6
5
4
3
2
1
0
Mea
n
Total priceconsciouness
Total valueconsciouness
Total price-qualityassociation
From Table 16 and Figure 12, it can be observed that all spending groups have more mean values for retailer’s reputation and negative WOM compared to existence of WOM and positive WOM. This implies that respondents in the study are more affected by reputation of the retailers and the negative WOM that they receive regarding private label brands.
Table 16: Mean values of consumer price perception dimension factors according to spending per month (in SEK)
Spending per month (in SEK)
Retailer’s reputation
Existence of WOM
Positive WOM
Negative WOM
Less than 1000 4.45 3.48 3.74 4.78 1000 to 2000 4.37 3.55 3.47 4.57 Over 2000 4.54 3.75 3.62 4.73

36
12Figure 12: Comparison of retailer’s reputation dimension factors according to spending per month (in SEK)
Above 20001000 to 2000Less than 1000
Spending per month (SEK)
5
4
3
2
1
0
Mea
n
Negative WOM
Positive WOM
Existence of WOM
Retailer'sreputation
One-way ANOVA tests for mean differences across the three spending categories for all factors showed that only price consciousness and value consciousness are significant (at p<0.01 and p<0.05 respectively). Further analysis using post-hoc Scheffe test revealed that the mean differences for price consciousness between the respondents who spend less than 1000 SEK per month on food items was significantly different from the other two groups (p<0.05). Specifically, less than 1000 SEK group tended to be more price consciousness than the other spending groups. For value consciousness, post-hoc Scheffe test revealed that mean differences between the respondents who spend less than 1000 SEK per month on food items was significantly different from the group spending between 1000 to 2000 SEK at 5% significance level and from group spending over 2000 SEK at 10% significance level. These results are summarized in Tables 17 and 18. Table 17: One-way ANOVA results for value consciousness and price consciousness for
three different spending groups
Sum of Squares
df Mean Square
F Sig.
Between Groups 7.550 2 3.775 3.488 .033** Within Groups 190.489 176 1.082
Value consciousness
Total 198.040 178 Between Groups 16.369 2 8.185 5.511 .005* Within Groups 259.916 175 1.485
Price consciousness
Total 276.285 177 * p<0.01, ** p<0.05

37
Table 18: Post-hoc Scheffe test results for value consciousness and price consciousness for three different spending groups
Dependent Variable
(I) Spending per month
(SEK)
(J) Spending per month
(SEK)
Mean Difference
(I-J) Std. Error Sig.
Less than 1000 1000 to 2000 .554 .222 .046* Above 2000 .625 .272 .074 1000 to 2000 Less than 1000 -.554 .222 .046* Above 2000 .071 .207 .942 Above 2000 Less than 1000 -.625 .272 .074**
Value consciousness
1000 to 2000 -.071 .207 .942 Less than 1000 1000 to 2000 .806 .260 .009* Above 2000 .935 .316 .014* 1000 to 2000 Less than 1000 -.806 .260 .009* Above 2000 .129 .240 .865 Above 2000 Less than 1000 -.935 .316 .014*
Price consciousness
1000 to 2000 -.129 .240 .865 * p<0.05, ** p<0.10
6.2.4 Private label brand purchase proneness One of the question in the questionnaire was to find out if the respondents purchase private label brands regularly, buys them but not always, or does not buy them at all. Table 19 shows the number of respondents in each category.
Table 19: Frequency of private label brands purchase
Frequency Percent Valid
Percent Valid Yes, regularly 52 28.4 28.7 Yes, but not always 126 68.9 69.6 Not at all 3 1.6 1.7 Total 181 98.9 100.0 Missing 2 1.1 Total 183 100.0
As can be seen from Table 19, majority of the respondents replied that they do buy private label brands but not always. This could imply low brand loyalty on the part of the consumer and that the retailers need to set some strategies to attract and keep these consumers. Cross tabulation results showed that none of the demographic variables (i.e. gender, age group, department studying in, source of finance, and spending per month) had any influence on the frequency of private label brand purchase.

38
6.2.5 Multiple regression analysis
In the current study, private label attitude construct was taken as the dependent variable with the other seven constructs as the independent variables. The results of the multiple regression analysis are shown in Table 20.
Table 20: Results of multiple regression analysis
Model summary Analysis of variance R 0.599 R2 0.359
Sum of square
df Mean square F ratio Sig.
Adjusted R2 0.331 Regression 54.48 7 7.78 13.102 .000* Std. error of estimate 0.771
Residual 97.41 164 0.59
Variables in equation
Regression coefficients B
Standardized coefficients β
t-value Sig.
Constant 2.975 7.010 .000* Price-quality association -0.012 -0.014 -0.207 .836 Value Consciousness -0.111 0.124 -1.666 .098** Price Consciousness 0.103 0.137 1.813 .072** Retailers’ reputation 0.316 0.337 4.929 .000* Existence of WOM -0.073 -0.098 -1.423 .157 Positive WOM 0.247 0.321 4.627 .000* Negative WOM -0.216 -0.372 -5.640 .000*
Note: *p<0.01, **p<0.10 Dependent variable: private label attitude. N = 183 As shown in Table 20, the strength of the relationship, R, is given as 0.599. The R2 shows how much of the variation in private label brand attitude can be explained by the model. As shown the independent variables can explain 36% of the variation in the private label attitude. This result is statistically significant (F ratio 13.102, p<0.01). As shown in Table 20, the constant for the model is 2.975 and it is statistically significant (p<0.01). Among the independent variables in the model, the coefficients of retailer’s reputation, positive WOM, and negative WOM are statistically significant at 1% significance level. The coefficients of variables value consciousness and price consciousness are also statistically significant at 10% level. The coefficients of price-quality association and existence of WOM are not statistically significant. Thus, given the results of the multiple regression analysis, the following equation can be derived (shown in the next page).

39
YPLA = 2.975 – 0.111XVC + 0.103XPC + 0.316XRR + 0.247XPWOM – 0.216XNWOM Where,
YPLA = the level of private label attitude XVC = the level of value consciousness XPC = the level of price consciousness XRR = the level of retailer’s reputation XPWOM = the level of positive WOM XNWOM = the level of negative WOM
The multiple regression equation indicates that when there is one unit increase in the level of value consciousness there is a decrease in the level of private label attitude by 0.111 unit when other factors are held constant. Similarly, a unit increase in the level of price consciousness will lead to an increase in the level of private label attitude by 0.103 unit when other factors are held constant. These two factors represent the consumer price perception dimension. Regarding the factors under reputation dimension, the regression equation indicates one unit increase in the level of retailer’s reputation will lead to an increase in the level of private label attitude by 0.316 unit when other factors are held constant. Similarly, a unit increase in the level of positive WOM will lead to an increase in the level of private label attitude by 0.247 unit when other factors are held constant. Also, a unit increase in the level of negative WOM will lead to a decrease in the level of private label attitude by 0.216 unit when other factors are held constant. The relative influence of each of the independent variable can be observed by looking at the standardized coefficients β. From Table 20, it can be observed that negative WOM seem to have the highest influence on private label attitude. This is followed by retailer’s reputation and positive WOM. Interestingly, value consciousness and price consciousness factors were found to have lower effect than these factors. The implications of these results are discussed in section 6.2.5.1. It should be noted here that the multiple regression analysis in SPSS also checks if there is any multicollinearity among the independent variables. It is normally reported by Tolerance figure under the output labeled Coefficients. Tolerance is an indicator of how much of the variability of the specified independent variable is not explained by the other independent variables in the model and is calculated as 1- R2 for each independent variable (Pallant 2005). A tolerance level less than 0.10 indicates that multiple correlation with other variables is high, suggesting the existence of multicollinearity. In the current model, the tolerance level reported for the independent variables ranged from 0.689 to 0.898. Thus, it was concluded that multicollinearity assumption was not violated in the current study. 6.2.5.1 Discussion of results of multiple regression analysis
The results show that the level of private label attitude is negatively related to value consciousness contrary to the expected direction. Previous academic studies have reported positive relationship between value consciousness and private label attitude (Burton et al. 1998, Garretson et al. 2002, Jin & Suh 2005). The negative relationship in the current study

40
could be because the respondents do not consider private label brands as providing them with value for money for the given quality. Young Swedish consumers probably look for better and well-known brands that have higher quality. This is also evident from Table 4, where the mean values for the statements under value consciousness were very high. This implies that young Swedish consumers who are value conscious are very much concerned with quality of the brands that they purchase which can result in negative attitude toward the private label brands. The level of private label attitude is found to be positively related to price consciousness. This is expected as consumers who are price conscious would have favorable attitude toward private label brands as these brands are traditionally sold at a lower price than the other brands. This result is consistent with Burton et al. (1998) finding. Our analysis further shows that there is a positive relationship between retailer’s reputation and the level of private label attitude. This implies that young Swedish consumers would buy private label brands from retailers whom they trust. As expected the regression results show that positive WOM have positive influence and negative WOM have negative influence on attitude toward private label brands. This implies that positive reviews about private label brands can significantly contribute to positive attitude toward private label brands whereas negative reviews can do the opposite. Previous academic studies have found that negative relationship exists between attitude toward private label brands and price-quality association (Burton et al. 1998, Garretson et al. 2002). However, in the current study the price-quality association was not found to be a predictor for the level of private label attitude. This could imply that the young Swedish consumers do not judge the quality of the private label brands from their price and thus there is no impact on the attitude toward private label brands from the price-quality association factor. Furthermore, our study was conducted for all private label brands in general and it may be possible that differences in product categories could have a moderating effect between attitude toward private label brands and price-quality association. In other words, price-quality association may emerge as an important factor if the different product categories are considered. The other factor that was not found to be a predictor of the level of private label attitude is the existence of WOM. However, positive WOM and negative WOM have impact on private label attitude. This implies that mere existence of WOM is not enough to form attitude toward private label brands. The WOM has to either positive or negative with positive WOM the desirable one as it can have positive impact on private label attitude. The fact that both value consciousness and price consciousness factors had lower effect than retailer’s reputation, positive WOM, and negative WOM implies that young Swedish consumers are mostly affected by where they do their grocery shopping more than trying to save money. This could mean that they are more concerned with the quality of the brands that they purchase. Since price-quality association was found to be non-significant, this could further mean that in the minds of the young Swedish consumers, quality is a stand-alone concept and that they do not associate it with the price of the brand. This conclusion is also consistent with the results described in Table 4, which showed that the mean values for items under value consciousness factor were higher than other items under consideration.

41
7. CONCLUSIONS AND MANAGERIAL IMPLICATIONS The first part of this chapter provides the results of the major findings in this study. It is then followed by comments on managerial implications for the retailers trying to attract the young Swedish consumers. The objective of the study was to determine the effect of consumer price perception dimension and reputation dimension on attitude toward private label brands among young Swedish consumers. The consumer price perception dimension includes price consciousness, value consciousness, and price-quality association factors. These are the factors that have been investigated in previous academic studies (Burton et al. 1998, Garretson et al. 2002, Jin & Suh 2005). However, the reputation dimension has not been investigated before. Reputation dimension includes retailer’s reputation, existence of WOM, positive WOM, and negative WOM. Thus, the objective of the current study is to investigate the relationship between these factors and attitude toward private label brands. Questionnaire developed consisted of twenty-five Likert statements that ranged from 1 (strongly disagree) to 7 (strongly agree). It was administered to students at Umeå University. Students were chosen for this study as the focus is on young Swedish consumers. The results show that females are more value conscious compared to males, business students were less affected by negative WOM compared to non-business students. With respect to age, respondents who are less than 20 years old were found to be more price conscious presumably because this group have lower amount of money to spend. Also respondents with lower spending on food items were found to be more price conscious and value conscious than respondents who are high spenders. In addition, the frequency of private label brands was not found to be related to any of the demographic variables considered in the study. Next multiple regression analysis was conducted by taking private label attitude as the dependent variable and the other seven constructs (i.e. price-quality association, value consciousness, price consciousness, retailers’ reputation, existence of WOM, positive WOM, negative WOM) as the independent variables. The result of this multiple regression analysis show that retailer’s reputation, positive WOM, and price consciousness positively influenced attitude toward private label brands, whereas negative WOM and value consciousness negatively influenced attitude toward private label brands among young Swedish consumers. Moreover, the negative WOM seemed to have the highest influence on attitude toward private label brands among young Swedish consumers. The study established that reputation dimension is an important factor along with the consumer price perception dimension that can affect attitude toward private label brands. More specifically, retailer’s reputation, positive WOM, and negative WOM can influence attitude toward private label brands. In fact, these three factors were found to have more impact on attitude toward private label brands than the factors under the consumer price perception dimension.

42
There are several implications for the retailers who are willing to target the younger generation in Sweden. First, the study finds that WOM can be an important instrument in developing attitude toward private label brands among young Swedish consumers. Specifically, positive WOM can influence attitude toward private label brands in a positive way and negative WOM can influence in negative way. This implies that retailers should engage in generating positive reviews about their private label brands and at the same time counter any negative perception of their private label brands. They could accomplish this through in-store promotions and advertising satisfied consumers who have used the private label brands. Another factor that was found to be important is the retailer’s reputation. Retailer’s reputation was found to be positively associated with private label attitude. Retailers should, therefore, focus on developing their names and service quality as a way to increase their reputation. They could also offer more flexible guarantee and refund policy for all brands they sell. They should also tie their retail company name with the names of the private label brands. This implies that retail managers should manage the name of the retail shop and the private label brand as part of a single brand portfolio. Our results showed that young Swedish consumers tend to be value consciousness and price consciousness. The results showed that value conscious consumers had a negative attitude toward private label brands. This seems to stem from the fact that value conscious consumers do not consider private label brands as providing value for money. Thus, the retailers should engage in promotional activities to promote their private label brands as providing value for money. Since price consciousness was found to another factor important for young Swedish consumers, it is suggested that retailers focus on keeping the prices of private label brands low while focusing on increased promotional activities.

43
8. LIMITATIONS AND SUGGESTIONS FOR FUTURE RESEARCH This chapter discusses the limitations of the current study. It is then followed by suggestions of future research areas that could be investigated by other researchers.
The current study focuses on the young Swedish consumers. Therefore, the results cannot be generalized to other age groups and different income levels. Further research could shed light on how consumer price perception and reputation dimension affect the average Swedish households with different income levels. As mentioned earlier, the current study does not consider the effect of product categories on attitude toward private label brands. Differences in product categories have been found to affect the purchase behavior of private label brands (Sinha & Batra 1999, Batra & Sinha 2000, Chen 2005). Future research could expand the current research across product categories to investigate whether consumer price perception and reputation dimensions will have the same influence on attitude toward private label brands as found in the current study. Another area that has not been investigated is the influence of each of the factors on other factors. For example, reputation dimension factors could have an impact on the factors under the consumer price perception dimension. Consumers who are value or price consciousness could rely on WOM to develop attitude toward private label brands. Further research are needed to see whether each of the factors considered the study affect other factors and in what way.
In addition to the consumer price perception dimension, Burton et al. (1998) has identified marketing construct and deal proneness construct which can also affect attitude toward private label brands. These construct have been briefly mentioned in Chapter 1. Future research could expand the current study to include these two constructs. The multiple regression analysis results indicated that 36% of the variability in the level of private label attitude could be explained. Therefore, it is possible that inclusion of marketing construct and deal proneness construct could further explain any variability in the level of private label attitude.
Also some measures in this study could be improved further. The Cronbach’s alpha values for existence of WOM and positive WOM factors were relatively low. Therefore, future research could investigate how these two factors could be improved. In addition, more items could be included to test all of the newer variables introduced in the study.

44
LIST OF REFERENCES Book References
Aaker, D. A., Kumar, V., & Day, G. S. (2004). Marketing Research, 8th ed. United States of America: John Wiley & Sons.
Bryman, A. & Bell, E. (2003). Business Research Methods, Hampshire: Oxford University Press.
Churchill, G. A. & Iacobucci, D. (2005). Marketing Research: Methodological Foundation, 9th ed. United States of America: South-Western.
Fazio, R. H. (1989). On the power and functionality of attitudes: The role of attitude accessibility. In A. R. Pratkanis, S. J. Breckler, & A. G. Greenwald (Eds.), Attitude structure and function. Hillsdale, N.J.: Erlbaum.
Fishbein, M., & Ajzen, I. (1975). Belief, attitude, intention, and behavior: An introduction to theory and research. New York: Addison-Wesley.
Gold, M. & Douvan, E. (1997). A new outline of social psychology. Washington DC: American Psychological Association.
Hair Jr., J. F., Anderson, R. E., Tatham, R. L., & Black, W. C. (1998). Multivariate Data Analysis, 5th ed. New Jersey: Prentice Hall.
Hornby, A.S. & Cowie A.P. (1992) Advanced learner’s dictionary of current English, Oxford University Press: Oxford.
Malhotra, N. K. (2004). Marketing Research: An Applied Orientation, 4th ed. Delhi: Pearson Education.
Pallant, J. (2005). SPSS Survival Manual, 2nd ed. Glasgow: Open university press.
Rosenberg, M. J. and Carl I. Hovland (1960), Cognitive, affective and behavioral components of attitude. In M. J. Rosenberg and C. I. Hovland (Eds.), Attitude Organization and Change. New Heaven: Yale University Press.
Solomon, M. R. (2004), Consumer Behavior: Buying, Having and Being, 6th ed. New Jersey: Pearson-Prentice Hall.
Journal References
Ailawadi, K. L. & Keller, K. L. (2004). “Understanding retail branding: conceptual insights and research priorities,” Journal of Retailing, 80 (4), 331-342.
Batra, R. & Sinha, I. (2000). “Consumer-Level Factors Moderating The Success Of Private Label Brands,” Journal of Retailing, 76 (2), 175-191.
Bergès-Sennou, F., Bontems, P., & Réquillart, V. (2003). “Economic impact of the development of private labels,” 1st Biennal Conference of the Food System Research Group, University of Wisconsin, Madison, June, 26-27, 2003.
Bone, P. F. (1995). “Word-of-mouth effects on short-term and long-term product judgements,” Journal of Business Research, 32 (3), 213-223.
45
Bonfrer, A. & Chintagunta, P. K. (2004). “Store Brands: Who Buys Them and What Happens to Retail Prices When They Are Introduced?”, Review of Industrial Organization, 24 (2), 195-218.
Burt, S. (2000). “The strategic role of retail brands in British grocery retailing,” European Journal of Marketing, 34 (8), 875-890.
Burton, S., Lichtenstein, D. R., Netemeyer, R. G., & Garretson, J. A. (1998). “A scale for measuring attitude toward private label products and an examination of its psychological and behavioral correlates,” Journal of Academy of Marketing Science, 26 (4), 293-306.
Buttle, F. A. (1998). “Word of mouth: understanding and managing referral marketing,” Journal of Strategic Marketing, 6 (3), 241-254.
Chu, W. & Chu, W. (1994). “Signaling quality by selling through a reputable retailer: An example of renting the reputation of another agent,” Marketing Science, 13 (2), 177-189.
Collins-Dodd, C. & Lindley, T. (2003). “Store brands and retail differentiation: The influence of store image and store brand attitude on store own brand perceptions,” Journal of Retailing and Consumer Services, 10 (6), 345-352.
Corstjens, M. & Lal, R. (2000). “Building store loyalty through store brands,” Journal of Marketing Research, 37 (3), 281-291.
Dawar, N. & Parker, P. (1994). “Marketing universals: Consumers’ use of brand name, price, physical appearance, and retailer reputation as signals of product quality,” Journal of Marketing, 58 (2), 81-95.
Dekimpe, M.G., Hanssens, D. M., & Silva-Risso, J. M. (1999). “Long-run effects of price promotions in scanner markets”, Journal of Econometrics, 89 (1/2), 269-291.
Dhar, S.K. & Hoch, S. J. (1997). “Why store brand penetration varies by retailer?”, Marketing Science, 16 (3), 208-227.
Dick, A., Jain, A., & Richardson, P. (1995). “Correlates of store brand proneness: some empirical observations,” Journal of Product & Brand Management, 4 (4), 15-22.
Dick, A., Jain, A., & Richardson, P. (1996). “How consumers evaluate store brands?”, Journal of Product & Brand Management, 5 (2), 19-28.
East, R., Hammond, K., Lomax, W., & Robinson, H. (2005). “What is the effect of a recommendation?”, Marketing Review, 5(2), 145-157.
Garretson, J. A., Fisher, D., & Burton, S. (2002). “Antecedents of private label attitude and national brand promotion attitude: similarities and differences,” Journal of Retailing, 78 (2), 91-99.
Harrison-Walker, L. J. (2001). “The Measurement of Word-of-Mouth Communication and an Investigation of Service Quality and Customer Commitment as Potential Antecedents,” Journal of Service Research, 4 (1), 60-75.
Herr, P. M., Kardes, F. R., & Kim, J. (1991). “Effects of word-of-mouth and product-attribute information on persuasion: An accessibility-diagnosticity perspective,” Journal of Consumer Research, 17 (4), 454-462.

46
Hubbard, R. & Armstrong, J. S. (1994). “Replications and extensions in marketing: Rarely published but quite contrary,” International Journal of Research in Marketing, 11 (3), 233-248.
Jin, B. & Suh, Y. G. (2005). “Integrating effect of consumer perception factors in predicting private brand purchase in a Korean discount store context,” Journal of Consumer Marketing, 22 (2), 62-71.
Juhl, H. J., Esbjerg, L., Grunert, K. G., Bech-Larsen, T., & Brunsø, K. (2006). “The fight between store brands and national brands—What’s the score?”, Journal of Retailing and Consumer Services, 13(5), 331-338.
Kukar-Kinney, M. & Grewal, D. (2006). “Consumer willingness to claim a price-matching refund: A look into the process,” Journal of Business Research, 59 (1), 11-18.
Lau, G. T. & Lee, S. H. (1999). “Consumers’ trust in a brand and the link to brand loyalty,” Journal of Market Focused Management, 4 (4), 341-370.
Lichtenstein, D. R., Netemeyer, R. G., & Burton, S. (1990). “Distinguishing Coupon Proneness from Value Consciousness: An Acquisition-Transaction Utility Theory Perspective,” Journal of Marketing, 54 (3), 54-67.
Lybeck, A., Holmlund-Rytkönen, M, & Sääksjärvi, M. (2006). “Store Brands vs. Manufacturer Brands: Consumer Perceptions and Buying of Chocolate Bars in Finland,” International Review of Retail, Distribution, and Consumer Research, 16 (4), 471-492.
Madden, C. S., Easley, R. W., & Dunn, M. G. (1995). “How journal editors view replication research,” Journal of Advertising, 24 (4), 77-87.
Narasimhan, C. & Wilcox, R. T. (1998). “Private-labels and the channel relationship: A cross category analysis”, Journal of Business, 71 (4), 573–600.
Pachauri, M. (2002). “Consumer behavior: A literature review,” Marketing Review, 2(3), 319-355.
Purohit, D. & Srivastava, J. (2001). “Effect of manufacturer reputation, retailer reputation, and product warranty on consumer judgments of product quality: A cue diagnosticity framework,” Journal of Consumer Psychology, 10 (3), 123-134.
Quelch, J. A. & Harding, D. (1996). “Brands versus private labels: Fighting to win,” Harvard Business Review, 74 (1), 99–109.
Richardson, P. (1997). “Are store brands perceived to be just another brand?”, Journal of Product and Brand Management, 6 (6), 388-404.
Richardson, P., Jain, A. K., & Dick, A. (1996). “Household Store Brand Proneness: A Framework,” Journal of Retailing, 72 (2), 159-185.
Sinha, I. & Batra, R. (1999). “The effect of consumer price consciousness on private label purchase,” International Journal of Research in Marketing, 16 (3), 237-251.
Steiner, R. L. (2004). “The nature and benefits of national brand/private label competition,” Review of Industrial Organization, 24 (2), 105-127.
Sudhir, K. & Talukdar, D. (2004). “Does Store Brand Patronage Improve Store Patronage?”, Review of Industrial Organization, 24 (2), 143-160.

47
Swan, J. E. & Oliver, R. L. (1989). “Postpurchase communications by consumers,” Journal of Retailing, 65 (4), 516-533.
Internet References
ACNielsen Consumer Attitudes Towards Private Label Global Study (2005). Available from: http://www2.acnielsen.com/press/documents/ACNielsen_PrivateLabel_GlobalSummary.pdf [accessed 19 March 2007]
Berlinski, P. (2005). “PLMA’s world of private label,” Private Label International, Summer. Available from: http://privatelabelmag.com/pdf/pli_summer2005/print/16.cfm [accessed 20 March 2007]
Boyle, Matthew, 2003. ”Brand Killers Store brands aren't for losers anymore. In fact, they're downright sizzling. And that scares the soap out of the folks who bring us Tide and Minute Maid and Alpo and...”, Fortune Magazine, 11th August, 2003. Available from: http://money.cnn.com/magazines/fortune/fortune_archive/2003/08/11/346850/index.htm [accessed 08 March 2007]
Carpenter, J. M. & Fairhurst, A. (2005). “Consumer shopping value, satisfaction, and loyalty for retail apparel brands,” Journal of Fashion Marketing and Management, 9 (3), 256-269. Available from: http://proxy.ub.umu.se:2080/Insight/ViewContentServlet?Filename=Published/EmeraldFullTextArticle/Articles/2840090301.html [accessed March 25, 2007]
Carpenter, D, 2007. ”Kraft Net Falls 19 Percent”, Associated Press, 31st January, 2007. Available from: http://in.us.biz.yahoo.com/ap/070131/earns_kraft.html?.v=4 [accessed 08 March 2007]
Chen, S. (2005). “An empirical investigation of category-level effects of consumer factors on private label purchase,” Masters Thesis, Auckland University of Technology, Auckland, New Zealand. Available from: http://repositoryaut.lconz.ac.nz/theses/209/ [accessed 11 April, 2007].
Chronsell, A. & Nauclèr, L. (2006). “Private brands conquer the Swedish market – How retailers regard and handle private brands,” Master Thesis, Jönköping International Business School, Jönköping University, Jönköping, Sweden. Available from: http://www.diva-portal.org/diva/getDocument?urn_nbn_se_hj_diva-512-1__fulltext.pdf [accessed 19 March 2007]
Coop Norden Report (2006). Available at: http://www.coopnorden.com/upload/modul/coopnorden/diverse/ENG_Coop_AR06las.pdf [accessed 11 April 2007]
Euromonitor International (2007). “Retailing in Sweden,” (executive summary). Available from: http://www.euromonitor.com/Retailing_in_Sweden#exec [accessed 19 March 2007]
Gu, W. & Nilsson, K. (2006). “Consumers’ perceptions of variety – The impact of private brands,” Master Thesis, School of Economics and Management, Lund University. Available from: http://theses.lub.lu.se/undergrad/search.tkl?field_query1=pubid&query1=FEK-00012630&recordformat=display [accessed 19 March 2007]

48
ICA Group’s Annual Report (2006). Available at: http://www.ica.se/file_archive/pdf/Annualreport2006.pdf [accessed 11 April 2007]
Nishikawa, C. & Perrin, J. (2005). “Private label grows global,” Consumer Insight Magazine, Available from: http://us.acnielsen.com/pubs/documents/2005_ci_q4_privatelabel.pdf [accessed 20 March 2007]
Overview of Axfood group (2006); Available at: http://www.axfood.se/showdoc.asp?docid=454&setlanguageid=4 [accessed 11 April 2007]
Penn, M. (2000) “Great Expectations: A Study of Visitor Perceptions of Tintagel (Cornwall, UK),” Undergraduate thesis, University of Exeter. Available from: http://www.arasite.org/guests.html (accessed 2nd April, 2007).
Private Label Manufacturers Association (PLMA) (2007). “Growth and Success,” Private Label Today. Available from: http://www.plmainternational.com/en/private_label_en.htm [accessed 20 March 2007]
Rivkin, J. (2006). “Price is still priority”, PL Buyer. Available from: http://www.privatelabelbuyer.com/content.php?s=PB/2006/03&p=7 [accessed 06 April 2007]
Swedish Competition Authority. “Competition in Sweden 2006”, Available from: http://www.kkv.se/upload/Filer/ENG/Publications/rap_2006-4_summary.pdf [accessed 19 March 2007]
Zebal, M. A. (2003). “A synthesis model of market orientation for a developing country – The case of Bangaldesh,” PhD dissertation, Victoria University of Technology, Melbourne, Victoria. Available from: http://wallaby.vu.edu.au/adt-VVUT/uploads/approved/adt-VVUT20041220.174947/public/02whole.pdf [accessed 20 April 2007].

49
APPENDIX A: SWEDISH FOOD RETAILERS
The Swedish food retail market has been dominated for years by three major private label brands: ICA, Coop and Axfood, while a fourth, BergendahlsGruppen, is mainly active in southern Sweden. In 2006, ICA achieved 49.8 per cent market share, Coop shared 21.6 per cent and Axfood was estimated to gain 16.5 per cent in Swedish market (Coop Norden 2006). The three major retailers together covered 87.9 percent of the whole national market share. ICA, founded in the early of 20th century, is one of the leading food retail companies in Sweden, who is the principal supplier to ICA retailers. ICA owns and manages their stores as independent businesses, and operates throughout the country in cooperation with independent retailers. The ICA retail chains in Sweden have developed four different store profiles: ICA Nära, ICA Supermarket, ICA Kvantum, Maxi ICA Stormarknad. ICA’s brand has a clear and strong position. By 2006, the food brands owned by ICA include ICA, ICA Gottliv and Euro Shopper. ICA is the umbrella brand that sold in ICA stores. ICA Gottliv launched in 2005 is designed in line with healthy products. And, Euro Shopper is ICA Group’s discount product line. As a market leader in Sweden, in 2006 ICA became the biggest gainer in the survey of well-known brands by Reputation Institute10. Coop, as the major driving force of Consumer Packaged Goods, has developed for more than a hundred years in Nordic Europe. With a clear market position of “low price”, Coop increased the number of low-price stores continued in 2006. For food segment, Coop Sweden has retail chains like Coop Konsum, Coop Extra and Coop Forum. Coop Konsum and Coop Extra are large supermarkets not only for food but also including a broad product range, and Coop Forum is a hypermarket that focuses on food category. In 2006, the basic Coop brands sold in Sweden include Coop and X-tra, which were given in a wide-ranging boost in food category. Coop is designed with a high quality and low prices than other comparable branded products. X-tra has a clear position that delivers low-price profile. These two brands are launched jointly in the food segment to match the best branded goods in terms of quality, but low prices. Axfood AB is one of the largest food retailers in Scandinavia listed on the stock market and conducts food retail and wholesale trade in Sweden. The Group’s retail operations are conducted through the Group-owned Willys and Hemköp stores. Axfood collaborates with a large number of proprietor-run stores that tied to Axfood, which include stores within the Hemköp and Willys chains as well as stores run under the Handlar’n and Tempo profiles. With a simple private label strategy, products that carry the Willys or Hemköp label are designed with not only a comparable level of quality to the market-leading product, but at a price that is roughly 10%-15% lower as well. In the discount segment, Axfood’s private label products keep the clear market position and distinct success.
10 http://www.reputationinstitute.com/main/index.php?pg=pub&box=in_the_press

50
APPENDIX B: QUESTIONNAIRE We are two students working on our D-level thesis. We are investigating the attitude toward store brands in the food industry among young Swedish consumers. STORE BRANDS are products which carry the retailer’s labels on them. Examples of store brands are meatball packets that carry ICA label, ice-cream boxes that carry X-tra label, pizza packets that carry Coop label, ketchups that carry Willy’s label, potato chips packet with Hemköp label etc.
We would very much appreciate it if you fill this two-page questionnaire. It will take less than 9 minutes. Your answers will be completely anonymous and will in no way be traced to you. All the responses will only be used for working on our thesis. Thank you in advance!
Please cross or tick the appropriate responses to the following questions
1. What is your gender? Male Female
2. What is your age? Less than 20 years 20 -24 years 25-30 years Over 30 years
3. What are you studying? (Please write below in English).
__________________________________________________________________________ 4. How are you financing yourself? (Check all that apply) Student loan Working part-time Working full-time
Others (please specify): ____________________________________________
5. How much do you spend of grocery/food items per month in SEK (approximately)? (Please check only one answer).
Less than 1000 � 1000 to 2000 Above 2000 6. Please read each statement below and CIRCLE the number that most accurately reflects your opinion on store brands.
Below “1” means “Strongly Disagree” to “7” means “Strongly Agree”.
Strongly Strongly Disagree Agree
When I buy a store brand, I always feel that I am getting a good deal.
1 2 3 4 5 6 7
The more well-known retailers are, the higher is the quality of the store brands.
1 2 3 4 5 6 7
Generally speaking, the higher the price of a product, the higher the quality.
1 2 3 4 5 6 7
Quality, price or reputation of store brands are a topic of discussion among my friends
1 2 3 4 5 6 7
I am very concerned about low prices, but I am equally concerned about product quality.
1 2 3 4 5 6 7

51
Strongly Strongly
Disagree Agree
I will grocery shop at more than one store to take advantage of low prices
1 2 3 4 5 6 7
My friends seldom comment on the value of store brands 1 2 3 4 5 6 7
I generally shop around for lower prices on products, but they still must meet quality requirements before I buy them.
1 2 3 4 5 6 7
I will only buy store brands from a retailer whom I trust. 1 2 3 4 5 6 7
I buy store brands because of my friends’ recommendations. 1 2 3 4 5 6 7
The time it takes to find low prices is usually not worth the effort
1 2 3 4 5 6 7
Buying store brands makes me feel good. 1 2 3 4 5 6 7
In general, store brands are poor quality products. 1 2 3 4 5 6 7
The price of a product is a good indicator of its quality. 1 2 3 4 5 6 7
When grocery shopping, I compare the prices of different brands to be sure I get the best value for the money.
1 2 3 4 5 6 7
I generally receive good recommendations about store brands. 1 2 3 4 5 6 7
The money saved by finding low prices is usually worth the time and effort
1 2 3 4 5 6 7
I have heard comments about store brands’ poor quality. 1 2 3 4 5 6 7
If the retailer is well-known, then I buy its store brands. 1 2 3 4 5 6 7
I am not willing to go to extra effort to find lower prices 1 2 3 4 5 6 7
I believe in the statement that "you get what you pay for". 1 2 3 4 5 6 7
I prefer store brands over other brands. 1 2 3 4 5 6 7
A retailer’s reputation is an important factor in choosing between different stores’ brands.
1 2 3 4 5 6 7
When I buy products, I like to be sure that I am getting my money’s worth.
1 2 3 4 5 6 7
You always have to pay a bit more to get a better brand. 1 2 3 4 5 6 7
7. Do you buy store brands? (Please check only one answer).
� Yes, regularly � Yes, but not always � Not at all
-------Thank you completing the questionnaire -------