e-file adoption: an empirical investigation
TRANSCRIPT
GFJMR Vol. 5 July-December, 2012
1
Tax Payers’ Perception towards
E-File Adoption: An
Empirical Investigation
Brahmbhatt Mamta Associate Professor
Shri Jairambhai Patel Institute of
Business Management and Computer
Applications.
Gandhinagar, Gujarat
This paper attempts to develop an understanding of the factors that
influence citizens’ adoption of electronic tax-filing services and to
discuss taxpayer perception and satisfaction with an online system for
filing individual income tax returns. A survey has been used to collect
primary data and questionnaire approach was used in final analysis.
Single cross sectional descriptive research design was used to determine
taxpayers’ perception. SPSS and Microsoft Excel have been used to
analyze and interpret the data. The data collected has been analyzed
through a series of tools and procedures. Cross tabulation, Graphical
Representation, Rank Analysis and Anova have been used. With proper
assistance from the tax-filing system and service centers, people can be
made familiar to filing income taxes online. Replications among other
samples are needed to validate the current finding. The study is confined
to the taxpayers located in Ahmadabad city of Gujarat. So, the conclusion
derived from the research cannot be made applicable as it is for the other
parts of the states or other states. This paper makes a valuable
contribution given the fact that there are only a limited number of
comprehensive studies dealing with the Taxpayers’ Perception towards
E-File Adoption in Gujarat.
Keywords: Electronic tax filing, Perception, Taxpayers.
GFJMR Vol. 5 July-December, 2012
2
An income tax return could be e-
filed in three ways. 1. An assessee
could e-file his tax return digitally
signed. 2. The return was filed on
the internet, but without a digital
signature.3. To e-file their return
through an e-return intermediary
who on payment of a prescribed
fee, would did the e-filing and also
assisted the assessee in submitting
the ITR-V to Income Tax
Department.
INTRODUCTION
E-FILING IN INDIA: Indian Income Tax Department’s Vision Document 2010 focused on quality tax-payer service as their
main area of concern. In this regard the main aim of the department is: “to enable taxpayers to meet
their normal tax obligations in a convenient manner without visiting Income Tax Office” (FINMIN,
2008, p. 137). To accomplish this objective, the department’s high priorities are: e-delivery of taxpayer
services, increase of departmental computer infrastructure and the setting up of Tax Information
Network (TIN). In India, income
tax e-filing was introduced in
September, 2004, initially on a
voluntary usage basis for all
categories of income tax assessee.
But from July, 2006, it was made
mandatory for all corporate firms
to e-file their income tax returns.
Taking this process further, from
assessment year 2007 to 2008, e-
filing of income tax return was
made mandatory for all
companies. For all other
categories of income tax assessee,
which includes salaried
individuals, the use of income tax
e-filing service continues to be
voluntary.
METHODS OF E-FILING: THEORETICAL FRAMEWORK
An income tax return could be e-filed in three ways. In the first option, an assessee could e-file his tax
return digitally signed. This is an anytime, anywhere, and paperless filing process which did not require
visit to the income tax office. But an assessee could use this facility only if he has a digital signature. In
the second e-filing option, the return was filed on the internet, but without a digital signature. At the end
GFJMR Vol. 5 July-December, 2012
3
Siriluck R. (2008) studies government
service quality and risk perceptions of
personal income taxpayers on e-government
service value. The findings suggested that
perceived value of e-government service is
e-government service quality, which consists
of service design, web site design, technical
support, and customer support quality.
of such e-filing process, the assessee prints out a single page receipt cum verification form (ITR-V)
which he was required to sign in ink. This ink-signed ITR-V form is to be physically delivered in
duplicate to the income tax office and one copy of it is returned to the assessee, duly acknowledged.
This physical filing of ITR-V must be done within 15 days or else the date of filing ITR-V will be
deemed as the date of income tax return filing. The third option provides for assessee to e-file their
return through an e-return intermediary who on payment of a prescribed fee, would did the e-filing and
also assisted the assessee in submitting the ITR-V to Income Tax Department. There are millions of
salaried taxpayers in India. Of these, only few of them had submitted paperless income tax returns
during previous assessment years. Hence, the main aim of the research is to develop an understanding
of the perception of taxpayers towards the e-filing.
LITERATURE REVIEW
Previous studies found that a combination of positive and negative beliefs about technology underlies
the domain of technology readiness (Dabholkar, 1994; Mick and Fournier, 1998). In particular,
Dabholkar (1994) found that individuals simultaneously harbour positive (favorable) and negative
(unfavorable) beliefs
about technology. The
positive beliefs propel
individuals towards new
technologies, while
negative beliefs may
hold them back.
Ramlah Hussein,
Norshidah Mohamed,
Abd Rahman Ahlan, Murni Mahmud 1(2011) aimed to investigate the factors influencing citizens’
intention to use e-filing in the Malaysian context. The study used quantitative approach methodology.
1 Ramlah Hussein, Norshidah Mohamed, Abd Rahman Ahlan, Murni Mahmud
1(2011) "E-government application: an
integrated model on G2C adoption of online tax", Transforming Government: People, Process and Policy, Vol. 5 Iss: 3,
pp.225 – 248
GFJMR Vol. 5 July-December, 2012
4
In total, 500 self-administered questionnaires were distributed and 411 were found usable for data
analysis; 14 hypotheses were formulated and tested. Perceived ease of use and perceived usefulness,
trust of the government, image, compatibility and service quality are found to be significant predictors
of citizens’ intention to use e-filing. Lemuria Carter, Ludwig Christian Shaupp, Jeffrey Hobbs, Ronald
Campbell 2(2011) investigated the influence of six determinants on taxpayers' intention to adopt e-file
systems. A survey was administered to 304 US taxpayers to capture their perceptions of e-filing. The
survey was developed using existing scales in the literature. The findings of this research show that
theoretical constructs from the UTAUT model are well suited in explaining intentions to use multiple e-
government services. Specifically, the results indicate that three factors from the UTAUT model
(performance expectancy, effort expectancy, and social influence) play a significant role in predicting
taxpayers' e-filing intentions. More importantly, the research findings indicate that personal factors
(web-specific self-efficacy (WSSE) and perceived security control), along with UTAUT factors, have a
significant impact on taxpayers' e-file intentions. Mohamed Gamal Aboelmaged 3 (2010) intended to
predict e-procurement adoption through integrating the constructs of the technology acceptance model
and the theory of planned behavior. Researchers found from the survey result that behavioral intention
toward e-procurement technology is mainly determined by user's attitude and additionally influenced by
perceived usefulness and subjective norm. The paper provides procurement system developers and
managers with a useful adoption model that demonstrates the significance of perceived usefulness of e-
procurement system in influencing the adoption decision. This highlights the importance of maximizing
the benefits of e-procurement system for potential users to facilitate the adoption process. Kun Chang
Lee, Melih Kirlidog, Sangjae Lee, Gyoo Gun Lim 4(2008) compared the web-based tax filing systems
of Turkey and South Korea. The comparison is based on user satisfaction which has parameters such as
ease of work, adequacy of the amount of information, display speed, convenience to life, job
productivity, and help service. The tax filing systems are presented along with a background of such
systems and their usability parameters. The study shows that users in the two countries felt differently
in such factors as ease of work, adequacy of the amount of information, display speed, convenience to
2 Lemuria Carter, Ludwig Christian Shaupp, Jeffrey Hobbs, Ronald Campbell
2(2011) "The role of security and trust in the
adoption of online tax filing", Transforming Government: People, Process and Policy, Vol. 5 Iss: 4, pp.303 – 318. 3 Mohamed Gamal Aboelmaged, (2010) "Predicting e-procurement adoption in a developing country: An empirical
integration of technology acceptance model and theory of planned behaviour", Industrial Management & Data Systems, Vol.
110 Iss: 3, pp.392 – 414 4 Kun Chang Lee, Melih Kirlidog, Sangjae Lee, Gyoo Gun Lim (2008) "User evaluations of tax filing web sites: A
comparative study of South Korea and Turkey", Online Information Review, Vol. 32 Iss: 6, pp.842 – 859
GFJMR Vol. 5 July-December, 2012
5
life, job productivity, and help service. Although Turkey has a complex tax system Turkish users did
not find the tax filing system difficult to use and that may be attributable to the fact that they are
accounting professionals who frequently use the system. José Carlos Pinho, Isabel Maria Macedo
5(2008) aimed to analyze the antecedents and consequences of online satisfaction within the context of
e-government, which increasingly play an important role in modern public administrative management.
Specifically, the taxation services offered through the web-based electronic declaration system. A
quantitative methodological approach, a survey was applied to a sample of 351 certified accountants to
empirically test the conceptual model. The results of this empirical study validate four out of five
hypotheses. It was found that convenience is an important antecedent of both satisfaction and online
service quality. Additionally, findings suggest that both the degree of satisfaction and online service
quality impacts on the intention of using the taxation website. Siriluck Rotchanakitumnuai 6(2008)
studied the e-government service quality and risk perceptions of personal income taxpayers on e-
government service value. The study used qualitative in-depth interview and content analysis to explore
the determinants of e-government service quality and risk dimensions of e-government service value.
The findings suggested that perceived value of e-government service is e-government service quality,
which consists of service design, web site design, technical support, and customer support quality. On
the other hand, the three perceived risk concerns are performance, privacy, and financial audit risk.
Reyes Gonzalez, Jose Gasco, Juan Llopis7 (2007) analyzed the evolution and current status of e-
government, trying to deduce a series of basic principles for its success. A case study method was used
to achieve that aim, but prior to its presentation, a short review of the e-government literature along
with some facts and figures have made. The authors concluded that E-government lays emphasis on
technology; however, the internal processes through which public administrations offer their services to
citizens need careful reengineering. Julian Teicher, Owen Hughes, Nina Dow 8(2002) examines the
concept of quality and its application to the public sector and discusses e-government, the latest
5 José Carlos Pinho, Isabel Maria Macedo, (2008) "Examining the antecedents and consequences of online satisfaction
within the public sector: The case of taxation services", Transforming Government: People, Process and Policy, Vol. 2 Iss:
3, pp.177 – 193 6 Siriluck Rotchanakitumnuai, (2008) "Measuring e-government service value with the E-GOVSQUAL-RISK model",
Business Process Management Journal, Vol. 14 Iss: 5, pp.724 – 737 7 Reyes Gonzalez, Jose Gasco, Juan Llopis, (2007) "E-government success: some principles from a Spanish case study",
Industrial Management & Data Systems, Vol. 107 Iss: 6, pp.845 – 86 8 Owen Hughes, Nina Dow(2002) "E-government: a new route to public sector quality", Managing Service Quality, Vol. 12
Iss: 6, pp.384 – 393
GFJMR Vol. 5 July-December, 2012
6
manifestation of attempts to improve quality in government. The paper also reports on a survey of
senior personnel across the three levels of government in Australia. The results of the survey and other
published research materials suggested that the impact of e-government on service delivery is modest
and not well distributed. While there has been widespread adoption of e-government measures, these
have generally been lacking in sophistication and have been disproportionately beneficial to city
dwellers without addressing problems of equity and access.
PROBLEM STATEMENT
The total number of tax payers during 2011-12 was 33579839 out of which of which 1% of tax payers
were done through e-filing. Ninety nine percent of tax returns are filed manually. Income tax
department requires extra ordinary efforts to enter the data from hard copies into the system.
Considering the potential e-fling brings to benefit both the government and the taxpayers, it is
important too to have majority of the tax-payers e-file. This requires an understanding of the tax payer’s
perception towards the service. Hence, the main aim of the research is to develop an understanding of
the perception of taxpayers towards the e-filing.
RESEARCH QUESTIONS
1. Do the tax payers find that e-filing system is easy to use?
2. Is e-filing system is efficient to be use?
3. Do the tax payers own enough facility to use e-filing system?
RESEARCH OBJECTIVES
To know whether the tax payers feel easy to use e-filling system.
To investigate whether the tax payers have problems/ (or facilities) in using the e-filing system.
To study the perception of taxpayers towards the e-filing.
RESEARCH INSTRUMENT
The survey instrument is a 5 point Likert scale questionnaire survey divided into two sections. Section
A contained questions on tax payers demography. Section B contained questions to measure tax payer’s
GFJMR Vol. 5 July-December, 2012
7
perception on different attributes of e-filing system. With respect to the measurement of the variables,
the study adopted the scales developed and used by Venkatesh, Morris and Davis in their famous article
on the Unified Theory of Acceptance and Use of Technology UTAUT.
RESEARCH METHODOLOGY
The researchers conducted pilot study before distributing to the respondents. 30 respondents were chosen
in order to know the questionnaires constructed are reliable and understand by the respondents. Single
Cross Sectional Descriptive Research design had been adopted to determine the Direct tax code
conceptual understanding and perception of taxpayers towards e-filing for the Ahmedabad and
Gandhinagar cities of Gujarat state.A convenience Sampling was used to elicit information regarding
perception of taxpayers towards the e-filing and areas covered are Ahmedabad and Gandhinagar. A
five-point Likert-type scale is used in this study, anchored by “strongly disagree” to “strongly agree.
The data were analyzed using statistical software tool (SPSS 17.0) with the uses of, rank analysis, Anova
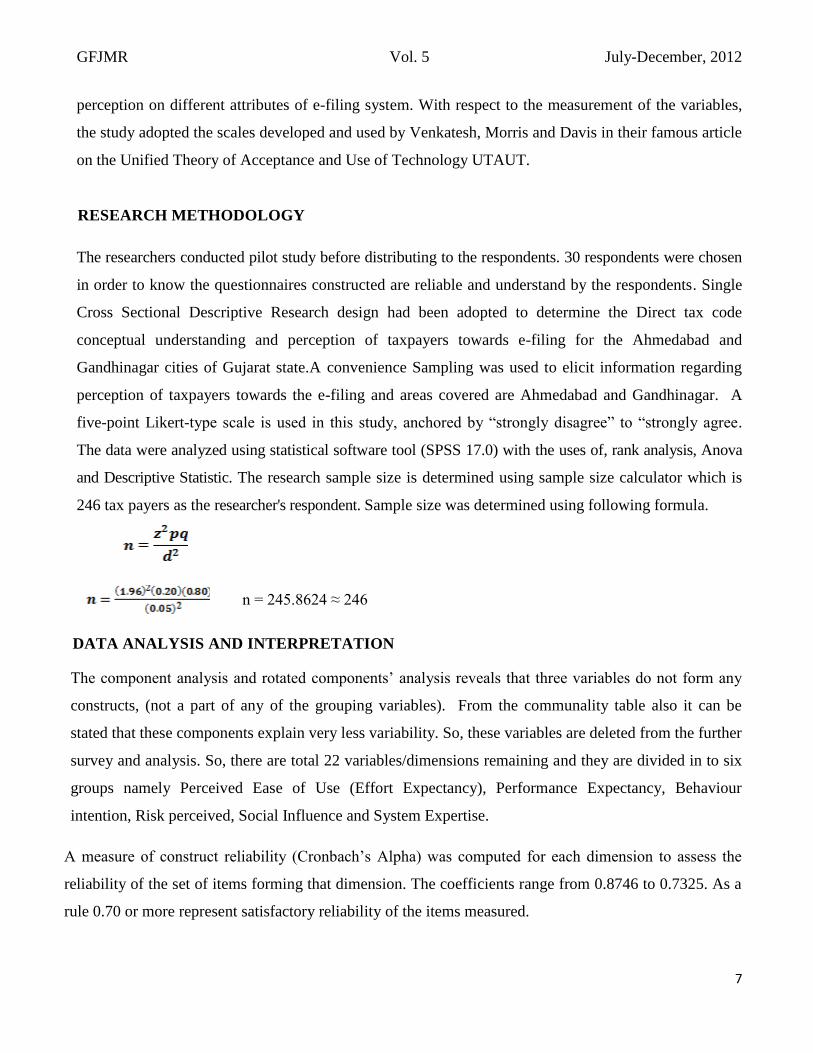
and Descriptive Statistic. The research sample size is determined using sample size calculator which is
246 tax payers as the researcher's respondent. Sample size was determined using following formula.
n = 245.8624 ≈ 246
DATA ANALYSIS AND INTERPRETATION
The component analysis and rotated components’ analysis reveals that three variables do not form any
constructs, (not a part of any of the grouping variables). From the communality table also it can be
stated that these components explain very less variability. So, these variables are deleted from the further
survey and analysis. So, there are total 22 variables/dimensions remaining and they are divided in to six
groups namely Perceived Ease of Use (Effort Expectancy), Performance Expectancy, Behaviour
intention, Risk perceived, Social Influence and System Expertise.
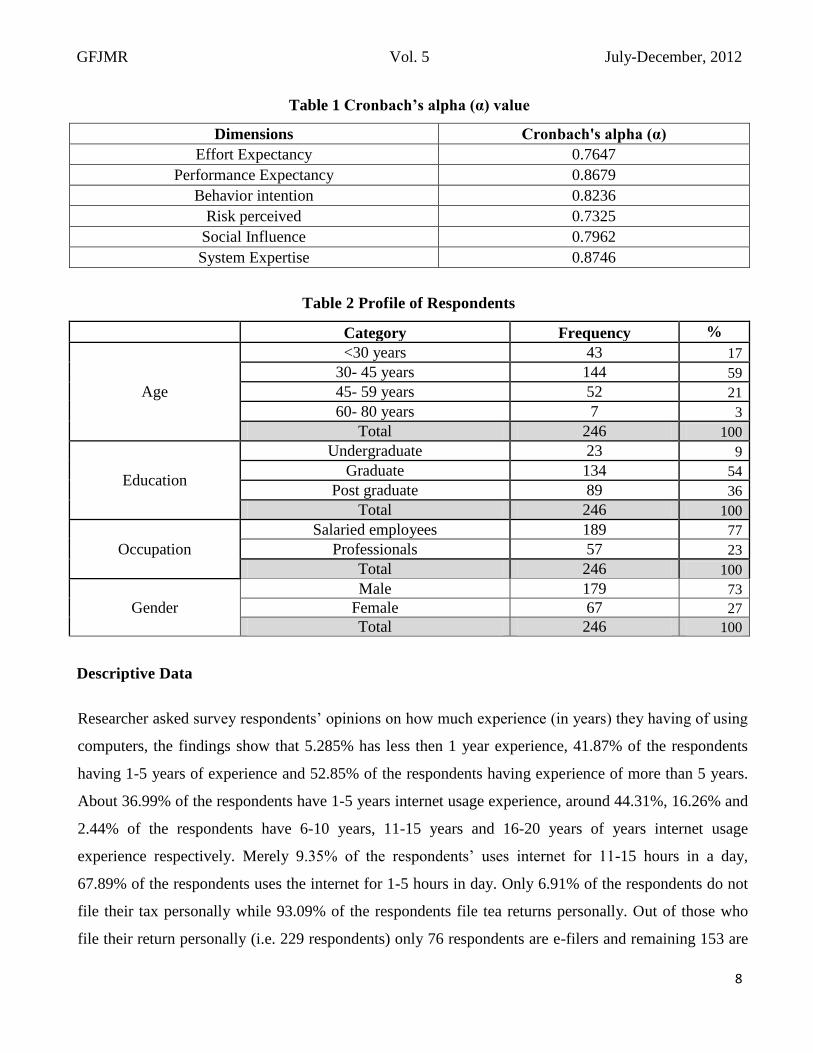
A measure of construct reliability (Cronbach’s Alpha) was computed for each dimension to assess the
reliability of the set of items forming that dimension. The coefficients range from 0.8746 to 0.7325. As a
rule 0.70 or more represent satisfactory reliability of the items measured.
GFJMR Vol. 5 July-December, 2012
8
Table 1 Cronbach’s alpha (α) value
Dimensions Cronbach's alpha (α)
Effort Expectancy 0.7647
Performance Expectancy 0.8679
Behavior intention 0.8236
Risk perceived 0.7325
Social Influence 0.7962
System Expertise 0.8746
Table 2 Profile of Respondents
Category Frequency %
Age
<30 years 43 17
30- 45 years 144 59
45- 59 years 52 21
60- 80 years 7 3
Total 246 100
Education
Undergraduate 23 9
Graduate 134 54
Post graduate 89 36
Total 246 100
Occupation
Salaried employees 189 77
Professionals 57 23
Total 246 100
Gender
Male 179 73
Female 67 27
Total 246 100
Descriptive Data
Researcher asked survey respondents’ opinions on how much experience (in years) they having of using
computers, the findings show that 5.285% has less then 1 year experience, 41.87% of the respondents
having 1-5 years of experience and 52.85% of the respondents having experience of more than 5 years.
About 36.99% of the respondents have 1-5 years internet usage experience, around 44.31%, 16.26% and
2.44% of the respondents have 6-10 years, 11-15 years and 16-20 years of years internet usage
experience respectively. Merely 9.35% of the respondents’ uses internet for 11-15 hours in a day,
67.89% of the respondents uses the internet for 1-5 hours in day. Only 6.91% of the respondents do not
file their tax personally while 93.09% of the respondents file tea returns personally. Out of those who
file their return personally (i.e. 229 respondents) only 76 respondents are e-filers and remaining 153 are
GFJMR Vol. 5 July-December, 2012
9
non e-filers. All the 76 e-filers are filing e-returns from their respective offices.
Profiles of the e-filers:
Out of 246 respondents only 229 have filed their returns personally, and out of those only 33.19% had
attempted e-filing, majority of the e-filers are professionals and aged between 30-45 years. There are
only 67 female respondents, but then only proportionate female e-filers are less than male respondents.
So, it can be concluded from the survey results that males appeared to be more technology adopters than
females; females experienced greater difficulty with e-filing as compared to males; older people tended
to be less optimistic about e-filing and older people experienced more discomfort with e-filing as
compared to younger people. The survey result found that all e-filers are filing their returns from their
office/work place only. In respect of time taken to e-file successfully, 78.7% of the e-filers indicated that
they took less than 30 minutes to 1 hour, remaining of them (21.3%) have completed between 1-2 hours.
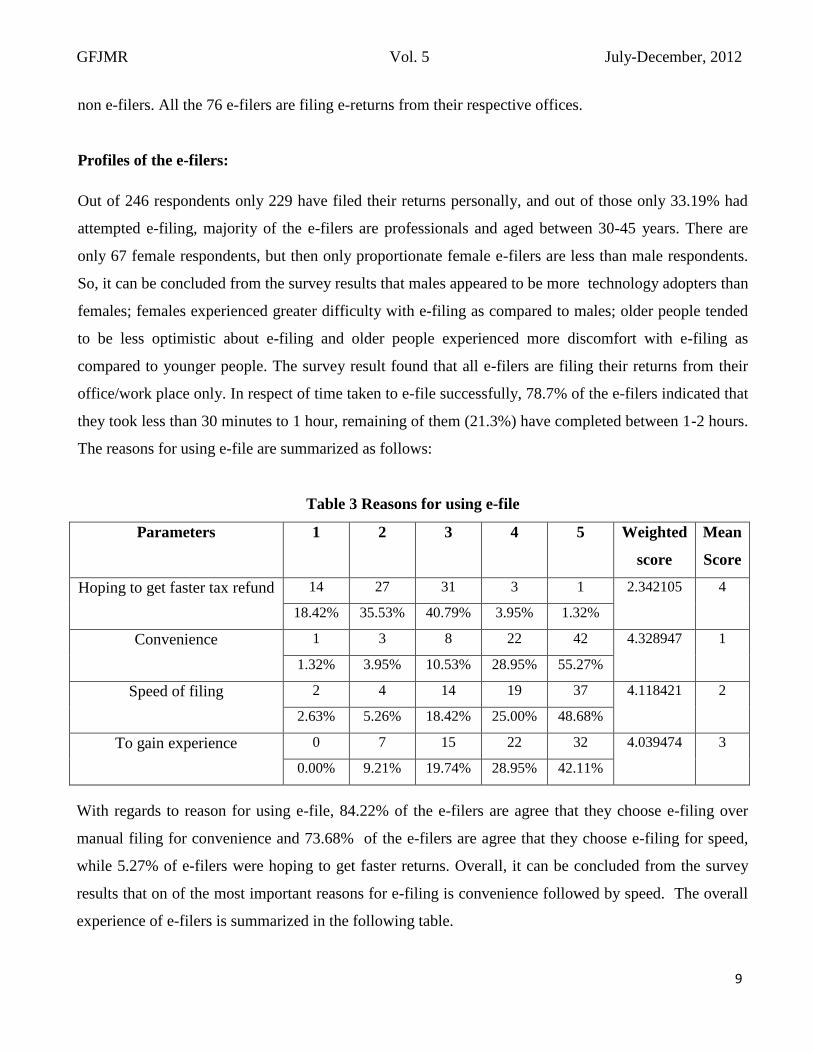
The reasons for using e-file are summarized as follows:
Table 3 Reasons for using e-file
Parameters 1 2 3 4 5 Weighted
score
Mean
Score
Hoping to get faster tax refund 14 27 31 3 1 2.342105 4
18.42% 35.53% 40.79% 3.95% 1.32%
Convenience 1 3 8 22 42 4.328947 1
1.32% 3.95% 10.53% 28.95% 55.27%
Speed of filing 2 4 14 19 37 4.118421 2
2.63% 5.26% 18.42% 25.00% 48.68%
To gain experience 0 7 15 22 32 4.039474
3
0.00% 9.21% 19.74% 28.95% 42.11%
With regards to reason for using e-file, 84.22% of the e-filers are agree that they choose e-filing over
manual filing for convenience and 73.68% of the e-filers are agree that they choose e-filing for speed,
while 5.27% of e-filers were hoping to get faster returns. Overall, it can be concluded from the survey
results that on of the most important reasons for e-filing is convenience followed by speed. The overall
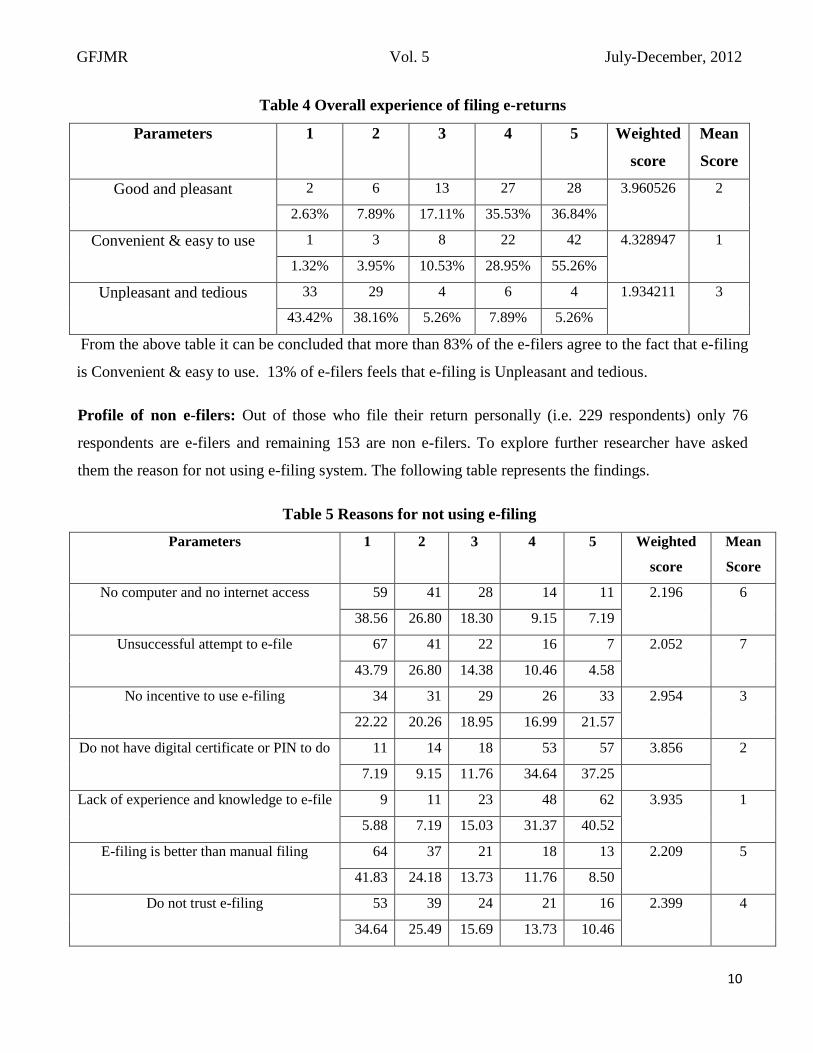
experience of e-filers is summarized in the following table.
GFJMR Vol. 5 July-December, 2012
10
Table 4 Overall experience of filing e-returns
Parameters 1 2 3 4 5 Weighted
score
Mean
Score
Good and pleasant 2 6 13 27 28 3.960526 2
2.63% 7.89% 17.11% 35.53% 36.84%
Convenient & easy to use 1 3 8 22 42 4.328947 1
1.32% 3.95% 10.53% 28.95% 55.26%
Unpleasant and tedious 33 29 4 6 4 1.934211 3
43.42% 38.16% 5.26% 7.89% 5.26%
From the above table it can be concluded that more than 83% of the e-filers agree to the fact that e-filing
is Convenient & easy to use. 13% of e-filers feels that e-filing is Unpleasant and tedious.
Profile of non e-filers: Out of those who file their return personally (i.e. 229 respondents) only 76
respondents are e-filers and remaining 153 are non e-filers. To explore further researcher have asked
them the reason for not using e-filing system. The following table represents the findings.
Table 5 Reasons for not using e-filing
Parameters 1 2 3 4 5 Weighted
score
Mean
Score
No computer and no internet access
59 41 28 14 11 2.196
6
38.56 26.80 18.30 9.15 7.19
Unsuccessful attempt to e-file
67 41 22 16 7 2.052
7
43.79 26.80 14.38 10.46 4.58
No incentive to use e-filing
34 31 29 26 33 2.954
3
22.22 20.26 18.95 16.99 21.57
Do not have digital certificate or PIN to do
11 14 18 53 57 3.856 2
7.19 9.15 11.76 34.64 37.25
Lack of experience and knowledge to e-file
9 11 23 48 62 3.935
1
5.88 7.19 15.03 31.37 40.52
E-filing is better than manual filing
64 37 21 18 13 2.209
5
41.83 24.18 13.73 11.76 8.50
Do not trust e-filing 53 39 24 21 16 2.399
4
34.64 25.49 15.69 13.73 10.46
GFJMR Vol. 5 July-December, 2012
11
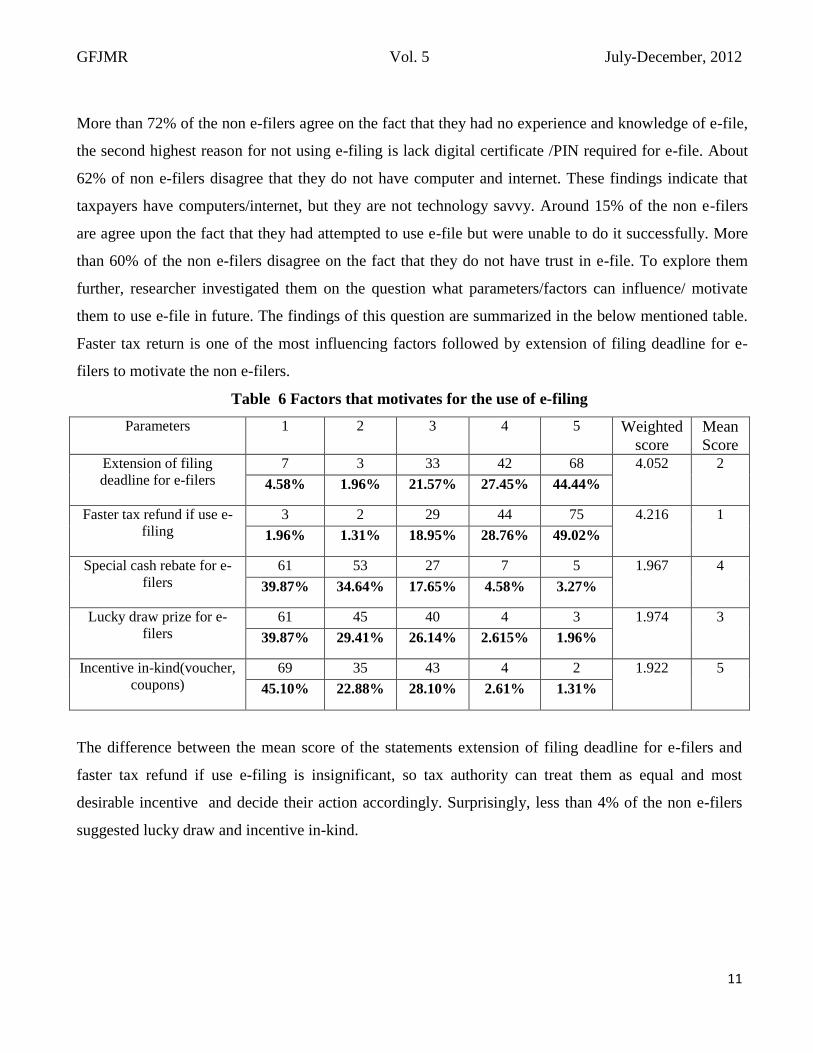
More than 72% of the non e-filers agree on the fact that they had no experience and knowledge of e-file,
the second highest reason for not using e-filing is lack digital certificate /PIN required for e-file. About
62% of non e-filers disagree that they do not have computer and internet. These findings indicate that
taxpayers have computers/internet, but they are not technology savvy. Around 15% of the non e-filers
are agree upon the fact that they had attempted to use e-file but were unable to do it successfully. More
than 60% of the non e-filers disagree on the fact that they do not have trust in e-file. To explore them
further, researcher investigated them on the question what parameters/factors can influence/ motivate
them to use e-file in future. The findings of this question are summarized in the below mentioned table.
Faster tax return is one of the most influencing factors followed by extension of filing deadline for e-
filers to motivate the non e-filers.
Table 6 Factors that motivates for the use of e-filing
Parameters 1 2 3 4 5 Weighted
score
Mean
Score
Extension of filing
deadline for e-filers
7 3 33 42 68 4.052
2
4.58% 1.96% 21.57% 27.45% 44.44%
Faster tax refund if use e-
filing
3 2 29 44 75 4.216
1
1.96% 1.31% 18.95% 28.76% 49.02%
Special cash rebate for e-
filers
61 53 27 7 5 1.967
4
39.87% 34.64% 17.65% 4.58% 3.27%
Lucky draw prize for e-
filers
61 45 40 4 3 1.974
3
39.87% 29.41% 26.14% 2.615% 1.96%
Incentive in-kind(voucher,
coupons)
69 35 43 4 2 1.922
5
45.10% 22.88% 28.10% 2.61% 1.31%
The difference between the mean score of the statements extension of filing deadline for e-filers and
faster tax refund if use e-filing is insignificant, so tax authority can treat them as equal and most
desirable incentive and decide their action accordingly. Surprisingly, less than 4% of the non e-filers
suggested lucky draw and incentive in-kind.
GFJMR Vol. 5 July-December, 2012
12
Inferential statistics
Hypothesis: - 1. There is no difference between respondents with Gender and Risk Perceived. For this
t-test was conducted, (0.064 > 0.05). Researchers can conclude that there is no difference between
Gender and risk perceived means whether male or female perceive the same level of risk while doing e-
filing.
Hypothesis:-2 There is no correlation between respondents Perceived Usefulness (Overall Performance
Expectancy and behavior intent for e-filling. From the survey result, researcher rejected the H0, means
there is correlation between that performance expectancy and Behavior intent for e-filing and degree of
correlation reported is 0.548.
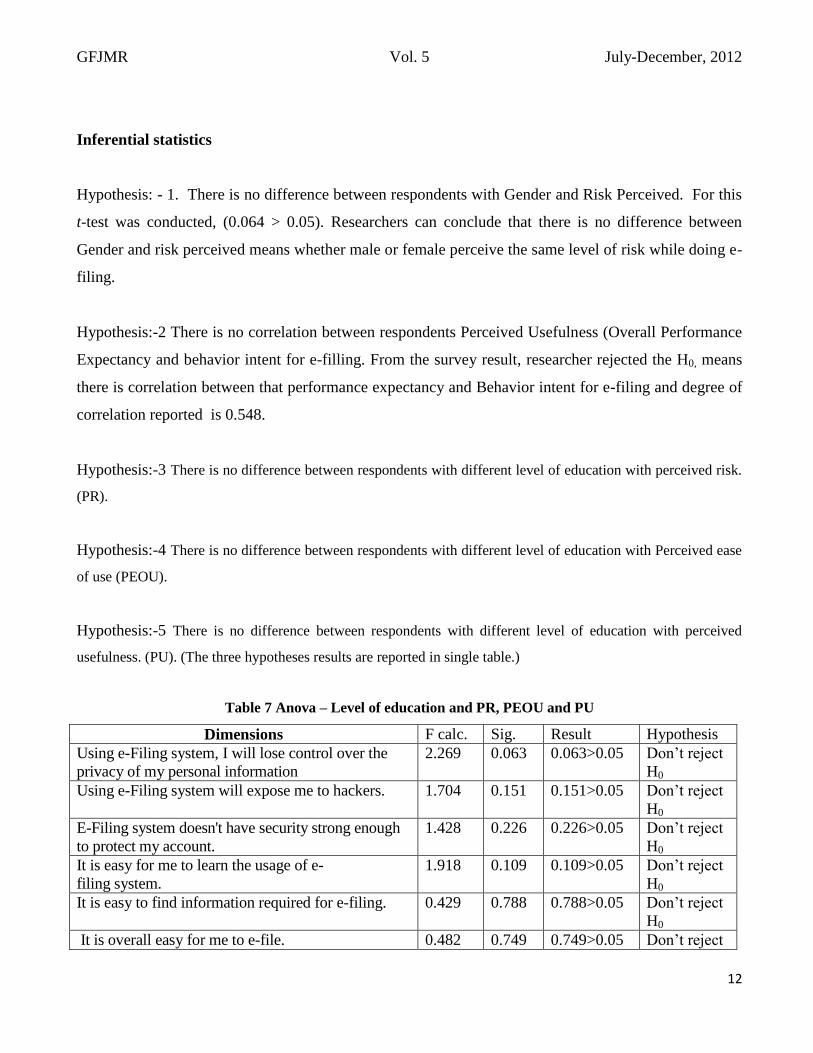
Hypothesis:-3 There is no difference between respondents with different level of education with perceived risk.
(PR).
Hypothesis:-4 There is no difference between respondents with different level of education with Perceived ease
of use (PEOU).
Hypothesis:-5 There is no difference between respondents with different level of education with perceived
usefulness. (PU). (The three hypotheses results are reported in single table.)
Table 7 Anova – Level of education and PR, PEOU and PU
Dimensions F calc. Sig. Result Hypothesis
Using e-Filing system, I will lose control over the
privacy of my personal information
2.269 0.063 0.063>0.05 Don’t reject
H0
Using e-Filing system will expose me to hackers. 1.704 0.151 0.151>0.05 Don’t reject
H0
E-Filing system doesn't have security strong enough
to protect my account.
1.428 0.226 0.226>0.05 Don’t reject
H0
It is easy for me to learn the usage of e-
filing system.
1.918 0.109 0.109>0.05 Don’t reject
H0
It is easy to find information required for e-filing. 0.429 0.788 0.788>0.05 Don’t reject
H0
It is overall easy for me to e-file. 0.482 0.749 0.749>0.05 Don’t reject
GFJMR Vol. 5 July-December, 2012
13
H0
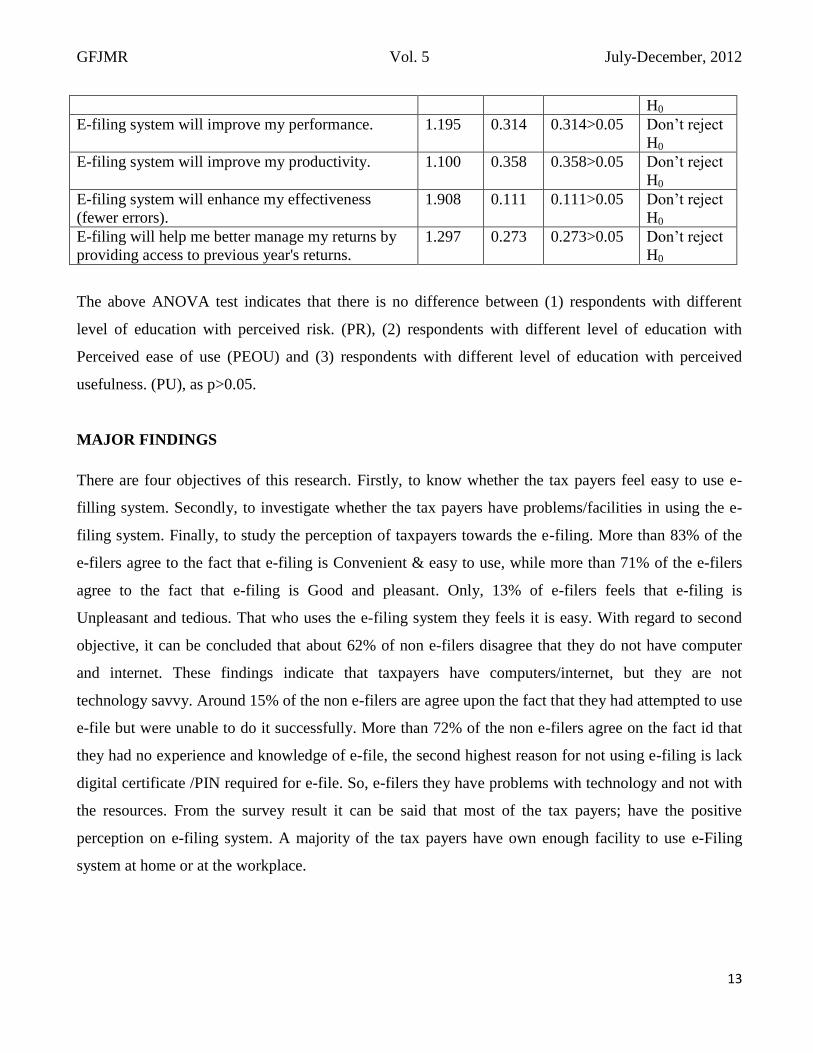
E-filing system will improve my performance. 1.195 0.314 0.314>0.05 Don’t reject
H0
E-filing system will improve my productivity. 1.100 0.358 0.358>0.05 Don’t reject
H0
E-filing system will enhance my effectiveness
(fewer errors).
1.908 0.111 0.111>0.05 Don’t reject
H0
E-filing will help me better manage my returns by
providing access to previous year's returns.
1.297 0.273 0.273>0.05 Don’t reject
H0
The above ANOVA test indicates that there is no difference between (1) respondents with different
level of education with perceived risk. (PR), (2) respondents with different level of education with
Perceived ease of use (PEOU) and (3) respondents with different level of education with perceived
usefulness. (PU), as p>0.05.
MAJOR FINDINGS
There are four objectives of this research. Firstly, to know whether the tax payers feel easy to use e-
filling system. Secondly, to investigate whether the tax payers have problems/facilities in using the e-
filing system. Finally, to study the perception of taxpayers towards the e-filing. More than 83% of the
e-filers agree to the fact that e-filing is Convenient & easy to use, while more than 71% of the e-filers
agree to the fact that e-filing is Good and pleasant. Only, 13% of e-filers feels that e-filing is
Unpleasant and tedious. That who uses the e-filing system they feels it is easy. With regard to second
objective, it can be concluded that about 62% of non e-filers disagree that they do not have computer
and internet. These findings indicate that taxpayers have computers/internet, but they are not
technology savvy. Around 15% of the non e-filers are agree upon the fact that they had attempted to use
e-file but were unable to do it successfully. More than 72% of the non e-filers agree on the fact id that
they had no experience and knowledge of e-file, the second highest reason for not using e-filing is lack
digital certificate /PIN required for e-file. So, e-filers they have problems with technology and not with
the resources. From the survey result it can be said that most of the tax payers; have the positive
perception on e-filing system. A majority of the tax payers have own enough facility to use e-Filing
system at home or at the workplace.
GFJMR Vol. 5 July-December, 2012
14
LIMITATIONS AND FUTURE RESEARCH DIRECTIONS
Few limitations must be acknowledged that suggest caution in generalization. The present study is
based on a moderate sample size and area covered are Ahmedabad and Gandhinagar therefore the
results of this study cannot be generalized. Future research could examine a wider respondent base
across the cities of Gujarat state with more diversified sample. In this study Unified Theory of
Acceptance and Use of Technology (UTAUT) scale was used. Comparison of various scales was not
attempted.
CONCLUSION AND IMPLICATIONS
Taxpayers should be encouraged to use e-filing as there are many benefits of this system (both to
government and to Taxpayers). There has been extensive advertisement in national news papers; this
can be extended to local news papers and using radio stations and local channels thru local languages.
The awareness can be best spread by introducing the e-filing in the high school or college curriculum.
The awareness can be increased by organizing awareness programs in offices/workplaces. For the older
generation who are hesitant to technology, the e-filing can influence by organizing awareness camps to
ensure that the effort expectancy, system expertise. Thus, the tax authorities should have to develop
marketing strategies to reduce and resolve the e-filing related issues.
REFERENCES:
Aboelmaged, M. G (2010) "Predicting e-procurement adoption in a developing country: An empirical
integration of technology acceptance model and theory of planned behaviour", Industrial
Management & Data Systems, Vol. 110 Iss: 3, pp.392 – 414
Amitabh Ojha, G. S (2009) "Antecedents of paperless income tax filing by young professionals in
India: an exploratory study", Transforming Government: People, Process and Policy, Vol. 3 Iss:
1, pp.65 – 90
Chau, P.Y.K., and Hu, P.J.H. (2001). "Information Technology Acceptance by Individual Professional:
A Model Comparison Approach", Decision Science, 32(4): 699-719.
Dabholkar, P. A. (1994), "Incorporating Choice In to an Attitudinal Framework: Analysing Model of
Mental Comparison Process", Journal of Consumer Research, 21: 100-118.

GFJMR Vol. 5 July-December, 2012
15
Davis, F. D. (1989), "Perceived Usefulness, Perceived Ease of Use, and User Acceptance of
Information Technology", MIS Quarterly, 13(3): 319-318.
Davis, F. D. (1993), "User Acceptance of Information Technology: System characteristics, user
perceptions and behavioural impacts", International Journal of Man-Machine Studies, 38: 475-
487.
Davis, F.D., Bagozzi, R. P., and Warshaw, P. R. (1989), "User Acceptance of Computer Technology: A
comparison of two theoretical models", Management Science, 35 (8): 982-1003.
Erard, B. (1993), "Taxation with representation: An analysis of the role of tax practitioners in tax
compliance", Journal of Public Economics, 52:163-197.
Fishbein, M., and Ajzen, I. (1975), Belief, Attitude, Intention and Behaviour: An introduction to theory
and research, Reading, MA: Addison Wesley.
Jackson, C. M., Chow, S., and Leith, R. A. (1997). "Toward an Understanding of the Behavioural
Intention to Use an Information System", Decision Sciences, 28(2): 357-389.
Kahan, S. (1998), "Is Widespread E-filing Inevitable?” The Practical Accountant, 31(11): 22-29.
Kun Chang Lee, M. K (2008) "User evaluations of tax filing web sites: A comparative study of South
Korea and Turkey", Online Information Review, Vol. 32 Iss: 6, pp.842 – 859
Lai, M. and K. Choong, 2010. Motivators, Barriers and Concerns in Adoption of Electronic Filing
System: Survey Evidence from Malaysian Professional Accountants. Am. J. Applied Sci., 7:
562-567.
Lee, E. (2002), "Merge, Acquire and Prosper", Akauntan Nasional (the Journal of Malaysian Institute
of Accountants), 15(6): 12-17.
Legris, P., Ingham, J., and Collerette, P. (2003), "Why Do People Use Information Technology? A
Critical Review of the Technology Acceptance Model", Information and Management, 40: 191-
204.
Lemuria Carter, L. C (2011) "The role of security and trust in the adoption of online tax filing",
Transforming Government: People, Process and Policy, Vol. 5 Iss: 4, pp.303 – 318
Mick, D. G., and Fournier, S. (1998), "Paradoxes of Technology: Consumer cognisance, emotions and
coping strategies", Journal of Consumer Research, 25(2): 123-143.
Newsberry, K. J., Reckers, P. M. J., and Wyndelts, R. W. (1993), "An Examination of Tax Practitioner
Decisions: The role of preparer sanction and framing effects associated with client condition",
Journal of Economic Psychology, 14(2): 439-452.

GFJMR Vol. 5 July-December, 2012
16
Parasuraman, A. (2000), "Technology Readiness Index (TRI): A Multiple-Item Scale to Measure
Readiness to Embrace New Technologies", Journal of Service Research, 2(4): 307-320.
Ramlah Hussein, N. M. (2011) "E-government application: an integrated model on G2C adoption of
online tax", Transforming Government: People, Process and Policy, Vol. 5 Iss: 3, pp.225 – 248
Reyes Gonzalez, J. G (2007) "E-government success: some principles from a Spanish case study",
Industrial Management & Data Systems, Vol. 107 Iss: 6, pp.845 – 861
Rotchanakitumnuai S. (2008) "Measuring e-government service value with the E-GOVSQUAL-RISK
model", Business Process Management Journal, Vol. 14 Iss: 5, pp.724 – 737
Sheppard, B. H., Hartwick, J., and Warshaw, P. R. (1988), "The Theory of Reasoned Action: A Meta-
Analysis of Past Research with Recommendations for Modifications and Future Research",
Journal of Consumer Research, 15(3): 325-343.