an economic analysis
TRANSCRIPT

An Economic Analysis: The PEO Industry Footprint in 2018
Laurie Bassi and Dan McMurrerMcBassi & Company
September 2018


Introduction
An Economic Analysis: The PEO Industry Footprint in 2018Laurie Bassi and Dan McMurrer, McBassi & Company
September 2018
Professional employer organizations (PEOs) provide comprehensive HR solutions
for small and mid-sized businesses. Payroll, employee benefits, HR, workers’
compensation, and risk management are some of the many services PEOs provide
to businesses across the country. As the research in our previous white papers has
shown, those businesses enjoy a better chance of survival, higher growth rates,
lower employee turnover, and higher employee satisfaction.
PEOs produce these benefits for their clients by providing them with a broad
array of cost-effective HR offerings. This enables their clients to concentrate on
growing their businesses, while offering superior benefits and HR practices to their
employees. As a result, PEO clients are able to provide their employees with a better
value proposition, and employees respond in kind by helping their employers grow
their businesses.
Given the win-win proposition that PEOs create for employers and their
employees, it is no surprise that as awareness increases, PEOs are becoming a large
and growing force. This paper provides new, definitive measures of the current size,
scope, and footprint of the PEO industry.
At the end of 2017, the 907 PEOs in the United States employed a total of 3.7
million worksite employees (WSEs), who were paid a total of $176 billion. These
employees worked for approximately 175,000 different PEO clients. The discussion
that follows elaborates on these findings.
The methodology used for this research is summarized in the second half of the
paper. In a nutshell, first we used multiple sources to identify all PEOs operating
in the United States. We then calculated the total size of the industry, using best
available methods to estimate the size of individual PEOs when limited or no data
was available. Finally, we used available data on year-over-year changes in size
among individual PEOs to estimate changes in the size of the industry since 2008.
Please note: The methodology used throughout is intentionally conservative. It is
likely, for example, that some small number of PEOs were not included in the sources
available to us and thus were not included in the industry size estimates. To the extent
this is the case, the actual industry size would be underestimated accordingly.
1
Contents
2
Size of the PEO Industry
3
How We Made the Calculations
4
Calculating Industry Size
6
Calculating Changes in Industry Size
8
About McBassi & Company

Size of the PEO IndustryThe 3.7 million WSEs employed by PEOs earned a total of $176 billion. They
represent 12.1 percent of all employment by private sector employers that have 10
to 99 employees (chosen because this is the size range of most PEO clients)1 and 2.4
percent of civilian employment in the United States.2
The total employment represented by the PEO industry is roughly the same as
the combined number of employees for Walmart (United States only), Amazon, IBM,
FedEx, Starbucks, AT&T, Wells Fargo, Apple, and Google.3 Those companies include
the two largest retailers, the largest technology company, the largest transportation
company, the largest telecommunications provider,
the largest financial services firm, the largest specialty
restaurant chain, plus the two most highly valued
firms in the world based on stock market valuation.
The PEO industry’s 175,000 clients represent 15
percent of all employers with 10 to 99 employees.4
There are 907 PEOs in total. In terms of context, the
five largest PEOs account for an estimated 43 percent
of the PEO industry’s 3.7 million WSEs. The next 25
largest firms account for an additional 22 percent of
the industry’s WSEs.
Change Since 2008Between 2008 and 2017, the number of WSEs
employed in the PEO industry grew at a compounded
annual rate of 8.3 percent, based on applying “same-
2
1 Based on comparison of PEO WSEs with U.S. Bureau of Labor
Statistics data on employment level by firm size for 2017 at
www.bls.gov/web/cewbd/table_f.txt. For the purpose of these
calculations, we used firms with 10 to 99 employees.
2 Based on comparison of PEO WSEs with total employed civilian
labor force from the U.S. Bureau of Labor Statistics Current
Population Survey, www.bls.gov/cps/cpsaat01.pdf.
3 Because it is difficult to obtain employment breakdowns by
country for most large publicly traded companies, all numbers
except Walmart are for worldwide employees. Walmart data is
from https://corporate.walmart.com/newsroom/company-facts;
data for all other companies is from Yahoo Finance, (accessed
August 7, 2018, with numbers based on companies’ annual public
reporting). Company-specific employment is as follows: Walmart
(US) 1,500,000; Amazon 580,000; IBM 370,000; FedEx 290,000;
Starbucks 280,000; AT&T 270,000; Wells Fargo 250,000; Apple
100,000; Google 90,000.
4 Based on comparison of PEO clients with total number of firms
with 10 to 99 employees from U.S. Bureau of Labor Statistics,
www.bls.gov/web/cewbd/table_g.txt.
PEO Industry at a Glance: Comparative Total
Employment
Size of the PEO Industry
Key Statistics

5 This estimate is based on calculating annually “same-store” PEO growth rate (i.e., growth for those
PEOs for which we had data for both the current year being calculated and the previous year).
Hence, this estimate excludes any specific growth effects of PEOs that were involved in mergers or
acquisitions, as well as the impact of the formation of new PEOs, and the departure of PEOs that went
out of business. Because the data for the same-store calculations come from NAPEO members’ 941
filings from 2008 to 2017, the estimate also assumes that the extent to which NAPEO members are
representative of the PEO industry as a whole has remained roughly constant during those years.
6 The PEO growth rate compared to the growth rate in employment (0.6 percent compounded annual increase)
from the U.S. Bureau of Labor Statistics (Current Population Survey) at www.bls.gov/cps/cpsaat01.xlsx.
store” sales estimates.
Figure 1 shows overall
industry growth from
year to year, with the
dotted line representing
the linear trend since
2008.5 The compounded
annual growth rate
of the PEO industry is
roughly 14 times higher
than the compounded
annual growth rate of
employment in the
economy overall during
the same period.6
The best available
evidence indicates that
the actual number of
PEOs has been relatively
stable over the past few years (907 in 2017), with the number of newly formed
PEOs being approximately offset by the number of PEOs that have merged, been
acquired, and/or gone out of business.
How We Made the CalculationsThis section provides additional background on how we calculated the summary
statistics provided in the previous section, as well as additional details and
breakdowns on some of the specific statistics.
The methodology used for this paper was wholly different from the methodology
employed for our 2015 NAPEO white paper on the industry footprint. This analysis
was built through an exhaustive assessment of data down to the individual PEO
level, drawn from a variety of sources (many of which included business-sensitive
3
How We Made the Calculatons
Figure 1: Estimated number of WSEs covered by PEOs from year to year, 2008 to
2017.

information provided under condition of confidentiality). We view this as a definitive
look at the current size of the industry given all available data.7
Calculating Industry SizeWe used the five-step process described below to calculate the size of the PEO
industry.
1. Identify all PEOs in the industry;
2. Estimate their relative size using available data on:
— WSE wages; and
— # WSEs;
3. Use established ratios (NAPEO member data and NAPEO’s Financial Ratio and
Operating Statistics (FROS) Survey were the two sources from which these
ratios were drawn) to make analytically responsible estimates of wages and/or
number of WSEs by PEO, as necessary;
4. Check and validate existing data; and
5. Adjust underlying data that has varying periodicity (quarterly, annually, point-in-
time) to account for employee turnover, ensuring consistency across data sources
and making possible both a point-in-time estimate of total WSEs (to compare with
the size of the national labor force) and an annual total for WSE wages.
Step #1—Identify all PEOs in the industry
We created a consolidated database of PEOs by combining PEO lists from the
following sources:
• Current NAPEO members;
• Employer Services Assurance Corporation (ESAC)-accredited members;
• NAPEO/ESAC-created list of additional PEOs, derived from sources including
state databases;
• PRISM HR client list;
• Slavic 401(k) clients; and
• McBassi PEO benchmarking survey.
We removed from the combined list those companies that we deemed unlikely
to be current PEOs. Firms meeting the following criteria were removed (67 total were
removed):
• No email address and letter mailed to physical mailing address was returned to
sender as undeliverable (34 companies);
• Company name is inconsistent with PEO work and review of website or other
online information also suggests company is not engaged in PEO work (32
companies); and
4
Calculating Industry Size
7 It is also useful to note that the size estimates from this analysis are quite consistent with the 2015
estimates after accounting for annual growth in the industry since that previous analysis.

• Company directly informed us via email that
it is not a PEO (one company).
Step #2—Calculate the size of PEOs identified in Step #1 for which there is known data (465 PEOs)
We used the following information and data
sources:
1. NAPEO Form 941 data (quarterly wages,
WSEs);
2. McBassi PEO benchmarking survey (annual wages, point-in-time WSEs);
3. Clients of McHenry Consulting and/or Stonehenge Insurance (WSEs);
4. ESAC-accredited members (annual wages, WSEs; broken out for only PEOs
that are not NAPEO members and for whom we therefore did not have 941
data);
5. PRISM HR clients (aggregated WSEs; adjusted to eliminate double-counting of
PEOs for which data are available from other sources);
6. Size information provided by Dan McHenry on selected other PEOs (WSEs); and
7. Slavic 401(k) clients (includes WSEs for retirement plan participants only;
adjusted accordingly).
Step #3—Use established ratios to estimate missing data as necessary
A. We estimated missing WSE # or WSE wages for the 235 PEOs for which
direct data was available for only one of the two key measures (i.e., those
PEOs that are not NAPEO members or did not participate in the McBassi PEO
benchmarking survey). In most cases, we applied what we believe to be the
best available data source: the ratio of $36,688 in wages per WSE for the 177
NAPEO firms for which we have both 2017 wages and WSE numbers (this is
drawn from 219 firms, from which we eliminated the top and bottom 10 percent
to remove the impact of outliers).
B. We estimated the size of PEOs identified in Step #1 for which we have no
specific data by applying the following estimates to the remaining “unknown”
PEOs (442 PEOs):
— 775 WSE per PEO—based on FROS “smallest firms” (fewer than 1,500
WSEs) mean (based on the assumption that most of the “unknown” PEOs
would fall into the smallest size group); and
— $36,688 per WSE—based on the same NAPEO ratio listed in Step #3A.
Step #4—Check and validate existing data
We adjusted certain data for specific PEOs based on what seemed to be erroneous
data entry (identified typically by extreme outliers on wage/WSE ratios).
5
Calculating Industry Size
We are grateful to the following individuals for their
invaluable assistance in the preparation of this research
report: Craig Babigian of PrismHR, Kerry Brooks and
Jane McCoggins of the Employer Services Assurance
Corporation (ESAC), Denise King of NAPEO, Dan McHenry
of McHenry Consulting, Troy Reynolds of Stonehenge
Insurance Solutions, and John Slavic of Slavic401K.

Step #5—Adjust underlying data that has varying periodicity
We also used U.S. Bureau of Labor Statistics data from the Job Openings and Labor
Turnover Survey on total monthly job separations (i.e., a measure of job turnover)
to adjust the annual (ESAC) and quarterly (NAPEO) WSE numbers to represent
point-in-time estimates. (In other words, because quarterly and annual counts of a
PEO’s WSEs would be higher than the number of WSEs at any single point in time
due to turnover in job positions, we adjusted the quarterly and annual numbers for
turnover.)
Final size estimates
After completing the five steps listed above, our final estimates for industry size are:
• 3,700,370 WSEs represented at a single point in time (Q4 2017) by PEOs8
— This is 2.4 percent of 2017 civilian employment in the United States
• $176,088,387,916 in wages for those WSEs9
• 907 PEOs10
• 174,545 PEO clients11
Calculating Changes in Industry Size
Underlying data
We used Form 941 wage data on NAPEO members to calculate same-store
changes in wages for each year from 2008 to 2017 (same-store refers to any PEO
that was in business for two consecutive years within that period).
As noted in Footnote 5, making these estimates back to 2008 requires some
important assumptions. Importantly, it excludes any specific growth effects of PEOs
that were involved in mergers or acquisitions, as well as the impact of the formation
of new PEOs and the departure of PEOs that went out of business. Because the
data for the same-store calculations come from NAPEO members’ 941 filings, the
estimate also assumes that the extent to which NAPEO members are representative
of the PEO industry as a whole has remained roughly constant from 2008 to 2017.
Here’s how the change estimates were calculated: We used Form 941 wage data
(from 2008 to 2017, excluding 2010, which was unavailable) on NAPEO members
to calculate same-store changes in wages for each year from 2009 to 2017. For
example, we calculated changes in total wages from 2015 to 2016 for each PEO for
which we have valid data in both 2015 and 2016, and then took the average across
all available PEOs for those years in order to identify the change rate for the industry
6
Calculating Changes in Industry Size
8 This is the aggregated total of all WSEs across the PEOs in our database. (It includes a total of 2,488,151
WSEs among NAPEO members, representing 1.6 percent of 2017 civilian employment in the United
States.).
9 This is the aggregated total of all wages across the PEOs in our database.
10 Count of all PEOs in our combined database.
11 Calculated by applying the 2017 NAPEO Financial Survey average of 21.2 worksite employees per client
to the total number of worksite employees represented by PEOs.

overall in 2016. The number of PEOs for which we had data available to calculate
same-store changes in a given year ranged from 175 to 250.
Data for any PEO that was flagged by NAPEO as having been involved in a
merger/acquisition for at least one of the two years in the pair was not included in
calculating average changes for any year affected. For example, a company involved
in a merger in 2016 was excluded from calculating 2015 to 2016 changes and also
from calculating 2016 to 2017 changes.12
There were notable outliers in the data across all of the years. To reduce/
eliminate their impact, we excluded the top and bottom 10 percent of the
distribution when calculating means.
Adjusting for the effects of inflation
We then adjusted these calculations to account for the annual rate of wage inflation
in the economy as a whole. For example, if average same-store wage growth was
9.0 percent, but wage
inflation in the US
overall was 2.0 percent,
then the adjusted same-
store PEO wage growth
was 7.0 percent.
The results show
an industry with an
average compounded
annual growth rate of
8.3 percent from 2008
to 2017, with specific
annual inflation-
adjusted wage growth
rates shown in Figure 2.
The change is positive
in all years (ranging
from 4 to 14 percent
annually) indicating that
the industry has grown each year included in the analysis. Although the growth rate
in 2017 fell below the average growth rate for 2008 to 2017, the average growth rate
over the entire period was increasing slightly over time (see the dotted trend line
below).
By iteratively applying the annual change data to number of WSEs (starting with
our current estimates for 2017 and then working backward),13 we are able to estimate
7
Calculating Changes in Industry Size
12 NAPEO also flagged several other PEOs as having been involved in a merger/acquisition, but with year
unknown. These PEOs were excluded from all year-pairs.
13 We applied the 2017 inflation-adjusted change rate to the 2017 estimate for number of WSEs to
estimate total WSEs in 2016. We then applied the 2016 inflation-adjusted change rate to that 2016
estimate to calculate 2015 WSEs, etc.
Figure 2. Mean growth rate and trendline, WSE inflation-adjusted wages from
previous year.
same-store PEO WSE
growth from 2008 to
2017, yielding the results
shown in Figure 1. (It
should be noted that, in
a separate analysis, we
examined actual WSE
growth for same-store
PEOs for 2016-2017.
This analysis yielded a
comparable estimate
of WSE growth for 2016
to 2017 as the one we
derived from using the
wage-based growth
calculations back to
2008.)
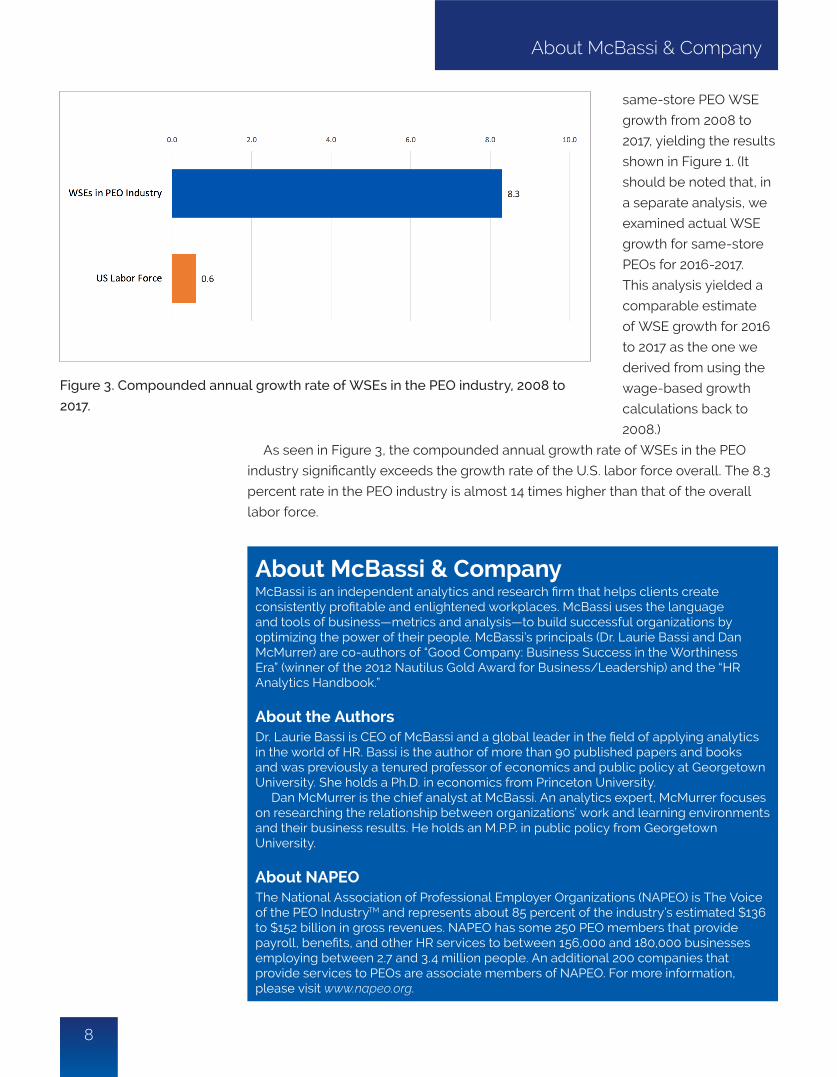
As seen in Figure 3, the compounded annual growth rate of WSEs in the PEO
industry significantly exceeds the growth rate of the U.S. labor force overall. The 8.3
percent rate in the PEO industry is almost 14 times higher than that of the overall
labor force.
8
About McBassi & Company
Figure 3. Compounded annual growth rate of WSEs in the PEO industry, 2008 to
2017.
About McBassi & CompanyMcBassi is an independent analytics and research firm that helps clients create consistently profitable and enlightened workplaces. McBassi uses the language and tools of business—metrics and analysis—to build successful organizations by optimizing the power of their people. McBassi’s principals (Dr. Laurie Bassi and Dan McMurrer) are co-authors of “Good Company: Business Success in the Worthiness Era” (winner of the 2012 Nautilus Gold Award for Business/Leadership) and the “HR Analytics Handbook.”
About the AuthorsDr. Laurie Bassi is CEO of McBassi and a global leader in the field of applying analytics in the world of HR. Bassi is the author of more than 90 published papers and books and was previously a tenured professor of economics and public policy at Georgetown University. She holds a Ph.D. in economics from Princeton University.
Dan McMurrer is the chief analyst at McBassi. An analytics expert, McMurrer focuses on researching the relationship between organizations’ work and learning environments and their business results. He holds an M.P.P. in public policy from Georgetown University.
About NAPEOThe National Association of Professional Employer Organizations (NAPEO) is The Voice of the PEO IndustryTM and represents about 85 percent of the industry’s estimated $136 to $152 billion in gross revenues. NAPEO has some 250 PEO members that provide payroll, benefits, and other HR services to between 156,000 and 180,000 businesses employing between 2.7 and 3.4 million people. An additional 200 companies that provide services to PEOs are associate members of NAPEO. For more information, please visit www.napeo.org.


September 2018
National Association of Professional Employer Organizations707 North Saint Asaph StreetAlexandria, VA 22314703/836-0466www.napeo.org
NAPEO White Paper Series