an asset management strategy for northern ireland · pdf filean asset management strategy for...
TRANSCRIPT
An Asset Management Strategy for Northern
Ireland Housing Executive – Tower Blocks
September 2015
Prepared with support from:
Savills (UK) Limited
33 Margaret Street
London
W1G 0JD

Contents 1. Introduction and Context .........................................................................................................
......................................................................................................
....................................................................................................................
..............................................................................................
.................................................................................
................................................................................
............................................................................................................
................................................................
3
2. Demand and Sustainability 5
3. Portfolio Summary 9
4. Asset Performance Evaluation 13
5. Developing Active Asset Management 20
6. Developing the Tower Block Action Plan 24
7. Monitoring and review 26
Appendix 1: Location of Tower Blocks.............................................................................................
..............................................................
................................................................................................
27
Appendix 2: Analysis of Void rates across Tower Blocks 28
Appendix 3: Fuel Poverty Indicators and SAP Ratings……………………………………………..…30
Appendix 4: Interim Investment Plan 31
Appendix 5: Illustrative programme of option appraisal 32
NIHE 2 September 2015
Asset Management Strategy Tower Blocks
1. Introduction and Context
1.1 This strategy forms an integral part of the overall Landlord Asset Management Strategy
developed in 2015 for the whole of NIHE’s stock. This element of the strategy sets out more
detailed information in relation to our Tower Blocks and sets out the key principles for taking an
asset management approach specifically for these properties. The reasons for this separate
approach are twofold:
to respond to requests for a standalone Tower Block strategy by the Department for
Social Development, and
because the outputs of the work on tower blocks arising from the Asset Management
Commission are so notably different from the rest of the stock
1.2 As such it is not the intention to repeat the key elements of explanation contained within the
main strategy but rather to set out the specific and challenging issues which have been brought
into clear focus by the work of the Asset Management Commission.
1.3 The Tower Block housing stock comprises 32 blocks with 1,912 individual properties, of which
1,629 are tenanted, 8 are used for other purposes such as caretakers offices, and 275 are sold
leasehold units. The locations of blocks are shown on the map at Appendix 1.
1.4 The blocks are predominantly located in Belfast and surrounding areas with the exception of
one block in Larne. Although there are 32 blocks in total these are grouped into recognised
housing estates. For the purposes of this strategy information is provided individually for each
block but these form part of groupings as set out below and used throughout on a consistent
basis:
Table 1: Locations and scale of Tower Block Estates
Blocks No of Blocks Total Stock Location
1 Carlisle 7 Blocks 384 North Belfast
2 Dales & Moynes 5 Blocks 280 Dunmurry
3 Rathcoole 4 Blocks 246 Newtownabbey
4 Cregagh 3 Blocks 160 East Belfast
5 Mount Vernon 2 Blocks 138 North Belfast
6 Finaghy 2 Blocks 112 South Belfast
7 Rushpark 2 Blocks 112 Newtownabbey
8 Belvoir 2 Blocks 112 South Belfast
9 Divis Stand Alone Block 93 West Belfast
10 Latharna Stand Alone Block 90 Larne
11 Carnet Stand Alone Block 72 East Belfast
12 Clarawood Stand Alone Block 57 East Belfast
13 Whincroft Stand Alone Block 56 East Belfast
Total 32 Blocks 1912
NIHE 3 September 2015
Asset Management Strategy Tower Blocks
1.5 As we have done with the rest of our stock in preparing our new Asset Management Strategy,
we have collected data on income and expenditure associated with the blocks projected over
the next thirty years and have discounted the resultant cash flows back to a value in today’s
terms to produce a net present value (NPV) for each block. This NPV is a measure of the
worth of each block’s cash flows to our long term financial plan, and is in effect a measure of
‘financial performance’.
1.6 Although the Tower Blocks represent only 1.9% of our total housing stock they account for
some 32% of the overall negative NPVs within the stock (i.e. there are some 38,000 properties
with an overall negative financial contribution of -£293million, of which -£93million comes from
Tower Blocks alone). For the purposes of Asset Performance Evaluation (APE) the entire stock
was split into 509 separate asset groups in order to create a sufficiently detailed picture on
which to base decisions; when the financial results of these 509 groups are set out in order of
the most expensive to the least expensive the Tower Blocks occupy 32 of the top 33 places.
1.7 These figures indicate a seriously disproportionate and detrimental impact on the long term
finances of the landlord
1.8 The Asset Performance Evaluation is explained in more detail in Chapter 4 but the very poor
results for the Tower Blocks arise in general because:
The Tower Blocks are the most expensive type of stock to improve
They are the most expensive type to manage
They incur above average repairs costs
Their rents are among the lowest of any category of stock
They have higher than average void rates
1.9 The costs of investment identified by the Stock Condition Survey for the blocks average
£63,388 per unit (excluding ongoing repair and maintenance costs). In addition there are issues
of demand and substantial under-occupation of many flats.
1.10 Taken together all of these factors result in a particular picture emerging and raise fundamental
questions about the long term viability of the blocks in terms of making a valuable contribution
to the long term social housing requirements of Northern Ireland. This therefore requires that
this element of our stock is considered in isolation in terms of identifying a way forward.
1.11 The remainder of this strategy sets out the detailed information which contributes to this overall
picture and examines approaches which might be taken to address these issues in the context
of adopting an active asset management strategy.
NIHE 4 September 2015
Asset Management Strategy Tower Blocks

2. Demand and Sustainability
Current Housing Demand
2.1 Taken as a portfolio, the level of housing demand for the Tower Blocks is lower than that for
more traditional housing forms such as houses, bungalows and low rise flats.
2.2 The actual level of demand for each of the tower blocks/groups is difficult to quantify and track
as only two of the complexes - Carlisle and Mount Vernon - have their own specific waiting lists
on the Common Selection Scheme. Therefore, our Area Managers were asked to provide a
brief profile of the trends in turnover, allocations, voids and associated issues in each of the
blocks in their areas in order to inform a more detailed analysis.
2.3 The information gathered from this exercise demonstrates that the levels of tenancy turnover,
housing demand and popularity of each of the Housing Executive’s Tower Blocks (or group of
blocks) varies significantly and is a function of the interplay between a number of issues.
2.4 The main driver is the level and type of social housing need in the area in which each block or
group of blocks is located. As a general rule tower blocks in areas of high housing stress
where there is low turnover in traditional housing - such as Lower Falls, New Lodge or Belvoir
and Cregagh - will be in demand, if only because there are few other housing opportunities in
the area.
2.5 Conversely the general lack of social housing need in a location can have a severe impact on
tower blocks and call into question their future viability, illustrated by the Housing Executive’s
previous demolition of two out of three blocks in the Riverdale complex in Larne.
2.6 However, there are a number of other issues that will affect the blocks’ popularity, as the
existence of blocks experiencing low demand in otherwise high demand estates demonstrates.
These issues include:
The physical condition of each block.
The level of and reputation of some blocks for anti-social behaviour and lifestyle clashes
associated with transient tenancies.
The proportion of sold flats in a block (albeit the impact will likely vary depending on the
ratio of owner-occupation versus private renting).
2.7 Consequently there is a considerable variation in demand for the blocks ranging from the very
high demand for Divis Tower to the very low demand for Kilbroney House which, although
situated in a popular estate, has letting difficulties because of its poor condition and reputation
for anti-social behaviour.
2.8 Regardless of demand, there are some issues that are relatively consistent across most of the
tower blocks. The first is a high level of under-occupation; the housing mix across the blocks is
heavily skewed towards 4-person 2-bedroom dwellings but most housing demand comes from
small households. Many of the flats are occupied by single persons (the general paucity of
demand for tower block accommodation by families is conventionally attributed to the lack of a
tradition of high rise living in Northern Ireland and the desire for conventional housing forms).
In part this is also the result of policy decisions to stop allocations to families in some blocks.
2.9 The second issue is the unpopularity of bedsit accommodation, which generally takes longer to
re-let than flats, even in those blocks in higher demand from applicants. The incidence of
NIHE 5 September 2015
Asset Management Strategy Tower Blocks
bedsit accommodation and levels of anti-social behaviour combine in some areas to represent
barriers to letting.
2.10 The introduction of Welfare Reform would likely have significant implications for the tower
blocks, but it is difficult to be definitive on what these would be at this time. Given the current
high proportions of under-occupation across the flats, and the tendency towards single person
applicants for them, the results of the ‘bedroom tax’ may be declining demand and considerably
reduced rental income (as voids increase and tenants are unable to make up the loss of
previous Housing Benefit entitlements). However, it may also be the case that households who
are under-occupying, for example, three-bedroom houses, could be inclined to seek the smaller
accommodation in the tower blocks.
Sustainability
2.11 Over the years we have introduced a number of management initiatives to promote
sustainability in many of the blocks. These include:
The designation of some blocks for housing particular household types or age groups; for
example, local lettings policies are in place for a number of the blocks restricting
allocations to those aged over 35 only.
The provision of enhanced security infrastructure including perimeter fencing with
controlled access, CCTV, and concierge services. The latter have been introduced for
sixteen of the blocks and there is evidence from an analysis of recent voids history that
this initiative has achieved the objective of reducing turnover and increasing demand.
Tenant Satisfaction
2.12 We have not carried out a full programme of satisfaction surveys across the whole portfolio.
However, surveys have been carried out for several blocks including the Carlisle and Mount
Vernon blocks. The key messages from these surveys include:
There is a high level of under-occupation in the blocks.
There are large numbers of working age small households on benefits, leading to a very
high risk of income loss as a result of Welfare Reform.
There is a high level of residents with a long term health problem or disability (64%).
The most common reasons for staying in the blocks were because people had always
lived there, liked the area, had family connections in the area, and because of the security
There are high levels of dissatisfaction with various aspects of the heating system (type,
cost, efficiency, control), with major concerns focussed on heating and inadequate
insulation giving rise to damp and condensation
While there were varying levels of satisfaction with homes, common shared areas and the
general image of the block (from 65% - 85%) people were very happy with concierge
services. The main reasons for dissatisfaction were parking and cleanliness.
People’s views were mixed on whether the block was changing for the better, not really
changing, or getting worse, with security being cited as a reason for improvement, and
anti-social behaviour and poor door locks as reasons for things getting worse. While the
introduction of concierge was cited in some blocks as a reason for improvement, in others
NIHE 6 September 2015
Asset Management Strategy Tower Blocks
less than half of respondents reported being satisfied with the concierge service, with
discontent about visitors being unable to get through gates/doors and key fob systems not
working.
Less than a third of residents were keen to be more involved in the running of their block,
although most were keen to continue involvement through responding to surveys.
2.13 In summary, these results show several key issues that need to be considered in any analysis
of future strategy for the blocks including
Very high levels of under-occupation
High levels of dissatisfaction with insulation and heating
Mixed views on whether things were getting better or not, often linked to issues of security
and the operation of the entry systems and concierge service.
Common Themes
2.14 There are common themes associated with Tower Blocks across the UK. Typically the
accommodation is relatively unpopular compared with other forms of social housing and the
costs of management and maintenance are higher than for other stock owned by the same
landlord.
2.15 Landlords have adopted various strategies in the management of these blocks across the UK
during the last thirty years but most maintenance strategies have fallen into the following two
categories:
Maintain the blocks in their existing form, carrying out frequent inspections and repairs as
and when required. Inevitably the extent of repairs has increased as the blocks get older
and deteriorate.
Over-cladding of the blocks (having carried out any necessary repairs first) in order to
protect the fabric of the block, improve the appearance and greatly improve the thermal
performance. Various forms of over cladding have been adopted and, in the main, they
have been successful. This is an expensive option and has not been considered viable in
some cases, especially when other factors have been taken into account such as demand
and cost in use.
Two different approaches have been adopted to the delivery of over-cladding. The back-
ventilated rain screen cladding systems are a common form of cladding adopted for high
rise buildings. They are expected to provide life expectancies of thirty years although will
probably give a life span of approaching forty years. If the panels need to be replaced
this can be done so whilst re-using the cladding rails which should have a far longer life.
The alternative approach involves the installation of external wall insulation (EWI)
together with a rendered finish and is potentially a more cost effective option.
2.16 Other solutions have included
demolition of blocks in areas of low social housing demand
redevelopment with alternative forms of housing, recreating street patterns and
introducing a mix of tenures
NIHE 7 September 2015
Asset Management Strategy Tower Blocks

refurbishment and tenure conversion of blocks in high value areas to provide market sale
and market rented accommodation.
Construction of new mixed use and mixed tenure blocks
NIHE 8 September 2015
Asset Management Strategy Tower Blocks
3. Portfolio Summary
3.1 Our tower blocks date from the 1960s when they were constructed to facilitate the slum
clearance programmes and increase the provision of modern housing.
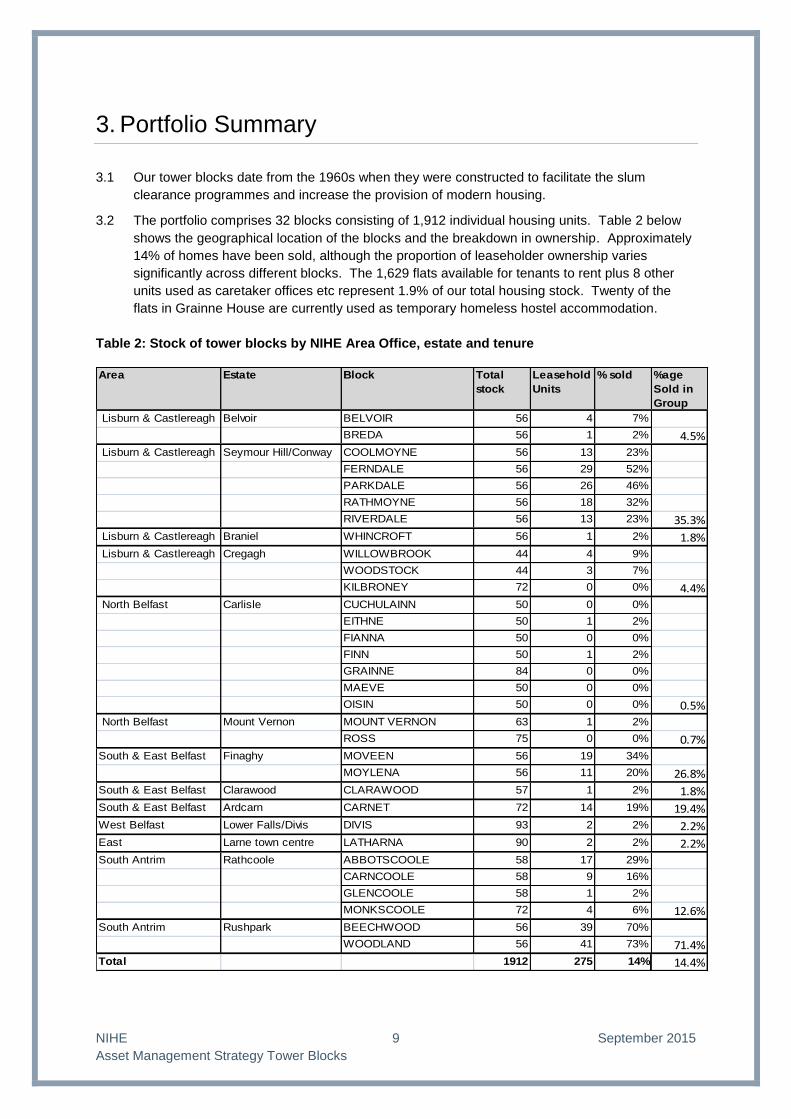
3.2 The portfolio comprises 32 blocks consisting of 1,912 individual housing units. Table 2 below
shows the geographical location of the blocks and the breakdown in ownership. Approximately
14% of homes have been sold, although the proportion of leaseholder ownership varies
significantly across different blocks. The 1,629 flats available for tenants to rent plus 8 other
units used as caretaker offices etc represent 1.9% of our total housing stock. Twenty of the
flats in Grainne House are currently used as temporary homeless hostel accommodation.
Table 2: Stock of tower blocks by NIHE Area Office, estate and tenure
Area Estate Block Total
stock
Leasehold
Units
% sold %age
Sold in
Group
Lisburn & Castlereagh Belvoir BELVOIR 56 4 7%
BREDA 56 1 2% 4.5%
Lisburn & Castlereagh Seymour Hill/Conway COOLMOYNE 56 13 23%
FERNDALE 56 29 52%
PARKDALE 56 26 46%
RATHMOYNE 56 18 32%
RIVERDALE 56 13 23% 35.3%
Lisburn & Castlereagh Braniel WHINCROFT 56 1 2% 1.8%
Lisburn & Castlereagh Cregagh WILLOWBROOK 44 4 9%
WOODSTOCK 44 3 7%
KILBRONEY 72 0 0% 4.4%
North Belfast Carlisle CUCHULAINN 50 0 0%
EITHNE 50 1 2%
FIANNA 50 0 0%
FINN 50 1 2%
GRAINNE 84 0 0%
MAEVE 50 0 0%
OISIN 50 0 0% 0.5%
North Belfast Mount Vernon MOUNT VERNON 63 1 2%
ROSS 75 0 0% 0.7%
South & East Belfast Finaghy MOVEEN 56 19 34%
MOYLENA 56 11 20% 26.8%
South & East Belfast Clarawood CLARAWOOD 57 1 2% 1.8%
South & East Belfast Ardcarn CARNET 72 14 19% 19.4%
West Belfast Lower Falls/Divis DIVIS 93 2 2% 2.2%
East Larne town centre LATHARNA 90 2 2% 2.2%
South Antrim Rathcoole ABBOTSCOOLE 58 17 29%
CARNCOOLE 58 9 16%
GLENCOOLE 58 1 2%
MONKSCOOLE 72 4 6% 12.6%
South Antrim Rushpark BEECHWOOD 56 39 70%
WOODLAND 56 41 73% 71.4%
Total 1912 275 14% 14.4%
NIHE 9 September 2015
Asset Management Strategy Tower Blocks
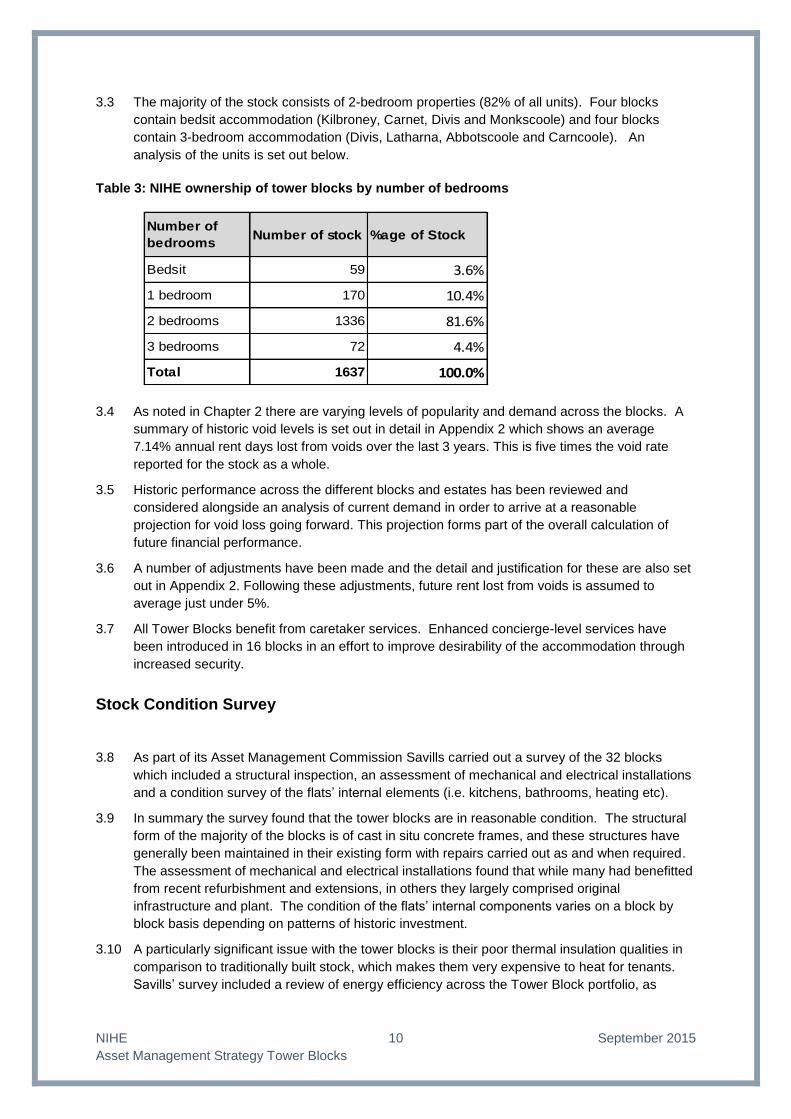
3.3 The majority of the stock consists of 2-bedroom properties (82% of all units). Four blocks
contain bedsit accommodation (Kilbroney, Carnet, Divis and Monkscoole) and four blocks
contain 3-bedroom accommodation (Divis, Latharna, Abbotscoole and Carncoole). An
analysis of the units is set out below.
Table 3: NIHE ownership of tower blocks by number of bedrooms
Number of
bedroomsNumber of stock %age of Stock
Bedsit 59 3.6%
1 bedroom 170 10.4%
2 bedrooms 1336 81.6%
3 bedrooms 72 4.4%
Total 1637 100.0%
3.4 As noted in Chapter 2 there are varying levels of popularity and demand across the blocks. A
summary of historic void levels is set out in detail in Appendix 2 which shows an average
7.14% annual rent days lost from voids over the last 3 years. This is five times the void rate
reported for the stock as a whole.
3.5 Historic performance across the different blocks and estates has been reviewed and
considered alongside an analysis of current demand in order to arrive at a reasonable
projection for void loss going forward. This projection forms part of the overall calculation of
future financial performance.
3.6 A number of adjustments have been made and the detail and justification for these are also set
out in Appendix 2. Following these adjustments, future rent lost from voids is assumed to
average just under 5%.
3.7 All Tower Blocks benefit from caretaker services. Enhanced concierge-level services have
been introduced in 16 blocks in an effort to improve desirability of the accommodation through
increased security.
Stock Condition Survey
3.8 As part of its Asset Management Commission Savills carried out a survey of the 32 blocks
which included a structural inspection, an assessment of mechanical and electrical installations
and a condition survey of the flats’ internal elements (i.e. kitchens, bathrooms, heating etc).
3.9 In summary the survey found that the tower blocks are in reasonable condition. The structural
form of the majority of the blocks is of cast in situ concrete frames, and these structures have
generally been maintained in their existing form with repairs carried out as and when required.
The assessment of mechanical and electrical installations found that while many had benefitted
from recent refurbishment and extensions, in others they largely comprised original
infrastructure and plant. The condition of the flats’ internal components varies on a block by
block basis depending on patterns of historic investment.
3.10 A particularly significant issue with the tower blocks is their poor thermal insulation qualities in
comparison to traditionally built stock, which makes them very expensive to heat for tenants.
Savills’ survey included a review of energy efficiency across the Tower Block portfolio, as
NIHE 10 September 2015
Asset Management Strategy Tower Blocks
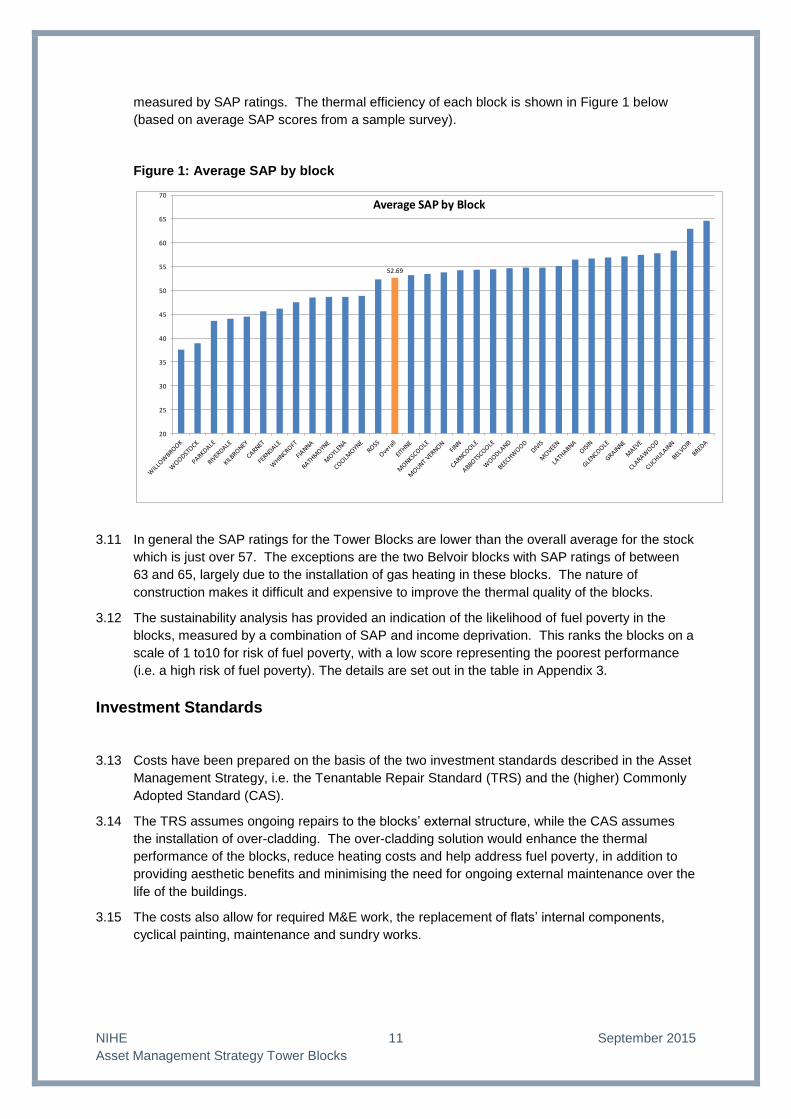
3.11 In general the SAP ratings for the Tower Blocks are lower than the overall average for the stock
which is just over 57. The exceptions are the two Belvoir blocks with SAP ratings of between
63 and 65, largely due to the installation of gas heating in these blocks. The nature of
construction makes it difficult and expensive to improve the thermal quality of the blocks.
3.12 The sustainability analysis has provided an indication of the likelihood of fuel poverty in the
blocks, measured by a combination of SAP and income deprivation. This ranks the blocks on a
scale of 1 to10 for risk of fuel poverty, with a low score representing the poorest performance
(i.e. a high risk of fuel poverty). The details are set out in the table in Appendix 3.
Investment Standards
3.13 Costs have been prepared on the basis of the two investment standards described in the Asset
Management Strategy, i.e. the Tenantable Repair Standard (TRS) and the (higher) Commonly
Adopted Standard (CAS).
3.14 The TRS assumes ongoing repairs to the blocks’ external structure, while the CAS assumes
the installation of over-cladding. The over-cladding solution would enhance the thermal
performance of the blocks, reduce heating costs and help address fuel poverty, in addition to
providing aesthetic benefits and minimising the need for ongoing external maintenance over the
life of the buildings.
3.15 The costs also allow for required M&E work, the replacement of flats’ internal components,
cyclical painting, maintenance and sundry works.
measured by SAP ratings. The thermal efficiency of each block is shown in Figure 1 below
(based on average SAP scores from a sample survey).
Figure 1: Average SAP by block
52.69
20
25
30
35
40
45
50
55
60
65
70
Average SAP by Block
NIHE 11 September 2015
Asset Management Strategy Tower Blocks
Cost Profiles: Investment Programme
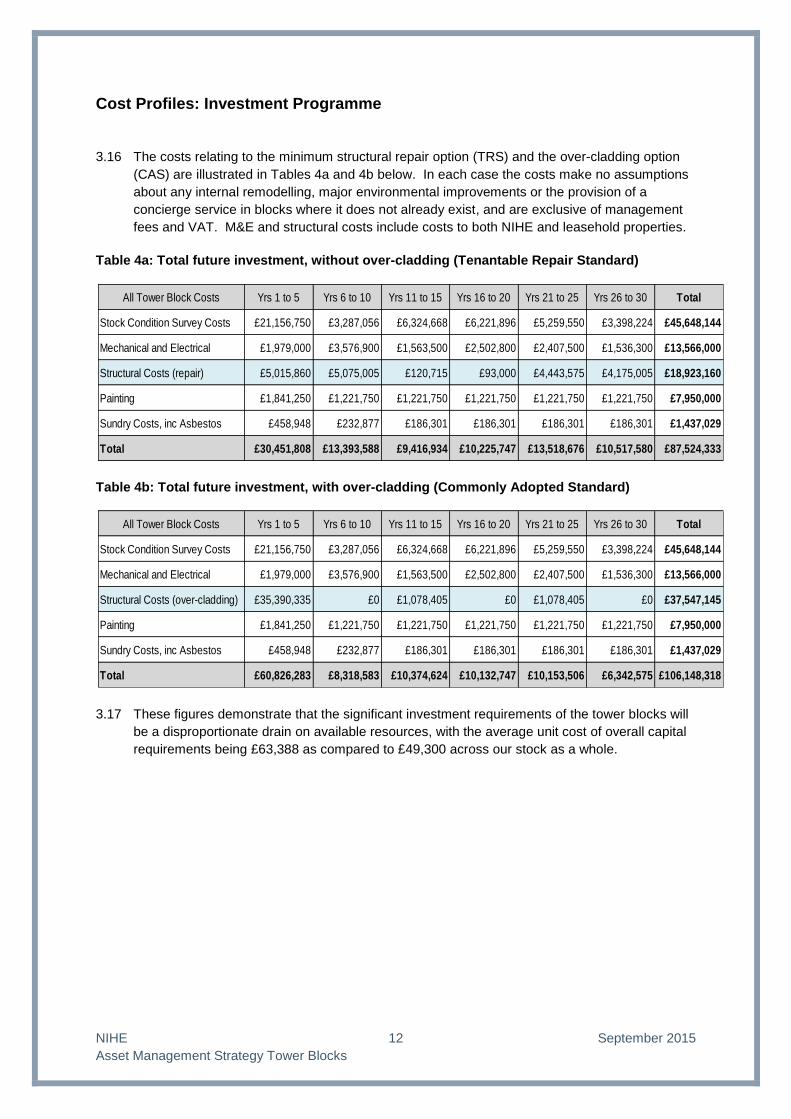
3.16 The costs relating to the minimum structural repair option (TRS) and the over-cladding option
(CAS) are illustrated in Tables 4a and 4b below. In each case the costs make no assumptions
about any internal remodelling, major environmental improvements or the provision of a
concierge service in blocks where it does not already exist, and are exclusive of management
fees and VAT. M&E and structural costs include costs to both NIHE and leasehold properties.
Table 4a: Total future investment, without over-cladding (Tenantable Repair Standard)
All Tower Block Costs Yrs 1 to 5 Yrs 6 to 10 Yrs 11 to 15 Yrs 16 to 20 Yrs 21 to 25 Yrs 26 to 30 Total
Stock Condition Survey Costs £21,156,750 £3,287,056 £6,324,668 £6,221,896 £5,259,550 £3,398,224 £45,648,144
Mechanical and Electrical £1,979,000 £3,576,900 £1,563,500 £2,502,800 £2,407,500 £1,536,300 £13,566,000
Structural Costs (repair) £5,015,860 £5,075,005 £120,715 £93,000 £4,443,575 £4,175,005 £18,923,160
Painting £1,841,250 £1,221,750 £1,221,750 £1,221,750 £1,221,750 £1,221,750 £7,950,000
Sundry Costs, inc Asbestos £458,948 £232,877 £186,301 £186,301 £186,301 £186,301 £1,437,029
Total £30,451,808 £13,393,588 £9,416,934 £10,225,747 £13,518,676 £10,517,580 £87,524,333
Table 4b: Total future investment, with over-cladding (Commonly Adopted Standard)
All Tower Block Costs Yrs 1 to 5 Yrs 6 to 10 Yrs 11 to 15 Yrs 16 to 20 Yrs 21 to 25 Yrs 26 to 30 Total
Stock Condition Survey Costs £21,156,750 £3,287,056 £6,324,668 £6,221,896 £5,259,550 £3,398,224 £45,648,144
Mechanical and Electrical £1,979,000 £3,576,900 £1,563,500 £2,502,800 £2,407,500 £1,536,300 £13,566,000
Structural Costs (over-cladding) £35,390,335 £0 £1,078,405 £0 £1,078,405 £0 £37,547,145
Painting £1,841,250 £1,221,750 £1,221,750 £1,221,750 £1,221,750 £1,221,750 £7,950,000
Sundry Costs, inc Asbestos £458,948 £232,877 £186,301 £186,301 £186,301 £186,301 £1,437,029
Total £60,826,283 £8,318,583 £10,374,624 £10,132,747 £10,153,506 £6,342,575 £106,148,318
3.17 These figures demonstrate that the significant investment requirements of the tower blocks will
be a disproportionate drain on available resources, with the average unit cost of overall capital
requirements being £63,388 as compared to £49,300 across our stock as a whole.
NIHE 12 September 2015
Asset Management Strategy Tower Blocks
4. Asset Performance Evaluation
4.1 The Asset Performance Evaluation modelling is intended to inform an investment strategy
based on an active asset management approach where we make investment decisions that are
informed by an understanding of the financial performance of the stock and the extent to which
it delivers wider social housing objectives.
4.2 The evaluation of the performance of the stock has therefore included a financial evaluation -
based on income and expenditure associated with the assets - combined with non-financial
measures of broader neighbourhood sustainability measured against our key Landlord
objectives of Quality Services, Better Homes and Vibrant Communities.
4.3 From this it is possible to identify the stronger and weaker performing assets to inform a future
asset management strategy for the portfolio. The results of this modelling need to be
considered in the context of the broader Asset Management Strategy for all of our stock.
Analysis of Financial performance
4.4 The evaluation of financial performance has been undertaken by calculating the net present
value (NPV) of the projected 30 year income and expenditure relating to each of the blocks.
This provides an assessment of the worth of the cash flows to the overall business plan.
4.5 The analysis is based on data from the results of the stock condition survey carried out by
Savills and from our current budgets (we have worked closely with Savills to extract information
from current housing management systems and budgets and to agree its treatment in the
model). This data therefore includes income from rents and service charges, rent lost from
voids, the costs of day-to-day management and maintenance, and the future investment needs
of the stock.
4.6 Two sets of NPVs have been calculated for the Tower Blocks based on the two investment
standards described in Chapter 3 i.e. the structural repair option and the over-cladding option.
Overall the tower blocks have a combined NPV of:
-£69.6m based on the structural repair option
-£93.5m based on the over-cladding option
4.7 The negative NPVs of the Tower Blocks have a disproportionate impact on the overall NPV of
the entire stock’s operating cash flows. Tower Blocks represent only 1.9% of total stock but
their combined NPVs make up 32% of the overall negative NPVs. These negative values show
that the high rise blocks would therefore require a very significant and ongoing subsidy from the
broader business plan or elsewhere in order to fund the investment profile identified by the
survey work.
4.8 The range of financial performance by block is illustrated in Figure 2 below:
NIHE 13 September 2015
Asset Management Strategy Tower Blocks

Figure2: NPV per unit – Tower Blocks (over-cladding option)
4.9 Although there is a range of financial performance across the portfolio, all of the tower blocks
have a negative NPV. This ranges from just under -£90,000 per unit at Maeve, Eithne and Finn
Houses to -£35,000 per unit at Latharna and Coolmoyne Houses. These figures compare to an
average NPV per unit across our housing stock of +£128.
4.10 While the overall NPV of the blocks improves by nearly £24m to -£69.6m under the structural
repair option, it should be noted that even in reducing the investment standard all Tower Blocks
still show a negative NPV (as illustrated in Figure 3 below). Under this investment scenario the
best financial performance is in Coolmoyne House at -£18,600 per unit compared with the worst
performance at Maeve House at -£77,300 per unit.
Figure 3: NPV per unit – Tower Blocks (structural repair and over-cladding options)
NIHE 14 September 2015
Asset Management Strategy Tower Blocks

4.11 The range of performance under the structural repair scenario illustrates the fact that even after
reducing the future investment requirement other drivers of poor performance remain.
Key financial performance drivers
4.12 The negative NPVs for the Tower Blocks are driven by a range of factors including:
The high level of capital investment required under both standards
Higher day-to-day maintenance expenditure related to the nature of this property type
The high cost of concierge services being enjoyed by a relatively low number of units
Relatively low rents compared to the rest of the stock
No recovery of service costs from tenants, and under-recovery of service costs from
leaseholders
Assumptions made about loss of rental income from voids, due to ongoing issues of low
demand in some blocks
4.13 It should be noted that the incidence, scale and impact of these drivers varies across the
blocks.
4.14 The principal drivers of poor value are the level of future capital expenditure required and the
costs associated with the concierge service in some blocks. The scale of required investment
at the two standards has already been stated in Chapter 3. As regards concierge services, half
of the blocks have this service and, while there is evidence from an analysis of recent void
history that this initiative has achieved the objective of increasing demand, the considerable
cost of maintaining concierge services and other related servicing requirements exceeds very
substantially the level of rent and service charge income received. If management costs in
those blocks with concierge services were able to be reduced to the level of caretaker service,
their NPVs would improve in some cases by 50%, but all would still be negative.
4.15 The detrimental impact of these investment and management costs on NPVs is exacerbated by
our ability to recover such costs from tenants and leaseholders. At present we do not recover
service costs from tenants. Service charges are levied from leaseholders on a proportionate
basis for general maintenance and repairs, insurance and other services; however, in regard to
concierge services only 20% of the proportionate cost is charged.
4.16 With regard to investment costs, the financial modelling with respect to the structural repair
option assumes that the costs of this type of work are recovered as such repairs are clearly
chargeable under the flat sales lease. However, in the case of the over-cladding option, while
the lease allows for a contribution to the costs of major improvement works to be sought by the
Housing Executive from leaseholders, there is considerable uncertainty as to how effective
levying such charges would be given affordability issues and the potential for successful legal
challenge.
4.17 Total capital expenditure for the over-cladding option and mechanical and electrical works is
estimated at £32.5m, of which £4.7m is assumed to be rechargeable to leaseholders. At this
level, the average cost per leaseholder over the 30 year period would be over £17,000 (in
today’s prices), and inflation and administration fees would add to this cost burden. We have
not previously had to charge this scale of costs to leaseholders, and we have evidence to
support the view that many leaseholders were not fully aware of or ignore their liability with
regard to planned scheme costs, and have not made adequate financial provision for it. In
addition, there is no financial assistance available to leaseholders for payment of service
charges. Given our experience of challenges to lower service charges, it is likely that there will
be challenges by leaseholders to over-cladding schemes. The risk of the Housing Executive
NIHE 15 September 2015
Asset Management Strategy Tower Blocks

not being able to recover the costs of major improvement works such as over-cladding requires
to be assessed in the light of practical experience before this can be reflected in the modelling
and the NPVs improved accordingly.
4.18 It is worth noting that the potential impact of under-occupation in the blocks and Housing
Benefit changes under Welfare Reform - i.e. in possibly reducing tenants’ ability to pay their
rent - could further increase the negative NPVs.
Analysis of Social Sustainability (Non–Financial performance)
4.19 Priority in terms of action will differ depending on whether poor financially performing stock is
located within a relatively sustainable or unsustainable location.
4.20 The Social Sustainability modelling has used a range of external and internal data - covering
measures around deprivation, satisfaction, housing demand and community engagement - to
arrive at ‘social sustainability’ scores across our stock. The indicators and measures used are
illustrated below.
Table 5: Social sustainability indicators and weighting
Measure Indicator Weighting
Service impact on communities Welfare reform risk – under occupation 5%
20% of Total Welfare reform risk – rent arrears 5%
Turnover 5%
Resident satisfaction with service 5%
Better Homes Housing demand – waiting list 25%
50% of Total Fuel Poverty 12.5%
House sales 12.5%
Vibrant communities Satisfaction with place, community relations 6%
30% of Total Engaged community 6%
ASB, NINIS 6%
Combined IMD 6%
Access to services IMD 6%
4.21 It is very important to note that in nearly all cases this data is not available for groups or
individual tower blocks, and that the results obtained are those applicable to the wider areas in
which the blocks are located rather than being specific to each block. Consequently these
results need to be treated with a degree of caution.
4.22 The sustainability scores in regard to the Tower Blocks are set out in Table 6 below:
NIHE 16 September 2015
Asset Management Strategy Tower Blocks
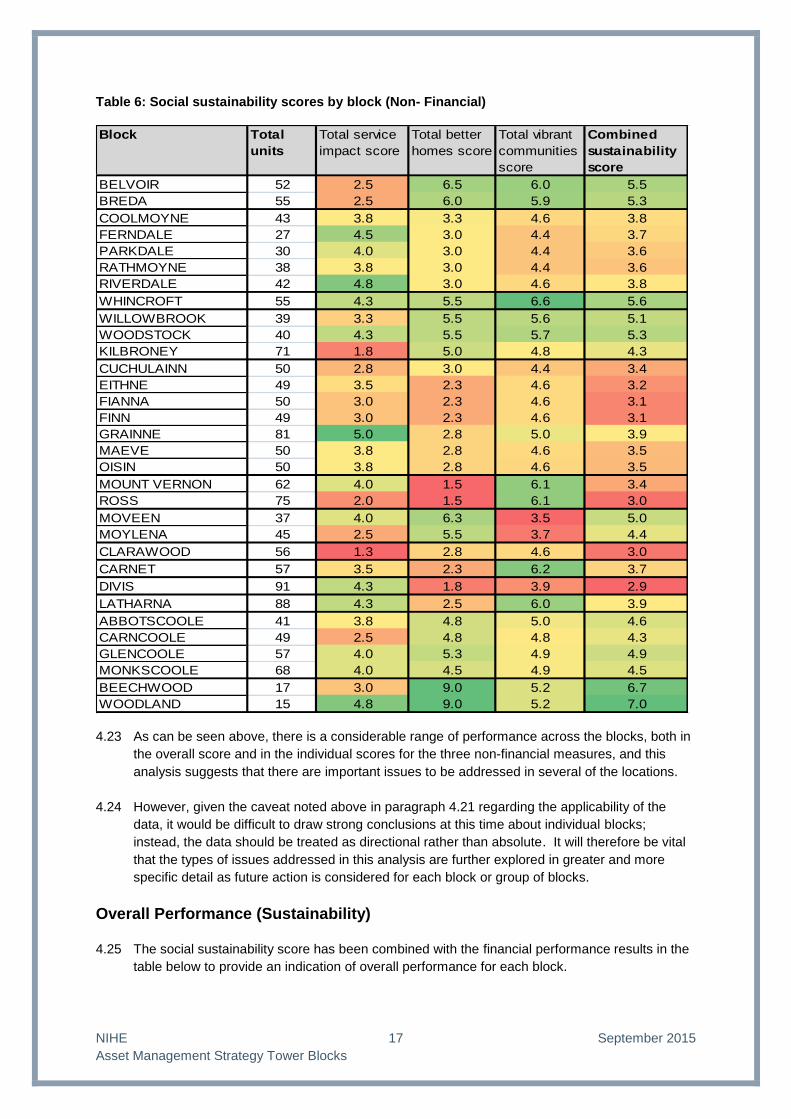
4.23 As can be seen above, there is a considerable range of performance across the blocks, both in
the overall score and in the individual scores for the three non-financial measures, and this
analysis suggests that there are important issues to be addressed in several of the locations.
4.24 However, given the caveat noted above in paragraph 4.21 regarding the applicability of the
data, it would be difficult to draw strong conclusions at this time about individual blocks;
instead, the data should be treated as directional rather than absolute. It will therefore be vital
that the types of issues addressed in this analysis are further explored in greater and more
specific detail as future action is considered for each block or group of blocks.
Overall Performance (Sustainability) 4.25 The social sustainability score has been combined with the financial performance results in the
table below to provide an indication of overall performance for each block.
Table 6: Social sustainability scores by block (Non- Financial)
Block Total
units
Total service
impact score
Total better
homes score
Total vibrant
communities
score
Combined
sustainability
score
BELVOIR 52 2.5 6.5 6.0 5.5
BREDA 55 2.5 6.0 5.9 5.3
COOLMOYNE 43 3.8 3.3 4.6 3.8
FERNDALE 27 4.5 3.0 4.4 3.7
PARKDALE 30 4.0 3.0 4.4 3.6
RATHMOYNE 38 3.8 3.0 4.4 3.6
RIVERDALE 42 4.8 3.0 4.6 3.8
WHINCROFT 55 4.3 5.5 6.6 5.6
WILLOWBROOK 39 3.3 5.5 5.6 5.1
WOODSTOCK 40 4.3 5.5 5.7 5.3
KILBRONEY 71 1.8 5.0 4.8 4.3
CUCHULAINN 50 2.8 3.0 4.4 3.4
EITHNE 49 3.5 2.3 4.6 3.2
FIANNA 50 3.0 2.3 4.6 3.1
FINN 49 3.0 2.3 4.6 3.1
GRAINNE 81 5.0 2.8 5.0 3.9
MAEVE 50 3.8 2.8 4.6 3.5
OISIN 50 3.8 2.8 4.6 3.5
MOUNT VERNON 62 4.0 1.5 6.1 3.4
ROSS 75 2.0 1.5 6.1 3.0
MOVEEN 37 4.0 6.3 3.5 5.0
MOYLENA 45 2.5 5.5 3.7 4.4
CLARAWOOD 56 1.3 2.8 4.6 3.0
CARNET 57 3.5 2.3 6.2 3.7
DIVIS 91 4.3 1.8 3.9 2.9
LATHARNA 88 4.3 2.5 6.0 3.9
ABBOTSCOOLE 41 3.8 4.8 5.0 4.6
CARNCOOLE 49 2.5 4.8 4.8 4.3
GLENCOOLE 57 4.0 5.3 4.9 4.9
MONKSCOOLE 68 4.0 4.5 4.9 4.5
BEECHWOOD 17 3.0 9.0 5.2 6.7
WOODLAND 15 4.8 9.0 5.2 7.0
NIHE 17 September 2015
Asset Management Strategy Tower Blocks

Table 7: Financial and non-financial sustainability scores
Block Total
Tenanted
Units
NPV pu 30yr 30 Yr NPV Avg
Sustainability
Score
BELVOIR 52 -£66,381 (£3,451,792) 5.5BREDA 55 -£64,793 (£3,563,601) 5.3
COOLMOYNE 43 -£35,385 (£1,521,559) 3.8FERNDALE 27 -£54,378 (£1,468,219) 3.7PARKDALE 30 -£52,182 (£1,565,457) 3.6RATHMOYNE 38 -£41,266 (£1,568,116) 3.6RIVERDALE 42 -£45,867 (£1,926,406) 3.8
WHINCROFT 55 -£44,631 (£2,454,706) 5.6
WILLOWBROOK 39 -£44,556 (£1,737,702) 5.1WOODSTOCK 40 -£43,613 (£1,744,500) 5.3KILBRONEY 71 -£38,639 (£2,743,368) 4.3
CUCHULAINN 50 -£56,171 (£2,808,559) 3.4EITHNE 49 -£88,628 (£4,342,756) 3.2FIANNA 50 -£86,404 (£4,320,192) 3.1FINN 49 -£89,619 (£4,391,350) 3.1GRAINNE 81 -£58,454 (£4,734,777) 3.9MAEVE 50 -£89,910 (£4,495,491) 3.5OISIN 50 -£86,269 (£4,313,454) 3.5
MOUNT VERNON 62 -£67,917 (£4,210,858) 3.4ROSS 75 -£58,834 (£4,412,520) 3.0
MOVEEN 37 -£46,302 (£1,713,163) 5.0MOYLENA 45 -£39,960 (£1,798,191) 4.4
CLARAWOOD 56 -£38,711 (£2,167,809) 3.0
CARNET 57 -£41,371 (£2,358,173) 3.7
DIVIS 91 -£61,314 (£5,579,568) 2.9
LATHARNA 88 -£34,520 (£3,037,731) 3.9
ABBOTSCOOLE 41 -£72,858 (£2,987,165) 4.6CARNCOOLE 49 -£65,318 (£3,200,597) 4.3GLENCOOLE 57 -£46,770 (£2,665,889) 4.9MONKSCOOLE 68 -£56,468 (£3,839,857) 4.5
BEECHWOOD 17 -£71,253 (£1,211,303) 6.7WOODLAND 15 -£78,359 (£1,175,383) 7.0
Average for NIHE Stock £128 5.4
NIHE 18 September 2015
Asset Management Strategy Tower Blocks
Summary
4.26 The assessment of financial performance has demonstrated that the retention of the tower
blocks - given the currently projected higher level of investment and management costs against
income - would require significant subsidy from the overall stock’s business plan.
4.27 In addition, the analysis of non-financial performance suggests that there may be issues that
require further investigation before definitive conclusions can be made on the extent to which
each of the blocks or groups of blocks are helping to meet the Housing Executive’s business
objectives.
4.28 In combination the assessment of the financial and non-financial performance of the tower
blocks places a question over their long term sustainability.
NIHE 19 September 2015
Asset Management Strategy Tower Blocks

5. Developing Active Asset Management
Asset management objectives
5.1 In the long term our asset management strategy seeks to establish a portfolio of assets which
matches demand, meets residents’ aspirations, fits with business needs and where investment
programmes are supported by a robust long term financial plan.
5.2 Our overarching strategy states that we will prioritise investment in the long term sustainable
stock. Where financial and/or social sustainability appears vulnerable in the long term we will
explore the extent to which we can strengthen cash flows through business improvement,
implement interventions to improve social sustainability, or explore alternative options for the
assets that will deliver better outcomes for the landlord and for residents.
5.3 The long term principles from our overarching strategy apply equally to the Tower Blocks.
These include a commitment to only retaining assets where they align with the organisation's
business needs, and to ensure that income generated from the assets is maximised. These
principles also state that assets are used to support wider programmes and initiatives to
support social well-being.
5.4 The evidence from the asset performance evaluation shows that none of the 32 Tower Blocks
appear financially viable, and many have below average social sustainability when compared
with our other residential assets. This means that any decision to retain and invest in these
blocks, would require subsidy from the broader business plan and would, in many cases, also
need to be accompanied by strategies to improve social sustainability. Investment in this stock
will therefore need to be considered alongside competing demand for investment in other stock
Summary of Issues impacting on Tower Blocks
5.5 In the context of the objectives set out above it is worth summarising what the outputs from the
Asset Commission work tell us about Tower Blocks:
The stock provides less than 2% of the houses available to rent to our tenants
The overall cost of achieving the Commonly Adopted Standard is circa £106 million
Many of the properties are significantly under-occupied and their use, in social housing
terms, is not therefore being optimised
The thermal efficiency of the blocks is poor and homes are therefore hard to heat. In
addition the type of construction limits the range of effective heating solutions available.
The tenure mix in some blocks makes substantive investment more complex
The cost of managing the blocks is not supported by income receivable
Asset Management Approach
5.6 The current demand and void issues, coupled with the costs of achieving the agreed standard,
require that a very serious examination of the issues is undertaken prior to significant
investment being made in the Tower Blocks.
5.7 The key strategic proposal is therefore that a series of option appraisals should be conducted
for these properties. The issues vary significantly across the different estates described in this
NIHE 20 September 2015
Asset Management Strategy Tower Blocks
strategy and there is no single approach which would fit all of the circumstances. It is therefore
proposed that an options appraisal for each of the 13 estate groupings identified earlier should
be undertaken with a view to considering a range of options that will include reaching a
conclusion on whether all of the Tower Blocks should be retained.
5.8 It is strongly recommended that if a decision to retain any or all of the blocks is taken then the
investment required to secure a long term life should be committed to. The over-cladding
options which are included within the costs set out in this strategy assume a further 30 year life st
for the buildings. This would take these blocks through to the middle of the 21 century
approximately 85 years after they were first constructed.
5.9 The objectives for the option appraisal process would be to:
Explore alternative options that would improve financial viability and long term demand.
Consider the social need for retention of the block(s) alongside local housing market
information
Compare the costs and benefits of retention against all available alternative options and
consider
The extent to which strategies can be put in place to potentially improve financial
performance, for example through restructuring of the concierge service and
improvements in recovery of service costs and leaseholder recharges
A review of long term demand for the accommodation, as well as levels of current
under occupation.
An exploration of whether alternative options are available that offer better
outcomes for existing residents.
An exploration of the extent to which there may be limited capacity for alternative
uses of the site.
An exploration of the extent to which opportunities for change of tenure could
improve financial performance
Determine whether demolition and new build would deliver a better long term outcome in
some cases
5.10 The option appraisals will require to consider how and if financial performance could be
improved and to what extent and at what cost improvements could be delivered. Specifically
this could include
A review of the concierge service to consider how this could be reconfigured or
restructured to reduce or broaden the cost base
A review of service charges levied on tenants and leaseholders for day to day services
and consideration of options to improve income recovery against costs
A review of the extent to which the implementation of outcomes of consultation on rent
policy would improve income and reduce the funding gap
A review of leaseholder charges for major works, including the extent to which these can
be recovered, and options to assist leaseholders with payment.
An analysis of the impact arising from the implementation of welfare reform and, in
particular the bedroom tax, in blocks with substantial under occupation.
5.11 The average open market value of the flats in the blocks is estimated to range from £28k to
£52k. The liabilities for these blocks have average NPVs ranging from -£34.5k to -£89.9k per
unit. This means that in some cases properties are projected to lose more money over the 30
NIHE 21 September 2015
Asset Management Strategy Tower Blocks

years of the business plan than they would fetch on the open market if sold vacant. Sales of
voids - particularly in blocks with high proportions of leaseholders in order to move the block to
100% leaseholder ownership - may represent a solution that avoids a conflict between the
needs of tenants for improvements and the need for leaseholders to minimise the cost of
works. Tenants in blocks with high proportions of leaseholders could be offered a transfer to a
better quality home in order to meet their needs more efficiently and accelerate sales of voids.
5.12 All options for improvement will be explored. These include:
The extent to which investment would improve sustainability and mitigate risk of reducing
demand;
Management initiatives – for example, efficiencies in concierge costs or reductions in
underlying maintenance or repair expenditure, reduction of voids, increases in income
subject to DSD policies on rents and service charges.
Options for tenants in blocks with large proportions of leaseholders, where over cladding
works cannot be afforded due to an inability to recover costs from leaseholders. This
might include, for example the offer of a move to alternative accommodation at a higher
standard, and subsequent sale of voids to move blocks to 100% leasehold ownership.
Redevelopment potential based on a review of developable land surrounding the blocks.
In this context an initial mapping exercise has been carried out to evaluate the extent of
open space around each block. Although this analysis does not identify how much of the
open space could be developed, it does show significant amounts around some blocks
which can be considered as part of any evaluation.
Transfer to alternative providers to ensure continued use as affordable housing where
subsidy is not available to support cash flows within NIHE’s business plan
Decommissioning, demolition and disposal.
5.13 We have a clear and robust methodology already in place for carrying out Economic
Assessment/Business Case analysis which can be readily used to assess the full range of
issues which require to be considered in reaching an informed conclusion in each of these
potentially diverse circumstances.
5.14 The intention is that these appraisals will be carried out over the next 12-15 months which
would:
Allow decisions on the shape of the final portfolio to be made in the context of the SHRP
reform project and the affordability of any future business plan under the preferred option
that emerges from the SHRP reforms
Provide clarity on the number of Tower Blocks required to deliver a contribution to the
long term housing supply
Set out alternative housing options where necessary
Facilitate the procurement of a programme of over-cladding works for all retained blocks.
It would be beneficial to consider a significant programme of over-cladding being
undertaken as a single programme of works with the associated procurement benefits
that would bring.
5.15 There are major benefits to be obtained from procurement of an overall programme of over-
cladding as opposed to any piecemeal approach and, given that the development of such a
strategy can be run in tandem with the appraisal process, delays in kick-starting this
programme can be minimised as far as practical. It is envisaged that such a programme of
works could commence in blocks identified as having a long term future in 2018/19
NIHE 22 September 2015
Asset Management Strategy Tower Blocks

5.16 Given the time that will be required to complete the appraisals programme and prepare the
forward plan for the portfolio, in the intervening period the following approach is recommended:
To agree an interim investment approach for these assets until decisions about their long
term future are agreed.
To ensure all regulatory and legislative requirements are met.
NIHE 23 September 2015
Asset Management Strategy Tower Blocks
6. Developing the Tower Blocks Action Plan
The Current Position
6.1 Our Landlord Asset Management Strategy for the whole stock sets out the overall level of
resources that is estimated to be available during the next five years. Any works to Tower
Blocks will need to be afforded within this overall plan.
6.2 Addressing the issues around Tower Blocks in a comprehensive way has been identified as a
key ministerial priority. The interim investment programme for 2015/16 and 2016/17 and the
ongoing programmed maintenance programme both include a number of schemes in the Tower
Blocks designed to address improved thermal insulation, security and health and safety
compliance and these are set out on Appendix 4.
6.3 The interim investment programme included the external upgrading of a further three Towers
and was established in advance of the key considerations addressed within this strategy.
Nonetheless it is proposed that these works should continue on the basis of the commitments
already given to local communities, subject to satisfactory economic appraisal. This would bring
the existing commitment to over cladding to four blocks in total, specifically:
Cuchulainn House
Eithne House
Carnet House
Whincroft House
6.4 There are other additional investment requirements in these blocks which will be programmed
separately. Further decisions on over-cladding of the remaining blocks will be subject to the
outcome of the option appraisal process.
The Next Stages
6.5 The following c omprise the practical steps will be taken in implementing this Strategy in respect
of Tower Blocks:
Due to the results of the financial and social sustainability analysis, no major investment,
beyond that identified within the interim investment plan and described above, is planned
in Tower Blocks in the early years of the investment plan, to allow time for option
appraisals to be carried out.
The key step is to set up, organise and deliver the option appraisals proposed earlier and
to do so in conjunction with the local communities affected and other key stakeholders.
Given the scale and importance of this task this will take time and the commitment of
significant resources, and it is therefore proposed to set up a dedicated team to take
forward the work involved in a concerted way with a view to delivering results for
consideration within the next 18 months. An illustrative programme of appraisal is set out
at Appendix 5 (it should be noted that the order in which the appraisals will be undertaken
does not reflect any prioritisation of the blocks as regards a future works programme)
A detailed plan for the future of each block or estate as appropriate will be presented for
decisions by our board and the Department for Social Development (as required).
NIHE 24 September 2015
Asset Management Strategy Tower Blocks

A long term plan will then be developed setting out the extent of, and the timescales
associated with, all works to retained blocks.
A review of concierge services, service charge policy and leaseholder recharges will be
carried out at the same time as the option appraisals in each area.
A holding investment approach will be developed for the Tower Blocks to ensure that all
health and safety work and related compliance issues continues to be delivered while
option appraisals are ongoing.
6.6 The outcome of all of this will be a fully detailed Tower Blocks plan that will include:
An investment programme to bring the blocks that will be retained up to the Commonly
Adopted Standard. This cannot be accomplished within the time frame envisaged by this
strategy but could potentially be delivered over a 10 year time frame. The order in which
these blocks will be addressed will be determined with regard to their relative condition
and needs.
A disposals programme (as required)
A demolition programme (as required)
NIHE 25 September 2015
Asset Management Strategy Tower Blocks

7. Monitoring and review
7.1 Given the key recommendation contained within this strategy is a programme of option
appraisal the central i ssue for monitoring and review will be the oversight of progress in relation
to that programme. As decisions are taken on individual Towers or groups of Towers the
consequent actions will migrate to become part and parcel of the whole stock asset
management strategy. The accountability and processes for subsequent monitoring and review
of progress will therefore follow those set out in the Asset Management Strategy.
7.2 In the intervening period of option appraisal quarterly progress reports will be prepared for
consideration of the Senior Management Team. Completed option appraisals, detailing the way
forward, will be subject of approval via the established internal management mechanisms
followed by the Board. Thereafter, given the nature and anticipated cost of the work, the
recommendations may require approval by the Department for Social Development and the
Department of Finance & Personnel.
NIHE 26 September 2015
Asset Management Strategy Tower Blocks

Appendix 1 – Location of Tower Blocks
NIHE 27 September 2015
Asset Management Strategy Tower Blocks

Appendix 2 – Analysis of Void rates across Tower
Blocks
Block No of
Tenanted
Units
Voids %age
(Average over
3 years)
Turnover
BELVOIR 52 1.63% 12.65%
BREDA 55 1.04% 9.11%
COOLMOYNE 43 1.94% 16.76%
FERNDALE 27 1.26% 8.12%
PARKDALE 30 0.97% 12.53%
RATHMOYNE 38 1.84% 19.78%
RIVERDALE 42 1.47% 16.41%
WHINCROFT 55 1.68% 6.27%
WILLOWBROOK 39 1.50% 8.84%
WOODSTOCK 40 0.68% 6.27%
KILBRONEY 71 6.47% 18.53%
CUCHULAINN 50 3.70% 15.66%
EITHNE 49 1.53% 8.31%
FIANNA 50 1.71% 11.28%
FINN 49 2.38% 12.79%
GRAINNE 81 1.38% 7.35%
MAEVE 50 1.43% 7.52%
OISIN 50 0.93% 6.89%
MOUNT VERNON 62 1.52% 9.09%
ROSS 75 5.95% 27.57%
MOVEEN 37 1.19% 8.47%
MOYLENA 45 1.56% 15.31%
CLARAWOOD 56 3.00% 12.87%
CARNET 57 1.20% 7.69%
DIVIS 91 0.59% 7.23%
LATHARNA 88 1.69% 15.66%
ABBOTSCOOLE 41 19.02% 9.93%
CARNCOOLE 49 13.59% 10.23%
GLENCOOLE 57 60.87% 19.78%
MONKSCOOLE 68 56.06% 20.73%
BEECHWOOD 17 1.15% 7.37%
WOODLAND 15 2.77% 8.35%
Total 1629 7.14% 12.52%
Void rates reflect voids held empty for a variety of management reasons. Therefore adjusted void
rates were agreed with NIHE to reflect an ongoing estimate of demand, as set out below.
Exceptional Issues
NIHE 28 September 2015
Asset Management Strategy Tower Blocks
a) High voids in the Rathcoole blocks reflect the history of improvement with units held empty
pending works or review. This is not necessarily a predictor of future void levels. However,
with demand relatively weak in these areas an ongoing void rate of 10% has been used to
project future cashflows of these blocks.
b) Other adjustments include
Clarawood House – future projection reduced from 3% to 2% to reflect the fact that
historic voids are driven largely by high turnover although all voids were relatively short
term and there are no current concerns regarding future sustainability
Woodland House – future projection reduced from 2.77% to 2% reflecting relatively low
turnover with no problems reletting
Cuchulainn House – future projection reduced from 3.7% to 2% reflecting the fact that
while there is a fair degree of turnover, all blocks in this area are relatively stable and
therefore it is assumed that recent voids reflect the major works underway in the pilot
programme.
Finn House – future projection reduced from 2.38% to 2% reflecting stability of area
Ross House – future projection reduced from 5.95% to 3% reflecting the impact of recent
works to improve security and reduce anti social behaviour and the introduction of the
caretaking service
NIHE 29 September 2015
Asset Management Strategy Tower Blocks
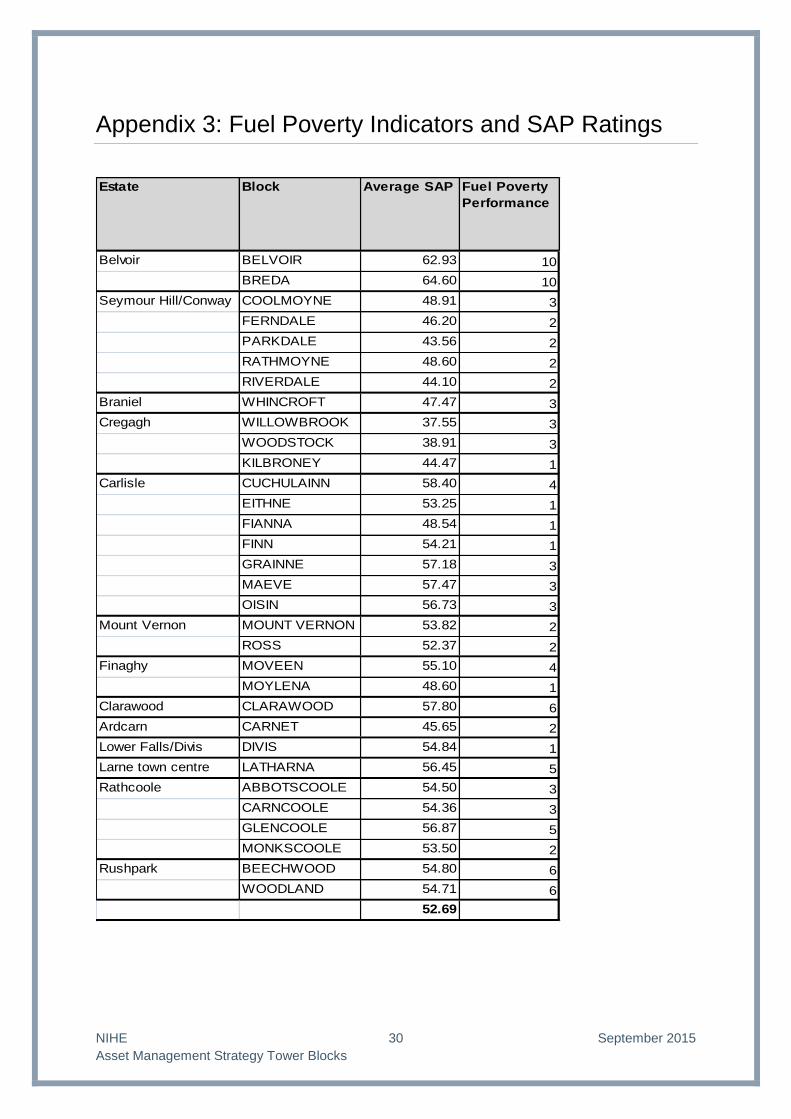
Appendix 3: Fuel Poverty Indicators and SAP Ratings
Estate Block Average SAP Fuel Poverty
Performance
Belvoir BELVOIR 62.93 10
BREDA 64.60 10
Seymour Hill/Conway COOLMOYNE 48.91 3
FERNDALE 46.20 2
PARKDALE 43.56 2
RATHMOYNE 48.60 2
RIVERDALE 44.10 2
Braniel WHINCROFT 47.47 3
Cregagh WILLOWBROOK 37.55 3
WOODSTOCK 38.91 3
KILBRONEY 44.47 1
Carlisle CUCHULAINN 58.40 4
EITHNE 53.25 1
FIANNA 48.54 1
FINN 54.21 1
GRAINNE 57.18 3
MAEVE 57.47 3
OISIN 56.73 3
Mount Vernon MOUNT VERNON 53.82 2
ROSS 52.37 2
Finaghy MOVEEN 55.10 4
MOYLENA 48.60 1
Clarawood CLARAWOOD 57.80 6
Ardcarn CARNET 45.65 2
Lower Falls/Divis DIVIS 54.84 1
Larne town centre LATHARNA 56.45 5
Rathcoole ABBOTSCOOLE 54.50 3
CARNCOOLE 54.36 3
GLENCOOLE 56.87 5
MONKSCOOLE 53.50 2
Rushpark BEECHWOOD 54.80 6
WOODLAND 54.71 6
52.69
NIHE 30 September 2015
Asset Management Strategy Tower Blocks
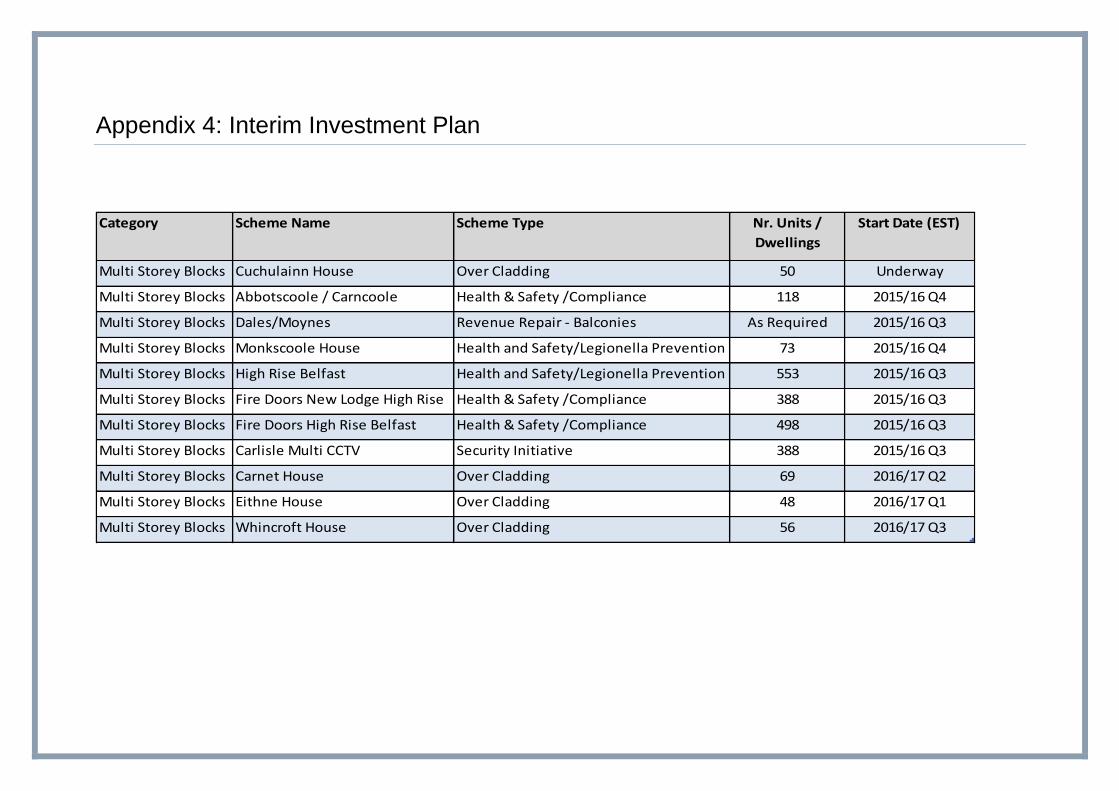
Appendix 4: Interim Investment Plan
Category Scheme Name Scheme Type Nr. Units /
Dwellings
Start Date (EST)
Multi Storey Blocks Cuchulainn House Over Cladding 50 Underway
Multi Storey Blocks Abbotscoole / Carncoole Health & Safety /Compliance 118 2015/16 Q4
Multi Storey Blocks Dales/Moynes Revenue Repair - Balconies As Required 2015/16 Q3
Multi Storey Blocks Monkscoole House Health and Safety/Legionella Prevention 73 2015/16 Q4
Multi Storey Blocks High Rise Belfast Health and Safety/Legionella Prevention 553 2015/16 Q3
Multi Storey Blocks Fire Doors New Lodge High Rise Health & Safety /Compliance 388 2015/16 Q3
Multi Storey Blocks Fire Doors High Rise Belfast Health & Safety /Compliance 498 2015/16 Q3
Multi Storey Blocks Carlisle Multi CCTV Security Initiative 388 2015/16 Q3
Multi Storey Blocks Carnet House Over Cladding 69 2016/17 Q2
Multi Storey Blocks Eithne House Over Cladding 48 2016/17 Q1
Multi Storey Blocks Whincroft House Over Cladding 56 2016/17 Q3
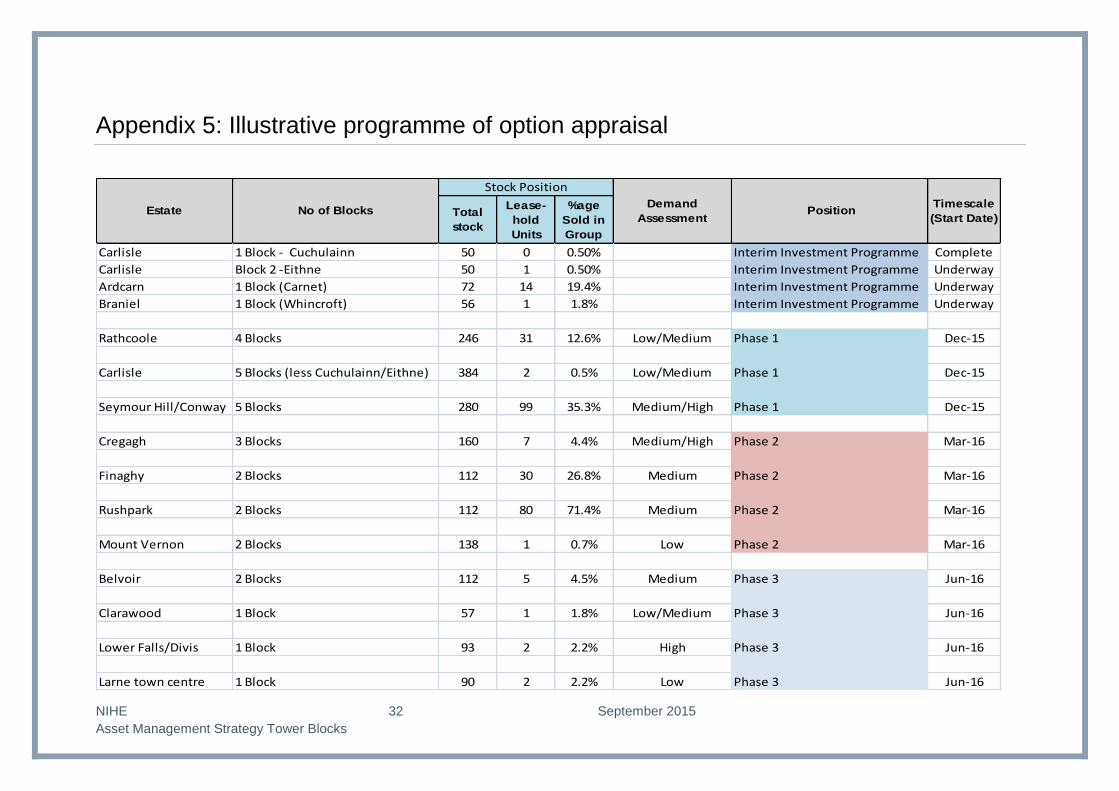
Appendix 5: Illustrative programme of option appraisal
Total
stock
Lease-
hold
Units
%age
Sold in
Group
Carlisle 1 Block - Cuchulainn 50 0 0.50% Interim Investment Programme Complete
Carlisle Block 2 -Eithne 50 1 0.50% Interim Investment Programme Underway
Ardcarn 1 Block (Carnet) 72 14 19.4% Interim Investment Programme Underway
Braniel 1 Block (Whincroft) 56 1 1.8% Interim Investment Programme Underway
Rathcoole 4 Blocks 246 31 12.6% Low/Medium Phase 1 Dec-15
Carlisle 5 Blocks (less Cuchulainn/Eithne) 384 2 0.5% Low/Medium Phase 1 Dec-15
Seymour Hill/Conway 5 Blocks 280 99 35.3% Medium/High Phase 1 Dec-15
Cregagh 3 Blocks 160 7 4.4% Medium/High Phase 2 Mar-16
Finaghy 2 Blocks 112 30 26.8% Medium Phase 2 Mar-16
Rushpark 2 Blocks 112 80 71.4% Medium Phase 2 Mar-16
Mount Vernon 2 Blocks 138 1 0.7% Low Phase 2 Mar-16
Belvoir 2 Blocks 112 5 4.5% Medium Phase 3 Jun-16
Clarawood 1 Block 57 1 1.8% Low/Medium Phase 3 Jun-16
Lower Falls/Divis 1 Block 93 2 2.2% High Phase 3 Jun-16
Larne town centre 1 Block 90 2 2.2% Low Phase 3 Jun-16
Timescale
(Start Date)
Stock Position
Estate No of BlocksDemand
Assessment Position
NIHE 32 September 2015
Asset Management Strategy Tower Blocks