an assessment of stream health of the … assessment of stream health of the whitewater river...
TRANSCRIPT
AN ASSESSMENT OF STREAM HEALTH OF THE WHITEWATER RIVER
LAURENCE A. CECIL, LAREN K. EVERAGE, WILLIAM B. HAMILTON, JORDAN E. IDDINGS, ALEXANDER W. KELLOGG, AMANDA R. MULLIKIN, BROOKE A. SMITH, ALEXANDRA R. TRIBO,
LAUREN E. WHITENACK, AND TASMIA ZAMAN
Abstract. The Whitewater River is located within the Savannah River watershed in a region of the southern Appalachian Mountains that has experienced varying types of anthropomorphic disturbance. We surveyed five sites in the Whitewater River and one site in Silver Run Creek, a tributary to the Whitewater River, to assess stream health. We observed physical characteristics that affect stream ecology such as riparian zone width, erosion potential, sedimentation, channelization, and habitat availability for aquatic life. To conduct these assessments, we followed protocols from the North Carolina Habitat Assessment for Mountain and Piedmont Streams, a stream visual assessment protocol (SVAP), Rosgen’s Bank Erosion Hazard Index (BEHI), Wolman’s Pebble Count, and an Index of Biotic Integrity (IBI) for benthic macroinvertebrates. We found that bank stability, vegetation, and light penetration scores were relatively consistent among all sites. NC Habitat Assessment scores were lowest at the two most upstream sites in Whitewater River. SVAP scores generally decreased as distance downstream increased. IBI values suggested that the Whitewater River has been moderately impacted by anthropogenic pollutants. Further data collection in this area during a time of more standard rainfall would be useful because this survey was conducted during a period of extreme drought.
Key words: BEHI; EPT; IBI; macroinvertebrates; pebble count; Savannah River Basin; Silver Run Creek; SVAP; Southern Appalachians; Whitewater River.
INTRODUCTION
Stream ecosystems support a variety of plants, animals, and microorganisms, transport water and sediment through watersheds to croplands and towns, serve as water sources for municipal and industrial processes, and function as recreation areas. Stream conditions impact the health and diversity of aquatic and terrestrial organisms that rely on water resources. Thus, channel stability, stream health and water quality are of great importance to the surrounding area (Vannote et al. 1980, Allan and Castillo 2007). Both natural and manmade disturbances impact stream health and stability. Drought, flooding, fire, beaver activity, and landslides are natural disturbance events that impact stream ecosystems (Resh et al. 1988). Human alteration of the landscape has a documented effect on the physical, chemical, and biological characteristics of streams in watersheds (Death and Winterbourn 1995, Wolman 1967). Construction and mining activities release sediment and heavy metals into streams, dam building and stream channel alteration change flow and sediment distribution, and establishment of paved surfaces increases runoff, causing erosion and increasing pollutant transmission (Wolman 1967). Changes in both physical and chemical composition alter the distribution and abundance of organisms within streams (Resh et al. 1988). Erosion, sedimentation and pollution from runoff are all abiotic factors that can affect such change.
The headwaters of the Savannah River watershed are located in North Carolina in the Seneca sub-basin that includes the Thompson, Horsepasture, Toxaway, and Whitewater Rivers. The Whitewater River, located in Jackson County, North Carolina, received excellent bioclassification ratings when sampled from 1994 to 2009, based on benthic macroinvertebrate data collected from one site by the NC Department of Environment and Natural Resources: Division of Water Quality (NCDEQ 2012). In this study, we describe the physical and biological
conditions of the Whitewater River watershed by using physical assessment methods and by collecting and analyzing macroinvertebrate samples.
METHODS AND MATERIALS
Study Area
Silver Run Creek is a tributary to the Whitewater River, which flows into South Carolina
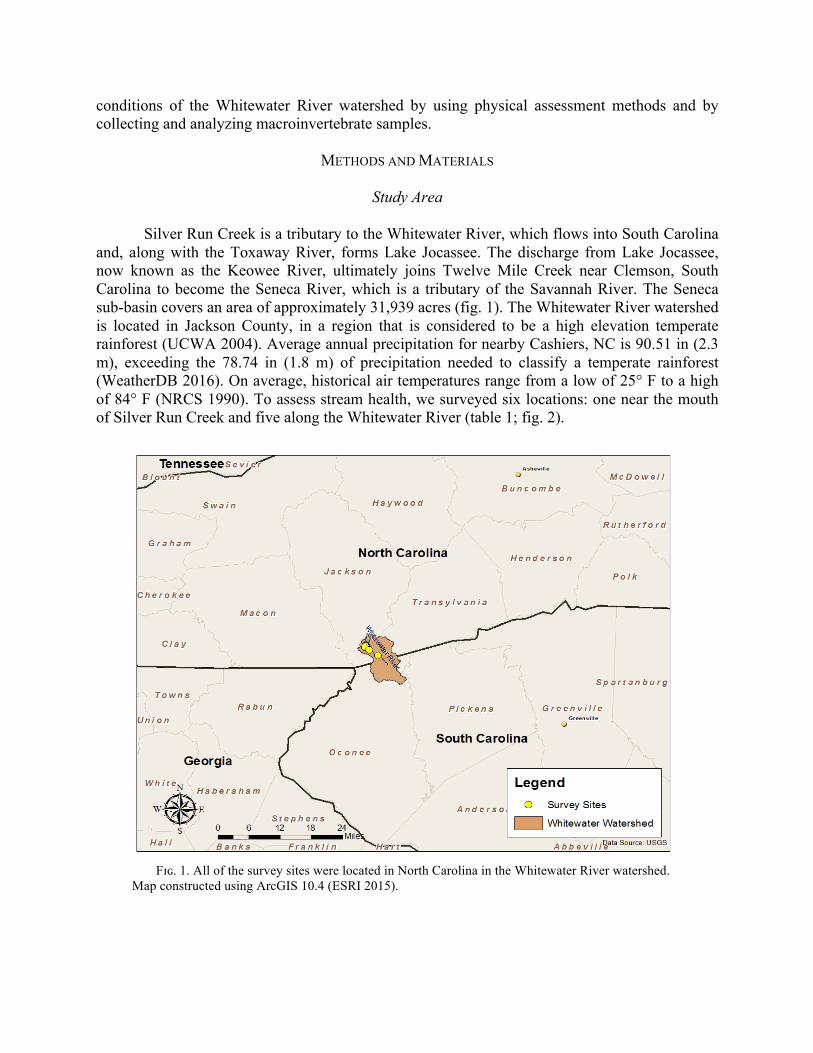
and, along with the Toxaway River, forms Lake Jocassee. The discharge from Lake Jocassee, now known as the Keowee River, ultimately joins Twelve Mile Creek near Clemson, South Carolina to become the Seneca River, which is a tributary of the Savannah River. The Seneca sub-basin covers an area of approximately 31,939 acres (fig. 1). The Whitewater River watershed is located in Jackson County, in a region that is considered to be a high elevation temperate rainforest (UCWA 2004). Average annual precipitation for nearby Cashiers, NC is 90.51 in (2.3 m), exceeding the 78.74 in (1.8 m) of precipitation needed to classify a temperate rainforest (WeatherDB 2016). On average, historical air temperatures range from a low of 25° F to a high of 84° F (NRCS 1990). To assess stream health, we surveyed six locations: one near the mouth of Silver Run Creek and five along the Whitewater River (table 1; fig. 2).
Fɪɢ. 1. All of the survey sites were located in North Carolina in the Whitewater River watershed.
Map constructed using ArcGIS 10.4 (ESRI 2015).

Tᴀʙʟᴇ 1. Locations of research sites referenced in the study. Sites will primarily be referred to by the listed abbreviations. Road refers to closest access point.
Site Road Latitude Longitude Survey Date
Silver Run Creek (SRC) NC 107 35.06640 N 83.06564 W 12 Sep 2016
Whitewater River 1 (WR1) NC 107 35.07458 N 83.06363 W 19 Sep 2016
Whitewater River 2 (WR2) NC 107 35.06649 N 83.06577 W 19 Sep 2016
Whitewater River 3 (WR3) NC 107 35.06621 N 83.05398 W 26 Sep 2016
Whitewater River 4 (WR4) NC 1103 35.05343 N 83.05398 W 24 Oct 2016
Whitewater River 5 (WR5) NC 281 35.03806 N 83.04556 W 10 Oct 2016
Fɪɢ. 2. Survey sites located along Silver Run Creek and Whitewater River. Map constructed using ArcGIS
10.4 (ESRI 2015).

North Carolina Habitat Assessment
In this element of the study, we examined stream reaches of 100 to 200 m in length and assigned each site a total score ranging from 1 and 100, from very poor stream conditions to very healthy stream conditions. To identify the conditions defined in the habitat assessment worksheet, we observed and recorded the stream’s physical and geomorphological characteristics. We also noted the specific weather and land use conditions under which the study was conducted. We looked for evidence of channel modification, presence of instream habitat types, quality and composition of bed sediment, and bank stability and vegetation.
When looking for evidence of channel modification, we noted channelization and frequency of bends. To score instream habitat, we considered the percentage of the reach that was favorable habitat for fish and aquatic macroinvertebrates. To do this, we looked for existence of habitat types: rocks, macrophytes, sticks and leaf packs, snags and logs, and undercut banks and root mats. The score assigned to this section were based on the number of types of habitats present in the reach and the percentage of the reach available for colonization or cover. When examining bottom substrate, we looked at the entire reach to generate a score, but only looked at the riffles for embeddedness. We rated the substrate as: healthy substrate with good mix of gravel, cobble, and boulders; substrate with only gravel and cobble; substrate with mostly gravel; or substrate that is homogeneous. Within those categories, further classification was prompted based on percent embeddedness (i.e. embeddedness <20%, embeddedness 20-40%, etc.). Each classification was assigned a specific score that added up to the total instream habitat score. We examined reaches for the presence and frequency of pools and for variety in size and dominant pool substrate. We looked at riffle habitats as well, noting whether riffles occurred frequently or infrequently. Scores were assigned based on classification of riffles as: well defined riffle and run; riffle as wide as the stream and extending two times the width of stream; riffle as wide as stream but riffle length is not two times stream width; riffle is not as wide as stream and riffle length is not two times stream width; or riffles absent. We also noted channel slope.
We also examined bank stability and erosion. We noted erosion areas on river left and river right and classified the bank vegetation (i.e. diverse trees, shrubs, and grass versus sparse mixed vegetation, etc.). We noted light penetration by classifying canopy as good, full, partial, minimal, or none. Lastly, we examined the width of the riparian vegetative zone (an area of natural vegetation adjacent to the stream) on river right and river left. We defined breaks in the riparian zone as any place on the stream which allows sediment or pollutants to directly enter the stream. We added individual section scores for the total score at the end, which can be used across sites as a quantitative comparison of individual stream habitats.
We used a spherical crown densiometer to measure canopy cover over the stream. The densiometer is divided into square sections. We counted the number of “dots” on the densiometer, which reflected open canopy while facing north, south, east, and west. Each dot represented a corner of a quadrant, with each quadrant being composed of four dots. Three points within the channel—two near the respective endpoints of the surveyed area and one in the middle—were surveyed to get an estimated average percent of open canopy. Additionally, we used a Pocket Rod to take 20 measurements at randomly selected points along the studied area of the stream in order to calculate average and maximum stream depth.

Stream Visual Assessment Protocol The Stream Visual Assessment Protocol (SVAP) is a qualitative assessment of stream
features and impacts originally developed by USDA for use by laypersons (Newton et al. 1998). It has since been modified by USDA and others (USDA 2009, LTLT 2014). The version that we used represents the unpublished precursor to the LTLT modification. We assigned a conditional assessment score of one to four, indicating poor to excellent stream health, based on ten habitat parameters. Epifaunal substrate is submerged material on the channel bottom. Embeddedness refers to how deeply sediments are deposited in the riffle and run areas. Diversity of instream habitats is measured by counting the number of riffles, runs, and pools. Sediment deposition is a survey of the presence of sediment bars within a stream. Channel flow status relates to how much water is in the stream channel. The measure of channel alteration involved surveying anthropogenic sources of disturbance or pollution, such as channelization, development, and/or agriculture. Channel sinuosity is the product of stream length divided by valley length, or a measure of the stream meander. Bank stability is a measure of stream bank resistance to change, quantified by evidence of erosion such as bank scouring and undercutting, bank collapse, and rooted vegetation. Vegetation protection refers to the percentage of a stream bank that is covered and shaded by a variety of vegetation such as trees, shrubs, flowering plants, and grasses. The riparian vegetative zone width is the measure of the amount of buffer present on each stream bank, with the best score given to a buffer zone that is greater than or equal to three times the channel width.
Bank Erosion Hazard Index
Rosgen’s Bank Erosion Hazard Index (BEHI) is a protocol used to evaluate the likelihood that a section of streambank erodes, primarily during elevated stream discharge (Rosgen 2001). In this study, we calculated a BEHI value for the segment of the stream bank at each study site that appeared to be at greatest risk of erosion; values are not characteristic of the full extent of the reach. BEHI is calculated based on measuring bank height ratio (ft/ft), root depth ratio (ft/ft), root density (%), bank angle (°), and surface protection (%), each of which are then matched with an erosion risk value ranging from ‘very low’ to ‘extreme.’ We performed these measurements based on stream bank characteristics observed in the field, as defined in the Bank Erosion Hazard Index Worksheet (Rathbun 2008). As a part of this protocol, we estimated bank height by placing a Pocket Rod survey tape in the middle of the stream as a reference. From this measurement, we noted bankfull elevation as well as the visible rooting depth of bankside vegetation relative to bank height. We estimated the bank angle from the examined area of the stream relative to the surface of the water and the top of the bank. Once the initial measurements were taken, we adjusted figures either up or down in accordance with the protocol, depending upon the bank material or the presence bank stratification, to generate final BEHI values.
Pebble Count
We estimated distribution and size of bed sediment by performing Wolman’s Pebble
Count (Wolman 1954). We categorized sand as fine, medium, or coarse based on feel, and measured large boulders in-situ as precisely as possible. In order to obtain reach-wide pebble count result, we took ten sediment measurements at ten transects arranged to reflect the

percentage of each habitat type (i.e. riffle, run, pool, and glide) within the reach, resulting in a total of 100 observations per stream reach. We measured the intermediate axes of randomly selected bed sediment with a flexible ruler and classified the sediment as silt, clay, sand, gravel, cobble, boulder, or bedrock (Wolman 1954). We used the results to develop relative and cumulative percentages of sediment size classes and to determine median grain size (D50), which is easily compared between sites.
Macroinvertebrates
We collected benthic macroinvertebrates using four different sampling methods: kick nets, D-nets, leaf packs, and timed visual sampling at each of the six stream reaches. We took four samples using each collection method, excluding visual samples. Timed visual samples were collected throughout the reach of the stream for a total of 20 minutes. We collected samples from riffles using kick nets and D-nets. When riffles were absent, we collected samples in other habitat types. We preserved insects obtained from sampling in an 80% ethanol solution and sorted specimens in the lab to order using dichotomous keys provided by Merritt et al. (2008). Orders Ephemeroptera, Plecoptera, and Trichoptera were further keyed to family to create an Index of Biotic Integrity (IBI). The EPT IBI is a biotic indicator used to gauge the health of a stream by measuring the diversity and abundance of macroinvertebrates. The IBI was determined at each individual site for the orders EPT using the following equation:
𝐼𝐵𝐼 = %&'&
( (1)
where 𝑛* is the number of individuals in a particular family, 𝑎* is the tolerance value associated with the family, and 𝑁 is the total number of individuals in the orders EPT (Hilsenhoff 1977). Tolerance values were derived from a published list by Hilsenhoff (1988). We also determined taxonomic richness by counting the number of unique families that were present at each site. We separated families into trophic classes to provide information regarding their role within stream ecosystems. Macroinvertebrate trophic classes include shredders, scrapers, piercers, predators, and collectors (Merritt et al. 2008). Variable levels of diversity and abundance depend on how severely the organisms are affected by the presence of pollution and other environmental changes. Together, IBI and taxonomic richness can be used to qualify aquatic health and can be employed to perform comparisons between sample sites.
RESULTS
At each studied site, we took a number of measurements reflecting the physical conditions of the reach, including temperature, pH, average and maximum stream depth, channel width, and bank height (table 2). There appear to be no noticeable patterns for any condition as distance from headwaters increases, except for channel width which increases with river mile. Temperature at SRC was not taken on the day of survey and was instead recorded the following week. Temperature was not recorded for WR2.

Tᴀʙʟᴇ 2. Physical conditions of research sites. Site Temperature
(°C) pH Average stream
depth (ft) Maximum stream depth (ft)
Channel width (ft) Bank height (ft)
SRC 17 5.3 1.2 2.2 40 3
WR1 16 5.13 0.39 0.77 29.5 14.1
WR2 NA 4.3 0.637 1.18 28.9 4
WR3 17 5.5 0.69 1.35 28.2 4.9
WR4 10.3 4.97 1.94 2.8 43.9 4.7
WR5 13.5 7.02 0.998 1.8 58.7 2.7
North Carolina Habitat Assessment
Component scores for each site were summed to form a cumulative habitat assessment score (table 3). Ideal scores were included as a baseline means of comparison between sites. Bank stability, vegetation, and light penetration scores were relatively consistent among all sites. In general, the quality of riffle habitats improved as distance from headwaters increased. Instream habitat and bottom substrate scores were lowest in WR1 and WR2, as were total habitat assessment scores (fig. 3). Tᴀʙʟᴇ 3. Habitat assessment scores by category. There were no riffles at WR4, so a score of 0 for riffle habitat was
assigned to the reach. Site SRC WR1 WR2 WR3 WR4 WR5 Ideal
Channel modification 4 5 4 5 4 4 5
Instream habitats 20 12 12 20 16 20 20
Bottom substrate 12 3 3 12 11 12 15
Pool variety 10 6 10 10 4 10 10
Riffle habitats 3 3 3 10 0 16 16
Bank stability/vegetation 12 12 11 12 12 12 14
Light penetration 7 7 10 10 7 7 10
Riparian vegetative zone width
10 10 7 7 7 10 10
Cumulative score 78 58 60 86 61 91 100

Fɪɢ. 3. Component and total NC Habitat Assessment scores for studied sites.
Stream Visual Assessment Protocol
Component scores for each site were summed to form a cumulative SVAP score (table 4). A column of ideal scores was added as a means of comparison between sites. SVAP scores generally decreased as distance downstream increased. Most categorical scores also decreased as river mile increased, except for livestock and barriers to fish movement scores which remained consistent between sites due to the absence of either issue at any of the sites (fig. 4).
0
10
20
30
40
50
60
70
80
90
100
SRC WR1 WR2 WR3 WR4 WR5
Scor
e
Site
Riparian Vegetation Zone Width
Light Penetration
Bank Stability and Vegetation
Riffles
Pool Variety
Bottom Substrate
Instream Habitat
Channel Modification
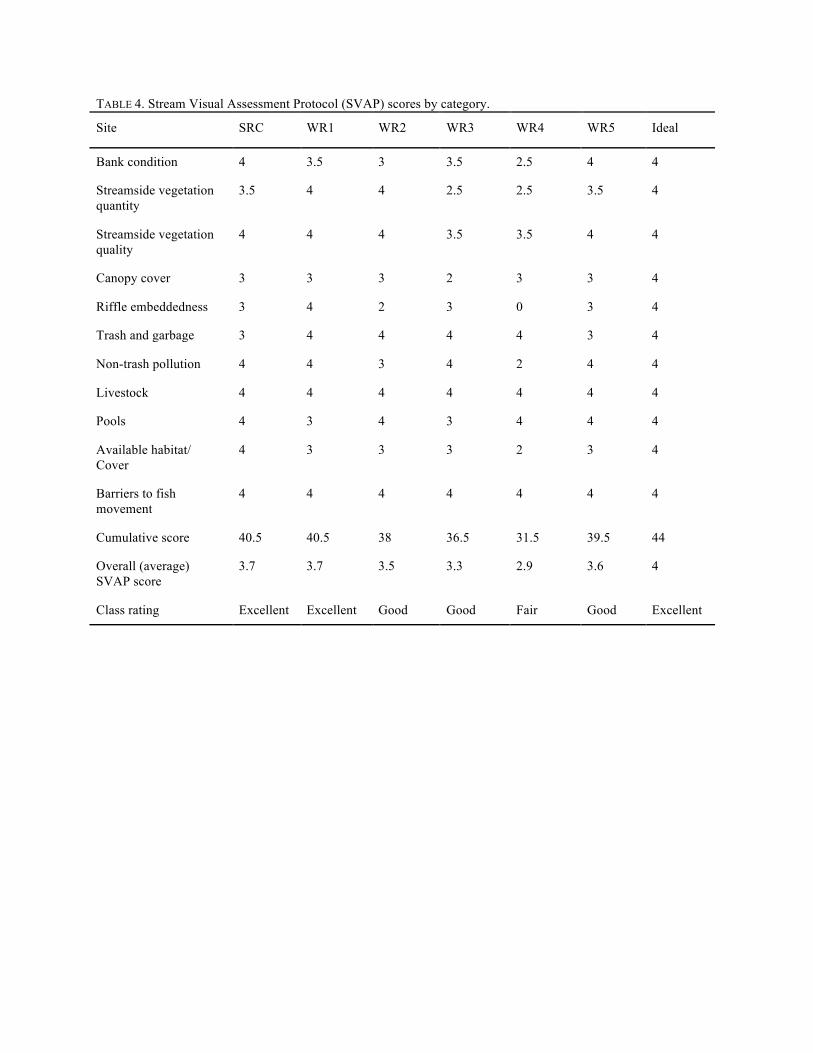
TABLE 4. Stream Visual Assessment Protocol (SVAP) scores by category. Site SRC WR1 WR2 WR3 WR4 WR5 Ideal
Bank condition 4 3.5 3 3.5 2.5 4 4
Streamside vegetation quantity
3.5 4 4 2.5 2.5 3.5 4
Streamside vegetation quality
4 4 4 3.5 3.5 4 4
Canopy cover 3 3 3 2 3 3 4
Riffle embeddedness 3 4 2 3 0 3 4
Trash and garbage 3 4 4 4 4 3 4
Non-trash pollution 4 4 3 4 2 4 4
Livestock 4 4 4 4 4 4 4
Pools 4 3 4 3 4 4 4
Available habitat/ Cover
4 3 3 3 2 3 4
Barriers to fish movement
4 4 4 4 4 4 4
Cumulative score 40.5 40.5 38 36.5 31.5 39.5 44
Overall (average) SVAP score
3.7 3.7 3.5 3.3 2.9 3.6 4
Class rating Excellent Excellent Good Good Fair Good Excellent
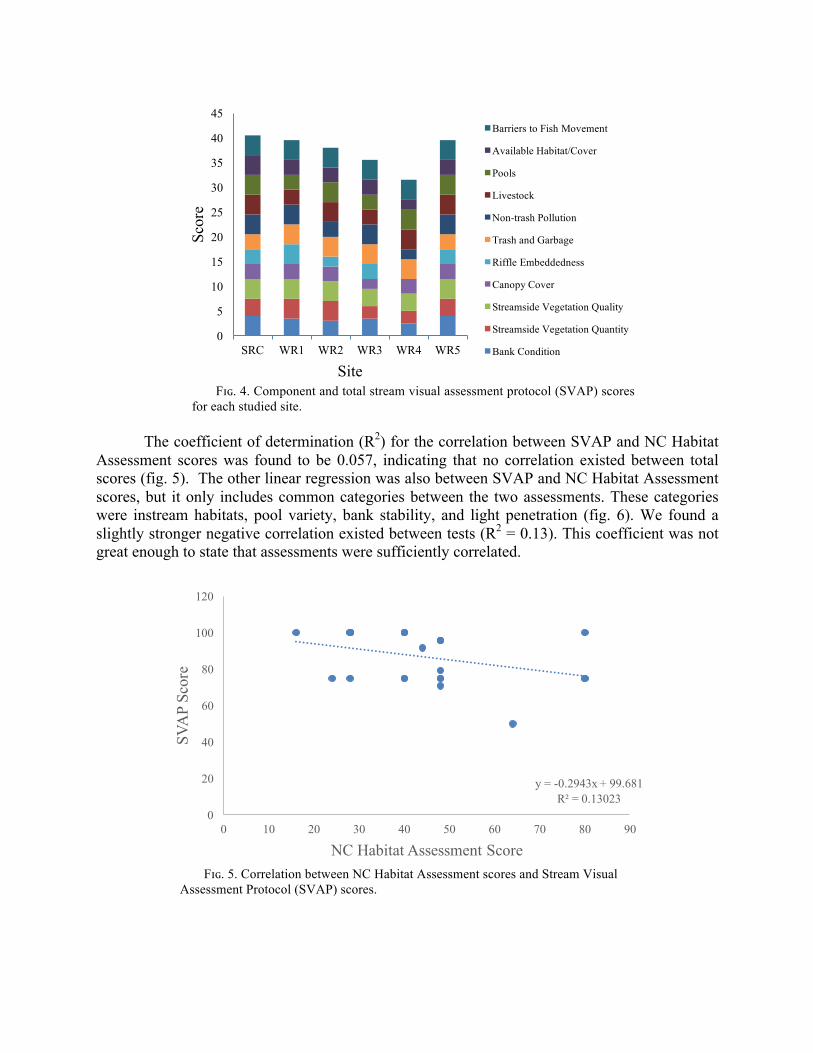
Fɪɢ. 4. Component and total stream visual assessment protocol (SVAP) scores
for each studied site.
The coefficient of determination (R2) for the correlation between SVAP and NC Habitat Assessment scores was found to be 0.057, indicating that no correlation existed between total scores (fig. 5). The other linear regression was also between SVAP and NC Habitat Assessment scores, but it only includes common categories between the two assessments. These categories were instream habitats, pool variety, bank stability, and light penetration (fig. 6). We found a slightly stronger negative correlation existed between tests (R2 = 0.13). This coefficient was not great enough to state that assessments were sufficiently correlated.
Fɪɢ. 5. Correlation between NC Habitat Assessment scores and Stream Visual
Assessment Protocol (SVAP) scores.
0
5
10
15
20
25
30
35
40
45
SRC WR1 WR2 WR3 WR4 WR5
Scor
e
Site
Barriers to Fish Movement
Available Habitat/Cover
Pools
Livestock
Non-trash Pollution
Trash and Garbage
Riffle Embeddedness
Canopy Cover
Streamside Vegetation Quality
Streamside Vegetation Quantity
Bank Condition
y = -0.2943x + 99.681R² = 0.13023
0
20
40
60
80
100
120
0 10 20 30 40 50 60 70 80 90
SVA
P Sc
ore
NC Habitat Assessment Score

Fɪɢ. 6. Correlation between NC Habitat Assessment and SVAP scores for
overlapping categories of assessment, including instream habitat, pool variety, bank stability and vegetation, and light penetration.
Percent canopy cover was generally stable across all sites (fig. 7). WR5 was the only site which did not follow the spatial trend as percent canopy cover was significantly less than the remaining sites.
Fɪɢ. 7. Percent canopy cover for three different locations at each studied site.
Locations include upstream, midstream, and downstream sections of the reach. Locations were randomly chosen, so Location 1 may not always refer to the upstream end of the reach.
Riparian vegetative zone width decreased with increasing average percent canopy cover (fig. 8). R2 was determined to be 0.17, indicating that a weak negative correlation existed between the two variables.
0
10
20
30
40
50
60
70
80
90
100
SRC WR1 WR2 WR3 WR4 WR5
Perc
ent C
anop
y C
over
Site
Location 1
Location 2
Location 3
Average

Fɪɢ. 8. Correlation between average percent canopy cover and riparian
vegetative zone width scores, according to the NC Habitat Assessment.
Bank Erosion Hazard Index
BEHI scores generally decreased with increasing river mile, indicating that erosion potential for the reaches examined is highest near the headwaters (fig. 9). Most indices followed the same decreasing trend, excluding bank angle which increased with distance from headwaters (table 5). Non-adjusted BEHI scores showed the same decreasing pattern as the adjusted scores. In general, surface protection contributed the most to total scores, while bank angle contributed minimally. TABLE 5. Indices of BEHI across sampled sites; adjusted BEHI score includes additive penalty for the presence of
fine sediments.
y = -3.4659x + 11.8R² = 0.16869
6
6.5
7
7.5
8
8.5
9
9.5
10
10.5
40.00% 50.00% 60.00% 70.00% 80.00% 90.00% 100.00%
Rip
aria
n Ve
geta
tive
Zone
Wid
th
Scor
e
Average Percent Canopy Cover
Site Bank height ratio
Root depth ratio
Root density
Bank angle
Surface protection
Adjustment Adjusted BEHI
Erosion potential
SRC 8 7 10 3 10 10 48 Extreme
WR1 10 7 3 2 7 10 39 High
WR2 6 4 10 2 6 10 38 High
WR3 8 7 4 4 5 0 28 Moderate
WR4 5 2 4 3 10 0 24 Moderate
WR5 8 1 2 3 10 10 34 High

Fɪɢ. 9. Component and total bank erosion hazard index (BEHI) scores for each
studied site, including adjustments for sediment types along bank where BEHI was performed.
Pebble Count
We determined relative percentages of runs, pools, and riffles/glides when setting up transects for pebble count. Morphological characteristics were most evenly distributed in WR1 and WR3, and they were least evenly distributed in WR4 (fig. 10). In most sites runs and glides composed nearly, or more than, half of all habitat types, yet WR5 was mostly composed of riffles. WR4 was absent of any riffles, and was dominated by pools.
Fɪɢ. 10. At most sites roughly half of the morphology types are runs and glides. WR5 is dominated by riffles,
and WR4 is absent of riffles and mostly made of pools. The distributions of sediment particle sizes reveal a distribution with a higher number of large sediments in the Silver Run Creek site and WR5 (fig. 11-16). WR1, WR2, and WR4 show
0
10
20
30
40
50
60
SRC WR1 WR2 WR3 WR4 WR5
Scor
e
Site
Adjustment
Surface Protection
Bank Angle
Root Density
Root Depth Ratio
Bank Height Ratio

distributions with higher numbers of smaller sediments, and the distribution at WR3 is approximately normal.
Fɪɢ. 11. Wolman Pebble Count in SRC site displaying number of sediments per size.
Fɪɢ. 12. Wolman Pebble Count in WR1 displaying number of sediments per size.
0
5
10
15
20
25
Cou
nt
Size (mm)
0
5
10
15
20
25
Cou
nt
Size (mm)
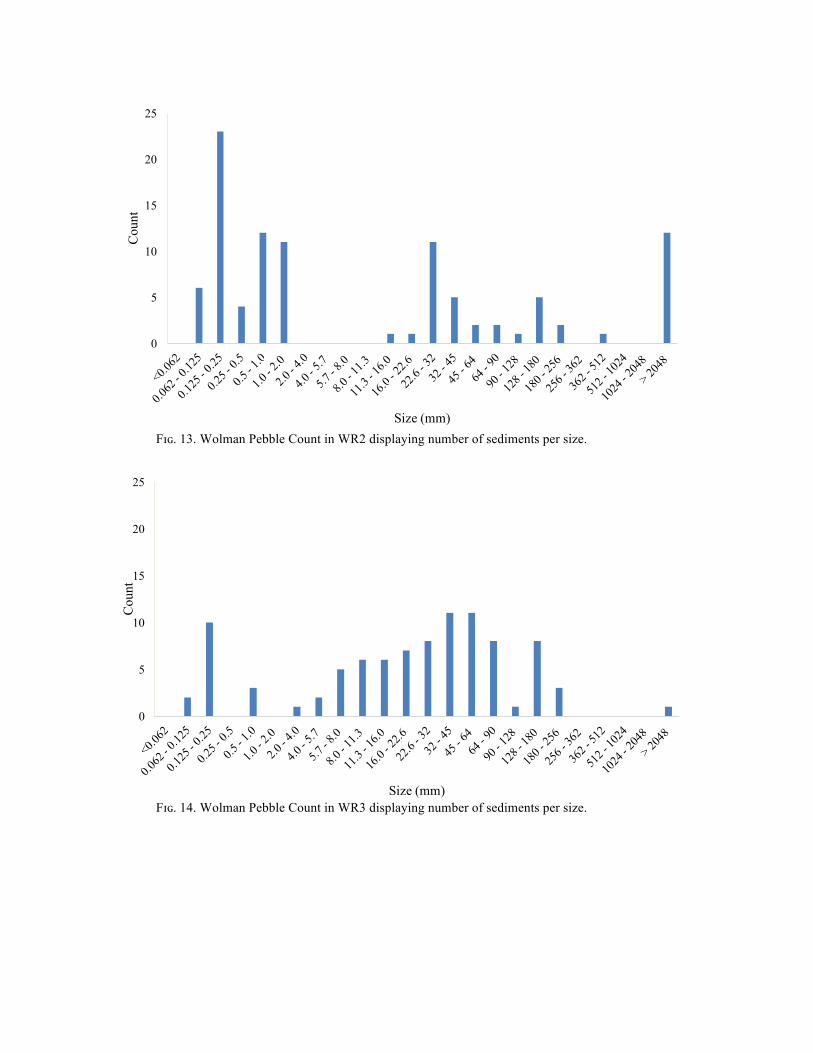
Fɪɢ. 13. Wolman Pebble Count in WR2 displaying number of sediments per size.
Fɪɢ. 14. Wolman Pebble Count in WR3 displaying number of sediments per size.
0
5
10
15
20
25C
ount
Size (mm)
0
5
10
15
20
25
Cou
nt
Size (mm)

Fɪɢ. 15. Wolman Pebble Count in WR4 displaying number of sediments per size.
Fɪɢ. 16. Wolman Pebble Count in WR5 displaying number of sediments per size.
The D50 values (median particle size) for each stream (fig. 17) relate to the sediment size
distributions and cumulative percentage rates per size class. D50 values tended to be higher in Silver Run Creek and WR5; they tended to be smaller in WR1, WR2, and WR4 (fig. 17). WR5 had the largest D50 of 128 - 180 mm, and the smallest D50 of 0.25 - 0.5 mm was at WR4.
0
5
10
15
20
25
Cou
nt
Size (mm)
0
5
10
15
20
25
Cou
nt
Size (mm)

Fɪɢ. 17. Distribution of particle size in six sites in the Whitewater River watershed. D50 for each site where the
line intersects 50 percent. Median particle size (D50) relates to distance from the first site with a linear regression slope of 30.043 and an R2 value of 0.784 (fig. 18). This means that median particle size generally increases by 30.043 mm with each river mile downstream. Median particle size is displayed as the median value of the D50 value because particle sizes are listed as a range of dimensions.
Fɪɢ. 18. The median particle size for WR1-WR5 as a function of distance from the first site
(SRC is excluded because it occupies a different section of the stream). The R-squared value suggests moderate correlation, though the results did not significantly adhere to a trend line.
Macroinvertebrates
0
50
100C
umul
ativ
e Per
cent
Size (mm)
SRC
WR1
WR2
WR3
WR4
WR5
y = 30.043x - 14.612R² = 0.78355
-40
-20
0
20
40
60
80
100
120
140
160
180
0 1 2 3 4 5 6
Med
ian
Parti
cle S
ize
(mm
)
Distance (rv. mi)
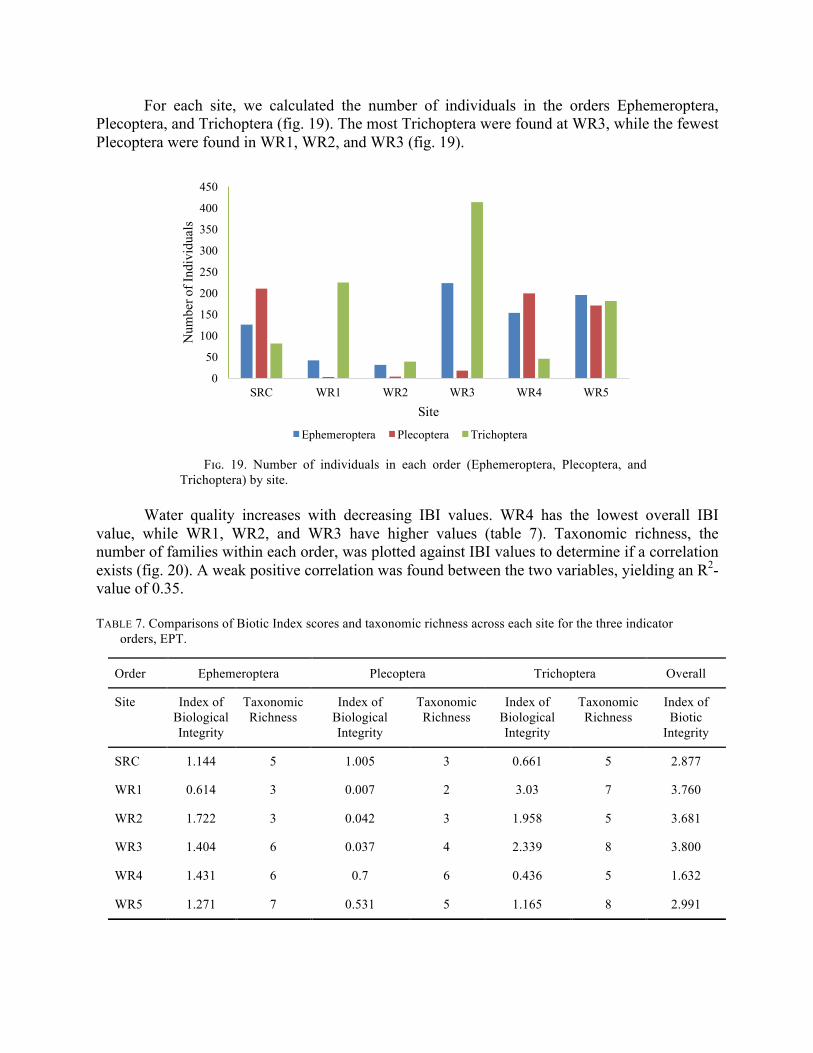
For each site, we calculated the number of individuals in the orders Ephemeroptera, Plecoptera, and Trichoptera (fig. 19). The most Trichoptera were found at WR3, while the fewest Plecoptera were found in WR1, WR2, and WR3 (fig. 19).
Fɪɢ. 19. Number of individuals in each order (Ephemeroptera, Plecoptera, and
Trichoptera) by site. Water quality increases with decreasing IBI values. WR4 has the lowest overall IBI value, while WR1, WR2, and WR3 have higher values (table 7). Taxonomic richness, the number of families within each order, was plotted against IBI values to determine if a correlation exists (fig. 20). A weak positive correlation was found between the two variables, yielding an R2-value of 0.35.
TABLE 7. Comparisons of Biotic Index scores and taxonomic richness across each site for the three indicator
orders, EPT.
0
50
100
150
200
250
300
350
400
450
SRC WR1 WR2 WR3 WR4 WR5
Num
ber o
f Ind
ivid
uals
Site
Ephemeroptera Plecoptera Trichoptera
Order Ephemeroptera Plecoptera Trichoptera Overall
Site Index of Biological Integrity
Taxonomic Richness
Index of Biological Integrity
Taxonomic Richness
Index of Biological Integrity
Taxonomic Richness
Index of Biotic
Integrity
SRC 1.144 5 1.005 3 0.661 5 2.877
WR1 0.614 3 0.007 2 3.03 7 3.760
WR2 1.722 3 0.042 3 1.958 5 3.681
WR3 1.404 6 0.037 4 2.339 8 3.800
WR4 1.431 6 0.7 6 0.436 5 1.632
WR5 1.271 7 0.531 5 1.165 8 2.991

Fɪɢ. 20. Correlation between taxonomic richness and Index of Biological Integrity
for Ephemeroptera, Plecoptera, and Trichoptera at all sites. A high proportion of scraper Ephemeroptera were found at WR1, WR2, WR3, and WR4 (fig. 21). Plecoptera tended to consist mostly of shredders (fig. 22), and Trichoptera tended to mostly include collectors (fig. 23).
FIG. 21. Trophic levels of Ephemeroptera found at each site.
0
50
100
150
200
250
SRC WR1 WR2 WR3 WR4 WR5
Ephe
mer
opte
ra A
bund
ance
Sitescollector scraper

FIG. 22. Trophic levels of Plecoptera found at each site.
FIG. 23. Trophic levels of Trichoptera found at each site.
DISCUSSION
Habitat Assessment
The habitat assessment enabled us to analyze how natural or man-made disturbances
influence stream characteristics along with documenting natural conditions. We documented the highest habitat assessment score at site WR5, which received a score of 91/100, and the lowest score at site WR1, which received a score of 58/100 (table 3). The components of the assessment
0
50
100
150
200
250
SRC WR1 WR2 WR3 WR4 WR5
Plec
opte
ra A
bund
ance
Sitesshredder predator
0
50
100
150
200
250
300
350
400
450
SRC WR1 WR2 WR3 WR4 WR5
Tric
hopt
era A
bund
ance
Sitescollector scraper shredder

that varied the most between the six sites were riffle characteristics, bottom substrate, and instream habitats (fig. 3). WR5 had wider, longer, and more frequent riffle habitats throughout the examined stretch compared to WR1.
Habitat assessment scores are greatly influenced by the characteristics of stream sediments (NCDENR 2012). Homogenous bottom substrates, regardless of sediment classification, lower total habitat assessment scores. A good mix of substrate provides more favorable habitats for colonization or cover for a variety of aquatic life. Bottom substrate scores and instream habitat scores fluctuated in unison with one another; when bottom substrate scores were lowest, instream habitat scores were also low (fig. 3). WR1 had bottom substrate that was homogeneously sand (D50 of 0.5-1.0 mm). Increased volumes of sand caused higher levels of embeddedness, which decreased the presence of instream habitats suitable for fish or macroinvertebrates. Embeddedness in WR5 was relatively low (20-40% embeddedness), so availability of instream habitats was greatest (available in >70% of the stream reach).
We found a slight negative correlation between riparian vegetative zone score and canopy cover (fig. 8). Breaks in the riparian zone resulted in a lower percentage of closed canopy because trees were absent. Analysis of temperature and pH yielded no significant conclusions that may indicate poor stream health, while channel width (table 1) increased as river mile increased.
Stream Visual Assessment Protocol (SVAP)
Cumulative SVAP score and distance from headwaters were inversely correlated for all six sites, with greater distance yielding lower scores. WR5, despite being the farthest site from the headwaters, did not follow this trend and received a relatively high score (fig. 4). This suggests that habitat suitability tended to decrease as distance from headwaters increased, with the exception of WR5. SRC and WR1 received the highest scores, 3.7/4, while WR4 received the lowest, 2.9/4. Between the six sites, bank condition, riffle embeddedness and streamside vegetation quantity appeared to be the most variable (fig. 4). The sites with the highest scores for bank condition tended to be largely free from man-made structures, while those with the lowest scores showed some signs of modification nearby. The lower scoring sites appeared to experience bank erosion as a result of runoff from these roads.
WR4, which scored the lowest both in regard to bank conditions and overall SVAP score, suffered from both residential development on one bank and proximity to a road on the other, thereby compromising bank stability. WR3 had the second lowest score due to the presence of a highway on the right bank. In contrast, the left bank was fully forested. The road reduced the right bank’s vegetation quantity to less than ⅓ of the stream’s width (score 1), compared to the left bank having a riparian zone that extends least 2 stream widths (score 4). There were also signs of erosion and bank failure on the right bank due to runoff from the road. Since the SVAP score is an average of left bank and right bank scores, the high scores of the left bank seemed to reduce the impacts of deterioration on the right bank. Habitat availability/cover score appeared to be the best predictor of overall SVAP score, seeing as how scores for this characteristic tended to decrease as distance from headwaters increased, with the exception of WR5. This suggests that habitat availability/cover condition is strongly influenced by the aggregate conditions of the other factors assessed in the SVAP.
The North Carolina Habitat Assessment and the Stream Visualization Assessment Protocol are both used to qualitatively describe stream characteristics. There are many categories

in which they overlap, such as instream habitats, pool variety, bank stability, and light penetration. However, they differ in the ways in which they score characteristics. The scores themselves are subjective in nature, left to personal discretion in the field. Because of differences in observer interpretation, the scores for the NC Habitat Assessment and SVAP were not always consistent. A comparison between the two assessments (Figs. 5 and 6) yielded that there was no correlation between the scores of corresponding components of both assessments. The information collected on both forms is still valuable, however, when considering a site’s suitability as macroinvertebrate habitat and stream health.
BEHI
As we sampled sites farther from the headwaters, we generally observed incrementally
lower BEHI scores (fig. 9). This pattern indicated that erosion potential is highest near the headwaters at Silver Run Creek for this localized stretch of river. Most indices followed the same decreasing trend, excluding bank angle, which increased with distance from headwaters (table 5). Non-adjusted scores display a similar decreasing trend. Adjustment and surface protection scores contributed the most to the final scores, while bank angle contributed the least. Subsequent adjustments based on bank material are an important contribution to the final BEHI scores; we see that all sites are given an adjustment score of 10, for the presence of sandy substrate in the bank, except WR3 and WR4, which exhibited substrate types that did not significantly affect erosion potential. Stream banks at SRC, WR1, WR2, and WR5 all featured sandy substrate, which is unstable and highly erodible and alters BEHI classification negatively.
Silver Run Creek produced the highest BEHI score, indicating the most significant potential for erosion. BEHI score for this reach was calculated near the base of Silver Run Falls, a 30 foot waterfall that discharges into a large eddy pool. We believe that during high discharge events, dissipation of energy below the falls erodes the soft bank stratum at the outlet of the splash pool, driving up the BEHI score. The SRC site has maximum scores for surface protection and root density, displaying very poor, if any, vegetative protection and reinforcement on the stream bank. Additionally, SRC is a recreational site with high levels of foot traffic nearby, possibly amplifying erosion potential locally.
WR4 yielded the lowest BEHI score of all sites, despite the proximity of artificial structures (wide bridge, residence, patio adjacent to stream bank). This contradictory result is likely credited to a combination of factors, primarily the nature of the specific measurement site, which was taken on river right, opposite of the residence, where vegetation was abundant in a wide riparian zone. Additional elements include a markedly healthy root depth ratio, a small bank angle, and a bank substrate firm enough not to merit an upward adjustment in the score.
As we moved downstream from the headwaters, the overall trend of BEHI scores decreased, with the exception of WR5. While the total BEHI score for WR5 was elevated, it produced fairly low individual scores for root depth ratio, root density, and bank angle. The high score for WR5 is largely attributed to high bank height ratio, the upward adjustment for the presence of sand in the bank, and poor surface protection. This channel is wide with no substantial floodplain, facilitating a considerable amount of flood flow within the channel. The bank exhibited varying degrees of stability, with sand a predominant component at the measurement site. These conditions likely lead to accelerated levels of erosion at the location observed.

The integrity of a stream bank is highly variable because stream characteristics are transformed by weather elements, channel evolution and other external factors over time. There is minimal antecedent data available for Whitewater River to use as a reference for stream bank behavior in previous years, so it is difficult to ascertain the behavior of the bank. Additionally, these BEHI scores represent the erosion potential of narrow segments of stream and are not necessarily indicative or predictive of the overall integrity of the stream bank.
Pebble Count
Competence is defined as the ability of a stream to mobilize larger sediment class sizes. According to the River Continuum Concept proposed by Vannote et al. (1980), competency tends to decrease from headwater to mouth, while capacity, or the ability of a stream to carry a certain sediment load, increases from headwater to mouth. The pebble count distributions demonstrate that WR5 (fig. 16) and SRC (fig. 11) had larger sediments, and WR1 (fig. 12), WR2 (fig. 13) and WR4 (fig. 15) had smaller sediments. Since stream slope and velocity are interrelated, these results likely indicate that WR1, WR2, and WR4 exhibited less competence due to a lower slope although we did not conduct measurements of slope or velocity to support this. SRC and WR5 likely showed greater competency because of a steeper slope. Our study sites do not clearly display the trend in competency described by the River Continuum Concept because competency is higher in WR5 which is downstream and lower in WR1 which is further upstream. Due to the mountainous nature of the region of study, the slope of study sites was highly variable and impacted stream velocity, resulting in more variation in competency and sediment size.
Pebble count distributions and D50 values appear highly variable across the extent of the study with the lowest D50 value occurring at WR4 at 0.25-0.5 mm (fig. 17) and the highest at WR5 at 90-128 mm (fig. 17). The R2-value of 0.784 for the median particle size versus distance plot (fig. 18) demonstrates that there is not a strong trend in particle size over distance. Again, this is likely due to a high variability in slope between our study sites.
Variety of sediment sizes within a reach increases microhabitat for fish and benthic macroinvertebrates, supporting greater local biodiversity (Vannote et al. 1980, Graça et al. 2004). Based on these criteria, sites such as WR3 with a more even distribution of sediment sizes appear to have greater habitat diversity within the stream. WR3 also had a more even distribution of habitat types consisting of 49% runs and glide, 20% riffles, and 31% pools (fig. 10). Nonetheless, it is important to consider other factors such as embeddedness and riparian zone width when assessing habitat diversity; these factors are included in the habitat assessment. Pebble counts and morphological characteristics can still be used to give an idea of habitat availability within the stream. WR4, for examples, had the smallest D50 values (fig. 17) and the most uneven distribution of habitat types with 32% runs and glides, 68% pools, and no riffles (fig. 10). These factors would contribute to the relatively low habitat score of 61 in WR4 (table 3).
Macroinvertebrates
We used EPT indices as a measure of overall stream health and, indirectly, of potential pollutants in the water, as a greater number of taxa in each order typically indicates cleaner water (NRCS 2012). Aquatic insects respond to various organic pollutants and display tolerance levels

to short and long-term contaminations of water quality (NRCS 2012). The highest number of taxa was found at WR5, with 19 different families between the three orders. Plecoptera are the most sensitive to pollutants and dissolved oxygen levels (Buchanan et al. 2011). Sites with the lowest numbers of individuals in Plecoptera included WR1, WR2, and WR3. Existing literature suggests that these low numbers could indicate the presence of pollutants or low levels of dissolved oxygen (Wallace et al. 1996).
Though we did not sample water for dissolved oxygen levels or the presence of chemical pollutants, other survey methods sought to qualify these factors. The Stream Visual Assessment Protocol accounts for physical and chemical pollutants, the latter of which was only evident at WR2 and WR4. Riffles are expected to have higher concentrations of dissolved oxygen than other stream habitats (Connolly et al. 2004), so it is appropriate to use riffle presence and frequency as a qualitative indicator of dissolved oxygen.
According to the Habitat Assessment form, riffles occurred infrequently at sites WR1 and WR2, both yielding scores of 3. There were no natural riffles recorded on the Habitat Assessment form at WR4, yet high levels of macroinvertebrates within the order Plecoptera were found. In WR4, we observed that the stream bed had a large amount of leaf litter. Order Plecoptera has a high number of shredder taxa, which feed on leaf litter, which could explain the high number of Plecoptera despite the lack of riffles (NCSU 2008). Because our study sites were located in low-order streams, we would expect shredders to be relatively high in number due to the high input of leaf litter and organic matter from the forested catchment (Wallace and Webster 1996).
We also examined trophic diversity for families within the EPT orders. Ratios of trophic levels indicated the dominant ecosystem function of macroinvertebrate communities within a reach (Merritt et al. 2008). The majority of those individuals belonging to the order Trichoptera were collectors. Collectors feed in part on the broken down organic matter produced by shredders. Therefore, the high numbers of shredders in the order Plecoptera may provide the resources needed for collectors to proliferate.
An apparent lack of correlation between EPT presence and anticipated stream quality suggests that there were either discrepancies in sampling and observing riffles, that other characteristics of riffles apart from mere presence within a reach are more important for macroinvertebrates, or that chemical pollutants are having a stronger impact on EPT numbers than is reflected in other elements of the study. Since no strong relationship was evident between EPT Indices and taxa richness, it is difficult to draw conclusions. Further research testing for dissolved oxygen levels and chemical pollutants will reveal if outside inputs unrepresented in this study are having an impact on macroinvertebrate diversity within the Whitewater River system.
Sources of Error Although we attempted to keep specimens from each site separate in the lab, we
inadvertently mixed macroinvertebrate samples from WR1 and WR2. As a result, we are not able to accurately draw conclusions from these samples. Macroinvertebrate characteristics are difficult to discern by the untrained eye, so there is a possibility that we misidentified some of the specimens. Additionally, some delicate specimens were destroyed or damaged during the collection process, and some sampled from the earliest sites decomposed due to lengthy time in ethanol solution diluted by stream water. The specimens that were identified may not have

yielded truly accurate results. Since we identified the insects to family level IBI, our data does not describe the exact tolerance level for each organism we found; their tolerance levels may have been different if they were further divided into genus or species. In order to ensure that all members could practice each method of data collection, different people were assigned to collect different sets of data at each site. This introduced inconsistencies in the evaluation of qualitative data, as each researcher has slightly different standards. We did not initially collect pH and temperature for SRC when we gathered the rest of the data and subsequently took those measurements the following week. As we surveyed stream locations on different dates over the course of two months, the sites were not subject to the same environmental and seasonal conditions such as temperature, rainfall, and canopy cover at the times of data collections.
CONCLUSIONS
Our survey of six sites in the Whitewater River watershed revealed evidence that there are structural threats that may disturb ecosystem functioning in this mountain stream. While few overall trends in stream health were evident, we recorded notable instances of low habitat diversity and high risk of erosion.
NC Habitat Assessment scores were lowest at sites WR1 and WR2, where fine sediment deposition and low riffle presence resulted in sub-optimal conditions for stream organisms. BEHI values also identified that the risk of erosion may be increased during high-rainfall events at the headwaters. In contrast to the pattern expressed in Habitat Assessment scores, SVAP scores tended to decrease as distance from the headwaters increased, indicating that these assessment methods reveal separate qualities of riverine health and are not comparable. SVAP scores identified WR4 as an area of particularly low habitat quality, as it lacked riffles all together. Riparian development and modification in the form of rip-rap and a low amount of riparian vegetation as revealed by this protocol pose significant stream quality risks at WR4. However, low abundance of macroinvertebrates within the order Plecoptera may suggest that some sites had poor dissolved oxygen levels and moderate levels of pollution. High IBI values at most sites supports that anthropogenic disturbances may be impacting stream health. A lack of correlation between the results of different stream health assessments failed to identify the most heavily impacted sites, possibly suggesting that all stream sites were negatively impacted by the encompassing watershed in different ways.
Assessment scores may have been depressed by low water levels due to an extended drought across Western North Carolina at the time of the study. Further data collection in this area during a time of more typical rainfall would be useful, for the results of this study do not reflect typical fluvial conditions for the watershed.
ACKNOWLEDGEMENTS
We would like to thank Steve Foster for his mentorship and guidance throughout this project, his readiness to share his wealth of knowledge in fluvial ecology and his contagious enthusiasm for the subject, his editorial assistance, and his genuine encouragement. We would also like to thank Alyssa Fuller for her help in the field and laboratory, for teaching us to identify macroinvertebrates, and for laughing at our terrible jokes. We are grateful to Drs. James Costa and Sarah Workman and the Highlands Biological Station at large for hosting, facilitating and funding our research project and semester.
LITERATURE CITED
Allan, J. D., and M. M. Castillo. 2007. An introduction to fluvial ecosystems. Stream Ecology: Structure and
Function of Running Waters. Dordrecht, The Netherlands: Springer. Brigham, A. R., W. R. Brigham, and A. Gnilka. 1982. Aquatic insects and oligochaetes of North and South
Carolina. Mahomet, Illinois (USA): Midwest Aquatic Enterprises. Buchanan, C., K. Foreman, J. Johnson, and A. Griggs. 2011. Development of a basin-wide benthic index of biotic
integrity for non-tidal streams and wadeable rivers in the Chesapeake Bay watershed: final report to the Chesapeake Bay Program Non-Tidal Water Quality Workgroup. University of Maryland Center for Environmental Science.
Connolly, N. M., M. R. Crossland, and R. G. Pearson. 2004. Effect of low dissolved oxygen on survival, emergence, and drift of tropical stream macroinvertebrates. Journal of the North American Benthological Society, 23:251-270.
Death, R. G., and M. J. Winterbourn. 1995. Diversity patterns in stream invertebrate communities: the influence of habitat stability. Ecology 76:1446-1460.
Environmental Systems Research Institute (ESRI). 2015. ArcGIS Desktop: Build 5524 (10.4). Redlands, California, USA.
Graça, M. A. S., P. Pinto, R. Cortes, N. Coimbra, S. Oliveira, M. Morais, M. J. Carvalho, and J. Malo. 2004. Factors affecting macroinvertebrate richness and diversity in Portuguese streams: a two-scale analysis. International Review of Hydrobiology. 89:151-164.
Hilsenhoff, W. L. 1977. Use of arthropods to evaluate water quality of streams. Madison, WI: Department of Natural Resources. Technical Bulletin No. 100.
Hilsenhoff, W. L. 1988. Rapid field assessment of organic pollution with a family-level biotic index. Journal of the North American Benthological Society 7:65-68.
Land Trust for the Little Tennessee (LTLT). 2014. Grade your stream program planning guide. Athens, Georgia: Crawford, T. G., C. E. Mertzlufft, J. Bloodgood, S. Ortiz, E. Guinessey, C. Brownson, H. Burnett, J. Chappell, J. Howard, L. Kosen, N. Heynen, and C. Pringle.
Merritt, R.W., K. W. Cummins, and M.B. Berg. 2008. An introduction to the aquatic insects of North America. 4th ed. Dubuque, Iowa (USA): Kendall/Hunt Publishing Company.
Natural Resources Conservation Service (NRCS). 1990. Climate Narrative for Jackson County, North Carolina. www.wcc.nrcs.usda.gov/legacy/ftp/support/climate/soil-nar/nc/jackson.doc
Natural Resources Conservation Service (NRCS): Watershed Science Institute. 2012. The EPT Index. www.wcc.nrcs.usda.gov/ftpref/wntsc/strmRest/wshedCondition/EPTIndex.pdf
North Carolina Department of Environmental Quality (NCDEQ). 2008. Savannah River Basin Restoration Priorities 2008. North Carolina Ecosystem Enhancement Program. https://ncdenr.s3.amazonaws.com/s3fs-public/PublicFolder/Work%20With/Watershed%20Planners/Savannah_RBRP_hcb_22dec08.pdf
North Carolina State University (NCSU). 2008. Biotic index and feeding type calculations. NCSU Stream Restoration Program. https://www.bae.ncsu.edu/programs/extension/wqg/srp/taxonomy/biotic_index.pdf
Newton, B., C. Pringle, and R. Bjorkland. 1998. Stream Visual Assessment Protocol. National Water and Climate Center Technical Note 99–1. Washington, DC (USA): Natural Resources Conservation Service, USDA.
North Carolina Department of Environment and Natural Resources (NCDENR): Division of Water Quality. 2012. Standard Operating Procedures for Benthic Macroinvertebrates. NC Department of Environment and Natural Resources. Environmental Sciences Section, Biological Assessment Unit. Raleigh, North Carolina (USA).
Rathbun, J. 2008. Standard Operating Procedure, assessing bank erosion potential using Rosgen’s Bank Erosion Hazard Index (BEHI). Michigan Department of Environmental Quality, Water Bureau, Nonpoint Source Unit.
Resh, V. H., A. V. Brown, A. P. Covich, M. E. Gurtz, H. W. Li, G. W. Minshall, S. R. Reice, A. L. Sheldon, J. B. Wallace, and R. C. Wissmar. 1988. The role of disturbance in stream ecology. Journal of the North American Benthological Society 7:433-455.
Rosgen, D. L. 2001. A practical method of computing streambank erosion rate. Proceedings of the 7th Federal Interagency Sedimentation Conference, Reno, Nevada (USA). 2:9-15.
Upper Cullasaja Watershed Association (UCWA). 2004. Upper Cullasaja Watershed Strategy and Action Plan. 1-44.
United States Department of Agriculture (USDA), Natural Resources Conservation Service. 2009. Stream Visual Assessment Protocol Version 2. Prepared by Kathryn Boyer et al. 190–VI–NBH.
Vannote, R. L., G. W. Minshall, K. W. Cummins, J. R. Sedell, and C. E. Cushing. 1980. The river continuum concept. Canadian journal of fisheries and aquatic sciences 37: 130-137.
Wallace, J. B., J. W. Grubaugh, and M. R. Whiles. 1996. Biotic indices and stream ecosystem processes: results from an experimental study. Ecological Applications 6: 140–151. Web.
Wallace, J. B. and J. R. Webster. 1996. The role of macroinvertebrates in stream ecosystem function. Annual Review of Entomology 41:115 - 139.
WeatherDB. 2016. Cashiers, North Carolina Average Rainfall. 7 Dec 2016. Web. Wolman, M. G. 1954. A method of sampling coarse river-bed material. EOS, Transactions American Geophysical
Union 35:951-956. Wolman, M. G. 1967. A cycle of sedimentation and erosion in urban river channels. Geografiska Annaler 49:385-
395.