an assessment of oral health status and treatment …
TRANSCRIPT
AN ASSESSMENT OF ORAL HEALTH STATUS
AND TREATMENT NEEDS OF 12 AND 15
YEARS OLD SCHOOL GOING CHILDREN OF
FISHERMEN COMMUNITY RESIDING AT
EAST COAST ROAD, CHENNAI, TAMILNADU
Dissertation Submitted to
THE TAMILNADU Dr. M.G.R. MEDICAL UNIVERSITY
In Partial Fulfillment for the Degree of
MASTER OF DENTAL SURGERY
BRANCH VII
PUBLIC HEALTH DENTISTRY
MARCH 2013

THE TAMIL NADU Dr. MGR MEDICAL UNIVERSITY
CHENNAI
DECLARATION BY THE CANDIDATE
I hereby declare that this dissertation titled “An assessment
of Oral health status and Treatment needs of 12 and 15 years
old School going children of Fishermen community residing at
East coast road, Chennai, Tamil Nadu” is a bonafide and
genuine research work carried out by me under the guidance of
Dr.M.Shivakumar MDS, Professor and Head of the Department
of Public Health Dentistry, Ragas Dental College and Hospital,
Chennai.
Date:
Place: Chennai
Dr. M.Rajmohan
Post Graduate Student
Dept of Public Health Dentistry,
Ragas Dental College and Hospital,
Chennai.


THE TAMIL NADU Dr. MGR MEDICAL UNIVERSITY
CHENNAI
COPYRIGHT
DECLARATION BY THE CANDIDATE
I hereby declare that The Tamil Nadu
Dr. M.G.R. Medical University, Chennai, Tamil Nadu
shall have the right to preserve, use and disseminate this
research work in print or electronic format for academic /
research purpose.
Date: Signature of the Candidate
Place: Chennai Dr.M.Rajmohan
Acknowledgement
ACKNOWLEDGEMENT
I thank Dr.M.Shivakumar MDS., Professor and Head of the
Department of Public Health Dentistry, Ragas Dental College and Hospital,
Chennai, who has been instrumental in shaping my views throughout the
completion of my dissertation in all aspects. His enthusiasm and unlimited
zeal proved to be a major driving force throughout the dissertation
completion. Sir, I solemnly express my deep felt gratitude for your valuable
and great guidance and suggestions.
I express my deep sense of gratitude to Dr.P.D.Madan Kumar MDS.,
Associate Professor, who was there at each step guiding me to prepare this
dissertation. I am deeply grateful for his detailed and constructive comments,
and for his important support throughout this work.
I also thank Dr.I.Nandabalan MDS., and Dr.S.Shyam MDS., Senior
Lecturers for their motivation and suggestions towards the completion of the
dissertation.
I take this opportunity to thank Dr. S. Ramachandran MDS.,
Principal, Ragas Dental College & Hospital and Dr. N.S. Azhagarasan,
MDS., and Dr.N.R.Krishnaswamy, MDS., Vice-Principals, Ragas Dental
College for their generous support rendered throughout my course.

Acknowledgement
I would like to extend my gratitude to Mr. Porchelvan, Statistician, for
his valuable help in statistical analysis.
I like to thank Mrs.Selvakumari, the Chief Educational Officer,
Kancheepuram District for giving me permission to carry out this dissertation.
I would also like to thank Mr.Julius, the Assistant Director of Fisheries,
Neelangarai for providing data regarding Fishermen. A special thanks to all
the Head Mistress, Teachers and Students who participated in this study
without whom this project would have ever been possible.
I also thank my batchmate Dr.K.Rajeswary for encouraging me and
helping me in completing this dissertation. I extend my gratitude to my
seniors Dr. S.Aparna and Dr.Delfin Lovelina and Juniors Dr.S.Arun kumar
and Dr.M.Dinesh Dhamodar for their friendly help, support and cooperation
throughout my postgraduate life.
I express my love and thanks to my loving Dad and Mom and all at
home who made my dreams come true.
Truly,
Dr.M.Rajmohan
Abstract
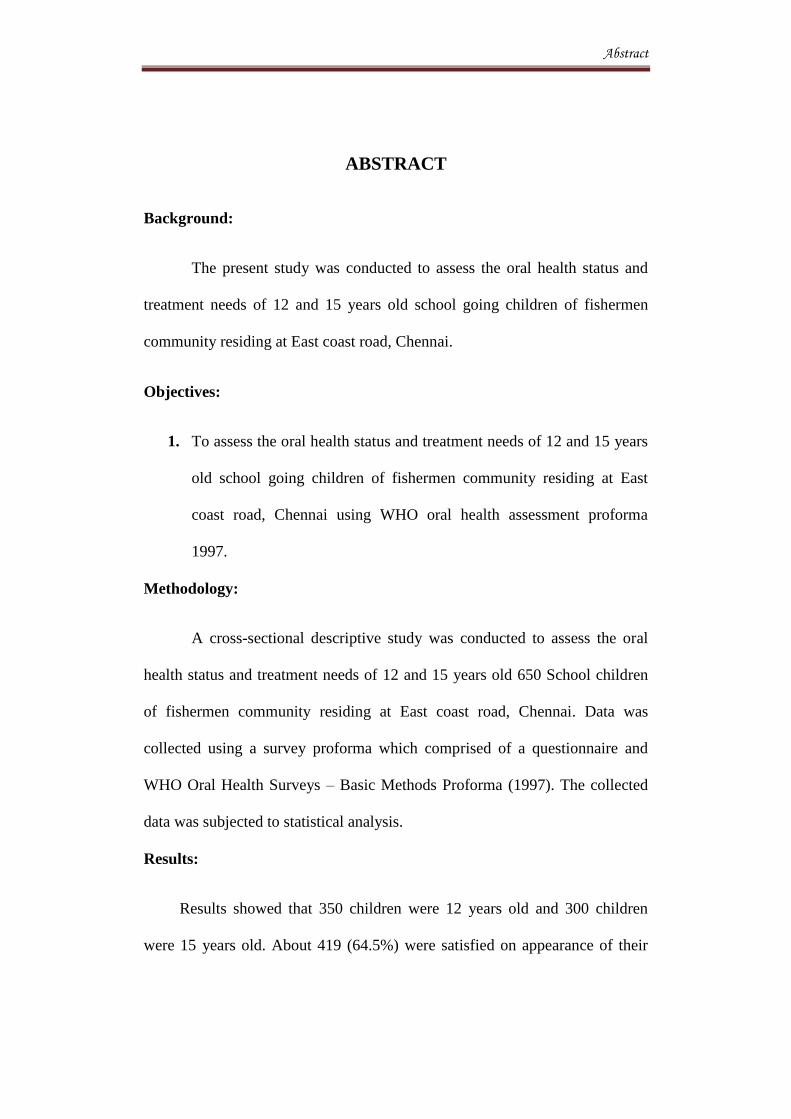
ABSTRACT
Background:
The present study was conducted to assess the oral health status and
treatment needs of 12 and 15 years old school going children of fishermen
community residing at East coast road, Chennai.
Objectives:
1. To assess the oral health status and treatment needs of 12 and 15 years
old school going children of fishermen community residing at East
coast road, Chennai using WHO oral health assessment proforma
1997.
Methodology:
A cross-sectional descriptive study was conducted to assess the oral
health status and treatment needs of 12 and 15 years old 650 School children
of fishermen community residing at East coast road, Chennai. Data was
collected using a survey proforma which comprised of a questionnaire and
WHO Oral Health Surveys – Basic Methods Proforma (1997). The collected
data was subjected to statistical analysis.
Results:
Results showed that 350 children were 12 years old and 300 children
were 15 years old. About 419 (64.5%) were satisfied on appearance of their

Abstract
teeth. Majority of the children, 617 (94.9%) used tooth paste and tooth brush
to clean their teeth A large percentage of the children, 424 (65.2%) had not
visited dentist before. Of those visited, 133 (58.8%) children had visited
dentist for Tooth ache. Mean DMFT Value of 12 year old private and
Government school children were 2.01 and 2.27 respectively. While Mean
DMFT value of 15 year old private and Government school children were 2.28
and 3.15 respectively. Majority of the children, 351 (54%) were in Watch-out
zone during sweet score calculation with significant relation to DMFT.
Majority of the children, 464 (71.3%) were taking fish more than 3 days in a
week with significant relation to DMFT. 172 (26.5%) children had definite
malocclusion and needed elective treatment. 30 (4.6%) children had severe
malocclusion and treatment is highly desirable.
Conclusion:
The oral health status of fishermen children was poor with high
prevalence of periodontal disease and dental caries. Regular oral examinations
by dental professionals, dental health education to motivate subjects to receive
regular dental check-up and to maintain oral hygiene, adoption by nearby
Dental colleges if any and involvement of NGO’S like Rotary Club, Lions
Club, IDA will be needed to improve the oral health status of these workers.
Key words:
Fishermen community, oral health status, WHO oral health proforma,
treatment needs.

CONTENTS
S.NO. INDEX PAGE NO.
1.
INTRODUCTION 1-4
2.
AIM AND OBJECTIVES 5
3.
REVIEW OF LITERATURE 6-18
4.
MATERIALS AND METHODS 19-27
5.
RESULTS 29-63
6.
DISCUSSION 64-74
7.
SUMMARY 75-77
8.
CONCLUSION 78
9.
RECOMMENDATION 79
10.
BIBLIOGRAPHY 80-84
11.
ANNEXURE 85-91
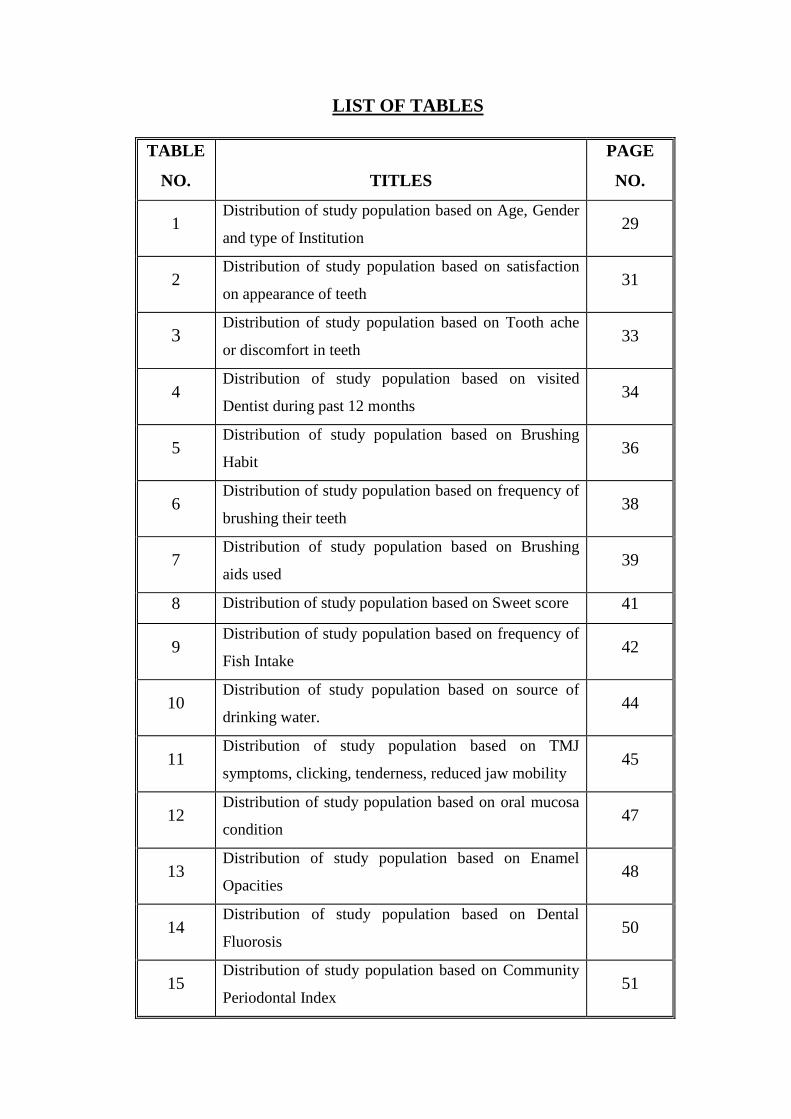
LIST OF TABLES
TABLE
NO.
TITLES
PAGE
NO.
1 Distribution of study population based on Age, Gender
and type of Institution 29
2 Distribution of study population based on satisfaction
on appearance of teeth 31
3 Distribution of study population based on Tooth ache
or discomfort in teeth 33
4 Distribution of study population based on visited
Dentist during past 12 months 34
5 Distribution of study population based on Brushing
Habit 36
6 Distribution of study population based on frequency of
brushing their teeth 38
7 Distribution of study population based on Brushing
aids used 39
8 Distribution of study population based on Sweet score 41
9 Distribution of study population based on frequency of
Fish Intake 42
10 Distribution of study population based on source of
drinking water. 44
11 Distribution of study population based on TMJ
symptoms, clicking, tenderness, reduced jaw mobility 45
12 Distribution of study population based on oral mucosa
condition 47
13 Distribution of study population based on Enamel
Opacities 48
14 Distribution of study population based on Dental
Fluorosis 50
15 Distribution of study population based on Community
Periodontal Index 51

16 Distribution of study population based on Crown Status 52
17 Distribution of study population based on Root status 54
18 Distribution of study population based on Treatment
needs 55
19 Distribution of study population based on Mean DMFT 57
20 Distribution of study population based on Prosthetic
treatment needs 58
21 Distribution of study population based on Aesthetic
Index (DAI) 62

LIST OF GRAPHS
GRAPH
NO.
TITLES
PAGE
NO.
1 Distribution of study population based on Age,
Gender and type of Institution 30
2 Distribution of study population based on satisfaction
on appearance of teeth 31
3 Distribution of study population based on Tooth ache
or discomfort in teeth 33
4(a) Distribution of study population based on visited
Dentist during past 12 months 35
4(b) Distribution of study population based on reason for
last Dental visit 35
5 Distribution of study population based on Brushing
Habit 37
6 Distribution of study population based on frequency
of brushing their teeth 38
7 Distribution of study population based on Brushing
aids used 40
8 Distribution of study population based on Sweet score 41
9 Distribution of study population based on frequency
of Fish Intake 43
10 Distribution of study population based on source of
drinking water 44
11 Distribution of study population based on TMJ
symptoms, clicking, tenderness, reduced jaw mobility 46
12 Distribution of study population based on oral mucosa
condition 47
13 Distribution of study population based on Enamel
Opacities 49
14 Distribution of study population based on Dental
Fluorosis 50
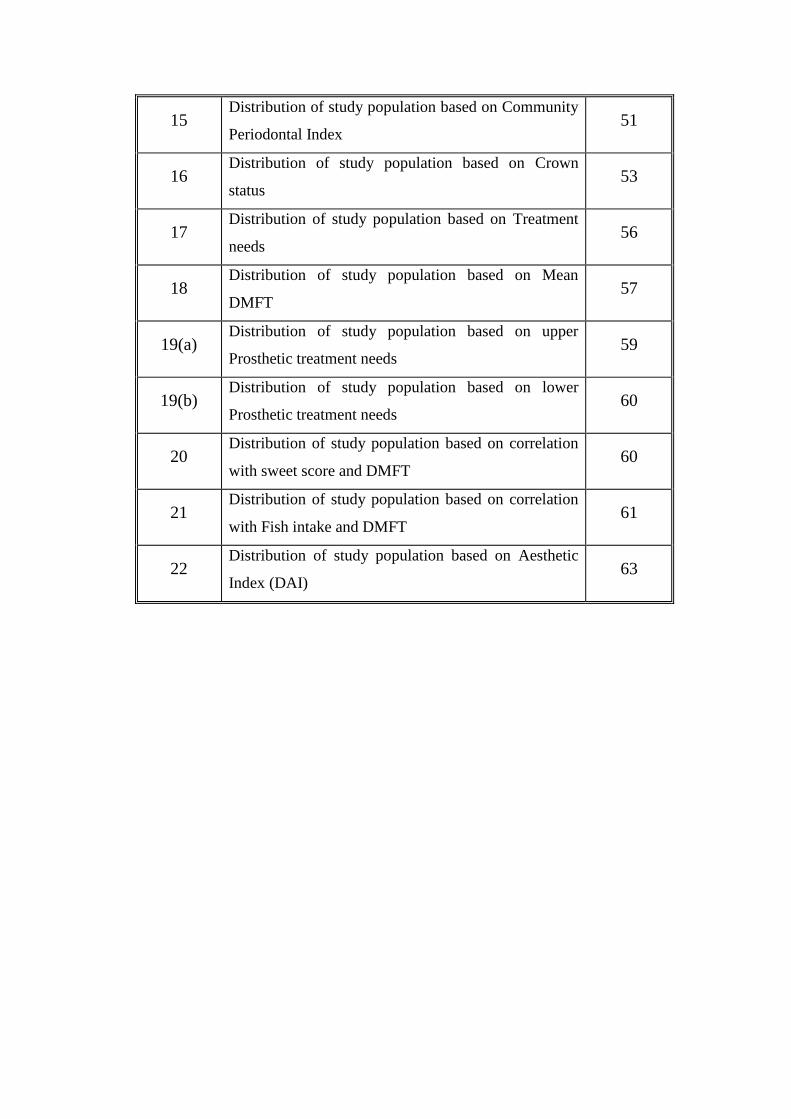
15 Distribution of study population based on Community
Periodontal Index 51
16 Distribution of study population based on Crown
status 53
17 Distribution of study population based on Treatment
needs 56
18 Distribution of study population based on Mean
DMFT 57
19(a) Distribution of study population based on upper
Prosthetic treatment needs 59
19(b) Distribution of study population based on lower
Prosthetic treatment needs 60
20 Distribution of study population based on correlation
with sweet score and DMFT 60
21 Distribution of study population based on correlation
with Fish intake and DMFT 61
22 Distribution of study population based on Aesthetic
Index (DAI) 63

LIST OF FIGURES
FIGURES
NO.
TITLES
PAGE
NO.
1 Oral Examination 28
2 Armamentarium 28

Introduction
1
INTRODUCTION
Health is a fundamental human right and is the essence of productive
life. Health implies the relative absence of pain and discomfort and a
continuous adaptation and adjustment to the environment to ensure optimal
function.1
Health is multi-factorial, the factors which influence health lie both
within the individual and externally in the society in which he or she lives.
Each disease has its unique natural history, which is not necessarily the same
in all individuals. Disease results from a complex interaction between man,
age and environment.2
Oral health is an integral part of general health. Poor oral health can
have a detrimental effect on general health. The mouth is also a portal of entry
for pathogens and toxins, which can affect the oral health and if not cleared by
the many defense mechanisms that have evolved to protect the oral cavity,
may spread to the rest of the body.3
The consequences of poor oral hygiene
and a diseased mouth can be disastrous to general health. In India, the major
oral diseases are Dental caries and Periodontal diseases. According to National
oral Health survey and Fluoride mapping of 2002,4
the prevalence of Dental
caries was increasingly high in children and it is said that 60% of children in
India were affected by Dental caries and were classified as High-risk
population. In case of children, oral health plays a vital role. Oral health
renders profound influence on children’s growth and development, on their
physical, mental and social aspects, their performance in school, and hence

Introduction
2
their success in their later life time.5 Studies have shown that children who
suffer from poor oral health are twelve times more likely to have more
restricted-activity days including missing school than children with good oral
health.6
The oral health of children is a significant public health issue.7
Oral
diseases are diet and behavior-related diseases. Childhood oral diseases, if
untreated, can lead to irreversible damage, pain, disfigurement and more
serious general health problems. It will also cause loss of school time, low
self-esteem and poor quality of life among children.8
India is a federation composed of 28 states and 7 union territories and is
the seventh-largest country by geographical area, occupying 2.4% of the
world's land area and is the second-most populous country with over 1.2
billion people supporting over 17.5% of the world's population. India having a
diverse population with Agriculture as the predominant occupation in Rural
India, accounting for about 52% of employment while livestock, forestry,
fishing, hunting, plantations, orchards, and allied activities accounts for
2 percent.
Southern India being a peninsula, Fishing is a major industry in its
coastal states, employing over 14 million people. Length of Coastline of
Indian mainland is 6100 km with about 3827 fishing villages.9
Coastline of
Indian mainland is surrounded by Arabian Sea in the west, Bay of Bengal in
the east, and Indian Ocean in the south. The long coast line of India is dotted

Introduction
3
with several major ports such as Kandla, Mumbai, Mangalore, Marmagoa,
Cochin in west coast and Chennai, Tuticorin, Vishakapatnam, and Paradip in
its east coast. The state of Tamil Nadu has a long coastline of over 1076 km
covering 13 districts.10
Chennai, sometimes referred to as the "Gateway to
South India", is located on the south–eastern coast of India in the
north–eastern part of Tamil Nadu on a flat coastal plain known as the Eastern
Coastal Plains. The beach line of Chennai called the Marina Beach runs for
13 km along the shoreline of the city and is the second longest urban beach in
the world. Hence, fishing is a major occupation in coastal areas of Chennai.
Fishing is a term applied to any activity which aims to capture fish or
shellfish for subsistence, scientific, commercial or recreational purposes.9
A Fisherman is a person who engages in the activity of fishing. Some
fishermen do this as profession, and may belong to a cooperative, corporation
or union. Fishing may also be a subsistence activity.
The occupation of fishing is stressful due to difficult physical
conditions, dislocation, isolation and less than ideal personal habits.11
Fishermen have prolonged hours of continuous work, which are found to be
correlated with high cigarette and alcohol consumption.12
Diet is lacking in
fruits and vegetables and meals eaten at very erratic intervals.13
Fishermen
have lower socioeconomic status and their illiteracy adds to their poor oral
hygiene, which may influence general and oral health.14
Oral diseases seem to
be the most common health problem of seafarers world wide. Seafaring as an

Introduction
4
occupation due to long sea voyages, the access to seamen to dental services is
very limited and making regular check ups.15
Fishermen due to their stressful
work in the night, would rest in day hours and they may not spare time to take
care of their health and also their children’s health and have poor oral health
when compared with that of general population.16
As a result, Fishermen
having little attention towards the oral health of children, they may be more
prone for dental diseases. Also with the associated factors like diet, oral
hygiene practice, they are at high risk population for dental caries and other
dental diseases In India only few studies were done to assess the oral health
status of fishermen children, so this study was done to assess the oral health
status and treatment needs of 12 and 15 years old school going children of
fishermen community residing at East coast road, Chennai.

Aim and Objectives
5
AIM AND OBJECTIVES
AIM:
The aim of the study is to assess oral health status and treatment needs
of 12 and15 years old school going children of fishermen community residing
at East coast road, Chennai.
OBJECTIVES:
1. To assess the oral health status and treatment needs of 12 and 15 years old
school going children of fishermen community residing at East coast
road, Chennai using WHO oral health assessment proforma 1997.
2. To assess the oral health perception, oral hygiene practices and diet
pattern using a pretested questionnaire.
3. To compare the oral health status among these Children based on Age and
Type of institution.
4. To suggest a Dental public health programme to cater the dental health
needs of school going children of fishermen community residing at East
coast road, Chennai using the obtained data.

Review of Literature
6
REVIEW OF LITERATURE
Bhat.M,Nagesh.L,Akola.A (2007)17
conducted a study to assess the
dental caries status and treatment needs of 267 children upto the age of 14
years belonging to fisher folk communities in coastal areas of Karnataka.
WHO (1997) assessment criteria was used. Results revealed that among 155
subjects in 10-14 years age groups, 125 (80.64%) were affected by dental
caries. Mean DMFT among 10-14 years age group was 1.896. According to
treatment needs required among 10-14 years an average of 0.625 teeth needed
one surface filling, 0.464 teeth required two surface filling, 0.335 teeth needed
pulp care and 0.439 teeth needed extraction. It was concluded that magnitude
of dental diseases was high in these children. Diet, availability of sticky
carbohydrate rich food, presence of certain trace elements like selenium,
relative humidity might have influenced the occurrence of Dental caries in this
study population.
Reddy.V.C, Priya.S.H, Chaly.P.E, Ingle.N.A (2011)18
conducted a
study to assess the prevalence of malocclusion and orthodontic treatment
needs among 300 school children of 12-15 years old of Maduravoyal area,
Chennai. Malocclusion was recorded according to the components of Dental
Aesthetic Index as described by WHO oral health survey. The results revealed
that 66 (22%) children had no segment crowding and 234 (78%) had one or
two segment crowding. A total of 231(77%) children had no segment spacing
and 69 (23%) children had one or two segment spacing. 261 children (87%)

Review of Literature
7
had no midline diastema, 39(13.1%) had > 1mm diastema. 155 children
(51.7%) had normal molar relation, 112(37.3%) had half cusp deviation and
33(11%) had full cusp deviation. Overall prevalence of malocclusion was
73.7%, out of which 79(26.3%) had no abnormality. 110(36.7%) had definite
malocclusion requiring elective treatment, 83(27.7%) had severe malocclusion
requiring highly desirable treatment.
Shivakumar.V,Gopinath.V,Saravanakumar.R,Anitha.V,Shanmug
am.M (2011)19
conducted a study to find the prevalence and determinants of
dental caries among 1205 school children of age group 4-17 years in Padur,
Kanchipuram. WHO (1997) criteria was used to assess Dental caries. The
results revealed that 64% of school children had dental caries. The prevalence
is more in corporation and Government schools compared to private schools.
Compared to those children who use pipe water for drinking, the odds of
suffering from Dental caries was 2 times higher than those who use bore water
for drinking. School children who brush only once a day had 94% higher odds
of suffering from dental caries compared to those who brush twice or more
times a day (OR=1.94). It was conclude that important policy and program
implications, including the need for public information campaigns designed to
inform people about the prevalence of Dental caries is required to promote
access to improved dental care.
Kumari.M,Saha.S,Jaganath.G.V,Mohammad.S (2011)20
conducted
a study to assess the periodontal status of 1198 12 and 15 years old urban and
Review of Literature
8
rural school going children of Lucknow. The results revealed that among 594
urban and 604 rural subjects, 593 used tooth brush and tooth paste while in
rural population 282(46.69%) used tooth brush and tooth paste and
312(51.66%) used tooth brush and tooth powder to clean their teeth. In urban
573 brushed once daily and 21(3.53%) brush twice daily. In urban area
335(56.40%) had healthy score, 127(21.38%) had bleeding score and
132(22.22%) had calculus score. In rural 244b (40.39%) had healthy
periodontium, 160(26.49%) had bleeding and 200(33.13%) had calculus. They
concluded that exploring these links between clinical condition and personal
and social outcomes provides opportunity to identify interventions to
minimize consequences of oral diseases by dental health programmes.
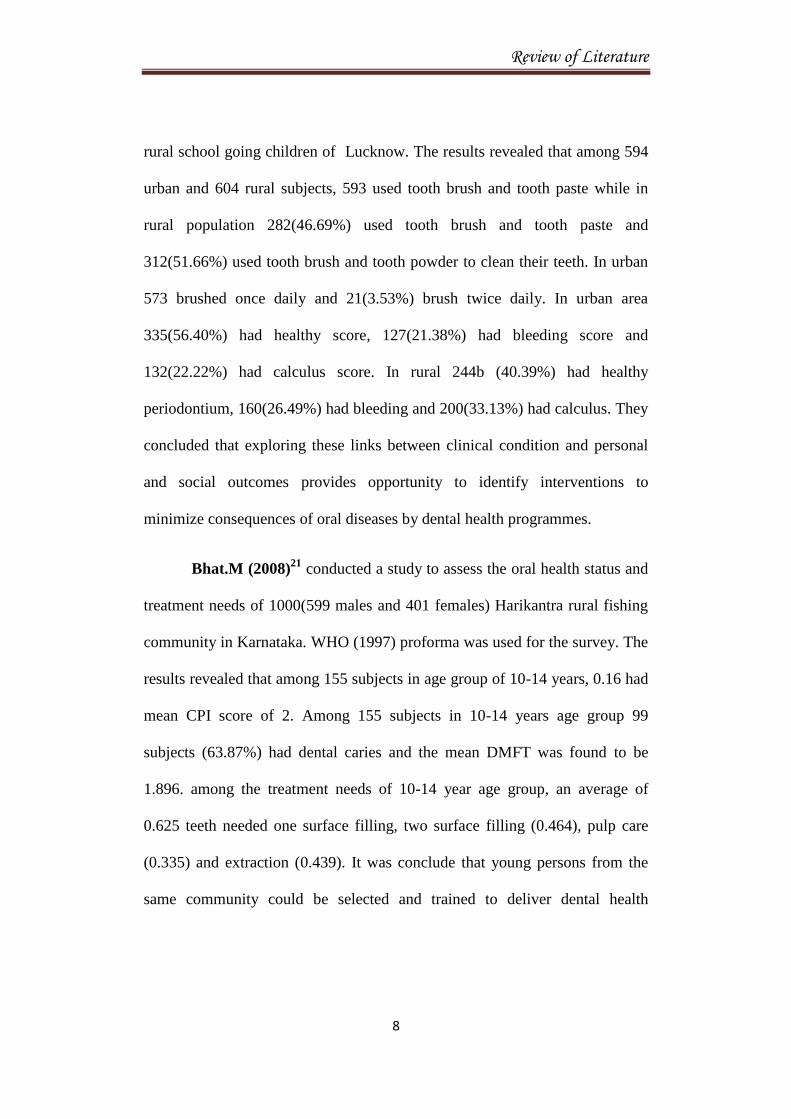
Bhat.M (2008)21
conducted a study to assess the oral health status and
treatment needs of 1000(599 males and 401 females) Harikantra rural fishing
community in Karnataka. WHO (1997) proforma was used for the survey. The
results revealed that among 155 subjects in age group of 10-14 years, 0.16 had
mean CPI score of 2. Among 155 subjects in 10-14 years age group 99
subjects (63.87%) had dental caries and the mean DMFT was found to be
1.896. among the treatment needs of 10-14 year age group, an average of
0.625 teeth needed one surface filling, two surface filling (0.464), pulp care
(0.335) and extraction (0.439). It was conclude that young persons from the
same community could be selected and trained to deliver dental health

Review of Literature
9
education to this community. Voluntary organizations need to render care to
this rural depressed community.
Mehta.A,Gupta.J,Bhall.S (2011)22
conducted a study to find out the
prevalence of Dental caries among 2615, 3-17 year old children studying in
various government and private schools at Chandigarh using def and DMF
Index. The results revealed that among 2615 children examined, 1307 were
suffering from Dental caries depicting caries prevalence of 49.9%. There was
no significant difference between males (51.1%) and females (48.8%). Mean
DMF score in 12-17 years age group was 1.17. There was no significant
differences in mean DMF among two genders. It was concluded that large
majority of untreated carious lesions suggesting the lack of awareness among
children, their parents and teachers regarding importance of good oral health.
Kaur.N,Hiremath.S.S (2011)23
conducted a study to know the
prevalence of traumatic injuries to permanent anterior teeth among 2000
government and private school children between the ages of 8-15 years old in
Bangalore city. The results revealed that among the children with the history
of trauma, 17.3% were boys and 11.4% were girls. The prevalence of
traumatic injuries was 14.5%. Among total children of 12-15 years examined,
205(20.5%) children had history of trauma. Among these 205 children, 14.7%
had minor malocclusion, 37.7% had definite malocclusion, 57.7% had severe
malocclusion and remaining 60.8% had very severe malocclusion. It was
concluded that prevalence of traumatic injuries was 14.5% and was higher

Review of Literature
10
among private school children compared to government school children. On
the whole, prevalence was more in boys when compared to girls.
Dhaval.P.R,Sujal.P.M (2011)24
conducted a study to assess the
gingival status and Dental caries status among 200 school going children aged
12 and 15 years old in Ahmedabad city. WHO methodology 1997 was used to
assess the Dental caries status. The results revealed that mean DMFT score of
male and female children of 12 year age group was 1.22 ± 1.56 and 1.02 ±
1.20 respectively. Mean DMFT score of male and female children of 15 year
age group was 2.30 ± 2.43 and 2.26 ± 2.37 respectively. Mean DMFT score
for 12 years old children was 1.11 ± 1.37, while that of 15 years old children
was 2.28 ± 2.40. Majority out of 200 children, 135(67.5%) children needed
one surface filling. It was concluded that implementation of oral health
program at early age helps in improving preventive dental behavior and
attitudes, which is beneficial throughout the life time. This can be achieved by
educating the parents about dental health through school dental programme.
Anu.V,Shivakumar.M,Madankumar.P.D,Sureshbabu.A.M(2011)25
conducted a study to assess the association between sweet score and Dental
caries experience among 317 school children of 12-13 year old in Chennai.
Sweet score was analyzed using 24 hour diet chart and Dental caries was
measured by DMFT Index. The results revealed that among 138 urban
population, 6.5% had excellent sweet score, 25.36% had good sweet score and
68.11% were in watch-out zone. Among 179 rural population, 18.40% had

Review of Literature
11
excellent sweet score, 14.25% had good sweet score and 67.03% were in
watch-out zone. Mean DMFT among rural population was 0.92 and urban
population was 1.89. Among 179 rural children, 120 children who were in
watch-out zone had a mean DMFT of 1.05. Among 138 urban school children,
94 children who were in watch-out zone had mean DMFT of 1.87. It was
conclude that, since majority of children in urban and rural schools were in
watch-out zone, early interventions like dietary counseling among school
children can be appropriate to inhibit the carious process.
Saravanan,N,Reddy.C.V.K,Veeresh.D.J (2011)14
conducted a study
to assess the oral health status and treatment needs of 144 fishermen in coastal
village of Tirunelveli District in Tamilnadu. WHO oral health assessment
form 1991 (modified) was used to assess oral health status. The results
revealed that prevalence of periodontal disease more among fisherman
(93.1%). Overall prevalence of Dental caries among fishermen was 54.9%.
Mean DMFT values of fishermen was 3.61. Among the total study population,
the treatment needed for extraction (39.6%), filling (20.8%), root canal
treatment (11.8%). It was concluded that oral health status of fishermen
population was relatively poor with caries prevalence and poor periodontal
health when compared to non-fishermen population. Hazardous occupations,
un scheduled working hours, job related stress, pernicious habits, irregular diet
due to lack of availability of home cooked food, lower awareness levels and

Review of Literature
12
socio-economic status seemed to influence the oral health status of fishermen
population.
Amith.H.V,Dcruz.A.M (2011)26
conducted a study to determine the
prevalence of Dental caries amongst 594 school going children of 12-15 years
old of Waranagar, Maharastra. The results revealed that prevalence of Dental
caries across all ages was 64.98% with a mean DMFT of 1.92. Decayed
component formed the majority (91.16%) of caries Index. Mean DMFT for
females and males was 1.96 and 1.90 respectively. Mean DMFT for age 12
years was 1.44 while mean DMFT for 15 years was 1.74. It was concluded
that there is a need for accessible and affordable oral health services to be
provided to this community. Well planned school based oral health education
program were needed to increase the oral health knowledge among the school
children of this region.
Naveen kumar.B,Ramesh.N,Reddy.V (2011)27
conducted a study to
assess the prevalence of traumatic dental injuries to permanent incisors among
1020 school children of 12 year old in Tandoor, Andhrapradesh. WHO
classification of tooth fractures (1978) was used. Results revealed that among
1020 children examined 515(51%) were boys and 505(49%) were girls.
Traumatic dental injuries was found among 184(18.04%) of the school
children. Boys had significantly higher (n= 121; 23.5%) prevalence as
compared to girls (n= 63; 12.5%). It was concluded that prevalence of

Review of Literature
13
traumatic dental injuries among 12 year old school children of Tandoor was
significantly higher and was more in males compared to females.
Grover S,Anuradha P (2011)28
conducted a study to assess the
prevalence and treatment needs of Dental caries among 1040 school going
children of which 527 children were of 12 years and 518 were of 15 years of
age. The results revealed that prevalence of Dental caries in 12 years old
children was 57.7% and in 15 years old was 48.5%. The mean DMFT for 12
years was 1.44 + 1.59 and mean DMFT for 15 years old children was 1.29 +
1.60. The treatment needs assessed were 48.2% females and 52.1% males
amongst 12 years required one surface filling and amongst 15 years 43.2%
females and 48.2% males required one surface filling. It was concluded that
prevalence of Dental caries was high in school going children of this
population and need for promotion of oral health and provision of availability
of treatment to every child.
Pankaj S (2010)29
conducted a study to assess the prevalence of
malocclusion and orthodontic treatment needs among 1600, 12-15 years
school children in Belgaum city, Karnataka. Dental Aesthetic Index (DAI) was
used to assess the malocclusion status and orthodontic treatment needs. The
results revealed that 29(1.8%) children had one or more missing teeth in
maxillary and mandibular incisal segments. 617(26.5%) had either one or two
segment crowding. 424(26.5%) had either one or two segment spacing.
202(12.6%) had a diastema equal to or more than 1 mm. 435(27.1%) children

Review of Literature
14
had either half cusp or full cusp deviation. 1417(88.6%) children had a score
less than or equal to 25, indicative of minor occlusion where there was no
need for treatment. 109(6.8%) had a score between 26 to 30 indicative of
definite malocclusion where treatment was elective. It was conclude that most
of children 88.6% had a dental appearance (exhibited lower DAI score) which
require no orthodontic treatment and 11.4% of children were in objective need
of orthodontic treatment.
Senthilkumar M,Balagopal S, Reddy S,Venkatesh A (2011)30
conducted a study to assess prevalence of Dental caries and treatment needs of
274 school children of age 5 to 12 years in Vandalur Taluk, Chennai. The
results revealed that caries was more prevalent in girls than in boys (25% in
girls and 10.44% in boys). Mean DMFT was 0.36 in 11-12 years old. Girls
experienced higher rates of caries (0.19) than boys (0.15). It was concluded
the necessity for accessible and affordable oral health services in the form of
oral health education in community and school settings to create awareness.
Bhat P.K,Aruna C.N (2011)31
conducted a study to assess the
prevalence of Dental caries among 414 school children of 10-12 years old in
South Bangalore. Dental caries experience was assessed using DMFT indices.
The results revealed 66.2% of school children were brushing twice daily and
only 5.1 % of them had Dental caries, whereas 30.4% of them were brushing
once daily and 38.1% of them had Dental caries. Around 15.7% of
respondents were consuming sweets once a day and 50.8% of them had caries,

Review of Literature
15
while 75.% of them were consuming sweets once in a week and 8.4% had
caries. 76.3% of them were consuming milk with sugar but only 14.6% of
them had caries. Near to 54% of participants consumed fresh fruits and only
14% of them had caries. It was concluded that changing life styles and dietary
patterns are markedly increasing caries incidence. Children should be
encouraged to brush twice daily and consumption of fresh fruits. Community
based oral health promotion programmes could be initiated through healthy
promoting school projects.
Stalin A, John J.B, Preethi V (2011)32
conducted a study to assess
the diet pattern and caries prevalence of 230 school children aged 11-14 years
in Tiruchengode, Tamilnadu. Diet diary was analyzed for sugar consumption
according to method described by Nizel and Pappas. The results revealed that
the sweet score for the sample ranged from 17.15 ± 8.5/day. Mean scores and
standard deviations of Dental caries prevalence revealed DMFT score 1.11 ±
1.4. The sweet score was found to be well above the ‘watch-out zone’. 17.15 ±
8.5 and it indicates high caries risk. The oral hygiene practices among the
school children was fair that 62.4% brush once daily, 36.5% twice daily. It
was concluded that sticky form of sweets such as cocoa, chocolates, wafer
chocolates and cream biscuits were concluded as most preferable and also
available snacks items for children from this sub urban community that
showed more significance in caries development.

Review of Literature
16
Sujatha B,Saisankar A.J,Manojkumar M.G (2011)33
conducted a
study to assess the prevalence of Dental caries and treatment needs for 1862
school going children in age group between 7-12 years and 13-16 years in
rural and urban areas government residential schools of Guntur district. WHO
(1997) criteria was used for examination. Results revealed that overall
prevalence of Dental caries in the study population was 45.91%. In rural
population it was found that 7-12 years group had 47.75% of caries as
compared to 51.84% 13-16 year age group. In both age groups, boys showed
higher caries prevalence compared to girls. In urban population 7-12 year age
group had 45.33% spread of caries compared to 37.02% in 13-16 year age
group. In 7-12 years group, girls showed higher caries prevalence, whereas in
13-16 year age group boys showed more caries prevalence. The percentage of
children requiring various type of dental caries treatment were more in rural
areas(50.32%) when compared to rural area(45.52%). It was concluded the
urgent need for extending the dental specialty to rural hospitals as the rural
population showed unusual increase in prevalence of caries.
Ganesh A, Ingle N, Chaly P, Reddy C (2011)34
conducted a study to
assess the dental caries experience and frequency of sugar consumption and to
correlate the relationship between the two factors in 1600 12 and 15 year old
children in Chennai. A 24 hour diet recall and WHO (1997) form was used to
assess dentition status and treatment needs. The results revealed that during a
period of 24 hours, it was noted that only 46(2.9%) of subjects had no sugar

Review of Literature
17
exposure. 303(18.9%) of children had one sugar exposure per day, 517(32.3%)
had two exposures per day, 416(26%) had three sugar exposures, 217(13.6%)
had four sugar exposures per day. The sweet score was excellent in
270(16.9%), good in 329(20.6%) however a majority 1001(62.6%) were in
watch-out zone. Mean DMFT of 12 year old children was 0.85 ± 1.31, while
that of 15 year old children was 1.31 ± 1.73. Mea DMFT of government
school children was 1.24 ± 1.71, while that of private school children was 0.92
± 1.37. Majority of subjects were free of traumatic teeth (93.4%). 82(5.1%) of
students had one traumatized teeth. 707(44.4%) needed one surface filling,
248(15.5%) needed two surface fillings, 83(4.1%) required extraction and pulp
care (2.9%). It was conclude that that majority of subjects were in watch-out
zone and two sugar exposures per day. Overall prevalence of Dental caries
was 45.6%, while that of 12 years was 40.2% and 15 years was 51%. There
was a positive correlation between DMFT with frequency of sugar exposures
per day.
Mahesh kumar P, Joseph T, Varma R.B, Jayanthi M (2005)35
conducted a study to assess the oral health status of 1200 school children of
which 600 each in 5 and 12 years in Chennai city. The results revealed that
among 12 year age group periodontal assessment using CPI (0= 11.2%,
1=51.3%, 2 = 37.5%). Among 600 12 years old, boys (317) were affected
more than girls (283). Also, higher percentage of corporation school children
had gingival and periodontal problems than private school children. In 12

Review of Literature
18
years, the mean DMFT for boys was 3.80 ± 3.43, girls 4.11 ± 2.98. Overall
prevalence of malocclusion was that both private and corporation school
children showed mild to moderate degree of malocclusion. It was concluded
that a study on oral health assessment and dental health education of children
at an early age helps in improving preventive dental behavior and attitudes,
which is beneficial for a life time. This can be achieved by educating the
uneducated parents about dental health through school dental health program.
Materials and Methods
19
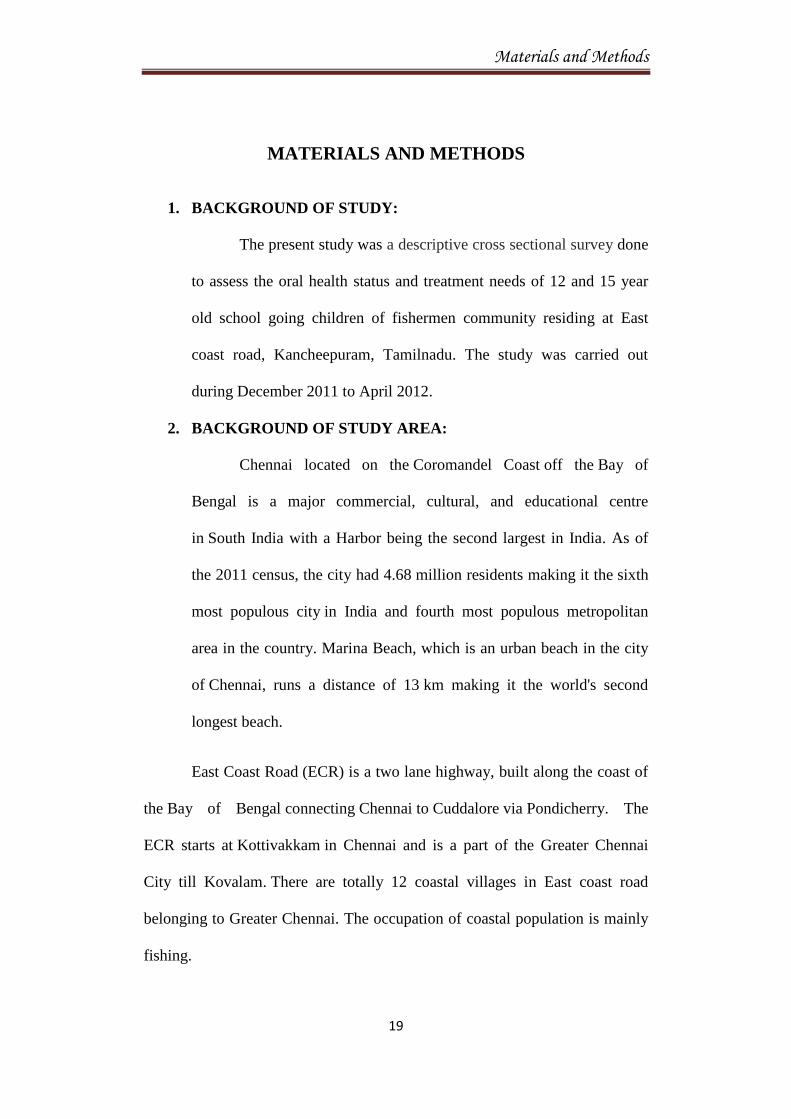
MATERIALS AND METHODS
1. BACKGROUND OF STUDY:
The present study was a descriptive cross sectional survey done
to assess the oral health status and treatment needs of 12 and 15 year
old school going children of fishermen community residing at East
coast road, Kancheepuram, Tamilnadu. The study was carried out
during December 2011 to April 2012.
2. BACKGROUND OF STUDY AREA:
Chennai located on the Coromandel Coast off the Bay of
Bengal is a major commercial, cultural, and educational centre
in South India with a Harbor being the second largest in India. As of
the 2011 census, the city had 4.68 million residents making it the sixth
most populous city in India and fourth most populous metropolitan
area in the country. Marina Beach, which is an urban beach in the city
of Chennai, runs a distance of 13 km making it the world's second
longest beach.
East Coast Road (ECR) is a two lane highway, built along the coast of
the Bay of Bengal connecting Chennai to Cuddalore via Pondicherry. The
ECR starts at Kottivakkam in Chennai and is a part of the Greater Chennai
City till Kovalam. There are totally 12 coastal villages in East coast road
belonging to Greater Chennai. The occupation of coastal population is mainly
fishing.

Materials and Methods
20
3. OBTAINING THE APPROVAL FROM AUTHORITIES:
Ethical clearance to conduct the study was obtained from the
Institution Review Board of Ragas Dental College and Hospital
(Annexure I).List of all the schools located along East coast road,
Chennai was obtained from the office of the Chief educational officer
(CEO), Kancheepuram district. The permission to conduct the study
was obtained from the Chief educational officer (CEO) Kancheepuram
and also from the respective school authorities (Annexure II).
4. STUDY POPULATION:
There were totally 35 schools in study area out of which 11
were Government schools and remaining 24 were private schools.
From this list of schools, the higher secondary schools were alone
segregated as the study population of 12 to 15 year old school going
children can be obtained only from these schools. Among the Higher
secondary schools, 2 government and 2 private schools were selected
from areas, where more number of fishermen children were studying
based on the data obtained from Office of Chief Educational Officer,
Kancheepuram district and Assistant directorate of fisheries in
Neelangarai, Chennai.

Materials and Methods
21
FLOW CHART:
SCHOOLS FROM
FISHERMEN CONCENTRATED
AREAS
5. INCLUSION AND EXCLUSION CRITERIA:
INCLUSION CRITERIA
1. Those Children, whose parents involved in fishing as primary
occupation obtained with the help of school records and who were
present on day of examination were included in the study.
2. Those children who were willing to participate in the study.
HIGHER SECONDARY
SCHOOLS
TYPE OF INSTITUTION
TOTAL SCHOOLS IN ECR
35
PRIVATE = 24
15
GOVERNMENT = 11
8
2 2

Materials and Methods
22
EXCLUSION CRITERIA
1. Those children who were absent during the time of examination
were excluded.
6. SAMPLE SIZE DETERMINATION:
PILOT STUDY:
A pilot study was undertaken in February 2012 at St.Joseph
school, Kovalam to determine the feasibility of the study and also to
determine the sample size. The study population included were 74
Fishermen children of 12 and 15 years old.
Closed-ended questionnaire consisting of demographic data and nine
questions, in which section 1 dealt with perceived dental health and utilization
of dental services, section 2 dealt with oral hygiene practices, section 3 dealt
with 24 hours-Diet chart for calculating sweet score, amount of fish intake and
source of drinking water. WHO oral health assessment proforma 1997 was
used to assess the oral health status and treatment needs excluding prosthetic
treatment needs .It took an average of 10-15 minutes to complete the proforma
and questionnaire.
As per the pilot study, the prevalence of dental caries was found to be
68 % and it was taken for sample size calculation.

Materials and Methods
23
SAMPLE SIZE DETERMINATION:
The sample size for the present study was calculated based on the data
collected from the pilot study. Accordingly, the prevalence of dental caries
was found to be 68% that is, 51 out of 74 children had caries experience. Thus
the sample proportion is 0.68. The sample size was calculated by fixing the
probability of Type I error at 5% and that of Type II error at 10%. The study’s
power was set at 90%. All these data were fed in a special software for sample
size determination namely n-MASTER. It was found that the minimum
sample size required was 590 assuming the population proportion as 0.74. A
non-response rate of 10% was anticipated prior for the main study and hence
the sample size was increased by 10%. Thus the final sample size was
calculated as follows:
= 590 + (10% of 590)
= 590 + 59
= 649
≈ 650 students.
STUDY SAMPLE AND SAMPLING PROCEDURE
The study sample for the present study was selected using convenient
sampling method.

Materials and Methods
24
7. IMPLEMENTING THE STUDY
a. PROFORMA and DATA COLLECTION
Data was collected from a cross-sectional survey, using a Survey
Proforma which comprised of a Questionnaire, and Clinical
examination.
(i) QUESTIONNAIRE AND DEMOGRAPHIC DATA
Closed-ended questionnaire demographic data and consisting of
9 questions, in which section 1 dealt with perceived dental health and
utilization of dental services, section 2 dealt with oral hygiene
practices, section 3 dealt with 24 hours-Diet chart for calculating sweet
score, amount of fish intake and source of drinking water
(Annexure III). WHO oral health assessment proforma 1997 was used
to assess the oral health status and treatment needs was collected from
the individuals prior to the clinical examination (Annexure IV).
(ii) CLINICAL EXAMINATION
An intra-oral examination was carried out by a single examiner
to assess the Oral Health Status and treatment needs using WHO Oral
Health Surveys – Basic Methods Proforma (1997) excluding prosthetic
treatment needs. Calibration of the examiner was assessed by kappa
statistic and interpreted to be 0.83.
Materials and Methods
25
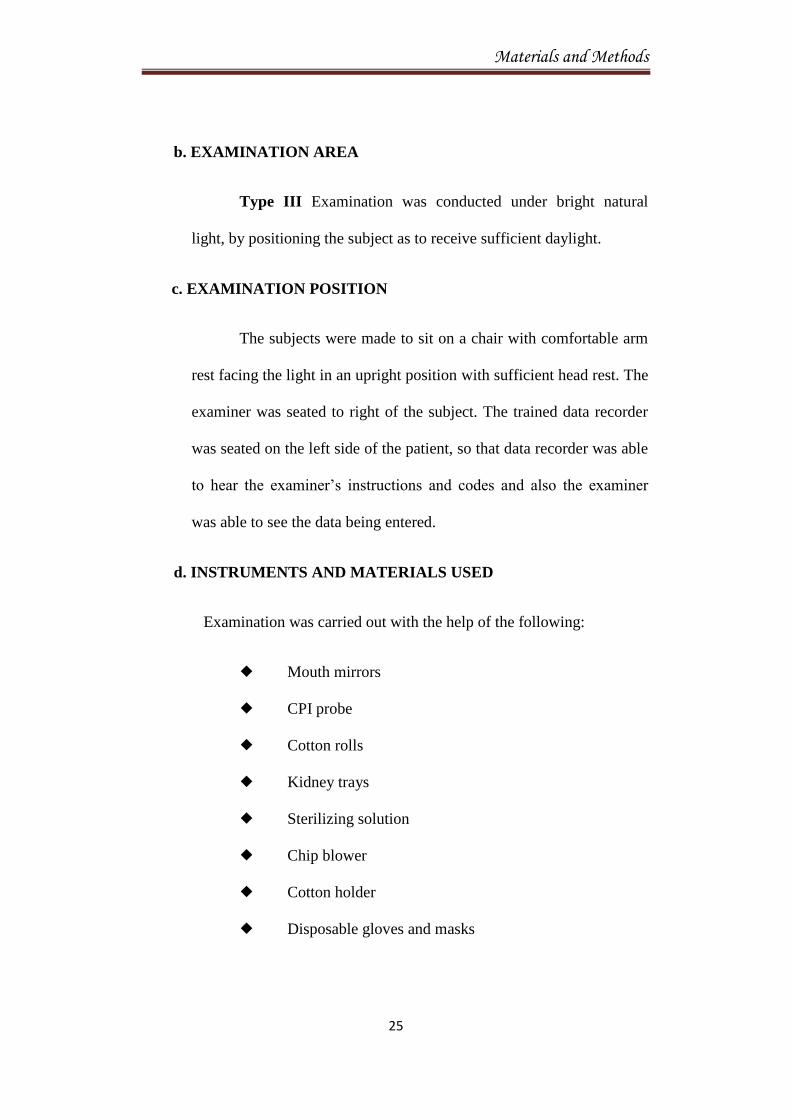
b. EXAMINATION AREA
Type III Examination was conducted under bright natural
light, by positioning the subject as to receive sufficient daylight.
c. EXAMINATION POSITION
The subjects were made to sit on a chair with comfortable arm
rest facing the light in an upright position with sufficient head rest. The
examiner was seated to right of the subject. The trained data recorder
was seated on the left side of the patient, so that data recorder was able
to hear the examiner’s instructions and codes and also the examiner
was able to see the data being entered.
d. INSTRUMENTS AND MATERIALS USED
Examination was carried out with the help of the following:
Mouth mirrors
CPI probe
Cotton rolls
Kidney trays
Sterilizing solution
Chip blower
Cotton holder
Disposable gloves and masks

Materials and Methods
26
During data collection, chemical method of disinfection and
sterilization using Korsolex (Glutaraldehyde- 7gms; Polymethyl urea
derivatives- 11.6 gms; 1, 6dihydroxy 2, 5droxyhexane - 8.2gm) diluted by
adding water was used. Used instruments were washed and placed in the
disinfectant solution (for 30 minutes), then re-washed and drained well. After
each day of examination, the entire set of instruments was autoclaved.
VIII. EXAMINATION, ORAL HEALTH EDUCATION AND
TREATMENT REFERRAL
A single classroom was provided in each school and each child was
examined for 15 minutes, after the questionnaire was completed. Around 30
children approximately were examined per day. Children with their parent’s
occupation as fishing were asked to come in class section-wise with their class
teacher. Questionnaire was distributed to the children and the examiner
explained the questions in their local language. Structured diet chart which
includes the quantity of Milk, Fruit Juices, Chocolates and Sweets were
elicited. After completion of the questionnaire, the examiner collected the
questionnaire and examined the oral cavity and recorded the findings in WHO
proforma 1997. After the oral examination, a brief oral health education
session was conducted in the local language Tamil to all the Fishermen
children and class teacher of the respective section with the help of Tooth
models and posters.
Materials and Methods
27
The findings of the survey were reported to the Head mistress and
those requiring treatment were provided free treatment by arranging Dental
Camp which was organized by Ragas Dental College and Hospital. Children
who required further dental treatment were referred to Ragas Dental College
& Hospital for dental treatment.
IX. STATISTICAL ANALYSIS:
The data recorded were transferred and tabulated to the computer -
Windows Microsoft Excel (2007) - for the purpose of the data analysis. The
Chi-square test (χ2) was used to find out whether there existed a significant
difference in the oral health status between 12 years old and 15 years old
school children and Private and Government school children.
Photographs
28
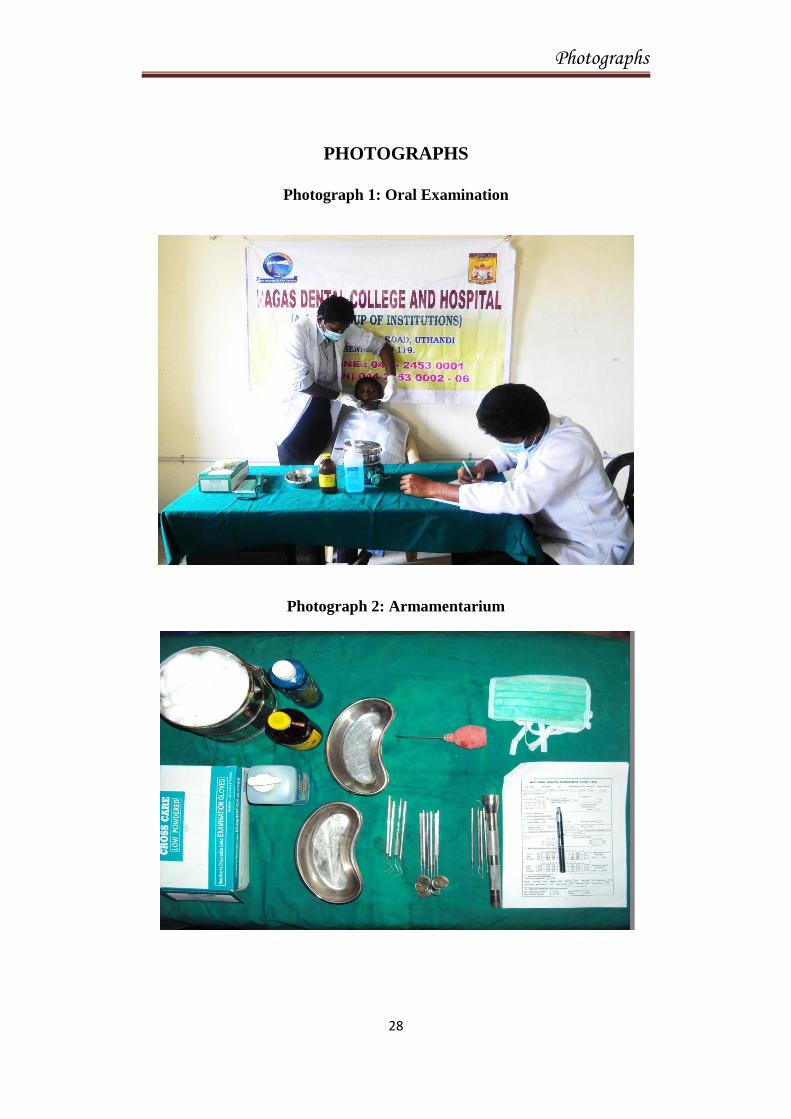
PHOTOGRAPHS
Photograph 1: Oral Examination
Photograph 2: Armamentarium

Results
29
RESULTS
The present study was done to assess the oral health status and
treatment needs of 12 and 15 years old school going children of Fishermen
community residing at East Coast Road, Chennai.
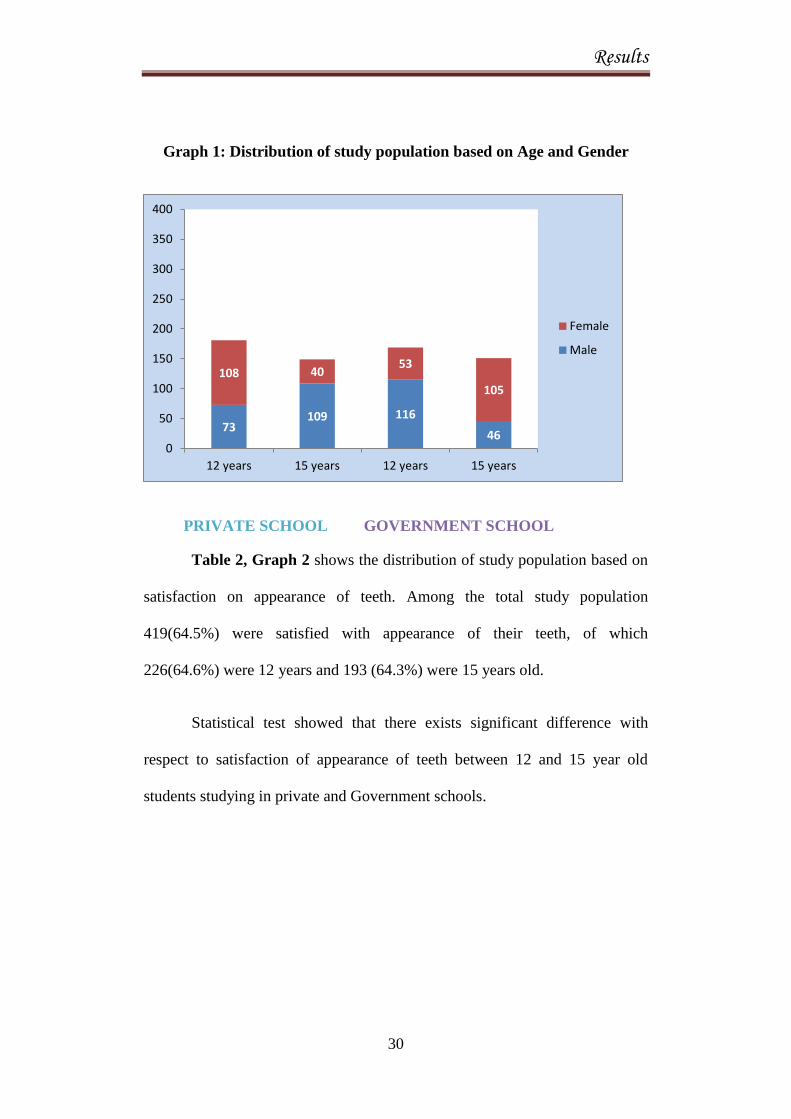
Table 1, Graph 1 shows the distribution of study population based on
age, Gender and type of Institution Among private school children, 181
(51.7%) were 12 years old and 149 (29.9%) were 15 years old, while among
Government school children 169 (48.2%) were 12 years old and 151 (50.3%)
were 15 years old.
Table 1: Distribution of study population based on age and Gender
Type of
Institution
Age
Private school
Government school
Total
Male
Female
Male
Female
12 years 73 108 116 53 350
15 years 109 40 46 105 300
Results
30
Graph 1: Distribution of study population based on Age and Gender
PRIVATE SCHOOL GOVERNMENT SCHOOL
Table 2, Graph 2 shows the distribution of study population based on
satisfaction on appearance of teeth. Among the total study population
419(64.5%) were satisfied with appearance of their teeth, of which
226(64.6%) were 12 years and 193 (64.3%) were 15 years old.
Statistical test showed that there exists significant difference with
respect to satisfaction of appearance of teeth between 12 and 15 year old
students studying in private and Government schools.
73 109 116
46
108 40 53
105
0
50
100
150
200
250
300
350
400
12 years 15 years 12 years 15 years
Female
Male

Results
31
Table 2: Distribution of study population based on satisfaction on
appearance of teeth
Satisfaction
on teeth
appearance
Private school* Government school* Total
12 years# 15 years
# 12 years
# 15 years
#
Yes 102(15.7%) 86(13.2%) 124(19.1%) 107(16.5%) 419(64.5%)
No 79(12.2%) 63(9.7%) 45(6.9%) 44(6.8%) 231(35.5%)
{# χ2= 16.709; P = 0.001(significant)} {* χ2 = 3.516; P = 0.61}
Graph 2: Distribution of study population based on satisfaction on
appearance of teeth
102
86
124
107
79
63
45 44
0
20
40
60
80
100
120
140
Private 12 year oldstudents
Private 15 year oldstudents
Govt 12 year oldstudents
Govt 15 year oldstudents
Yes No

Results
32
Table 3, Graph 3 shows 323 children(49.7%) of total study
population had tooth ache or discomfort in their teeth, of which 156 (44.6%)
were 12 years and 167 (55.7%) were 15 years old.
Statistical test showed that there exists significant difference with
respect to Pain in teeth between 12 and 15 year old students studying in
private and Government schools.
Table 3: Distribution of study population based on Tooth ache or
discomfort in teeth
Pain in
teeth
Private school*
Government school*
Total
12 years# 15 years
# 12 years
# 15 years
#
Yes 91(14%) 77(11.8%) 65(10%) 90(13.8%) 323(49.7%)
No 90(13.8%) 72(11.1%) 104(16%) 61(9.4%) 327(50.3%)
{#
χ2 = 14.719; P = 0.002(Significant)}{* χ2 = 7.728; P = 0.005(Significant)}

Results
33
Graph 3: Distribution of study population based on Tooth ache or
discomfort in teeth
Table 4, Graph 4(a) and 4(b) shows that only 226(34.8%) of the total
study population have visited dentist during past 12 months. However, there
was no difference among 12 years old 118(33.7%) and 15 years old 108(36%)
in visiting dentist during past 12 months.63 children from 12 years and 70
children from 15 years had visited dentist for Tooth ache. 23 children from 12
years and 17 children from 15 years had visited dentist for Extraction, while
39 children from 12 years and 25 children from 15 years old had visited
dentist for restoration.
91
77
65
90 90
72
105
61
0
20
40
60
80
100
120
Private 12 year oldstudents
Private 15 year oldstudents
Govt 12 year oldstudents
Govt 15 year oldstudents
Yes No

Results
34
Statistical test showed that there exists significant difference with
respect to Pain in teeth between 12 and 15 year old students studying in
private and Government schools.
Table 4: Distribution of study population based on visited Dentist during
past 12 months
Past Dental
visit
Private school* Government school* Total
12 years# 15 years
# 12 years
# 15 years
#
Yes 73(11.2%) 63(9.7%) 45(6.9%) 45(6.9%) 226(34.8%)
No 108(16.6%) 86(13.2%) 124(19.1%) 106(16.3%) 424(65.2%)
{# χ2 = 12.760; P = 0.005 (significant)} {* χ2 = 2.140; P = 0.143}

Results
35
Graph 4(a): Distribution of study population based on visited Dentist
during past 12 months
Graph 4(b): Distribution of study population based on reason for last
Dental visit
73 63
45 45
108
86
124
106
0
20
40
60
80
100
120
140
Private 12 year oldstudents
Private 15 year oldstudents
Govt 12 year oldstudents
Govt 15 year oldstudents
Yes No
232
63
23 39 10 3
192 70
17 25 3 1 0
50100150200250300350
Distribution of study population based on reason for last dental visit
12 years
15 years

Results
36
Table 5, Graph 5 shows that most of the study population 648(99.7%) had
the habit of brushing.
Statistical test showed that there is no significant difference with respect
to Habit of brushing between 12 and 15 year old students studying in private
and Government schools.
Table 5: Distribution of study population based on Brushing Habit
Habit of
Brushing
Private school* Government school Total
12 years# 15 years
# 12 years
# 15 years
#
Yes 181(27.8%) 149(22.9%) 167(25.7%) 151(23.2%) 648(99.7%)
No 0(0%) 0(0%) 2(0.3%) 0(0%) 2(0.3%)
{#χ2 = 5.710; P = 0.127(Not significant)} {* χ2 = 0.607; P = 0.436}

Results
37
Graph 5: Distribution of study population based on Brushing Habit
Table 6, Graph 6 shows that majority of the study population
470(72.3%) were brushing once a day which includes 257students among 12
years old children and 213 students among 15 years old children.
Statistical test showed that there is no significant difference with
respect to Frequency of brushing between 12 and 15 year old students
studying in private and Government schools.
181
149
167
151
0 0 2 0 0
20
40
60
80
100
120
140
160
180
200
Private 12 year oldstudents
Private 15 year oldstudents
Govt 12 year oldstudents
Govt 15 year oldstudents
Yes No

Results
38
Table 6: Distribution of study population based on frequency of
brushing their teeth
Frequency
of
Brushing
Private school* Government school
Total
12 years# 15 years
# 12 years
# 15 years
#
Once
daily
129(19.8%) 98(15.1%) 128(19.7%) 115(17.7%) 470(72.3%)
Twice or
more
52(8%) 51(7.8%) 41(6.3%) 36(5.5%) 180(27.7%)
{#
χ2 = 5.389; P = 0.145(Not significant)} {* χ2 = 1.457; P = 0.227}
Graph 6: Distribution of study population based on frequency of
brushing their teeth
129
98
128
115
52 51
41 36
0
20
40
60
80
100
120
140
Private 12 year oldstudents
Private 15 year oldstudents
Govt 12 year oldstudents
Govt 15 year oldstudents
once daily twice or more daily

Results
39
Table 7, Graph 7 shows distribution of study population based on
Brushing aids used. Among the total study population, 646(99.4%) were using
Tooth brush and tooth paste and 4(0.6%) were using Finger and tooth powder.
Statistical test showed that there is no significant difference with
respect to Brushing aids used between 12 and 15 year old students studying in
private and Government schools.
Table 7: Distribution of study population based on Brushing aids used
Brushing
aids used
Private school* Government school* Total
12 years# 15 years
# 12 years
# 15 years
#
Tooth
brush and
paste
180(27.7%) 149(22.9%) 166(25.5%) 151(23.2%) 646(99.4%)
Finger
and tooth
powder
1(0.2%) 0(0%) 3(0.5%) 0(0%) 4(0.6%)
{# χ2 = 5.586; P = 0.134} {* χ2 = 1.218; P = 0.270}

Results
40
Graph 7: Distribution of study population based on Brushing aids used
Table 8, Graph 8 shows distribution of study population based on
Sweet score. Among the 12 year old school children,53(15.1%) had excellent
sweet score, 97(27.7 %) had good sweet score and200(57.7%) were in watch-
out zone. Among the 15 year old school children, 55(18.3%) had excellent
sweet score, 94 (31.3%) had good sweet score and 151 (50.3 %) were in
watch-out zone.
Statistical test showed that there is no significant difference with
respect to Sweet score between 12 and 15 year old students studying in private
and Government schools.
180
149
166
151
2 0 3 0 0
20
40
60
80
100
120
140
160
180
200
Private 12 year oldstudents
Private 15 year oldstudents
Govt 12 year oldstudents
Govt 15 year oldstudents
Tooth brush and paste Finger and tooth powder

Results
41
Table 8: Distribution of study population based on Sweet score
SWEET
SCORE
Private school* Government school* Total
12 years# 15 years
# 12 years
# 15 years
#
Excellent 32(4.9%) 27(4.2%) 21(3.2%) 28(4.3%) 108(16.6%)
Good 52(8%) 43(6.6%) 45(6.9%) 51(7.8%) 191(29.4%)
Watch-
out zone
97(14.9%) 79(12.2%) 103(15.8%) 72(11.1%) 351(54%)
{#
χ2 = 6.576; P = 0.362} {* χ2 = 1.072; P = 0.018}
Graph 8: Distribution of study population based on Sweet score
32 27
21 28
52
43 45 51
97
79
103
72
0
20
40
60
80
100
120
Private 12 year oldstudents
Private 15 year oldstudents
Govt 12 year oldstudents
Govt 15 year oldstudents
Excellent Good Watch-out zone

Results
42
Table 9, Graph 9 shows distribution of study population based on
frequency of Fish Intake. Among the 12 years old children, 115(32.9%) were
taking fish daily,120 (34.3%) were taking fish more than 3 days in a week,
109(31.1%) were taking fish less than 3 days in a week and 5(1.4%) never
took fish. Among the 15 years old children, 107 (35.7 %) were taking fish
daily, 122 (40.7%) were taking fish more than 3 days in a week, 64 (21.3%)
were taking fish less than 3 days in a week and 7(2.3%) never took fish.
Statistical test showed that there exists significant difference with
respect to Fish intake between 12 and 15 year old students studying in private
and Government schools.
Table 9: Distribution of study population based on frequency of
Fish Intake
Frequency of
Fish intake
Private school* Government school*
12 years# 15 years
# 12 years
# 15 years
#
Daily 70(10.8%) 43(6.6%) 45(7%) 64(9.8%)
More than 3
days in a week
67(10.3%) 66(10.2%) 53(8.2%) 56(8.6%)
Less than 3
days in a week
43(6.6%) 37(5.7%) 66(10.2%) 27(4.2%)
Never 1(0.2%) 3(0.5%) 4(0.6%) 4(0.6%)
{#
χ2 = 31.838; P = 0.001(Significant)} {* χ2 = 2.064; P = 0.048}

Results
43
Graph 9: Distribution of study population based on frequency of
Fish Intake
Table 10, Graph 10 shows distribution of study population based on
source of drinking water. Among the total study population, 282(43.4%) were
taking packaged drinking water, 288(44.3%) were taking corporation water
and 80(12.3%) were taking Bore well water.
Statistical test showed that there exists significant difference with
respect to source of drinking water used between 12 and 15 year old students
studying in private and Government schools.
70
43 46
64 67 66
53 56
43
37
66
27
1 3 4 4
0
10
20
30
40
50
60
70
80
private 12 year oldstudents
Private 15 year oldstudents
Govt 12 year oldstudents
Govt 15 year oldstudents
Daily More than 3 days a week Less than 3 days a week Never

Results
44
Table 10: Distribution of study population based on source of
drinking water
Source of
drinking
water
Private school*
Government school*
Total
12 years# 15 years
# 12 years
# 15 years
#
Packaged
drinking
water
90(13.8%) 67(10.3%) 80(12.3%) 45(6.9%) 282(43.4%)
Corporation
water 76(11.7%) 63(9.7%) 73(11.2%) 76(11.7%) 288(44.3%)
Bore well
water 15(2.3%) 19(2.9%) 16(2.5%) 30(4.6%) 80(12.3%)
{# χ2 = 20.954; P = 0.002(Significant)} {* χ2 = 9.901; P = 0.007}
Graph 10: Distribution of study population based on source of
drinking water
90
67
80
45
76
63
73 76
15 19 16
30
0
10
20
30
40
50
60
70
80
90
100
Private 12 year oldstudents
Private 15 year oldstudents
Govt 12 year oldstudents
Govt 15 year oldstudents
Packaged drinking water Corporation water Bore well water

Results
45
Table 11, Graph 11 shows distribution of study population based on
TMJ symptoms, clicking, tenderness, and reduced jaw mobility. Among the
total study population, almost 647(99.6%) had no TMJ symptoms and only 3
students had clicking
Statistical test showed that there is no significant difference with
respect to TMJ symptoms between 12 and 15 year old students studying in
private and Government schools.
Table 11: Distribution of study population based on TMJ symptoms
(clicking, tenderness, and reduced jaw mobility)
{# χ2 = 3.368; P = 0.338} {* χ2 = 0.912; P= 0.340}
TMJ
symptoms
Private school* Government school* Total
12 years# 15 years
# 12 years
# 15 years
#
Clicking
Yes 3(1.6%) 0(0%) 0(0%) 0(0%) 3(0.4%)
No 178(98.3%) 149(100%) 169(100%) 151(100%) 647(99.6%)

Results
46
Graph 11: Distribution of study population based on TMJ symptoms,
clicking, tenderness, and reduced jaw mobility
Table 12, Graph 12 shows distribution of study population based on
oral mucosa condition. Only 3(0.4%) children of 12 year old had ulcerations in
their mouth.
Statistical test showed that there is no significant difference with
respect to Oral mucosa condition between 12 and 15 year old students
studying in private and Government schools.
3 0 0 0
178
149
169
151
0
20
40
60
80
100
120
140
160
180
200
private 12 year oldstudents
Private 15 year oldstudents
Govt 12 year oldstudents
Govt 15 year oldstudents
clicking present clicking absent

Results
47
Table 12: Distribution of study population based on Oral
Mucosa condition
Oral
Mucosa
condition
Private school*
Government school*
Total
12 years# 15 years
# 12 years
# 15 years
#
No
Abnormal
condition
180(27.6%)
149(22.9%)
167(25.6%)
151(23.2%)
47(99.6%)
Present 1(0.1%) 0(0%) 0(0%) 2(0.3%) (0.4%)
{#
χ2 = 3.341; P = 0.342} {* χ2 = 6.630; P =0.010}
Graph 12: Distribution of study population based on Oral
Mucosa condition
Oral mucosal lesion present
Oral mucossal lesion absent
020406080
100120140160180
Private 12year oldstudents
Private 15year oldstudents
Govt 12year oldstudents
Govt 15year oldstudents
1 0 2
0
180
149 167
151
Oral mucosal lesion present Oral mucossal lesion absent

Results
48
Table 13, Graph 13 shows distribution of study population based on
Enamel Opacities. Among the total study population, majority 607(93.4%) had
no Enamel opacity, while 24(6.9%) of 12 years old and 18(6%) of 15 years old
had demarcated opacity.
Statistical test showed that there is no significant difference with
respect to Enamel opacities between 12 and 15 year old students studying in
private and Government schools.
Table 13: Distribution of study population based on Enamel Opacities
Enamel
opacity
Private school*
Government school*
Total
12 years# 15 years
# 12 years
# 15 years
#
No enamel
opacity
172(26.5%) 143(22%) 153(23.5%) 139(21.4%) 07(93.4%)
Demarcated
opacity
9(1.4%) 6(0.9%) 15(2.3%) 12(1.8%) 42(6.5%)
Diffuse
opacity
0(0%) 0(0%) 1(0.2%) 0(0%) 1(0.2%)
{# χ2 = 7.209; P = 0.302} {* χ2 = 1.012; P = 0.603}

Results
49
Graph 13: Distribution of study population based on Enamel Opacities
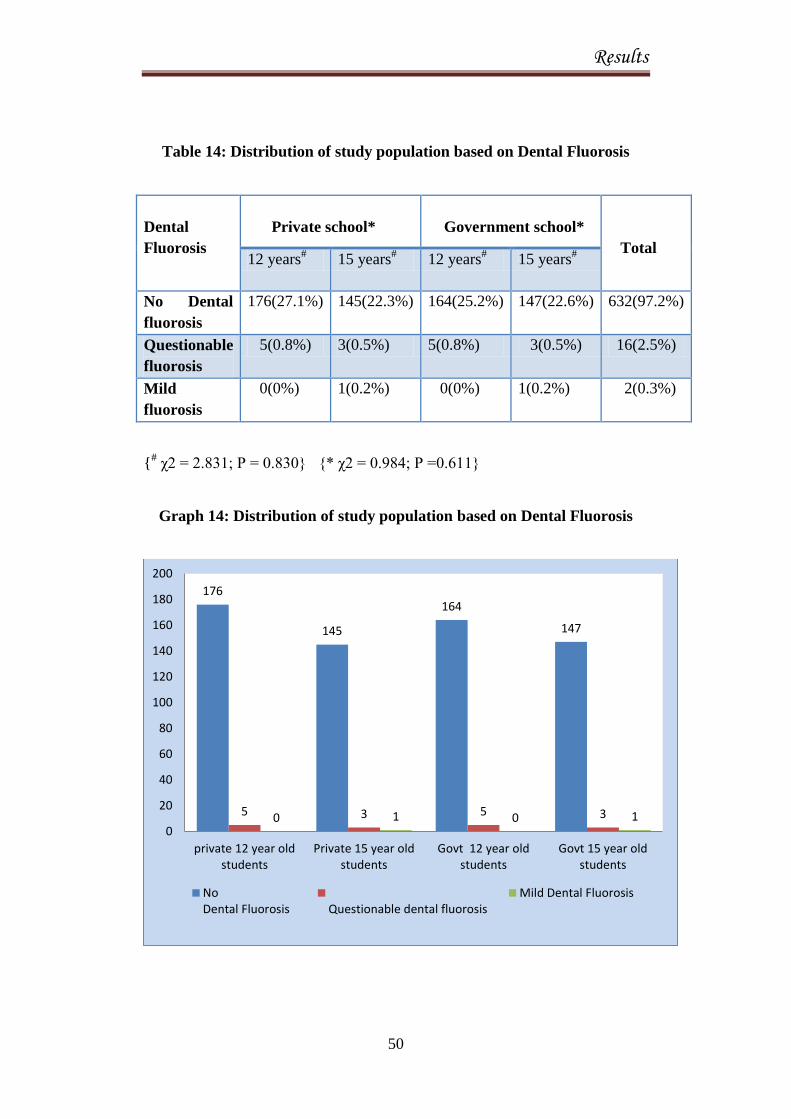
Table 14, Graph 14 shows distribution of study population based on
Dental Fluorosis. Among the total study population, 16(2.5%) had
Questionable fluorosis, while 2(0.3%) had mild fluorosis.
Statistical test showed that there is no significant difference with
respect to Dental fluorosis between 12 and 15 year old students studying in
private and Government schools.
172
143 153
139
9 6 15 12
0 0 1 0 0
20
40
60
80
100
120
140
160
180
200
Private 12 year oldstudents
Private 15 year oldstudents
Govt 12 year oldstudents
Govt 15 year oldstudents
No enamel opacity Demarcated opacity Diffuse opacity
Results
50
Table 14: Distribution of study population based on Dental Fluorosis
Dental
Fluorosis
Private school*
Government school*
Total 12 years
# 15 years
# 12 years
# 15 years
#
No Dental
fluorosis
176(27.1%) 145(22.3%) 164(25.2%) 147(22.6%) 632(97.2%)
Questionable
fluorosis
5(0.8%) 3(0.5%) 5(0.8%) 3(0.5%) 16(2.5%)
Mild
fluorosis
0(0%) 1(0.2%) 0(0%) 1(0.2%) 2(0.3%)
{# χ2 = 2.831; P = 0.830} {* χ2 = 0.984; P =0.611}
Graph 14: Distribution of study population based on Dental Fluorosis
176
145
164
147
5 3 5 3 0 1 0 1 0
20
40
60
80
100
120
140
160
180
200
private 12 year oldstudents
Private 15 year oldstudents
Govt 12 year oldstudents
Govt 15 year oldstudents
NoDental Fluorosis Questionable dental fluorosis
Mild Dental Fluorosis

Results
51
Table 15, Graph 15 shows distribution of study population based on
CPI index. Majority of the study population 623(95.8%) had CPI score of
2(ie., calculus), while only 27(4.1%) of the study population had CPI score of
0(ie., healthy gums).
Statistical test showed significant difference between Age and Highest
CPI code
Table 15: Distribution of study population based on CPI index
AGE NO.OF
EXAMINED
NO. OF
DENTATE
PERSONS
% PERSONS CODED
H B C P1 P2
12 & 15
YEARS
650 650 4.1% 0 95.8% 0 0
{χ2 = 4.7; P = 0.02 (Significant)}.
Graph 15: Distribution of study population based on CPI index
2.50% 6.00% 0% 0%
97.50% 94.00%
0.00%
20.00%
40.00%
60.00%
80.00%
100.00%
120.00%
12 years 15 years
Healthy Bleeding Gums Calculus

Results
52
Table 16, Graph 16 shows distribution of study population based on
Crown Status.511 children (266(76%) 12 year old and 245(82%) 15 year old)
had decayed teeth. 4(1.1%) 12 year old children and 2(0.6%) 15 year old
children had filled teeth with decay. 9(2.5%)
12 year old children and 47(15.6%) 15 year old children had filled
teeth. 30(8.5%) 12 year old children and 97(32.3%) 15 year old children had
missing teeth due to caries. 1(0.1%) child had missing due to reason other than
caries. 6(1.7%) 12 year old children and 4(1.3%) 15 year old children had
fractured teeth.
Table 16: Distribution of study population based on Crown Status
Private school Government school
Total 12 years 15 years 12 years 15 years
Decayed
Yes 142(78.5%) 113(75.8%) 124(73.4%) 132(87.4%) 511(78.6%)
No 39(21.5%) 36(24.2%) 45(26.6%) 19(12.6%) 139(21.4%)
Filled with decay
Yes 3(1.6%) 2(1.3%) 1(0.6%) 0(0%) 6(0.9%)
No 178(98.4%) 147(98.7%) 168(99.4%) 151(100%) 644(99.1%)
Filled without decay

Results
53
Yes 6(3.3%) 11(7.4%) 3(1.8%) 36(23.8%) 56(8.6%)
No 175(96.1%) 138(92.6%) 166(98.2%) 115(76.2%) 594(91.4%)
Missing due to caries
Yes 16(8.8%) 28(18.8%) 7(4.1%) 42(27.8%) 93(14.3%)
No 165(90.6%) 121(81.2%) 162(95.9%) 109(72.2%) 557(85.7%)
Missing other reason
Yes 1(0.6%) 0(0%) 0(0%) 0(0%) 1(0.1%)
No 180(99.4%) 149(100%) 169(100%) 151(100%) 649(99.9%)
Trauma
Yes 3(1.7%) 4(2.7%) 3(1.8%) 0(0%) 10(1.5%)
No 178(98.3%) 145(97.3%) 166(98.2%) 149(100%) 640(98.5%)
Graph 16: Distribution of study population based on Crown
Status
255
5 17 44
1 7
256
1
39 49
0 3 0
50
100
150
200
250
300
Decayed Filled withdecay
Filled withoutdecay
Missing dueto caries
Missing otherreason
Trauma
Private school children Govt school children

Results
54
Table 17 shows distribution of study population based on root status of
children. Among the study population, 4(0.6%) children, (3(0.8%) 12 year old
children and 1(0.3%) 15 year old child) had decayed root.
Table 17: Distribution of study population based on Root status
Table 18, Graph 17 shows distribution of study population based on
Treatment needs. Majority of the study population 454 (241(68.8%) 12 year
old children and 213(71%) 15 year old children need one surface restoration.
Two surface restorations were needed by 77(22%) 12 year old children and
144(48%) 15 year old children needed two surface restorations. 27 (7.7%) 12
year old children and 22(7.3%) 15 year old children needed pulp care and
17(4.9%) 12 year old children and 12(4%) 15 year old children needed
extraction.
Private school Government school
Total 12 years 15 years 12 years 15 years
Root Decay 2(1.1%) 1(0.7%) 1(0.6%) 0(0%) 4 (0.6%)
Root
Unexposed
179
(98.9%)
148
(99.3%)
168
(99.4%)
151
(100%)
646
(99.4%)

Results
55
Table 18: Distribution of study population based on Treatment needs
Private school Government school
Total
12 years 15 years 12 years 15 years
One surface restoration
Yes 129(71.3%) 88(59.1%) 112(66.3%) 125(82.8%) 454(69.9%)
No 52(28.7%) 61(40.9%) 57(33.7%) 26(17.2%) 196(30.1%)
Two surface restoration
Yes 42(23.2%) 81(54.4%) 35(20.7%) 63(41.7%) 221(34%)
No 139(76.8%) 68(45.6%) 134(79.3%) 88(58.3%) 429(66%)
Pulp care
Yes 11(6.1%) 16(10.7%) 16(9.5%) 6(4%) 49(7.5%)
No 170(93.9%) 133(89.3%) 153(90.5%) 145(96%) 601(92.6%)
Extraction
Yes 5(2.8%) 6(4%) 12(7.1%) 6(4%) 29(4.4%)
No 176(97.2%) 143(96%) 157(92.9%) 145(96%) 621(95.6%)

Results
56
Graph 17: Distribution of study population based on Treatment needs
Table 19, Graph 18 shows the mean DMFT of the study population.
12 year old children and 15 year old children had a mean DMFT Value of
2.14 and 2.72 respectively.
Statistical test showed significant difference between Mean DMFT and
Age.
217
123
27 11
237
98
22 18
0
50
100
150
200
250
One surfacerestoration
Two surfacerestoration
Pulp care Extraction
Private school children Govt school children

Results
57
Table 19: Distribution of study population based on Mean DMFT
DMFT Private school Government school
12 years 15 years 12 years 15 years
MEAN(S.D) 2.01(1.63) 2.28(1.9) 2.27(1.93) 3.15(2.24)
MEDIAN 2 2 2 2
MEAN RANK 294.28 313.98 315.20 285.97
P VALUE < 0.001 (Highly significant); Kruskal Wallis ANOVA
(Mann Whitney U Value = 44903; P = 0.001)
Graph 18: Distribution of study population based on Mean DMFT
2.01 2.28 2.27
3.15
0
0.5
1
1.5
2
2.5
3
3.5
private 12 year oldstudents
Private 15 year oldstudents
Govt 12 year oldstudents
Govt 15 year oldstudents
MEAN DMFT

Results
58
Table 20, Graph 19(a) and (b) shows the distribution of study
population based on Prosthetic needs. Among the study population, 29(4.4%)
children need upper one unit prosthesis, 11(1.6%) children need upper
multiunit prosthesis and 6(0.9%) children need both upper one unit and
multiunit prosthesis. 63(9.6%) children need lower one unit prosthesis,
22(3.3%) children need lower multiunit prosthesis and 12(1.8%) children need
both lower one unit and multiunit prosthesis.
Statistical test showed that there is significant difference with respect
to both upper and lower prosthetic treatment needs between 12 and 15 year old
students studying in private and Government schools.
Table 20: Distribution of study population based on Prosthetic needs
PROSTHETIC
NEEDS
Private school Government school Total
12 years 15 years 12 years 15 years
UPPER
No prosthesis
needed 169(26%) 131(20.1%) 163(25.1%) 141(21.6%) 604(92.9%)
One unit
prosthesis 8(1.2%) 12(1.8%) 2(0.3%) 7(1.1%) 29(4.4%)
Multiunit
prosthesis 3(0.4%) 3(0.4%) 3(0.4%) 2(0.3%) 11(1.6%)
One unit
prosthesis +
Multiunit
prosthesis
1(0.1%) 3(0.4%) 1(0.1%) 1(0.1%) 6(0.9%)
Total 181(27.8%) 149(22.9%) 169(26%) 151(23.2%) 650(100%)
Upper: {χ2 = 23.33; P < 0.005 (Significant)}

Results
59
LOWER
No prosthesis
needed 163(25.1%) 112(17.2%) 154(23.6%) 124(19.1%) 553(85.1%)
One unit
prosthesis 13(2%) 24(3.7%) 11(1.7%) 15(2.3%) 63(9.6%)
Multiunit
prosthesis 3(0.4%) 9(1.3%) 3(0.4%) 7(1.1%) 22(3.3%)
One unit
prosthesis +
Multiunit
prosthesis
2(0.3%) 4(0.6%) 1(0.1%) 5(0.8%) 12(1.8%)
Total 181(27.8%) 149(22.9) 169(26%) 151(23.2%) 650(100%)
Lower: { χ2 =37.97; P < 0.001 (Significant)}
Graph 19(a): Distribution of study population based on upper Prosthetic
treatment needs
26.1
20.1
25.1
21.6
1.2 1.8
0.3 1.1
0.4 0.4 0.4 0.3 0.1 0.4 0.1 0.1 0
5
10
15
20
25
30
Private school12 years
Private school15 years
Govt school 12years
Govt school 15years
No prosthesis needed
One unit prosthesis
Multiunit prosthesis
One unit prosthesis +Multiunit prosthesis

Results
60
Graph 19(b): Distribution of study population based on Lower Prosthetic
treatment needs
Graph 20: Distribution of study population based on correlation with
sweet score and DMFT
Statistical test showed a significant correlation between sweet score
and Dental caries. (r = 0.061; P = 0.03).
25.1
17.2
23.6
19.1
2 1.7 3.7 2.3 0.4 1.3 0.4 1.1
0.3 0.6 0.1 0.8 0
5
10
15
20
25
30
Privateschool 12
years
Privateschool 15
years
Govt school12 years
Govt school15 years
No prosthesis needed
One unit prosthesis
Multiunit prosthesis
One unit prosthesis +Multiunit prosthesis
0
2
4
6
8
10
0 10 20 30 40 50
DM
FT
SWEET SCORE

Results
61
Graph 21: Distribution of study population based on correlation with
Fish intake and DMFT
Statistical test showed significant correlation between frequency of
Fish intake and DMFT. (r = -0.64; P = 0.02).
Table 21, Graph 22 shows distribution of study population based on
Dental Aesthetic Index (DAI). Majority 429(66%) of the children had Minor
malocclusion and needed no or slight treatment. 160(24.6%) had definite
malocclusion and needed elective treatment. 61(9.4%) had severe
malocclusion and treatment is highly desirable.
0
2
4
6
8
10
0 1 2 3 4 5
DM
FT
FISH INTAKE
CORRELATION BETWEEN FISH INTAKE AND DMFT

Results
62
Statistical test shows significant difference with respect to Malocclusion
between 12 and 15 year old students studying in private and Government
schools.
Table 21: Distribution of study population based on Dental
Aesthetic Index
DAI Score
Private school* Government school*
Total 12 years# 15 years
# 12 years
# 15 years
#
Minor
malocclusion
145(22.3%) 83(12.8%) 125(19.2%) 76(11.7%) 429(66%)
Definite
malocclusion
12(1.8%) 61(9.4%) 25(3.8%) 62(9.5%) 160(24.6%)
Severe
malocclusion
24(3.7%) 5(0.8%) 19(2.9%) 13(2%) 61(9.4%)
Chi square =87.60; P< 0.001(Highly significant).
{#χ2 = 87.60; P < 0.001(Highly significant)}
{* χ2 = 106.488; P = 0.000(Highly significant)}
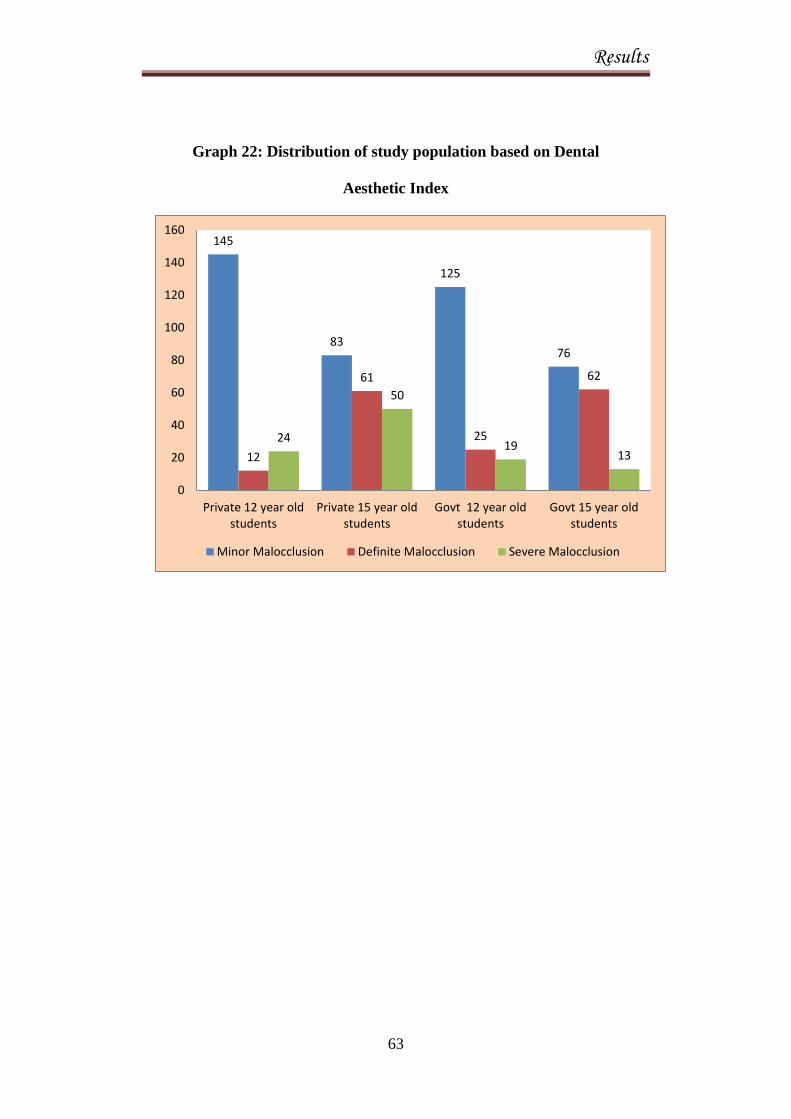
Results
63
Graph 22: Distribution of study population based on Dental
Aesthetic Index
145
83
125
76
12
61
25
62
24
50
19 13
0
20
40
60
80
100
120
140
160
Private 12 year oldstudents
Private 15 year oldstudents
Govt 12 year oldstudents
Govt 15 year oldstudents
Minor Malocclusion Definite Malocclusion Severe Malocclusion

Discussion
64
DISCUSSION
Oral health is an essential component of general health. Horowitz
(2003), a pioneer in the field of dental health education, felt that there is an
association between oral cavity and the development of healthy personality,
perceptions and the overall experiences of pleasure by the child. Particularly in
children, untreated oral diseases frequently lead to serious general health
problems, significant pain, interference with daily function, and even learning
disabilities.36
Among Children, those belonging to fishing community deserve
special attention due to myriad reasons. Long sea voyages force the fishermen
to work for prolonged hours. Owing to their stressful work in the night, they
would rest in day hours and hence may not spare time to take care of their
health as well as their children’s health.16
Another important factor that
influences oral health is the diet of fishermen community. Lack of fruits and
vegetables and increased frequency of fish intake make this population
vulnerable to dental diseases. Moreover, their access to dental services is also
very limited. In India, only few studies have been conducted to assess the oral
health status of children belonging to Fishermen community. Hence, the
present study was contemplated to assess the oral health status and treatment
needs of 12 and 15 years old school going children of fishermen community
residing at East Coast Road, Chennai.

Discussion
65
The present study was conducted among 650(344 males and 306
females) school going children of fishermen community residing at East Coast
Road, Chennai. In this study the WHO Oral Health Assessment Proforma
(Basic Oral Health Survey methods, 1997)37
was used to assess the oral health
status and treatment needs of the study population. A closed-ended
questionnaire was administered to collect data pertaining to perceived dental
health and utilization of dental services, oral hygiene practices and Diet
pattern including amount of fish intake and source of drinking water.
The present study included 330 private school students and 320
government school students. It is difficult to collect data on socioeconomic
factors from children, as they may not be aware of their parent’s income. So to
get an insight into their socioeconomic status, the study population was
classified into those belonging to private and government schools. It may be
perceived that children belonging to lower socioeconomic status might study
in Government schools rather than in a Private school. The study population
consists of 350 children of age 12 years and 300 children of age 15
years.Children belonging to these two age groups were included as 12 years is
the global monitoring age for caries, while 15 years is the index age for
assessment of periodontal disease indicators.
ORAL HYGIENE PRACTICES
In this present study, 470 children (72.3%) were brushing once a day
which included 257(73.4%) students of 12 years age group and 213(71%)

Discussion
66
students of age 15 years. Only 180(27.7%) were brushing twice or more a day
which includes 93(26.6%) students among 12 years and 87(29%) students
among 15 years, which is less compared to Stalin A et al(2011)32
study among
11 to 14 years children in Tiruchengode, Tamil Nadu.
In the present study, 617(94.9%) were using Tooth brush and tooth
paste and 33(5.1%) were using Finger and tooth powder. However, at the
same time a high prevalence of calculus and Dental caries were observed in
the clinical investigation. This inconsistency could be explained by either over
reporting of tooth brushing frequency or simply reflecting a lack of tooth
brushing skills. While the tooth brushing technique may be improper to
majority of children, they may still gain some caries preventive effect when
using tooth paste with appropriate level of fluoride.
DENTAL VISITS AMONG STUDY POPULATION
In this present study, among the total study population 323 children
(49.7%) had tooth ache or discomfort in their teeth, of which 156 (44.6%)
were 12 years children and 167 (55.7%) were 15 years children. Among this
only 226(34.8%) of the total study population have visited dentist during past
12 months. However there was no much difference among 12 years 118
(33.7%) and 15 years 108(36%) in visiting dentist during past 12 months. 63
children from 12 years and 70 children from 15 years had visited dentist for
Tooth ache. Dental visits are mostly sought for symptomatic reasons and

Discussion
67
restoration is often the service rendered for pain relief. In our study also, most
of the children never visited the dentist because parents and children did not
recognize the need for regular dental check-up and many children cannot
afford to undergo dental treatment as most of them may think it as an
expensive procedure.
PERIODONTAL DISEASE
Among this study population based on CPI index, majority of the study
population 623(95.8%) had CPI score of 2(i.e., calculus), while only 27(4.1%)
of the study population had CPI score of 0(i.e., healthy gums). This finding is
similar to 93.1%periodontal disease prevalence in the fisherman study
conducted by Saravanan et al (2011)14
in Tirunelveli district, Tamil Nadu.
This may be due to socioeconomic factors and the availability, affordability
and awareness towards oral hygiene, lack of proper technique of brushing and
lack of access to dental care.
This finding is higher in relation to CPI score of 2 (i.e., calculus) and
low in compared to CPI score of 0 (i.e. healthy gums) when compared to
Kumari et al (2011)20
in Lucknow.
MEAN DMFT
In this population study, 12 year old children and 15 year old children
had a mean DMFT of 2.14 and 2.72 respectively. This finding is similar to the
Discussion
68
study done by Dhaval et al (2011)24
study among school going 12 and 15 years
children in Ahmedabad city.
The study finding is lower when compared Saravanan et al (2011)14
study among fishermen in Tirunelveli district, Tamil Nadu where the mean
DMFT was 3.61.
The study finding is higher than the study done by Bhat et al (2007)17
where the Mean DMFT was 1.89 conducted in fisher folk communities in
coastal areas of Karnataka among 10-14 years children, Bhat et al (2008)
study conducted in Harikantra fishing community in Karnataka and Anu et al
(2011) study conducted among12 to 13 years school children in Chennai.
The study finding comparatively very high than the study conducted by
Ganesh A et al (2011)34
among 12 and 15 years children in Chennai and
Mehta. A et al (2011)22
study among 4 to 17 years children in various
government and private schools in Chandigarh , Grover S et al (2011)28
among
school going children. This may be due to higher sweet consumption (54%),
increased intake of fish (71.5%). Diet, availability of sticky carbohydrate rich
food, presence of certain trace elements like selenium, relative humidity might
have influenced the occurrence of Dental caries in this study population.
Implementation of oral health program at early age helps in improving
preventive dental behaviour and attitudes, which is beneficial throughout the
Discussion
69
life time. This can be achieved by educating the parents about dental health
through school dental programme.
CARIES PREVALANCE
In this study population, 78.6% had caries prevalence of which 76%
were 12 years and 82% were 15 years.
This is comparatively similar to Bhat et al (2007)17
study conducted in
fisher folks communities in coastal areas of Karnataka where 80.64% had
decayed teeth.
This reading is relatively higher compared to 63.8% dental caries in
Bhat et al (2008)21
study in Harikantra rural fishing community in Karnataka,
49.9% decayed teeth in the study conducted by Mehta. A et al (2011)22
among
various government and private school children in Chandigarh, 54.9% caries
prevalence in Saravanan et al (2011)14
among fishermen in Tirunelveli district,
TamilNadu, 64.98% caries prevalence in Amith et al (2011)26
in 12 and 15
years school children in Waranagar, Maharashtra, 50.34% decayed teeth in
Sujatha et al (2011)33
study among 7 to 12 years and 13 to 16 years group in
both urban and rural areas in Guntur district, 40.2% for 12 years and 51% for
15 years in the study conducted by Ganesh et al (2011)34
in Chennai, 57.7%
for 12 years and 48.5% for 15 years in the study conducted by Grover S et al
(2011)28
in the school going children.
Discussion
70
The higher prevalence may be the results of poor dietary habits
including high consumption of sugar containing products combined with
frequency of tooth brushing and frequency of dental visits. So, need for
promotion of oral health and provision of availability of treatment to every
child as well as planned school based oral health education program were
needed to increase the oral health knowledge among these school children.
SWEET SCORE AND CARIES PREVALANCE
In this study population, among the 12 year old school children, 53
(15.1 %) had excellent sweet score, 97 (27.7 %) had good sweet score and 200
(57.7 %) were in watch-out zone. Among the 15 year old school children, 55
(18.3 %) had excellent sweet score, 94 (31.3 %) had good sweet score and
151 (50.3 %) were in watch-out zone.
This finding is similar to Ganesh et al (2011)34
study among 12 and 15
years children in Chennai where 16.9% had excellent sweet score, 20.6% had
good sweet score, 62.6% were in watch- out zone and also similar to Anu et al
(2011)25
study among 12 to 13 years school children in Chennai. Results
revealed that among 138 urban population, 6.5% had excellent sweet score,
25.36% had good sweet score and 68.11% were in watch-out zone. Among
179 rural populations, 18.40% had excellent sweet score, 14.25% had good
sweet score and 67.03% were in watch-out zone. This may be due to rapid
influx of cariogenic foods in their locality and easy availability of these

Discussion
71
products from street vendors and shops located around all the schools which
resulted in more consumption of these attractive sticky sugary stuffs.
Since, majority of school children were in watch-out zone, early
interventions like dietary counselling among school children can be
appropriate to inhibit the carious process.
FISH INTAKE AND CARIES PREVALANCE
In this study population, among the 12 years old children, 115 (32.9 %)
were taking fish daily, 120 (34.3%) were taking fish more than 3 days in a
week, 109 (31.1 %) were taking fish less than 3 days in a week and 5(1.4 %)
never took fish. Among the 15 years old children, 107 b(35.7 %) were taking
fish daily, 122 (40.7 %) were taking fish more than 3 days in a week, 64 (21.3
%) were taking fish less than 3 days in a week and 7 (2.3 %) never took fish.
The caries prevalence for 12 and 15 years old children is 78.6% and 76%. This
finding is similar to 80.64% caries prevalence of Bhat et al (2007)17
study in
fisher folk communities in coastal areas of Karnataka.
Selenium could affect mineralization of enamel would be by altering the
uptake of fluoride ion into enamel as Fluor apatite. Fluor apatite may stabilize
the crystal lattice and render enamel less soluble to the acid attack of the caries
process. The lack of interaction between fluoride and selenium in bones and
teeth could also be due to the large disparity in their concentrations, since
fluoride concentrations can be from fifty to several thousand times larger than

Discussion
72
the selenium concentrations in the hard tissues. The fact that dietary organic
and inorganic selenium compounds did not influence fluoride metabolism in
the hard tissues has important implications regarding how selenium may
increase dental caries.38,39
Since the present study being of cross sectional design, the exact
temporality between fish intake and Dental caries could not be determined.
Further, longitudinal study should be conducted to find the exact causal
relation between fish intake and dental caries.
TREATMENT NEEDS
Majority of the study population 454(241(68.8%) 12 year old children
and 213(71%) 15 year old children need one surface restoration. Two surface
restorations were needed by 77(22%) 12 year old children and 144(48%) 15
year old children needed two surface restorations. 27(7.7%) 12 year old
children and 22(7.3%) 15 year old children needed pulp care and 17(4.9%) 12
year old children and 12(4%) 15 year old children needed extraction.
The study finding is similar to Ganesh et al (2011)34
study conducted
among 12 and 15 years in Chennai in relation to 4.1% extraction and higher
for one surface restoration (44.4%), two surface restoration (15.5%), and pulp
care (2.9%).
The study finding is relatively lower compared to adult fishermen
study conducted by Saravanan et al (2011)14
in Tirunelveli district. Tamil

Discussion
73
Nadu in which the treatment needed for extraction (39.6%), filling (20.8%),
and root canal treatment(11.8%).
Hazardous occupations, unscheduled working hours, job related stress,
pernicious habits, irregular diet due to lack of availability of home cooked
food, lower awareness levels and socio-economic status seemed to influence
the oral health status of fishermen population.
MALOCCLUSION AND DAI SCORE
In this study population, majority 448(68.9%) of the children had
minor malocclusion and needed no or slight treatment. 172(26.5%) children
(49(14%) 12 year old children and 123(41%) 15 year old children) had
definite malocclusion and needed elective treatment. 30(4.6%) children
(12(3.4%) 12 year old children and 18(6%) 15 year old children) had severe
malocclusion and treatment is highly desirable. This may be due to pernicious
habits during childhood, premature exfoliation of deciduous teeth. Tooth
mortality in early childhood has a direct influence on future development and
establishment of occlusion.
The study finding is high when compared to Pankaj S et al (2010)29
study conducted among 12 to 15 years children in Belgaum, Karnataka where
88.6% had a dental appearance (exhibited lower DAI score) which require no
orthodontic treatment and higher(26.5%) when compared to 11.4% of
children requiring orthodontic treatment.
Discussion
74
Reddy et al (2011)18
conducted a study to assess the prevalence of
malocclusion and orthodontic treatment needs among 300 school children of
12-15 years old of Maduravoyal area, Chennai. This study showed
110(36.7%) had definite malocclusion requiring elective treatment, 83(27.7%)
had severe malocclusion requiring highly desirable treatment. These findings
are relatively higher than this present study.

Summary
75
SUMMARY
The present descriptive cross-sectional study was conducted to assess
the oral health status and treatment needs of 12 to 15 years old school going
children of Fishermen community residing at East coast road, Chennai, Tamil
Nadu. Ethical clearance was obtained from the Institution Review Board of
Ragas Dental College & Hospital and Chief Educational Officer,
Kancheepuram District to conduct the study. (ANNEXURE I & II)
Children, whose parents involved in fishing as primary occupation
obtained with the help of school records and who were present on the day of
examination were included in the study. Data was collected using proforma
which consisted of WHO basic oral health assessment form (1997) and a pre-
tested, closed ended questionnaire. The collected data was subjected to
statistical analysis using SPSS 15 version.
The findings of the current study were as follows:
Of the 650 School children examined, 350 children were 12 years old
and 300 children were 15 years old.
Majority of the children, 419 (64.5%) were satisfied on appearance of
their teeth.
Majority of the children, 617 (94.9%) used tooth paste and tooth brush
to clean their teeth.

Summary
76
Majority of the children, 470 (72.3%) brush their teeth once a day.
Mean DMFT Value of 12 year old private and Government school
children were 2.01 and 2.27 respectively. While Mean DMFT value of
15 year old private and Government school children were 2.28 and
3.15 respectively.
A large percentage of the children, 424 (65.2%) had not visited dentist
before. Of those visited, 133 (58.8%) children had visited dentist for
Tooth ache.
Majority of the children, 351 (54%) were in Watch-out zone during
sweet score calculation with significant relation to DMFT.
Majority of the children, 464 (71.3%) were taking fish more than 3
days in a week with significant relation to DMFT.
On TMJ examination, 647 (99.6%) had no TMJ symptoms and 3
(0.4%) children had clicking.
43 (6.6%) children had demarcated enamel opacities.
16 (2.5%) had questionable dental fluorosis, and 2 (0.3%) children had
mild dental fluorosis.
623 (95.8%) had CPI score of 2(ie., calculus), while only 27 (4.1%) of
the study population had CPI score of 0(ie., healthy gums).
511 (78.6%) children had decayed crown, 127 (19.5%) had teeth
missing due to caries, 56 (8.6%) had filled crown and 4 (0.6%)
children had decayed root.

Summary
77
454(69.8%) children needed one surface restoration, 221(34%) needed
two surface restoration, 49 (7.5%) needed pulp care and 29(4.4%)
needed extraction.
172(26.5%) children had definite malocclusion and needed elective
treatment. 30(4.6%) children had severe malocclusion and treatment is
highly desirable.

Conclusion
78
CONCLUSION
The magnitude of the dental diseases was high among these children.
Oral health status of fishermen children was relatively poor with high caries
prevalence and poor periodontal health.
Poor socioeconomic status, Lack of formal education among parents,
Diet, availability of sticky carbohydrate rich food, presence of certain trace
elements like selenium, relative humidity might have influenced the
occurrence of dental caries in this study population. As oral health is an
integral part of general health, the oral health of these children may also get
influenced by such environmental and socioeconomic factors. Majority of the
study population required oral prophylaxis and restoration of their teeth.
Among the oral diseases, Dental caries and periodontal diseases have
historically been considered the most important global oral health burdens.
Despite various steps taken to improve the oral health of people, oral health
problems still remain as a burden in many communities, particularly among
underprivileged people.
The present study was conducted to assess the oral health status and
treatment needs of 12 and 15 years old school going children of Fishermen
community residing at East Coast Road, Chennai revealed that the oral health
status of these children was poor with high caries prevalence and high
Malocclusion. This study also highlighted the contribution of high intake of
sweets and Fish and its adverse effects on oral health conditions of these
children.

Recommendations
79
RECOMMENDATIONS
Oral health education should be given to the fishermen population
about the oral health problems through pamphlets issued by Social welfare
organization of fishermen population and fishermen cooperative societies and
also giving advice on oral hygiene and the importance of regular dental check-
up.
1. Fishermen cooperative societies may establish a dental clinic within
their area to deliver comprehensive health care to fishermen
population.
2. Nearby Dental colleges and IDA if any may adopt Fishermen
community which may help to reduce the unmet back log of dental
treatment needs of these children who are poor socio economically.
3. Voluntary organizations can organize free medical and dental camps
periodically so that the children can get free treatment.
4. Centrally Sponsored National Scheme on Welfare of Fishermen, Chief
Minister's Comprehensive Health Insurance Scheme should be used by
fishermen to cater their oral needs.
5. The fishery departments should ensure health insurance for all dental
procedures and distribution of Tooth pastes, mouth washes at a
subsidized rate for Fishermen population.

Bibliography
80
BIBLIOGRAPHY
1. Park K. Text Book of Preventive and Social Medicine.20th
Edition.Jabalpur. Banarsidas Bhanot 2009.
2. Ustun.AP, Corvalan.C. Preventing Disease Through Healthy
Environments. Publication of World Health Organisation, 2006. WHO
press.
3. Blinkhom AS. Dental Health education: What Lessons Have We
Ignored Br dent J 1998; 184(2): 58-59.
4. National oral health survey and fluoride mapping 2002-2003. Dental
Council of India.
5. Rang WS, Bian JY. Wang WJ. Effectiveness of An Oral Health
Education And Caries Prevention Program In Kindergartens In China.
Community Dent Oral Epidemiol 2003; 31: 412-6.
6. Petersen PE, Peng G, Tai B. Effect Of A School-Based Oral Health
Education Programme in Wuhan City, Peoples Republic of China.
Int. Dent. J. 2004: 54: 33-41.
7. Harris NO. School Based Dental Health Programs Primary Preventive
Dentistry. Harris and christen AG. 3rd
edition. 2004, Pearson Prentice
Hall Publication.
8. Thomas S, Tandon S, Nair S. Effect of Dental Health Education on
The Oral Health Status of a Rural Child Population by involving target
group. J. Indian SocPedoPrev Dent. 2000; 18(3): 115-125.

Bibliography
81
9. http://en.wikipedia.org/wiki/Fishing in India accessed on 25.4.2012.
10. http://en.wikipedia.org/wiki/Ports_in_India accessed on 27.4.2012.
11. Carel RS, Carmil D, Keinan G. Occupational stress and well-being: do
seafarers harbor more health problems than people on the shore? Isr J
Med Sci 1990; 26(11):619-24.
12. Casson FF, Zucchero A. Work and chronic health effects among
fishermen in Chioggia, Italy. G Ital Med LavErgon 1998; 20(2): 68-74.
13. Lawrie T, Matheson C. The health and lifestyle of Scottish fishermen: a
need for health promotion. Health Educ Res 2004; 19(4):373-79.
14. Saravanan N, Reddy C.V.K, Veeresh D.J. A Study to assess the Oral
health status and treatment needs of Fishermen population in coastal
region of Tamilnadu. JIAPHD 2011; 18: 266-77.
15. Saarni U, Saarni H.Xylitol for messrooms--A method worth trying to
prevent caries among seafarers. Bull InstMarit Trop Med
Gydnia1997;48:91-7.
16. Sandbeek OW. Dental health status and use of dental services among
seamen in overseas trade. Nor TannlaegeforenTid 1977; 87(6):275-81.
17. Megashyam B, Nagesh L, Ankola A. Dental caries status and treatment
needs of children of fisher folk communities, residing in the coastal areas
of Karnataka region, South India. West Indian Med J 2007; 56(1): 96-8.
18. Reddy V.C, Priya S.H, Chaly P.E, Ingle N.A. Prevalance of Malocclusion
and orthodontic treatment needs among 12-15 years old school children
of Maduravoyal area, Chennai. JIAPHD 2011; 18: 591-97.

Bibliography
82
19. Shivakumar V, Gopinath V, Saravanakumar R. A cross sectional study on
the prevalence and determinants of Dental caries among school children
of Padur. JIAPHD 2011; 18: 1138-43.
20. Kumari M, Saha S, Jaganath G.V. Periodontal status of 12-15 years old
urban and rural school children of Lucknow. JIAPHD 2011; 18: 171-76.
21. Bhat M. Oral health status and treatment needs of a rural Indian fishing
community. West Indian Medical Journal 2008; 57(4): 415-418.
22. Mehta A, Gupta J, Bhalla S. Prevalance of dental caries among 3-17 year
old children studying in various government and private schools at
Chandigarh. JIAPHD 2011; 18: 89-93.
23. Kaur N, Hiremath S.S. Prevalance of Traumatic injuries to permanent
anterior teeth among 8-15 years old Government and private school
children in Bangalore city. JIAPHD 2011; 17(1): 357-63.
24. Dhaval P.R, Sujal P.M. Assessment of Gingival and Dental caries
status among 12 and 15 years old school going children of Ahmedabad
city. JIAPHD 2011; 18(3): 967-71.
25. Anu V, Shivakumar M, Madankumar P.D. Sweet score and Dental caries
experience of 12-13 year old school children in Chennai. JIAPHD 2011;
17(1): 305-8.
26. Amith H.V, D’Cruz A.M. Prevalance of Dental caries amongst 12-15
years old school going children in Warananagar, Kolhapur, Maharashtra.
JIAPHD 2011; 18(2): 887-90.

Bibliography
83
27. Naveen kumar B, Ramesh N, Reddy V. Prevalance of Traumatic dental
injuries to permanent incisors among 12 years old school children in
Tandoor, Andhra Pradesh. JIAPHD 2011; 17(2): 704-7.
28. Grover S, Anuradha P. Prevalance and treatment needs of dental caries
among 12 and 15 years old school going children in Lucknow city.
JIAPHD 2011; 18: 105-11.
29. Pankaj S. Prevalance of malocclusion and orthodontic treatment needs
among 12-15 years school children using dental aesthetic index. JIAPHD
2010; 15: 81-84.
30. Senthilkumar M, Balagopal S,Reddy S. Caries prevalence among 5-12
years school children residing in rural Chennai. JIAPHD 2011; 18(3):
1040-43.
31. Bhat P.K, Aruna C.N. Dietary habits, Oral hygiene practices and
prevalence of Dental caries among 10-12 years old school children of
South Bangalore. JIAPHD 2011; 17: 78-82.
32. Stalin A, John J.B, Preethi V. Diet pattern and caries prevalence of
Children aged 11-14 years in Tiruchengode. JIAPHD 2011; 17(1):
554-59.
33. Sujatha B, Saisankar A.J, Manojkumar M.G. Prevalance of dental caries
and treatment needs for school going children in rural and urban areas of
Guntur district. JIAPHD 2011; 17(2): 533-38.

Bibliography
84
34. Ganesh A, Ingle N, Chaly P, Reddy C. Sugar consumption and Dental
caries experience in 12 and 15 year old children in Chennai. JIAPHD
2011; 18(1):462-73.
35. Mahesh kumar P, Joseph T, Varma R.B, Jayanthi M. Oral health status of
5 years and 12 years school going children in Chennai city- An
epidemiological study. Journal of Indian Society of Pedodontics and
Preventive dentistry 2005; 23(1):17-22.
36. Horowitz AR. Initial Impact of a National Dental Education Program
on the Oral Health and Dental Knowledge of Children. The Journal of
Contemporary Dental Practice, 2003;4(2):1-7.
37. WHO oral health surveys basic methods, 4th
Ed. 1999. AITBS Pub.
38. Thomas R. Shearer. Fluoride-Selenium Interaction in the Hard and
Soft Tissues of the Rat. Journal of Nutrition 1976;106: 451-456.
39. Hadjimarkos, D. M. Selenium in relation to dental caries. Food
Cosinet. Toxicol 1973;11: 1083-1095.

Annexures
85
ANNEXURE I

Annexures
86
ANNEXURE II
PERMISSION LETTER OBTAINED FROM THE CHIEF EDUCATIONAL
OFFICER, KANCHIPURAM DIST., TAMIL NADU
P.Selvakumari
CEO
Kancheepuram Dist
----------------------------------------------------------------------
Proceedings of the chief educational officer,Kancheepuram Dist
Pdl 1/12 Dated:21.1.2012
-----------------
Sub:- Education – Permission to attended the project works at schools
Ref:- Application Dated 18.1.2012 of the individual concerned
-----------------
Dr.M.Rajmohan, Post graduate student, Ragas dental college, Chennai
permitted to do his project work in the schools enclosed in the list
---------------------------------------------------------------------------
Encl:- List of Schools
To,
Concerned Headmaster
Copy to District Elementary Education Officer, Kancheepuram Dist

Annexures
87
ANNEXURE III - QUESTIONNAIRE
AN ASSESSMENT OF ORAL HEALTH STATUS AND TREATMENT
NEEDS OF 12 TO 15 YEARS OLD SCHOOL GOING CHILDREN OF
FISHERMEN COMMUNITY RESIDING AT EAST COAST ROAD,
CHENNAI.
QUESTIONNAIRE- 12 & 15 years
Name of the school / gs;spapd; ngah; :
Private/ Government school / jdpahh; / muR gs;sp :
Name of the student / khzthpd; ngah; :
Sex / ghypdk; :
Age / taJ :
Fathers occupation / je;ijapd; njhopy; :
Mothers occupation/ jhapd; njhopy; :
1. Are you satisfied with the appearance of your teeth? cq;fs; gw;fspd; Njhw;wk; cq;fSf;F jpUg;jpahf cs;sjh?
Yes / Mk; No / ,y;iy
2. Did you have tooth ache or felt discomfort on account of your teeth
during the past 12 months ? fle;j 12 khjq;fspy; cq;fSf;?F gy; typ my;yJ gy;ypdhy;
mnrsfhpak; ,Ue;jjh?
Yes / Mk; No / ,y;iy
3. Have you visited the dentist during last 12 months? fle;j 12 khjq;fspy; ePq;fs; gy; kUj;Jthplk; nrd;wPh;fsh?
Yes / Mk; No / ,y;iy
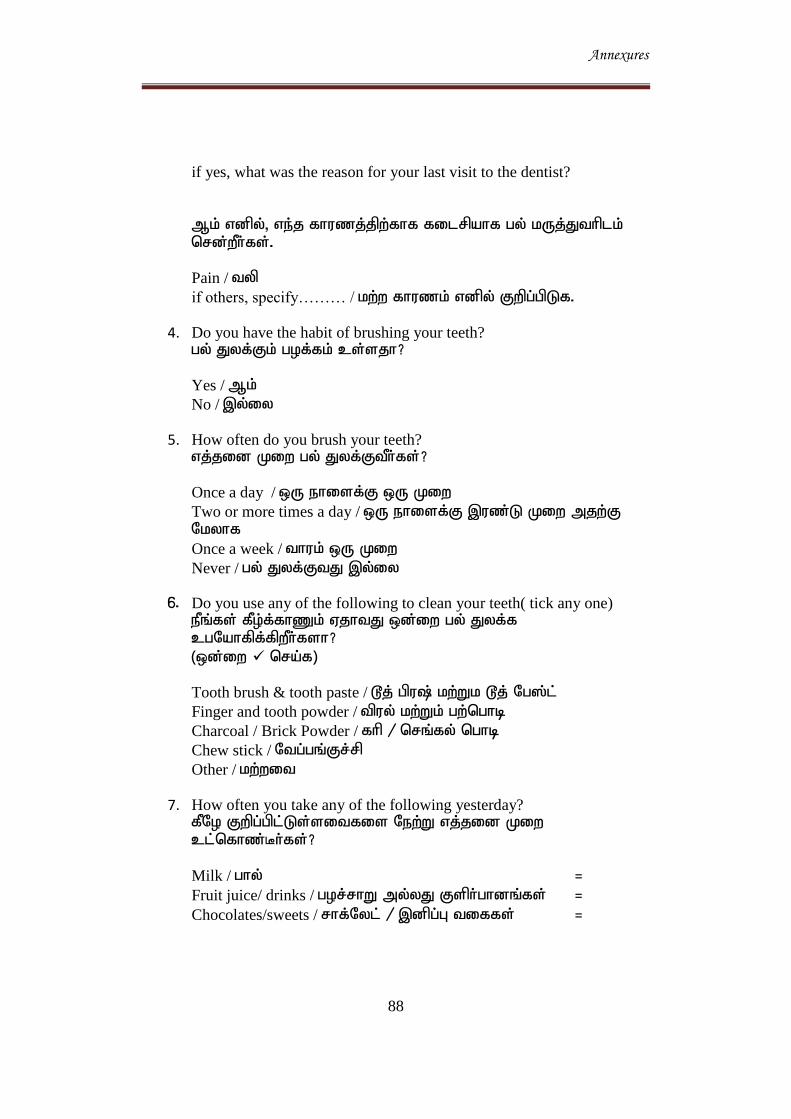
Annexures
88
if yes, what was the reason for your last visit to the dentist?
Mk; vdpy;> ve;j fhuzj;jpw;fhf filrpahf gy; kUj;Jthplk;
nrd;wPh;fs;.
Pain / typ if others, specify……… / kw;w fhuzk; vdpy; Fwpg;gpLf.
4. Do you have the habit of brushing your teeth? gy; Jyf;Fk; gof;fk; cs;sjh?
Yes / Mk; No / ,y;iy
5. How often do you brush your teeth? vj;jid Kiw gy; Jyf;FtPh;fs;?
Once a day / xU ehisf;F xU Kiw Two or more times a day / xU ehisf;F ,uz;L Kiw mjw;F
Nkyhf Once a week / thuk; xU Kiw Never / gy; Jyf;FtJ ,y;iy
6. Do you use any of the following to clean your teeth( tick any one) ePq;fs; fPo;f;fhZk; VjhtJ xd;iw gy; Jyf;f
cgNahfpf;fpwPh;fsh?
(xd;iw nra;f)
Tooth brush & tooth paste / ^j; gpu\; kw;Wk ^j; Ng];l; Finger and tooth powder / tpuy; kw;Wk; gw;nghb Charcoal / Brick Powder / fhp / nrq;fy; nghb Chew stick / Ntg;gq;Fr;rp Other / kw;wit
7. How often you take any of the following yesterday? fPNo Fwpg;gpl;Ls;sitfis New;W vj;jid Kiw
cl;nfhz;Bh;fs;?
Milk / ghy; = Fruit juice/ drinks / gor;rhW my;yJ Fsph;ghdq;fs; = Chocolates/sweets / rhf;Nyl; / ,dpg;G tiffs; =

Annexures
89
8. How often do you take fish with your food? vj;jid Kiw cq;fs; czNthL ePq;fs; kPd; rhg;gpLtPh;fs;?
a. Daily / jpdKk; b. More than three days in a week / thuj;jpw;F 3 ehl;fSf;F Nky; c. Less than three days in a week / thuj;jpw;F 3 ehl;fSf;F
Fiwthf d. Never / vg;nghOJk; ,y;iy
9. Your source of drinking water ePq;fs; cgNahfpf;Fk; FbePh;
a. Packaged drinking water / Nfd; jz;zPh; b. Corporation water / khefuhl;rp toq;Fk; FbePh; c. Bore well water / Mo;Foha; fpzW jz;zPh;

Annexures
90
ANNEXURE IV – WHO Proforma 1997

Annexures
91