an architecture for semi-automated radar image exploitation
TRANSCRIPT
• SISTERSON, DELANEY, GRAVINA, HARMON, HIETT, AND WYSCHOGRODAn Architecture for Semi-Automated Radar Image Exploitation
VOLUME 11, NUMBER 2, 1998 LINCOLN LABORATORY JOURNAL 175
An Architecture forSemi-Automated RadarImage ExploitationL. Keith Sisterson, John R. Delaney, Samuel J. Gravina, Paul R. Harmon,Margarita Hiett, and Daniel Wyschogrod
T -, wide-area sensorplatforms on unmanned air vehicles (UAV)will generate a profusion of data that dramati-
cally increases the demands on image analysts. For ex-ample, Teledyne Ryan Aeronautical’s Global HawkUAV is designed to provide sustained high-altitudesurveillance and reconnaissance at large standoffranges. Its mission goals include the ability to loiterover a target area for 24 hours at an altitude of 65,000feet. This UAV will carry a synthetic aperture radar(SAR) sensor that is projected to collect in one dayenough data sampled at 1.0 m × 1.0 m resolution tocover 140,000 km2 (roughly the size of North Korea).
To analyze the growing quantities of image data,the Defense Advanced Research Projects Agency(DARPA) initiated a project to develop the Semi-Au-tomated IMINT (image intelligence) Processing, or
SAIP, system. The SAIP system combines advancedautomatic target recognition (ATR) algorithms androbust false-alarm mitigation techniques with com-mercial off-the-shelf computer hardware to filter outnatural and cultural clutter, and to recognize and pri-oritize potential targets. It annotates image areas con-taining potential targets with target cues for the imageanalysts, who use visualization tools provided by theSAIP human-computer interface to establish true tar-get types and produce a target report for the battle-field commander. The results of the exploitation pro-cess are saved and transmitted to other militarysystems.
In this article, we describe the design elements ofthe overall system architecture rather than the detailsof individual algorithms, unless their nature forces aparticular architecture. We discuss how the compo-
■ To improve the timeliness and accuracy of synthetic aperture radar imageexploitation, the Defense Advance Research Projects Agency (DARPA) startedthe Monitor program at Lincoln Laboratory. This program was combined withrelated technologies from other contractors to develop the Semi-AutomatedIMINT (image intelligence) Processing (SAIP) system as part of an advanced-concept technology demonstration. The SAIP system accepts radar images inreal time, distributes them to a number of algorithms for automated analysis,and organizes the images and algorithmic results for display to image analysts.The SAIP software infrastructure, which mediates between the operating systemand the application code of the individual components, supports messagepassing between those components and allows the system to operate as apipeline of parallel computation modules. In this article, we describe the designconsiderations of the overall system architecture. We also discuss how thecomponent systems are organized and how the software allows manycomponents from different organizations to work together.
• SISTERSON, DELANEY, GRAVINA, HARMON, HIETT, AND WYSCHOGRODAn Architecture for Semi-Automated Radar Image Exploitation
176 LINCOLN LABORATORY JOURNAL VOLUME 11, NUMBER 2, 1998
nent systems are organized and how the software al-lows many components from different organizationsto work together. We also describe the parallel archi-tectures of the detection and identification compo-nents—high-definition vector imaging (HDVI) andmean-square error (MSE) classification.
System Description
The SAIP system combines state-of-the-art automatictarget-detection and recognition algorithms with hu-man image analysts. The algorithms can examinelarge volumes of high-resolution imagery in great de-tail but have limited ability to put the imagery intocontext. Human analysts can use contextual cues andan overall sense of purpose to derive an accurate mili-tary analysis under difficult circumstances, but theycannot examine large volumes of high-resolution im-agery in near real time for extended periods.
The SAIP system was conceived to accommodatethe X-band radar planned for the Global Hawk plat-form. The Global Hawk flies at about 175 m/sec andilluminates a swath 10 km wide from an altitude of20 km, resulting in an image pixel rate of 3,000,000pixels/sec and a ground-area coverage rate of 2.3km2/sec [1]. These factors determined the SAIP re-quirements for computational power, data-transferrates, and storage. The SAIP system must have athroughput capability that matches the imaging rateand it must also have a low processing latency. Sys-tems analyses [2] of the requirements for surveillancesystems of transporter-erector launchers (TELs, par-ticularly those we know as SCUDs) found that the la-tency from the initial imaging of a target to the dis-patching of a report from an image analyst needed tobe less than five minutes. The latency of existing sys-tems ranges from five to fifteen minutes [3, 4]. Theunder-five-minute constraint provided a latency goalfor the SAIP system of two minutes for processingand two minutes for image-analyst exploitation. Theimaging rate of the sensor makes an exploitable imageabout every minute, so with two analysts, each has anaverage of two minutes to exploit a scene whilematching the latency requirements.
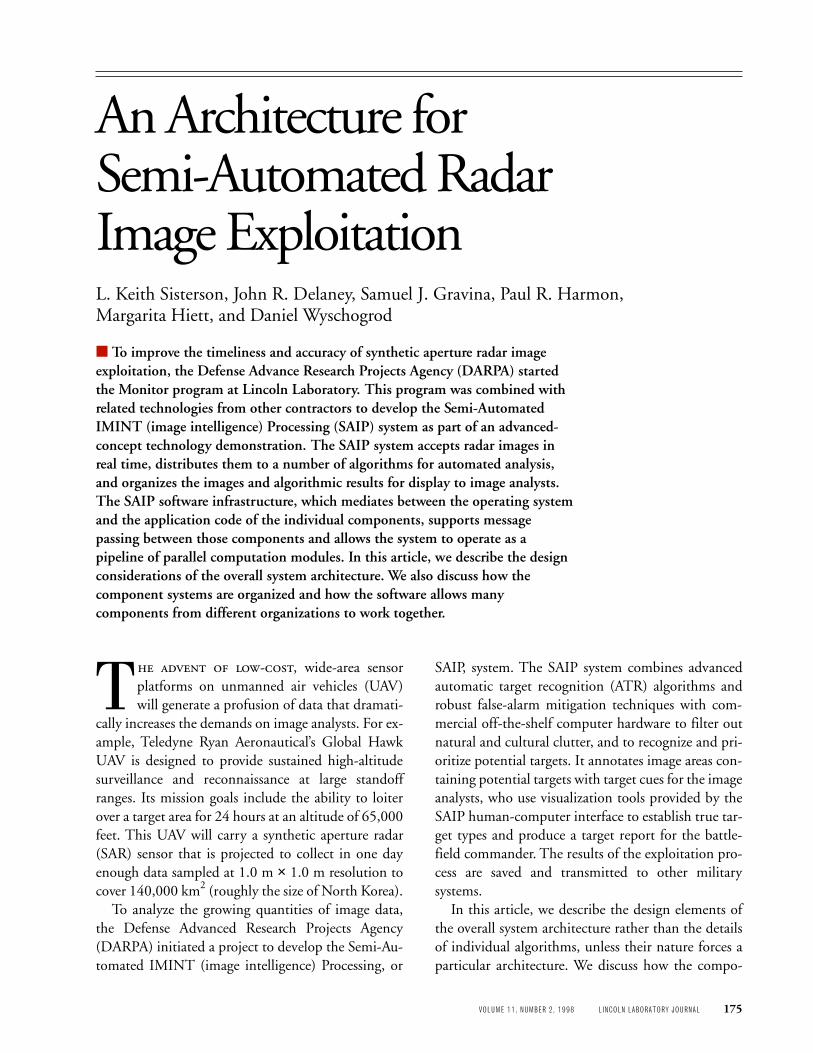
Figure 1 shows the assignment of the SAIP systemcomponents to the servers, and the data flow for thecomplete baseline system. It is composed of several
symmetric multiprocessor servers and workstationsinterconnected by an asynchronous transfer method(ATM) network [5]. The SAIP software infrastruc-ture supports message passing between the applica-tion code of the individual components supplied bydifferent vendors and allows the system to operate as apipeline of parallel computation modules.
The image receiver distributes complex-valued ra-dar image data to registration and detection algo-rithms and up to three analyst workstations. The de-tector finds bright objects in the scene and computescharacteristic features for each object. The locationson the ground of these detected objects are computedby using a sensor model calculated from the registra-tion information. The list of detected objects, theirfeatures, and their geolocations are processed by algo-rithms aimed at false-alarm mitigation and change in-dication. These algorithms process only the detectedobjects, not all the imagery. The discriminationthresholding algorithm computes a score for each ob-ject by using the results from the preceding algo-rithms and rejects objects with a score below a thresh-old. The discrimination thresholding algorithm triesto lower the false-alarm rate by up to a factor of aboutone hundred. It also assigns a priority ranking foreach detected object, or candidate target, that passesthe threshold.
After the discrimination-thresholding algorithm,the HDVI module processes candidate targets in or-der of priority by using a complex image chip con-taining the detected object, followed by the applica-tion of an MSE classifier, which attempts to identifythe object by comparing it to a stored library of signa-tures. A component called the MSE manager man-ages the work flow of the MSE classifier. Finally, theforce-structure-analysis component analyzes the datato establish deployment patterns by comparing thedistributions of detections to known deployment pat-terns of military forces such as tank battalions.
The results and the imagery from which they werederived are stored by the exploitable-image formercomponent in a database for examination by the im-age analysts. This arrangement relieves the analystfrom the necessity of keeping up in real time on ashort-term basis and allows the analyst the flexibilityto spend as long as necessary to exploit a scene.
• SISTERSON, DELANEY, GRAVINA, HARMON, HIETT, AND WYSCHOGRODAn Architecture for Semi-Automated Radar Image Exploitation
VOLUME 11, NUMBER 2, 1998 LINCOLN LABORATORY JOURNAL 177
FIGURE 1. Semi-Automated IMINT (image intelligence) Processing (SAIP) baseline system to analyze image data and detecttargets. Image data are processed to find bright objects and to determine the positions of these objects on the ground. Themain data path through the system, highlighted in blue, starts with the complex imagery being sent to the image receiver. Eachprocessing stage enclosed by a box represents a Silicon Graphics, Inc. server with the configuration indicated. Bright detectedobjects and their features are analyzed by false-alarm mitigation algorithms that reduce false alarms, recognize specific targettypes, and determine military force structures. In the target-recognition algorithms, the discrimination threshold ranks candi-date targets before they are processed by the high-definition vector imaging (HDVI) and mean-square error (MSE) classifier.The results and corresponding original imagery are stored in the exploitable-image former to be retrieved by the image analysts.
4 R8000s256 MB RAMHDVI/MSE
HDVI/MSE4 R8000s
256 MB RAM
6 R4400s500 MB RAM
Image-analystworkstations
Imageserver
Exploitable-imageformer
Target-recognitionalgorithms
False-alarmmitigationalgorithms
Data and results distribution
User interfaces
6 R8000s256 MB RAM
6 R4400s500 MB RAM
Results
Detections
Objectdatabase(40 GB)
Imagedatabase
forregistration
(96 GB)
Exploitationdatabase(30 GB)Temporary
imagedatabase(30 GB)
8 R8000s1.5 GB RAM
12 R1000s2 GB RAM
12 R4400s1.5 GB RAM
i
HDVI/MSE
Compleximagery
CFARdetector
Featureextractor
Registration
Geolocation
Imagereceiver
MSEmanager
Discriminationthresholding
Terraindelimitation
Spacialclustering
Force-structureanalysis
Object-levelchange
detection
• SISTERSON, DELANEY, GRAVINA, HARMON, HIETT, AND WYSCHOGRODAn Architecture for Semi-Automated Radar Image Exploitation
178 LINCOLN LABORATORY JOURNAL VOLUME 11, NUMBER 2, 1998
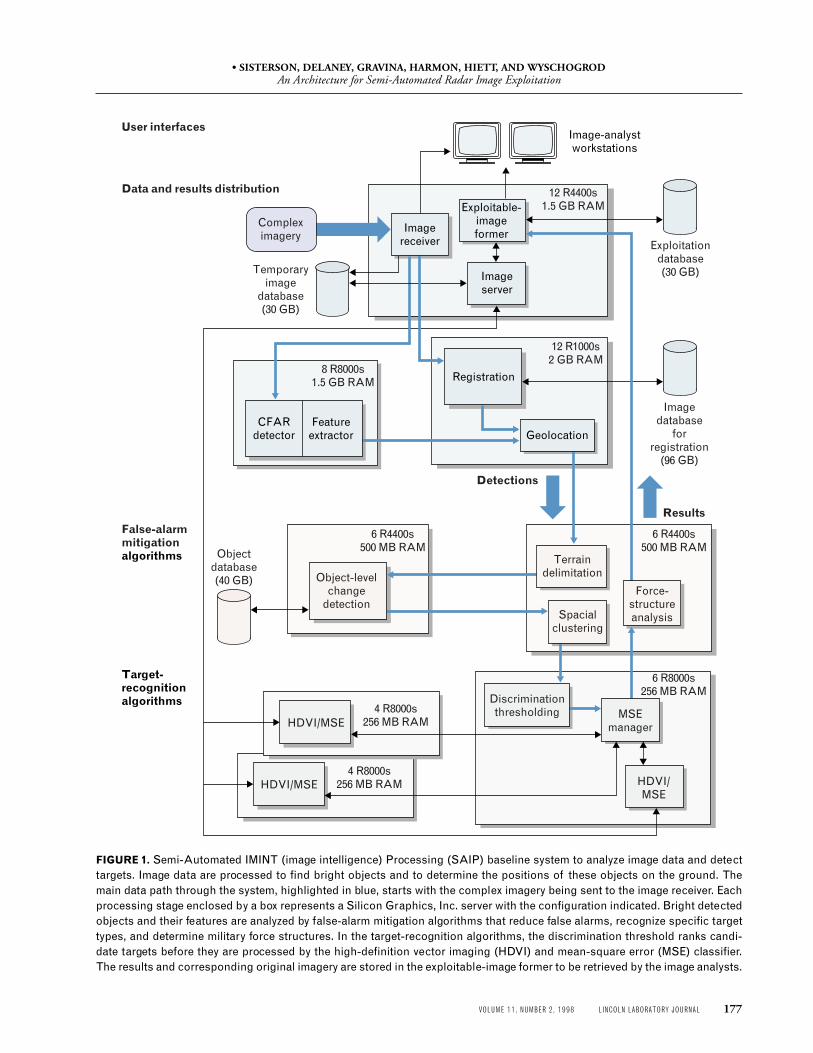
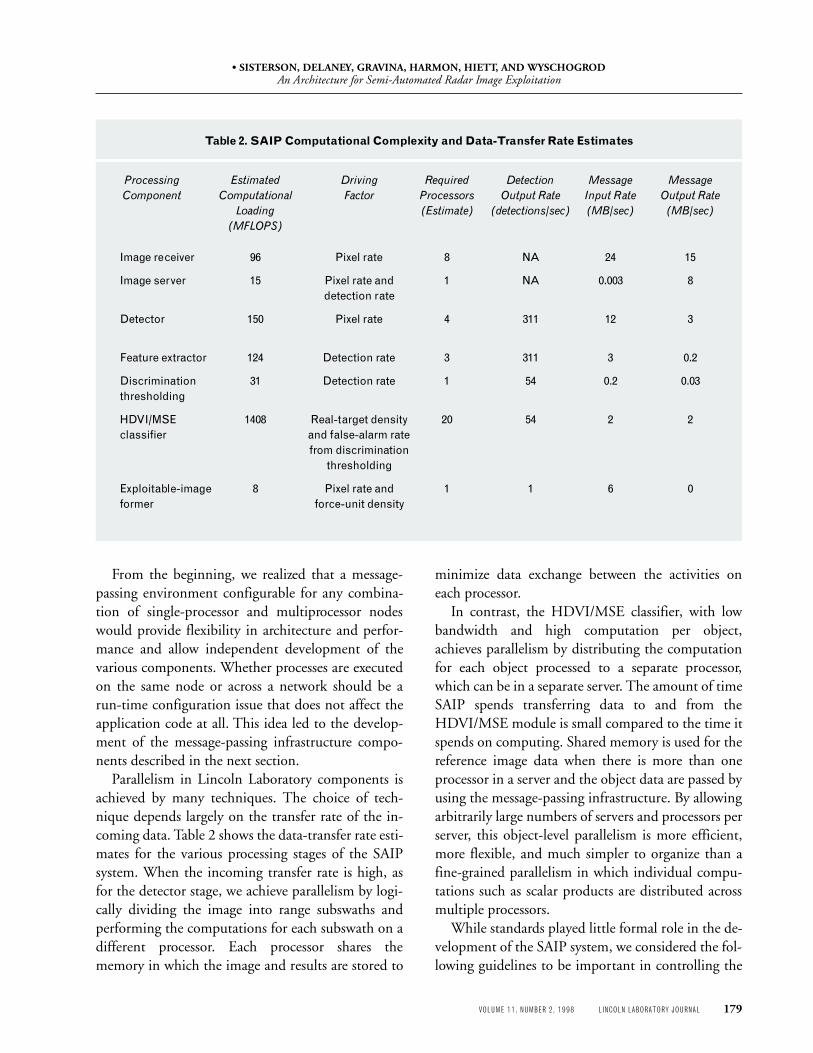
The computational complexity of each algorithmand the data-transfer rate required between algo-rithms determine the nature and organization of thehardware. Table 1 shows the design parameters usedto estimate the computational complexity of LincolnLaboratory SAIP algorithms, which are listed in Table2. The main driving factor for the computationalcomplexity differs for each algorithm. The image re-ceiver and detection components process all the im-agery, and their computational complexity dependsprimarily on the incoming pixel rate. After the detec-tion stage, the remaining algorithms process messagescontaining feature information about the detections.The computational complexity of these algorithmsdepends on the detection rate.
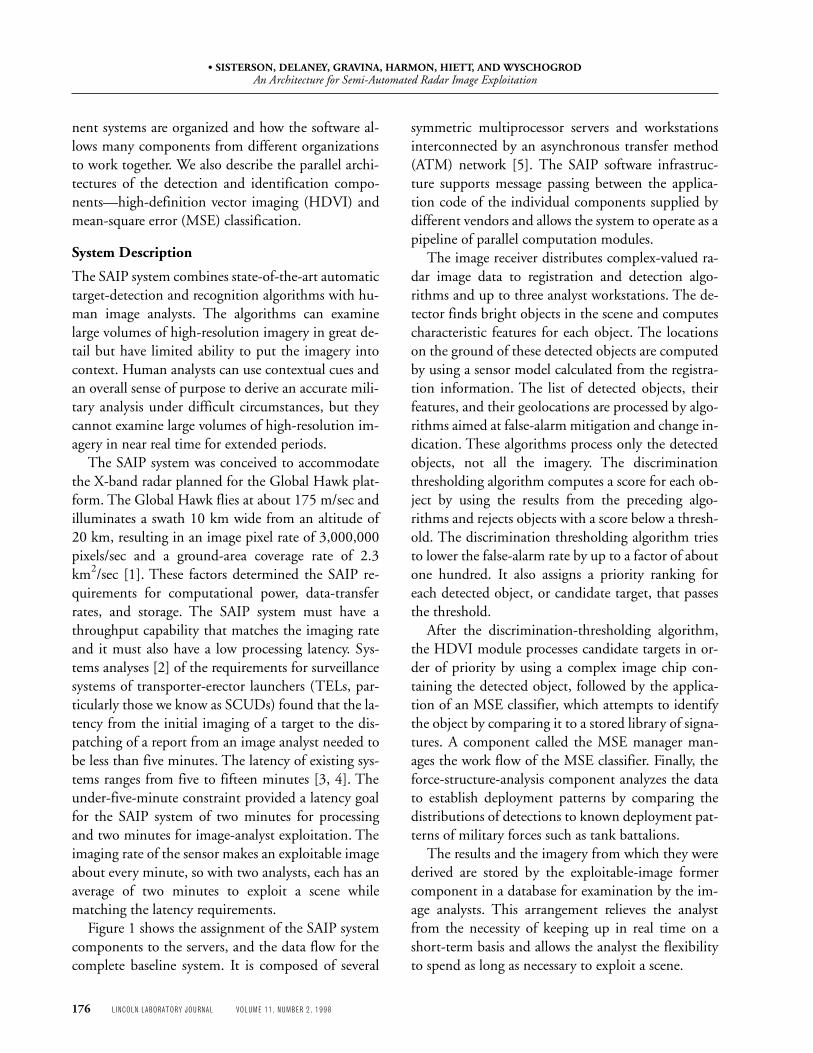
The detection-rate model used for Table 2 assumesa dense target environment in a high-false-alarm re-gion at a detection probability of 90%. The false-alarm rate represents a worst case typified by forestedregions around well-populated areas, and was derivedfrom work with data collected by the Advanced De-
tection Technology sensor developed at LincolnLaboratory [6]. Figure 2 shows how the false-alarmdensity varies widely with location. Several algo-rithms need more than one processor (given the pro-cessor capability in 1997) to achieve the computationrates for handling the incoming image stream.
The image-receiver and detector components eachprocess all imagery in various formats. Therefore, thecommunications data-transfer rate between thesecomponents is the highest in the system, and an 80-MB/sec high-performance parallel interface connectsthe servers used by these components. However, afterthe detection stage, the data-transfer rate between al-gorithms is moderate. While the complete systemcould be run within a single large processing system,the comparatively low interconnect bandwidth arguesfor the much less expensive solution of using severalmultiprocessor servers with a suitable network be-tween them. This choice of architecture is reinforcedby the practical need to have several independent or-ganizations supply software components, some ofwhich already exist for other environments, that willwork together and have clean interfaces for straight-forward integration. Thus the resulting architecture isa pipeline of parallel subsystems; each subsystem hasenough parallelism to keep up with the average pro-cessing rate. The main connection between the serv-ers is a 155-MB/sec ATM network.
FIGURE 2. Area distribution of false alarms. The false-alarmdensity fluctuates widely as data are processed by the sys-tem. The average false-alarm density from the detector is 170false alarms/km2. The distribution has a much larger tailthan an equivalent Poisson distribution. The variation infalse-alarm density leads to a large variation in the process-ing load for those algorithms which depend upon the detec-tion rate.
Table 1. Parameters for EstimatingSAIP Computational Complexity
Parameter Value
Input pixel rate 3,000,000 pixels/sec
Real target density 25/km2
Detection false-alarm rate 110/km2
Area coverage rate 2.3 km2/sec
Target-image chip size 31 pixels
HDVI pixel size 3reduction factor
Average size of 4,000,000 pixelsregion of interest (ROI)
Detected-object message size 500 bytes
Detections processed 20%by HDVI/MSE
Overview-display 12downsample factor
Image-frame interval 3
Number of false alarms/km2
0 200 400 600 800
40
30
20
10
0
Freq
uenc
y False-alarm density distribution(Total false alarms = 43,171)
• SISTERSON, DELANEY, GRAVINA, HARMON, HIETT, AND WYSCHOGRODAn Architecture for Semi-Automated Radar Image Exploitation
VOLUME 11, NUMBER 2, 1998 LINCOLN LABORATORY JOURNAL 179
Table 2. SAIP Computational Complexity and Data-Transfer Rate Estimates
Processing Estimated Driving Required Detection Message Message
Component Computational Factor Processors Output Rate Input Rate Output Rate
Loading (Estimate) (detections/sec) (MB/sec) (MB/sec)
(MFLOPS)
Image receiver 96 Pixel rate 8 NA 24 15
Image server 15 Pixel rate and 1 NA 0.003 8detection rate
Detector 150 Pixel rate 4 311 12 3
Feature extractor 124 Detection rate 3 311 3 0.2
Discrimination 31 Detection rate 1 54 0.2 0.03thresholding
HDVI/MSE 1408 Real-target density 20 54 2 2classifier and false-alarm rate
from discriminationthresholding
Exploitable-image 8 Pixel rate and 1 1 6 0former force-unit density
From the beginning, we realized that a message-passing environment configurable for any combina-tion of single-processor and multiprocessor nodeswould provide flexibility in architecture and perfor-mance and allow independent development of thevarious components. Whether processes are executedon the same node or across a network should be arun-time configuration issue that does not affect theapplication code at all. This idea led to the develop-ment of the message-passing infrastructure compo-nents described in the next section.
Parallelism in Lincoln Laboratory components isachieved by many techniques. The choice of tech-nique depends largely on the transfer rate of the in-coming data. Table 2 shows the data-transfer rate esti-mates for the various processing stages of the SAIPsystem. When the incoming transfer rate is high, asfor the detector stage, we achieve parallelism by logi-cally dividing the image into range subswaths andperforming the computations for each subswath on adifferent processor. Each processor shares thememory in which the image and results are stored to
minimize data exchange between the activities oneach processor.
In contrast, the HDVI/MSE classifier, with lowbandwidth and high computation per object,achieves parallelism by distributing the computationfor each object processed to a separate processor,which can be in a separate server. The amount of timeSAIP spends transferring data to and from theHDVI/MSE module is small compared to the time itspends on computing. Shared memory is used for thereference image data when there is more than oneprocessor in a server and the object data are passed byusing the message-passing infrastructure. By allowingarbitrarily large numbers of servers and processors perserver, this object-level parallelism is more efficient,more flexible, and much simpler to organize than afine-grained parallelism in which individual compu-tations such as scalar products are distributed acrossmultiple processors.
While standards played little formal role in the de-velopment of the SAIP system, we considered the fol-lowing guidelines to be important in controlling the
• SISTERSON, DELANEY, GRAVINA, HARMON, HIETT, AND WYSCHOGRODAn Architecture for Semi-Automated Radar Image Exploitation
180 LINCOLN LABORATORY JOURNAL VOLUME 11, NUMBER 2, 1998
complexity and volume of our work:1. Although ANSI C++ was our preferred stan-
dard, we allowed ANSI C for some algorithmcode, especially legacy code.
2. For data structures and methods, we defined acentralized library to provide common facilitiesto component developers, thereby providing ade facto coding standard. This library was builton the Standard Template Library (STL) [7, 8],which encouraged component developers to usethe STL also.
3. We layered construction to hide communica-tions methods from the application code.
4. We used commercial object-oriented databasesoftware for storing data.
5. We used commercial software for configurationcontrol.Although early in the development phase a deci-
sion was made to use Silicon Graphics, Inc. (SGI)workstations and servers, the Lincoln Laboratorysoftware was written to be ported to alternativeUNIX platforms at modest cost because only genericUNIX operating system functions are used and thecode is ANSI C++ or ANSI C.
The remainder of this article explains the designand implementation of most of the Lincoln Labora-tory components shown in Figure 1. We start withthe infrastructure software that allows the compo-nents to communicate.
Infrastructure Software
The SAIP infrastructure components are the layeredsoftware common to most SAIP software compo-nents. The two major parts of the infrastructure arethe SAIP interprocess communication (IPC) libraryand the SAIP data structures C++ class library, whichboth facilitate communication. A pair of UNIX pro-cesses can communicate by writing to and readingfrom a shared database, or by explicitly passing mes-sages via the SAIP-IPC module.
Such interprocess communication can be definedand controlled on a case-by-case basis for each pair ofcommunicating processes. However, the SAIP systemstandardizes interprocess communications by defin-ing all data objects that can be stored in a database orpassed in a message in a single C++ class library. In
this library, the SAIP system also defines standardmember functions for all objects such as storage allo-cation, message buffer packing and unpacking, andprinting.
The single C++ class library approach has severaladvantages. First, standardization allows us to reviseor reuse old code quickly when process implementa-tions are changed or when new processes are added tothe system. Second, experience gained from imple-menting the communication between one pair ofprocesses readily transfers to the task of implementingthe communications between two other processes.Third, standard methods for data classes speed thedevelopment of application code. Fourth, configura-tion control of class definitions is simplified by cen-tralizing the definitions.
For the purposes of message passing, the SAIP C++class library is layered on a C library for transferringdata buffers between processes. The SAIP C++ classlibrary hides much of the functionality of the IPC li-brary to present application programmers with asimple communications model. In that model, C++objects are passed between processes. An object is sentwith one function call taking the object’s address, asymbolic message type name, and a symbolic destina-tion process name as arguments.
The SAIP-IPC Component
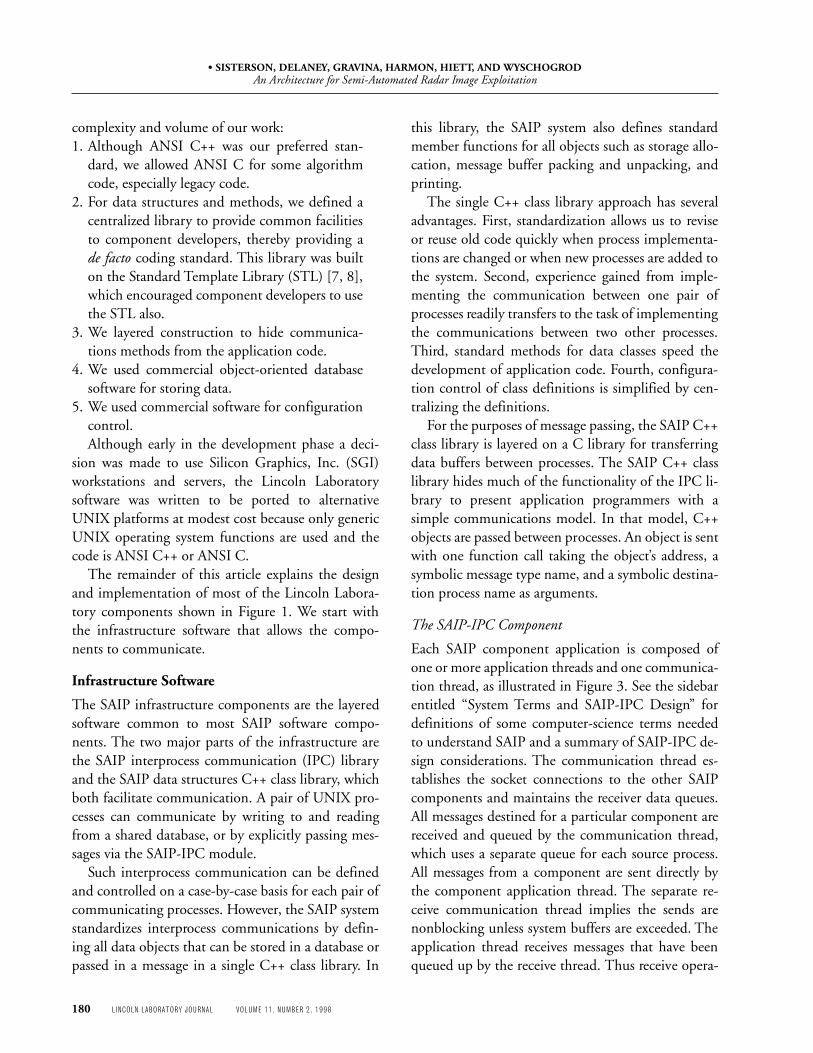
Each SAIP component application is composed ofone or more application threads and one communica-tion thread, as illustrated in Figure 3. See the sidebarentitled “System Terms and SAIP-IPC Design” fordefinitions of some computer-science terms neededto understand SAIP and a summary of SAIP-IPC de-sign considerations. The communication thread es-tablishes the socket connections to the other SAIPcomponents and maintains the receiver data queues.All messages destined for a particular component arereceived and queued by the communication thread,which uses a separate queue for each source process.All messages from a component are sent directly bythe component application thread. The separate re-ceive communication thread implies the sends arenonblocking unless system buffers are exceeded. Theapplication thread receives messages that have beenqueued up by the receive thread. Thus receive opera-
• SISTERSON, DELANEY, GRAVINA, HARMON, HIETT, AND WYSCHOGRODAn Architecture for Semi-Automated Radar Image Exploitation
VOLUME 11, NUMBER 2, 1998 LINCOLN LABORATORY JOURNAL 181
tions are blocking only if there are no new incomingmessages on the queue to be processed.
The communication thread forms a data channel,maintaining application-visible status and message-queue information on the health of the connectionsto other applications. Because queueing occurs at thereceiver, each application can monitor the growth ofits input queue and, if needed, take actions to processdata more rapidly, typically by incomplete processingof each message until the backup is under control.This arrangement allows the application to receivedata continuously until resource limits are exceeded.The sender will therefore block only when the re-ceiver has stopped receiving data and the operatingsystem buffers are filled. Thus the SAIP-IPC effec-tively supports nonblocking sends.
The communication thread uses sockets to imple-
ment the underlying communication mechanism.We chose sockets because they provide a generallyuniform communication interface across almost allUNIX platforms. This design allows the applicationthread to select which inputs it wishes to deal with atany one time without blocking. In addition, it allowsincoming data to be received while the applicationthread is processing previous message inputs.
The SAIP-IPC module is also responsible forlaunching the application components throughoutthe system, which is accomplished by a programlauncher utility. Once launched, each applicationcomponent invokes the initialization phase for theSAIP-IPC. The communication threads for the appli-cations are started and the interconnections betweenthe applications are established. The initialization al-gorithm is distributed across all of the components inthe system that concurrently attempt to establish thesocket connections defined by the applications. TheSAIP-IPC module forms the connections indepen-dently of the detailed execution sequence of the set ofapplications forming the system. As a result the sys-tem launches quickly.
The Data-Structures C++ Class Library
The SAIP C++ class library uses the SAIP-IPC libraryto enqueue objects in each process as they arrive fromother processes. Such enqueuing can occur in parallelwith other computations because the communica-tions thread handles it.
The library’s Message class pulls together the func-tions layered on the SAIP-IPC library plus the globalvariables needed to coordinate them. There are meth-ods to send and receive as well as to enter and exit adispatching loop and the dispatch function. Objectsare dequeued by the application thread by using oneof two methods of the Message class. In the firstmethod, a conventional receive function takes as ar-guments a symbolic message type name, a symbolicsource process name, and a variable for storing the ad-dress of that type object arriving from that process. Ifthere are no objects from that process enqueued whenthe function is called, it blocks until one arrives. Inthe second method, a function causes the thread inwhich it is called to enter a dispatching loop and toremain in the loop until explicitly exited. If there are
FIGURE 3. SAIP interprocess communication (IPC) struc-ture showing the multithreaded nature of the componentcommunication in SAIP. The communications thread formsa message queue for all other components that send a mes-sage to it. The communication thread also establishes thesocket connections to the other SAIP components andmaintains the receiver data queues.
UNIXsockets
Messagequeue
Messagequeue
Send to multiple sockets
Receive from multiple sockets
Applicationcomponent
Applicationthread
UNIXsockets
Communicationthread
• SISTERSON, DELANEY, GRAVINA, HARMON, HIETT, AND WYSCHOGRODAn Architecture for Semi-Automated Radar Image Exploitation
182 LINCOLN LABORATORY JOURNAL VOLUME 11, NUMBER 2, 1998
no objects enqueued when the function is called, thethread blocks until one arrives. If one or more objectsare enqueued, the thread picks one fairly and thencalls a dispatch function. When the dispatch functionreturns, it repeats the above procedure unless the dis-patch function makes an explicit exit call.
The dispatch function’s declaration is part of theSAIP C++ class library, but not its definition. Foreach process, a dispatch function must be suppliedthat is tailored to the purposes of the process. Typi-cally, a dispatch function’s top level is a switch state-ment on the symbolic message type name. The vari-
S Y S T E M T E R M S A N D S A I P - I P C D E S I G N
some computer-science terms used with SAIP andthen we summarize our designconsiderations for the SAIP inter-process communication (IPC).
Thread—A single sequence ofexecution within an application.All SAIP components have at leasttwo threads, one for the main ap-plication and one that SAIP-IPCcreates for receiving data (thecommunication thread).
Blocking—A thread will block,that is, stop executing, when itrequires a resource that is unavail-able. The typical resource thatcauses a thread to block is eitherdata to be read that are unavail-able, or data to be output when theoutput method is unavailable.
Socket—A UNIX mechanismfor point-to-point data commu-nication between two applica-tions. If the applications are on thesame computer, local sockets canbe used. Generally, the applica-tions are on different computersconnected by a network that re-quires communication protocolsto control the data flow.
SAIP-IPC Design
We had two design strategies for
SAIP-IPC—use the emergingstandard message-passing inter-face (MPI) [1] or use UNIX sock-ets within our software. At thestart of this project it was impor-tant to establish a working IPCsystem so that applications couldbe connected to one another assoon as possible.
In 1995, we built a precursorsystem to SAIP called Monitorwith MPI that had been devel-oped by the University of Missis-sippi [2], and supported byArgonne National Laboratory [3].In building Monitor, we uncov-ered several characteristics of MPIthat made it unsuitable for devel-oping a real-time system like SAIP.
First, although the implemen-tation was based on UNIX sock-ets, only network-based socketswere used instead of local socketsbetween processes within thesame multiprocessor system. Thisarrangement meant that all pack-ets sent and received encounteredall the additional overhead of net-work sockets, which is time con-suming, and limited the speed ofmessage transmission through thesystem.
Second, the MPI application
interface assumed that all pro-cesses connect to all other pro-cesses in the system. In a network-based system this assumptionincreases system start-up time.Third, the implementation ofMPI at the time was not thread-safe, so that sending and receivingmessages would delay the applica-tion. Fourth, MPI queued mes-sages at the sender rather than thereceiver, so that a componentcould not know how much workwas in its input queue.
Given these factors, we ulti-mately felt that MPI was not ma-ture enough for our system. In-stead, we decided to implementour socket-based approach to theSAIP-IPC module, paying closeattention to the characteristics weneeded.
References1. Message Passing Interface Forum,
“MPI: A Message-Passing InterfaceStandard,” Int. J. Supercomputer Appl.8 (3/4), 1994.
2. W. Gropp, E. Lusk, and A. Skjellum,Using MPI: Portable Parallel Program-ming with the Message-Passing Interface(MIT Press, Cambridge, Mass.,1994).
3. N. Doss, W. Gropp, E. Lusk, and A.Skjellum, “A Model Implementationof MPI,” Technical Report, ArgonneNational Laboratory, 1993.
• SISTERSON, DELANEY, GRAVINA, HARMON, HIETT, AND WYSCHOGRODAn Architecture for Semi-Automated Radar Image Exploitation
VOLUME 11, NUMBER 2, 1998 LINCOLN LABORATORY JOURNAL 183
ous case clauses in the switch statement handle ob-jects of corresponding types. In this way, the process-ing of each object type becomes modular.
Most commonly, the first dequeuing function iscalled when one process is started to wait for initial-ization information from other processes. After allinitialization is completed, the second dequeuingfunction is called and does not return until the systemis shut down.
Pointer Semantics. Most objects handled by SAIPsoftware components are composed of subobjects.For example, a detection object includes distinctsubobjects holding the results of applying various al-gorithms such as spatial clustering or MSE target clas-sification. The SAIP C++ class library uniformly usespointer semantics to represent such inclusion. That is,an object contains pointers to its subobjects ratherthan explicitly containing those subobjects, and ahighly composed object is the root of a tree of sub-objects, sub-subobjects, and so on.
We found two advantages to designing the librarywith pointer semantics. First, pointer semantics per-mit different instances of the same object type to usedifferent amounts of storage, either by pointing todifferent numbers of subobjects or by pointing tosubobjects that use different amounts of storage. Forexample, detection objects passed between softwarecomponents near the head of the SAIP algorithmchain typically use less storage than those passed be-tween components near the end of the chain becausethe former contain null pointers, whereas the lattercontain pointers to filled-in instances of results fromlater-applied algorithms such as the MSE classifier.Also, imagery objects can contain pointers to arrays ofpixel attributes with contextually determined sizes.
Second, pointer semantics permit a clear indica-tion of which object’s subobjects have been set. If apointer to a particular subobject is null (meaningempty, or zero), then the associated subobject’s com-ponents are not set. When containment semantics areused instead of pointers, either subobjects must con-tain flags to indicate whether their components areset or reserved component values must be used as in-dicators that components are set.
As with most design commitments, there are dis-advantages as well as advantages to handling sub-
object inclusion via pointer semantics. The most ob-vious disadvantage is the level or levels of indirectionintroduced in accessing those fundamental objects(e.g., integers, characters) which are the leaves of theobject-subobject-… trees. It is not, however, the mostsignificant disadvantage, as the following discussionindicates. The data buffers transferred between pro-cesses through the SAIP-IPC library are linear arraysof bytes. But a highly composed object is not a lineararray; it has a number of characteristics for which thelibrary must allow. First, the storage allocated for theobject and its subobjects need not be contiguous; itcould be scattered all over the local heap. Second,some storage holds pointers that are meaningful inthe sending process but not in the receiving process.Third, the C++ compiler or run-time environmentmay insert hidden elements into its representation ofan object (particularly pointers) that are not equiva-lent from one process to the next.
Thus the transferring process must flatten or serial-ize object-subobject-… trees into a linear form thatincludes all leaf object values plus enough structuralinformation for the receiving process to unflatten thetree. The manipulations required for flattening andunflattening take computational time, particularly incopying leaf object values to or from a data buffer andin allocating storage for each subobject, subsubobject,and so on in the receiving process.
Those familiar with pointer semantics may havenoticed something odd in the above discussion. Itmentions only object-subobject-… trees, but pointersemantics allow for graphs of object-object pointers,even cyclic ones. By convention, the SAIP C++ classlibrary restricts the use of pointer semantics in the li-brary to constructing trees with leaf-ward pointersonly. This restriction keeps the flattening and unflat-tening of objects relatively simple. For the informa-tion being communicated between SAIP softwarecomponents, the restriction is not burdensome.
The C++ language allows us to associate functionswith objects and to use the same function name andformal parameter list for a different function, de-pending on the associated object’s type. The SAIPC++ class library uses this capability to provide uni-form calls for functions common in general purposeto all object types but different in implementation
• SISTERSON, DELANEY, GRAVINA, HARMON, HIETT, AND WYSCHOGRODAn Architecture for Semi-Automated Radar Image Exploitation
184 LINCOLN LABORATORY JOURNAL VOLUME 11, NUMBER 2, 1998
details. The generic print function is a good example.Each object type defines a function with that nameand with the same formal parameters. It is used toprint the components of any object of that type and,because objects of different types have different com-ponents, the detailed implementations of the func-tions differ for different object types.
The C++ language does not allow us to similarlyassociate functions with fundamental types. It does,however, allow us to define function templates appli-cable to all types and to define specialized implemen-tations (specializations) for particular types, includingthe fundamental types. The SAIP C++ class libraryuses this capability to provide uniform calls for func-tions that are common in general purpose to all types(not just all object types) but different in implemen-tation detail. Again, the generic print function is agood example. The SAIP C++ class library defines aprint-function template that provides uniform se-mantics for printing any data item. If the data item isan object, invoking the print-function template withthe data item as an argument simply invokes theprint-member function for that object’s type. If thedata item is a fundamental type, the appropriate spe-cialization is invoked.
Such uniformity in commonly used function se-mantics allows us to write code that is readily compre-hended and modified. Of course, the number offunctions we would want applicable to all objects andfundamental types is not large. In the SAIP C++ li-brary, generic functions are supplied for printing,heap and database storage allocation, logical andarithmetic operators, flattening data items into buff-ers and unflattening them out of buffers, and generat-ing unique instances for testing.
Examples of Library Class Members
Most SAIP C++ class library members can be viewedas parts of several hierarchical classes used to composethe top-level objects passed between SAIP softwarecomponents. While distinct at the higher levels of thehierarchy, they run together at lower levels. The high-est levels of the hierarchies typically correspond tomessages passed from one SAIP software componentto another. This section describes some of theseclasses to illustrate principles of their construction.
Frame Class. The Frame class represents chunks ofinput-image data or collections of algorithmic resultsderived from the same chunk of input-image data.While a chunk of input data may correspond to anentire SAR spotlight-mode image or one whole patchof stripmap-mode imagery, nothing in the SAIP C++class library requires such a correspondence. Data areframed for the convenience of the SAIP algorithms,although the framing is not completely arbitrary. TheSAIP C++ class library does require that all the inputimage data associated with a frame be part of oneSAR spotlight-mode image or one sequence of SARstripmap-mode patches. Moreover, all input imagedata or derived results for only one SAR spotlight-mode image or one sequence of SAR stripmap-modepatches must be contained in sequential frames. Sucha collection of frames is called a scene. The Frameclass contains bookkeeping data for the frame, geo-metrical information about the location of the imageand the radar, a pointer to the image array, and apointer to a container class for the detections. Thiscontainer class is an adjustable length vector of point-ers to each detection. The ability to expand the con-tainer at will is convenient in the prescreening andfeature-extraction software component in which de-tections are created and sorted geographically. Theability to shrink the container is convenient in thediscrimination-thresholding component, which dis-cards and sorts detections by discrimination score.
Detection. Detections are formed in the prescreen-ing and feature-extraction software component,which defines each detection by an image locationplus a number of characteristics that are used to ini-tialize an instance of the Detection class. Later compo-nents in the algorithm chain translate the image loca-tion to the ground plane and add additionalcharacteristics. In this way, the results of most SAIPalgorithms are organized by detection. As mentionedabove, detections are grouped by frame and carrieddown the algorithm chain by using Frame class in-stances as messages.
Exploitation-Related Classes. Two classes are usednear the end of the algorithm chain to create datastructures that help manage exploitation. The Unitclass represents collections of detections presumed tobe elements of a single military unit. Instances thereof
• SISTERSON, DELANEY, GRAVINA, HARMON, HIETT, AND WYSCHOGRODAn Architecture for Semi-Automated Radar Image Exploitation
VOLUME 11, NUMBER 2, 1998 LINCOLN LABORATORY JOURNAL 185
are created by the force-structure-analysis softwarecomponent. The region of interest (ROI) is repre-sented by the ROI class, which consists of associatedcollections of detections with local imagery and otherdisplay-oriented information added. Instances of thisROI class are partially created by the force-structure-analysis component and are completed by the exploit-able-image former.
Each Unit class instance indicates which detectionscompose the unit and which detections bind the unit(i.e., form the vertices of the unit’s ground-plane con-vex hull). Units and ROIs are closely related. In fact,it is the presence of a unit that makes a region of im-agery interesting. In that sense, each ROI contains aunit plus the imagery in which the unit was recog-nized. To support the efficient display of old and newimagery for an ROI, each ROI also indicates whichold ROIs overlap significantly.
Algorithm Components
This section describes two of the Lincoln LaboratorySAIP components and focuses on how sufficientthroughput is achieved, how data should be orga-nized, and how the algorithm is organized for parallelcomputation.
Detection and Feature Extraction
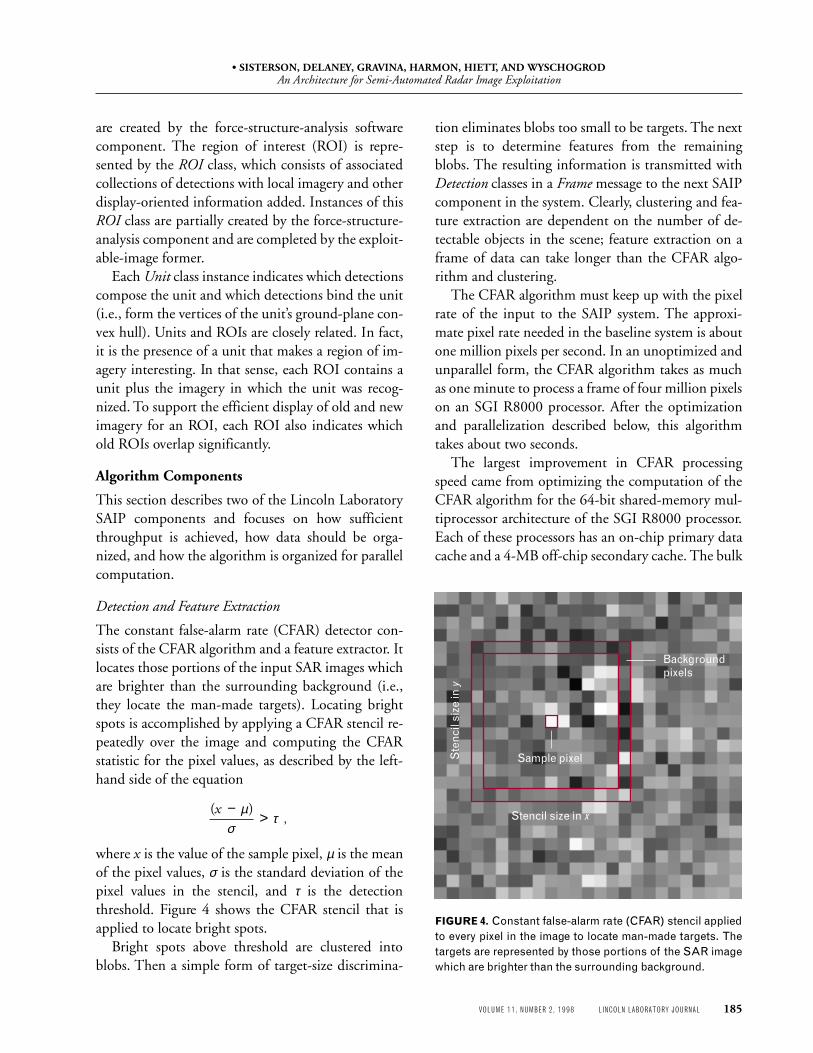
The constant false-alarm rate (CFAR) detector con-sists of the CFAR algorithm and a feature extractor. Itlocates those portions of the input SAR images whichare brighter than the surrounding background (i.e.,they locate the man-made targets). Locating brightspots is accomplished by applying a CFAR stencil re-peatedly over the image and computing the CFARstatistic for the pixel values, as described by the left-hand side of the equation
( ),
x − >µσ
τ
where x is the value of the sample pixel, µ is the meanof the pixel values, σ is the standard deviation of thepixel values in the stencil, and τ is the detectionthreshold. Figure 4 shows the CFAR stencil that isapplied to locate bright spots.
Bright spots above threshold are clustered intoblobs. Then a simple form of target-size discrimina-
tion eliminates blobs too small to be targets. The nextstep is to determine features from the remainingblobs. The resulting information is transmitted withDetection classes in a Frame message to the next SAIPcomponent in the system. Clearly, clustering and fea-ture extraction are dependent on the number of de-tectable objects in the scene; feature extraction on aframe of data can take longer than the CFAR algo-rithm and clustering.
The CFAR algorithm must keep up with the pixelrate of the input to the SAIP system. The approxi-mate pixel rate needed in the baseline system is aboutone million pixels per second. In an unoptimized andunparallel form, the CFAR algorithm takes as muchas one minute to process a frame of four million pixelson an SGI R8000 processor. After the optimizationand parallelization described below, this algorithmtakes about two seconds.
The largest improvement in CFAR processingspeed came from optimizing the computation of theCFAR algorithm for the 64-bit shared-memory mul-tiprocessor architecture of the SGI R8000 processor.Each of these processors has an on-chip primary datacache and a 4-MB off-chip secondary cache. The bulk
FIGURE 4. Constant false-alarm rate (CFAR) stencil appliedto every pixel in the image to locate man-made targets. Thetargets are represented by those portions of the SAR imagewhich are brighter than the surrounding background.
Backgroundpixels
Sample pixel
Stencil size in x
Ste
ncil
size
in y
• SISTERSON, DELANEY, GRAVINA, HARMON, HIETT, AND WYSCHOGRODAn Architecture for Semi-Automated Radar Image Exploitation
186 LINCOLN LABORATORY JOURNAL VOLUME 11, NUMBER 2, 1998
dynamic RAM (where most of the memory is lo-cated) is accessed off the processor boards via a 1-GB/sec backplane on four-way interleaved memoryboards. Data must first be fetched from the bulkDRAM into the secondary cache, then read into theon-chip primary cache. Finally, the processor ma-nipulates the data within its internal registers. All ofthese transfers are handled automatically by the cachecontrol units. We access the memory space sequen-tially in an orderly fashion to optimize data flowwithin the memory subsystem, to allow the cachecontrol units to prefetch data from DRAM in bursts,and to minimize cache flushing. In the context of
handling images, we call this type of memory accessrasterization.
Thus to optimize CFAR, we rasterize the data ac-cesses and keep the repeated memory accesses as closein proximity as possible. To do so, we must changethe image scan pattern for the CFAR stencil. Firstnote that the standard deviation σ is expressed by
σ µ µ2 2 2 2= − = −E x E x[ ] [ ] .
In the original relation
( ),
x − >µσ
τ
we note that σ is costly to compute because a square-root operation is expensive in terms of cycle count.Therefore, we rewrite the relation as follows:
( ).
x − >µ
στ
2
22
This expression removes the square-root operationuntil the very end and can in fact be eliminated aslong as the correct sign information is preserved (be-cause there can be negative CFAR statistic values). Itbrings all the operations back to just multiplication,addition, and a single expensive division. When de-tecting bright pixels, we can avoid the division alto-gether. However, forming the CFAR image chips forthe feature extractor requires the division. We canminimize the computation by not performing the di-vision until the CFAR image chip is actually formed.The final relation is then given by
( )
( [ ] ).
x
E x
−
−>µ
µτ
2
2 22
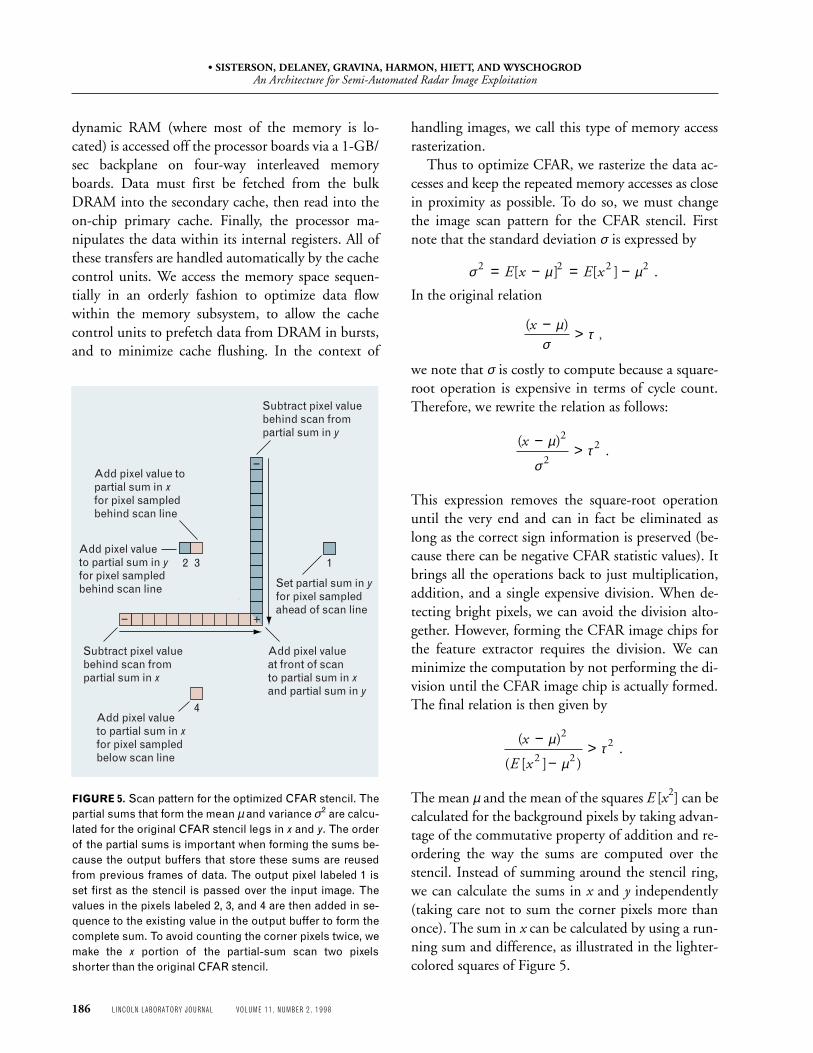
The mean µ and the mean of the squares E [x2] can becalculated for the background pixels by taking advan-tage of the commutative property of addition and re-ordering the way the sums are computed over thestencil. Instead of summing around the stencil ring,we can calculate the sums in x and y independently(taking care not to sum the corner pixels more thanonce). The sum in x can be calculated by using a run-ning sum and difference, as illustrated in the lighter-colored squares of Figure 5.
FIGURE 5. Scan pattern for the optimized CFAR stencil. Thepartial sums that form the mean µ and variance σ2 are calcu-lated for the original CFAR stencil legs in x and y. The orderof the partial sums is important when forming the sums be-cause the output buffers that store these sums are reusedfrom previous frames of data. The output pixel labeled 1 isset first as the stencil is passed over the input image. Thevalues in the pixels labeled 2, 3, and 4 are then added in se-quence to the existing value in the output buffer to form thecomplete sum. To avoid counting the corner pixels twice, wemake the x portion of the partial-sum scan two pixelsshorter than the original CFAR stencil.
–
–
+
2 3
Add pixel value topartial sum in xfor pixel sampledbehind scan line
Add pixel valueto partial sum in xfor pixel sampledbelow scan line
Set partial sum in yfor pixel sampledahead of scan line
Add pixel valueto partial sum in yfor pixel sampledbehind scan line
Subtract pixel valuebehind scan frompartial sum in x
Add pixel valueat front of scanto partial sum in xand partial sum in y
Subtract pixel valuebehind scan frompartial sum in y
4
1
• SISTERSON, DELANEY, GRAVINA, HARMON, HIETT, AND WYSCHOGRODAn Architecture for Semi-Automated Radar Image Exploitation
VOLUME 11, NUMBER 2, 1998 LINCOLN LABORATORY JOURNAL 187
A similar scan pattern can be applied for the partialsums in y ; however, there is no advantage to scanningthe y-direction the same way as the x-direction be-cause that would not result in a continuous sequentialaccess of the memory space. Instead, partial sums forthe y legs of the stencil are maintained as in Figure 5.
Note that in this revised scan pattern, partial sumsfrom each leg of the CFAR stencil are generated in thenumbered sequence from 1 to 4 in Figure 5. Whenwe deal with a single processor on a single image thisorder of sums is relatively unimportant. When wedeal with adjacent search frames and a multiple pro-cessor application of the CFAR algorithm this orderbecomes important.
In addition to changing the CFAR scan pattern forthe revised CFAR stencil, we can operate in parallelon a number of computers to optimize CFAR pro-cessing. The goals of parallel operation are to keep upwith the overall data rate and to minimize the framelatency, which delays the entire system. We foundthat having multiple processors each process a por-tion of the incoming frame simultaneously is the bestway to make the CFAR algorithm parallel. This ap-
proach is also used to cluster the bright spots.The frames are divided along the range axis. The
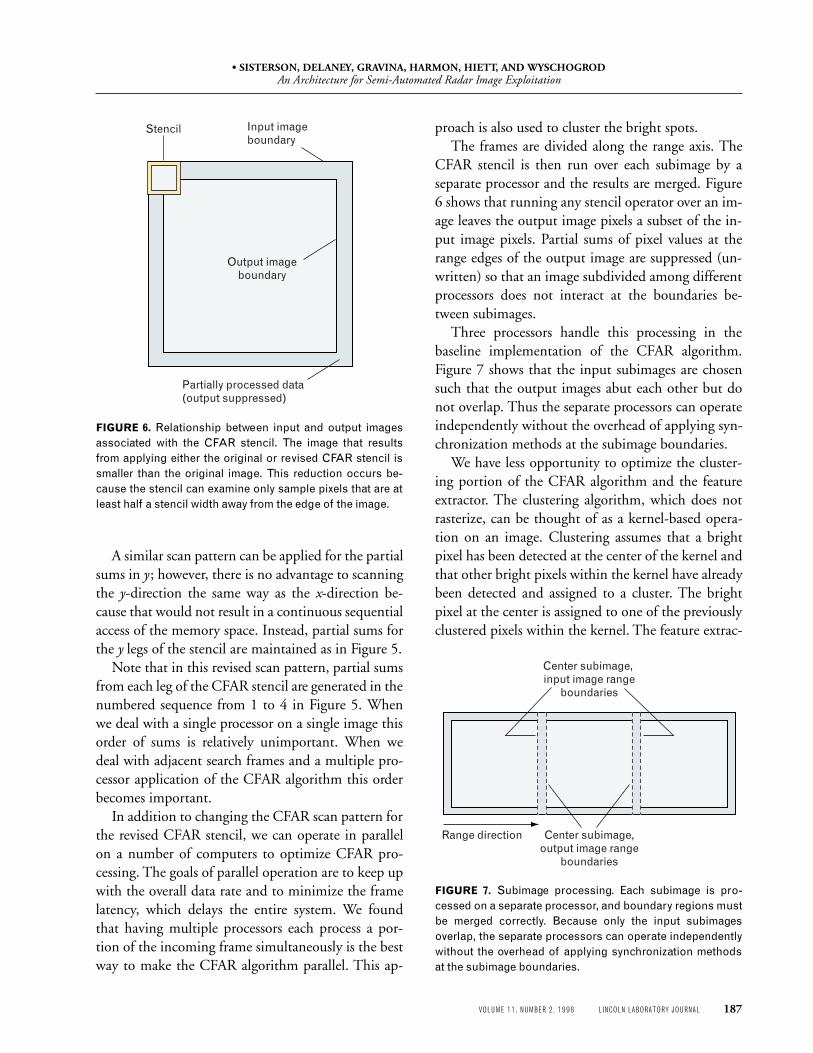
CFAR stencil is then run over each subimage by aseparate processor and the results are merged. Figure6 shows that running any stencil operator over an im-age leaves the output image pixels a subset of the in-put image pixels. Partial sums of pixel values at therange edges of the output image are suppressed (un-written) so that an image subdivided among differentprocessors does not interact at the boundaries be-tween subimages.
Three processors handle this processing in thebaseline implementation of the CFAR algorithm.Figure 7 shows that the input subimages are chosensuch that the output images abut each other but donot overlap. Thus the separate processors can operateindependently without the overhead of applying syn-chronization methods at the subimage boundaries.
We have less opportunity to optimize the cluster-ing portion of the CFAR algorithm and the featureextractor. The clustering algorithm, which does notrasterize, can be thought of as a kernel-based opera-tion on an image. Clustering assumes that a brightpixel has been detected at the center of the kernel andthat other bright pixels within the kernel have alreadybeen detected and assigned to a cluster. The brightpixel at the center is assigned to one of the previouslyclustered pixels within the kernel. The feature extrac-
FIGURE 6. Relationship between input and output imagesassociated with the CFAR stencil. The image that resultsfrom applying either the original or revised CFAR stencil issmaller than the original image. This reduction occurs be-cause the stencil can examine only sample pixels that are atleast half a stencil width away from the edge of the image.
FIGURE 7. Subimage processing. Each subimage is pro-cessed on a separate processor, and boundary regions mustbe merged correctly. Because only the input subimagesoverlap, the separate processors can operate independentlywithout the overhead of applying synchronization methodsat the subimage boundaries.
Center subimage, input image range
boundaries
Center subimage,output image range
boundaries
Range direction
Output imageboundary
Partially processed data(output suppressed)
Input imageboundary
Stencil
• SISTERSON, DELANEY, GRAVINA, HARMON, HIETT, AND WYSCHOGRODAn Architecture for Semi-Automated Radar Image Exploitation
188 LINCOLN LABORATORY JOURNAL VOLUME 11, NUMBER 2, 1998
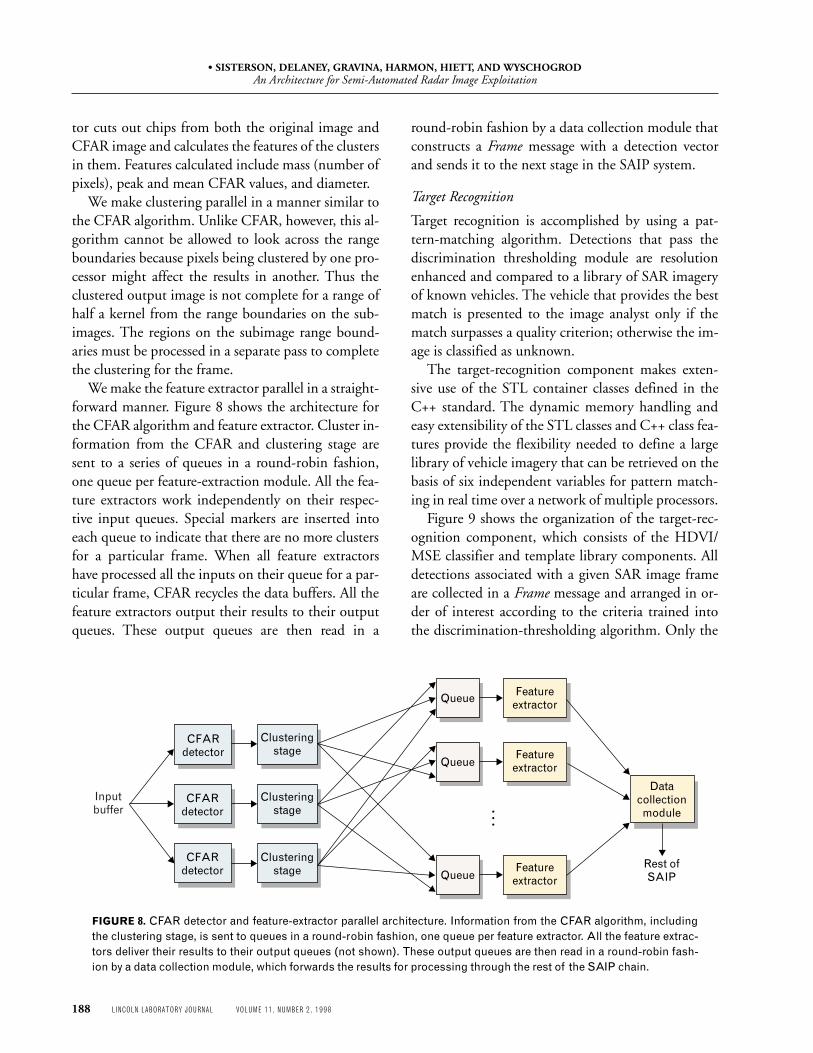
FIGURE 8. CFAR detector and feature-extractor parallel architecture. Information from the CFAR algorithm, includingthe clustering stage, is sent to queues in a round-robin fashion, one queue per feature extractor. All the feature extrac-tors deliver their results to their output queues (not shown). These output queues are then read in a round-robin fash-ion by a data collection module, which forwards the results for processing through the rest of the SAIP chain.
tor cuts out chips from both the original image andCFAR image and calculates the features of the clustersin them. Features calculated include mass (number ofpixels), peak and mean CFAR values, and diameter.
We make clustering parallel in a manner similar tothe CFAR algorithm. Unlike CFAR, however, this al-gorithm cannot be allowed to look across the rangeboundaries because pixels being clustered by one pro-cessor might affect the results in another. Thus theclustered output image is not complete for a range ofhalf a kernel from the range boundaries on the sub-images. The regions on the subimage range bound-aries must be processed in a separate pass to completethe clustering for the frame.
We make the feature extractor parallel in a straight-forward manner. Figure 8 shows the architecture forthe CFAR algorithm and feature extractor. Cluster in-formation from the CFAR and clustering stage aresent to a series of queues in a round-robin fashion,one queue per feature-extraction module. All the fea-ture extractors work independently on their respec-tive input queues. Special markers are inserted intoeach queue to indicate that there are no more clustersfor a particular frame. When all feature extractorshave processed all the inputs on their queue for a par-ticular frame, CFAR recycles the data buffers. All thefeature extractors output their results to their outputqueues. These output queues are then read in a
round-robin fashion by a data collection module thatconstructs a Frame message with a detection vectorand sends it to the next stage in the SAIP system.
Target Recognition
Target recognition is accomplished by using a pat-tern-matching algorithm. Detections that pass thediscrimination thresholding module are resolutionenhanced and compared to a library of SAR imageryof known vehicles. The vehicle that provides the bestmatch is presented to the image analyst only if thematch surpasses a quality criterion; otherwise the im-age is classified as unknown.
The target-recognition component makes exten-sive use of the STL container classes defined in theC++ standard. The dynamic memory handling andeasy extensibility of the STL classes and C++ class fea-tures provide the flexibility needed to define a largelibrary of vehicle imagery that can be retrieved on thebasis of six independent variables for pattern match-ing in real time over a network of multiple processors.
Figure 9 shows the organization of the target-rec-ognition component, which consists of the HDVI/MSE classifier and template library components. Alldetections associated with a given SAR image frameare collected in a Frame message and arranged in or-der of interest according to the criteria trained intothe discrimination-thresholding algorithm. Only the
Clusteringstage
Queue
Datacollection
module
Rest ofSAIP
CFARdetector
CFARdetector
CFARdetector
Inputbuffer
Featureextractor
Clusteringstage
Clusteringstage
Queue
Queue
Featureextractor
Featureextractor

• SISTERSON, DELANEY, GRAVINA, HARMON, HIETT, AND WYSCHOGRODAn Architecture for Semi-Automated Radar Image Exploitation
VOLUME 11, NUMBER 2, 1998 LINCOLN LABORATORY JOURNAL 189
FIGURE 9. HDVI/MSE classifier algorithm consisting of HDVI/MSE threads and template library compo-nents. All detections associated with a given SAR image frame are collected in a Frame message and ar-ranged in order of interest by the discrimination thresholding module. The MSE manager receives thesemessages and keeps track of processors, frames, and detections, and an arbitrary number of candidate pro-cesses. Each candidate process can contain an arbitrary number of threads and has its own copy of the tem-plate library. All detections, whether processed or not, are assembled into the Frame message and passedon to the force-structure-analysis module, which determines military force structures.
most interesting detections will be processed whentime does not allow processing of all detections.
The results of the MSE classifier are placed in thedetection class along with a resolution-enhanced im-age of the detection. All detections, whether pro-cessed or not, are assembled into the Frame messageand passed on to the force-structure-analysis module.
The number of detections per frame that will passdiscrimination thresholding and be processed withinthe time allotted to the classifier are not known untilrun time. Since it is also not known whether a par-ticular detection will be processed, the Frame messageis kept small by not storing the detection imagerywithin the frame. Thus an additional interface re-
quirement of the classifier is that it must request de-tection imagery from an image server when necessary.
The fundamental task of the classifier algorithm isto find the vehicle template that, when comparedwith the detection, gives the lowest MSE [9]. Theperformance of this algorithm is improved by usingthe HDVI algorithm for resolution enhancement. Inthe SAIP baseline system the HDVI image of the de-tection and the templates are oversampled by a factorof three and compared to the original image. This ar-rangement results in nine times as many computa-tions for a given template comparison, due to the in-creased number of pixels per image.
As a result, the HDVI/MSE classifier is two-stage
Candidate 2
. . .
Sharedarray HDI –> MSECandidate 1
. . .
Sharedarray HDI –> MSEMSE manager
Fra
me
mes
sage
Fra
me
mes
sage
Discriminationthresholding
Image server
Force-structureanalysis
Newest frame
Candidate start
Candidate finish
Candidate 0
Oldest frame
. . .
Sharedarray
HDVI/MSEthread
HDVI/MSEthread
HDVI/MSEthread
Templatelibrary
Templatelibrary
Templatelibrary
• SISTERSON, DELANEY, GRAVINA, HARMON, HIETT, AND WYSCHOGRODAn Architecture for Semi-Automated Radar Image Exploitation
190 LINCOLN LABORATORY JOURNAL VOLUME 11, NUMBER 2, 1998
multiresolution to reduce computation. In the firststage the classifier is run over the entire space of pos-sible template matches at the unenhanced image reso-lution. The results of this classification are the startingpoint for classification with the HDVI enhanced im-agery and templates. The second-stage search space isreduced to a volume around the answer found in thefirst stage, which significantly reduces the computa-tion needed compared to searching the whole spacewith enhanced imagery.
The MSE classifier, which is designed to use anyallocated hardware, works in parallel on any numberof processors distributed on any number of net-worked servers. The various servers used do not evenneed to be running the same operating system.
Because the classification of each detection is inde-pendent of the other detections, each detection is as-signed to an independent process. This level of algo-rithm segmentation results in efficient use of theprocessors: the number of detections available forprocessing will in general be larger than the numberof processors available.
Two components in a dispatcher/worker modelimplement the classifier algorithm. The dispatchermodule, called the MSE manager, handles the com-munications with other SAIP components shown inFigure 9, and a worker module candidate acceptswork from the MSE manager and dispatches it a de-tection at a time to individual processing threads.Each candidate can run on a separate server with itsown copy of the templates.
The MSE manager is a single threaded modulethat receives the frame of detections and distributesthem to the candidate processes. As the processed de-tections are returned to the MSE manager, it placesthe results in the appropriate frame and sends theframes off to the force-structure-analysis module inthe order in which they were received. The MSEmanager keeps track of three main categories: proces-sors available for classifying detections, frames fromwhich detections are retrieved and stored, and detec-tions that have been sent off for processing.
The MSE manager has no a priori knowledge ofwhat process handles detections. When a processwants to work on detections it sends a candidateDonemessage to the MSE manager with no results in it.
The MSE manager adds the detection process to itslist. When the MSE manager receives a completed de-tection (a candidateDone message) the process thatsent the message is available for processing anotherdetection. The MSE manager then adds the processto its list of available processes. This technique makesit easy to add detection processes.
Because the candidate processes can be multi-threaded, many instances of a candidate process canexist in the available processes list. To handle this dy-namic data the STL class multiset stores the availableprocesses. When a detection is sent off for processing,the process to which it is sent is removed from theavailable processes list. When the processed detectionis received, its process becomes available again on theMSE manager list. This scheme allows a variety ofprocessor configurations. If one of the detection pro-cesses should fail, then that process would simply notreturn its results, and all the other processes would beunaffected.
A FrameAccount class keeps track of each Framemessage encountered to free the candidate processesof any order or time constraint, to minimize codecomplexity, and to allow for maximum flexibility inallocating CPU resources. The bookkeeping of thedetections for a particular frame is done with the twoSTL set classes: notSent and notDone. When a frame isfirst encountered, an index for each detection to beprocessed is placed in both the notDone and notSentset. The notSent list is the place from which the MSEmanager picks detections to send. When a detectionis sent, its index is removed from this list. If acandidateDone message is received, its index is re-moved from the notDone list. If the notDone list isempty, then the frame is sent off to the force-struc-ture-analysis module.
The MSE manager queues the incoming frames sothat new frames can be received while older framesare being processed. The frames must be sent off inthe order they are received for the benefit of otherSAIP modules that depend on this order. No limit isplaced on the number of frames that can be in thequeue. The STL list class is used to keep track of theframes. The classifier algorithm is designed to processas many detections as possible within a fixed amountof time and to pass on the results even if all of the de-
• SISTERSON, DELANEY, GRAVINA, HARMON, HIETT, AND WYSCHOGRODAn Architecture for Semi-Automated Radar Image Exploitation
VOLUME 11, NUMBER 2, 1998 LINCOLN LABORATORY JOURNAL 191
The classifier makes no assumptions about the scopeof the templates; it determines which templates existby reading the library. This determination allows forefficient disk usage and maximum flexibility in main-taining the library.
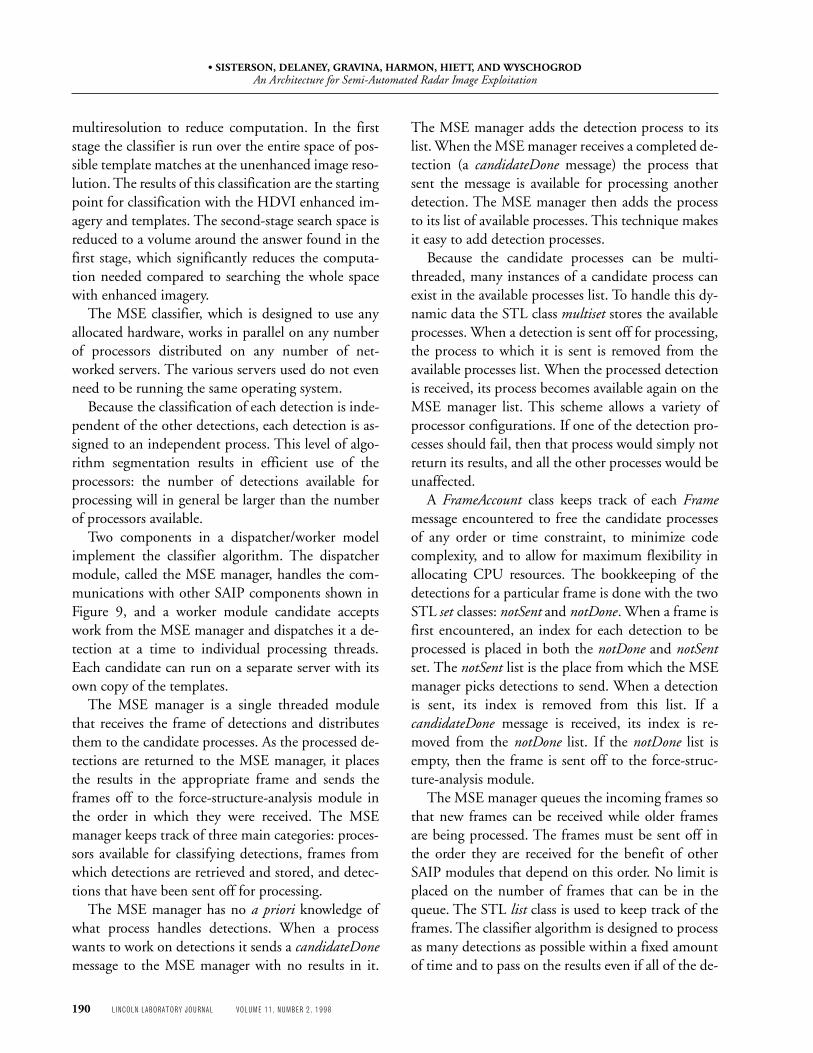
Table 3 also indicates that the total library plannedfor SAIP will have 349,920 templates (9 × 3 × 3 × 2 ×30 × 72). At approximately 6 kB/template, the tem-plates represent over 2 GB of data. This amount doesnot present a disk storage problem, but it can exceedthe amount of memory dedicated to the classifier.Consequently, we adopted the strategy of reading inonly templates that have a possibility of being used.Of the templates read, we group them in memory byaspect angle and class type so that all of the templatesused in a particular search reside in the same region ofmemory. Thus even if the in-memory template li-brary is larger then the physical memory available, thememory region in use for any particular frame will besmall enough to avoid reading templates in fromswap space.
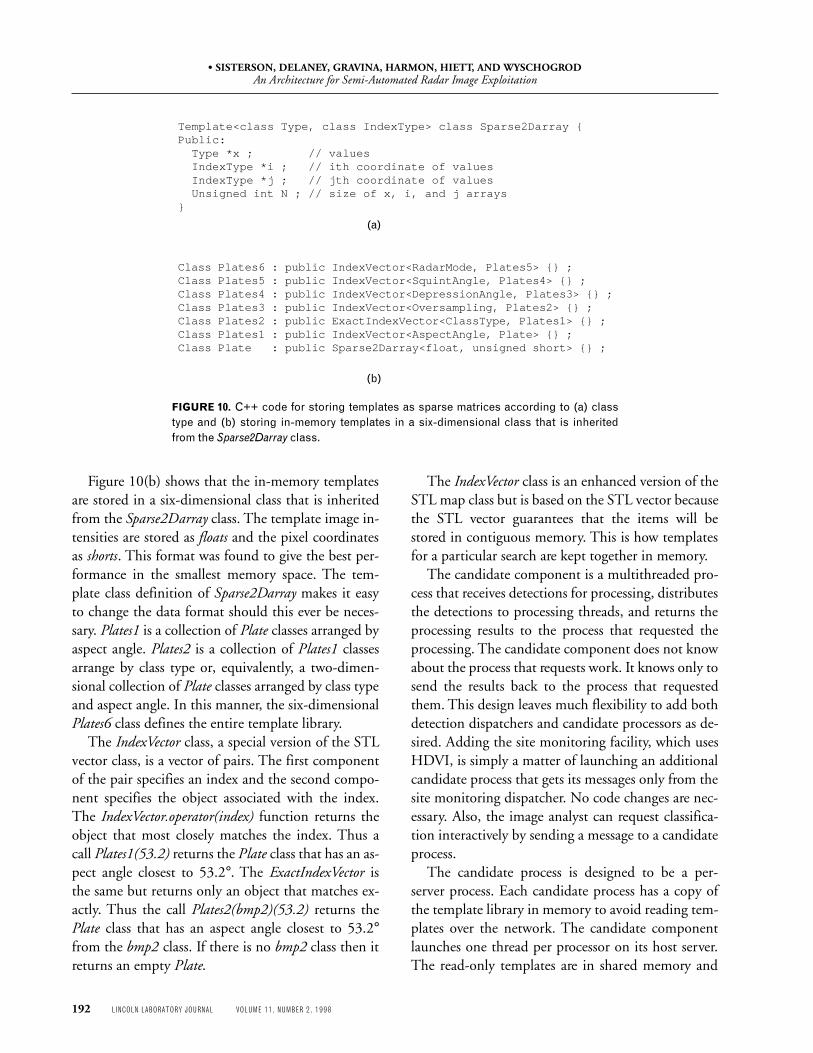
Figure 10(a) shows that templates are stored assparse matrices. The imagery is stored in array x ; thecoordinates of the pixel values are stored in arrays iand j. The sparse matrix storage is a fast way to do thecomparison of the template with the detection imagewhile excluding non-vehicle clutter pixels that do notcontain any information about the vehicle. Other-wise, a clutter mask would need to be stored with thetemplate and a test done on every template pixel be-fore comparing that pixel to the detection image.
tections have not been processed. This feature is es-sential in a real-time system with a greatly varyingprocessing load to prevent the backup of data duringtimes of high detection density. Two parameters limitthe number of detections that get processed. One pa-rameter limits the number of detections to be placedinto the notSent and notDone lists; another parameterspecifies the maximum number of seconds a frame isheld for processing.
Template Library
A key design issue for the MSE classifier was the useand storage of the templates. Individual templatesmust be easily retrieved by the software and the per-sonnel maintaining the template library. In addition,the template library must grow and evolve as newtemplates are collected. Table 3 lists the six indepen-dent parameters that uniquely distinguish one tem-plate from another.
The template parameters used to distinguish thetemplate—radar mode, squint angle, and depressionangle—are compared to the respective values of theframe of detections being processed. Those templateswhich give the best match are used as the set tosearch. The parameter oversampling divides the tem-plates into first-stage and second-stage templates.Two other parameters—class type and aspect angle—define the search space. The result of the search willbe the class type and aspect angle that best matchesthe detection.
Because each template is described in a six-dimen-sional space, both disk and memory storage use a six-dimensional storage system. In both storage schemeseach template is independently specified with all sixdimensions.
The UNIX file system is used to create a six-di-mensional database of template files. The templatesare stored in a file path in which the parameter valuesare the directory names. Thus all of the templates forradar mode Globalhawk_spot with a squint angle of7.3° are in the directory Globalhawk_spot/7.3/. Table3 shows the order of the parameter directories. At thebottom of the directory tree is the actual template filewhose name is the aspect angle of the template.
This system allows easy insertion and removal ofthe templates with standard UNIX file system tools.
Table 3. Template Parameterization Space
Parameter Number of expected values
(determined by data, not software)
Radar mode 9
Squint angle 3
Depression angle 3
Oversampling 2
Class type 30
Aspect angle 72
• SISTERSON, DELANEY, GRAVINA, HARMON, HIETT, AND WYSCHOGRODAn Architecture for Semi-Automated Radar Image Exploitation
192 LINCOLN LABORATORY JOURNAL VOLUME 11, NUMBER 2, 1998
Figure 10(b) shows that the in-memory templatesare stored in a six-dimensional class that is inheritedfrom the Sparse2Darray class. The template image in-tensities are stored as floats and the pixel coordinatesas shorts. This format was found to give the best per-formance in the smallest memory space. The tem-plate class definition of Sparse2Darray makes it easyto change the data format should this ever be neces-sary. Plates1 is a collection of Plate classes arranged byaspect angle. Plates2 is a collection of Plates1 classesarrange by class type or, equivalently, a two-dimen-sional collection of Plate classes arranged by class typeand aspect angle. In this manner, the six-dimensionalPlates6 class defines the entire template library.
The IndexVector class, a special version of the STLvector class, is a vector of pairs. The first componentof the pair specifies an index and the second compo-nent specifies the object associated with the index.The IndexVector.operator(index) function returns theobject that most closely matches the index. Thus acall Plates1(53.2) returns the Plate class that has an as-pect angle closest to 53.2°. The ExactIndexVector isthe same but returns only an object that matches ex-actly. Thus the call Plates2(bmp2)(53.2) returns thePlate class that has an aspect angle closest to 53.2°from the bmp2 class. If there is no bmp2 class then itreturns an empty Plate.
The IndexVector class is an enhanced version of theSTL map class but is based on the STL vector becausethe STL vector guarantees that the items will bestored in contiguous memory. This is how templatesfor a particular search are kept together in memory.
The candidate component is a multithreaded pro-cess that receives detections for processing, distributesthe detections to processing threads, and returns theprocessing results to the process that requested theprocessing. The candidate component does not knowabout the process that requests work. It knows only tosend the results back to the process that requestedthem. This design leaves much flexibility to add bothdetection dispatchers and candidate processors as de-sired. Adding the site monitoring facility, which usesHDVI, is simply a matter of launching an additionalcandidate process that gets its messages only from thesite monitoring dispatcher. No code changes are nec-essary. Also, the image analyst can request classifica-tion interactively by sending a message to a candidateprocess.
The candidate process is designed to be a per-server process. Each candidate process has a copy ofthe template library in memory to avoid reading tem-plates over the network. The candidate componentlaunches one thread per processor on its host server.The read-only templates are in shared memory and
FIGURE 10. C++ code for storing templates as sparse matrices according to (a) classtype and (b) storing in-memory templates in a six-dimensional class that is inheritedfrom the Sparse2Darray class.
Template<class Type, class IndexType> class Sparse2Darray {Public: Type *x ; // values IndexType *i ; // ith coordinate of values IndexType *j ; // jth coordinate of values Unsigned int N ; // size of x, i, and j arrays}
Class Plates6 : public IndexVector<RadarMode, Plates5> {} ;Class Plates5 : public IndexVector<SquintAngle, Plates4> {} ;Class Plates4 : public IndexVector<DepressionAngle, Plates3> {} ;Class Plates3 : public IndexVector<Oversampling, Plates2> {} ;Class Plates2 : public ExactIndexVector<ClassType, Plates1> {} ;Class Plates1 : public IndexVector<AspectAngle, Plate> {} ;Class Plate : public Sparse2Darray<float, unsigned short> {} ;
(b)
(a)
• SISTERSON, DELANEY, GRAVINA, HARMON, HIETT, AND WYSCHOGRODAn Architecture for Semi-Automated Radar Image Exploitation
VOLUME 11, NUMBER 2, 1998 LINCOLN LABORATORY JOURNAL 193
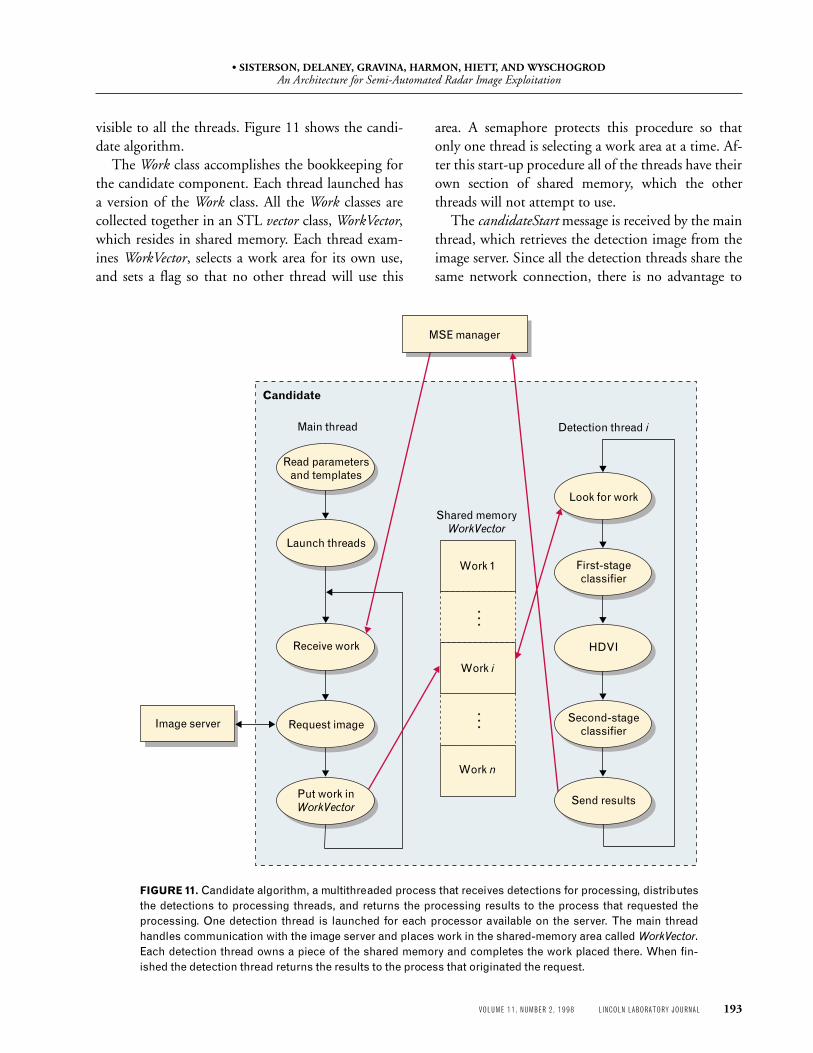
visible to all the threads. Figure 11 shows the candi-date algorithm.
The Work class accomplishes the bookkeeping forthe candidate component. Each thread launched hasa version of the Work class. All the Work classes arecollected together in an STL vector class, WorkVector,which resides in shared memory. Each thread exam-ines WorkVector, selects a work area for its own use,and sets a flag so that no other thread will use this
area. A semaphore protects this procedure so thatonly one thread is selecting a work area at a time. Af-ter this start-up procedure all of the threads have theirown section of shared memory, which the otherthreads will not attempt to use.
The candidateStart message is received by the mainthread, which retrieves the detection image from theimage server. Since all the detection threads share thesame network connection, there is no advantage to
FIGURE 11. Candidate algorithm, a multithreaded process that receives detections for processing, distributesthe detections to processing threads, and returns the processing results to the process that requested theprocessing. One detection thread is launched for each processor available on the server. The main threadhandles communication with the image server and places work in the shared-memory area called WorkVector.Each detection thread owns a piece of the shared memory and completes the work placed there. When fin-ished the detection thread returns the results to the process that originated the request.
Main thread
Look for work
Shared memoryWorkVector
Work n
Work 1
Work i
Image server
Candidate
Detection thread i
MSE manager
Read parametersand templates
Launch threads
Receive work
First-stageclassifier
HDVI
Second-stageclassifier
Send results
Request image
Put work inWorkVector
• SISTERSON, DELANEY, GRAVINA, HARMON, HIETT, AND WYSCHOGRODAn Architecture for Semi-Automated Radar Image Exploitation
194 LINCOLN LABORATORY JOURNAL VOLUME 11, NUMBER 2, 1998
having the individual detection threads request theimagery. The main thread decides which Work to putthe candidateStart class in by looking for a Work thatis idle.
The rest of the processing is up to the individualdetection threads. They continually monitor theirWork class until they find new work pending. Thenew work starts the cascade of processing that eventu-ally fills out the fields in the candidateDone class.Once completed the thread sends the candidateDonemessage back to the process that originated thecandidateStart message.
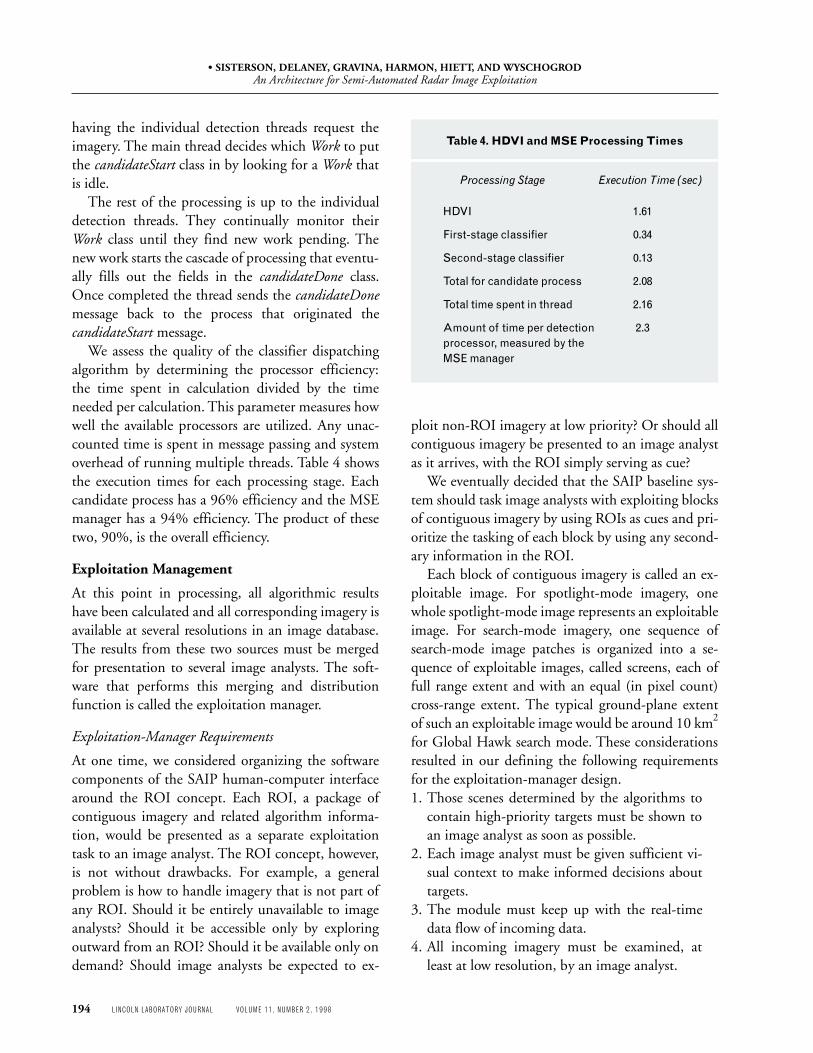
We assess the quality of the classifier dispatchingalgorithm by determining the processor efficiency:the time spent in calculation divided by the timeneeded per calculation. This parameter measures howwell the available processors are utilized. Any unac-counted time is spent in message passing and systemoverhead of running multiple threads. Table 4 showsthe execution times for each processing stage. Eachcandidate process has a 96% efficiency and the MSEmanager has a 94% efficiency. The product of thesetwo, 90%, is the overall efficiency.
Exploitation Management
At this point in processing, all algorithmic resultshave been calculated and all corresponding imagery isavailable at several resolutions in an image database.The results from these two sources must be mergedfor presentation to several image analysts. The soft-ware that performs this merging and distributionfunction is called the exploitation manager.
Exploitation-Manager Requirements
At one time, we considered organizing the softwarecomponents of the SAIP human-computer interfacearound the ROI concept. Each ROI, a package ofcontiguous imagery and related algorithm informa-tion, would be presented as a separate exploitationtask to an image analyst. The ROI concept, however,is not without drawbacks. For example, a generalproblem is how to handle imagery that is not part ofany ROI. Should it be entirely unavailable to imageanalysts? Should it be accessible only by exploringoutward from an ROI? Should it be available only ondemand? Should image analysts be expected to ex-
ploit non-ROI imagery at low priority? Or should allcontiguous imagery be presented to an image analystas it arrives, with the ROI simply serving as cue?
We eventually decided that the SAIP baseline sys-tem should task image analysts with exploiting blocksof contiguous imagery by using ROIs as cues and pri-oritize the tasking of each block by using any second-ary information in the ROI.
Each block of contiguous imagery is called an ex-ploitable image. For spotlight-mode imagery, onewhole spotlight-mode image represents an exploitableimage. For search-mode imagery, one sequence ofsearch-mode image patches is organized into a se-quence of exploitable images, called screens, each offull range extent and with an equal (in pixel count)cross-range extent. The typical ground-plane extentof such an exploitable image would be around 10 km2
for Global Hawk search mode. These considerationsresulted in our defining the following requirementsfor the exploitation-manager design.1. Those scenes determined by the algorithms to
contain high-priority targets must be shown toan image analyst as soon as possible.
2. Each image analyst must be given sufficient vi-sual context to make informed decisions abouttargets.
3. The module must keep up with the real-timedata flow of incoming data.
4. All incoming imagery must be examined, atleast at low resolution, by an image analyst.
Table 4. HDVI and MSE Processing Times
Processing Stage Execution Time (sec)
HDVI 1.61
First-stage classifier 0.34
Second-stage classifier 0.13
Total for candidate process 2.08
Total time spent in thread 2.16
Amount of time per detection 2.3processor, measured by theMSE manager
• SISTERSON, DELANEY, GRAVINA, HARMON, HIETT, AND WYSCHOGRODAn Architecture for Semi-Automated Radar Image Exploitation
VOLUME 11, NUMBER 2, 1998 LINCOLN LABORATORY JOURNAL 195
5. If image analysts fall behind the incoming datarate, the system must buffer imagery and algo-rithmic results until the analysts are ready.
6. High-resolution imagery for all targets found ei-ther algorithmically or by image analysts mustbe saved for mission review and for later real-time retrieval.
7. Scheduling of imagery screens, subject to aboveconsiderations, is round-robin.
Data-Driven and Image-Analyst-DrivenPortions of the Architecture
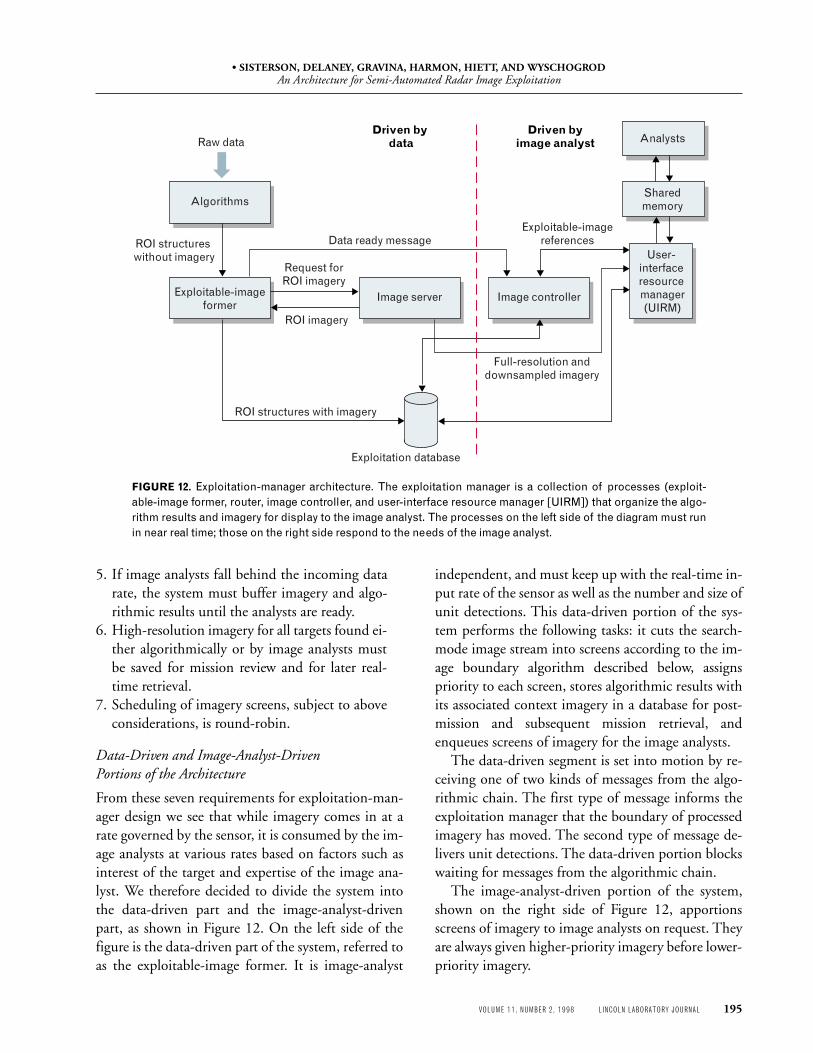
From these seven requirements for exploitation-man-ager design we see that while imagery comes in at arate governed by the sensor, it is consumed by the im-age analysts at various rates based on factors such asinterest of the target and expertise of the image ana-lyst. We therefore decided to divide the system intothe data-driven part and the image-analyst-drivenpart, as shown in Figure 12. On the left side of thefigure is the data-driven part of the system, referred toas the exploitable-image former. It is image-analyst
independent, and must keep up with the real-time in-put rate of the sensor as well as the number and size ofunit detections. This data-driven portion of the sys-tem performs the following tasks: it cuts the search-mode image stream into screens according to the im-age boundary algorithm described below, assignspriority to each screen, stores algorithmic results withits associated context imagery in a database for post-mission and subsequent mission retrieval, andenqueues screens of imagery for the image analysts.
The data-driven segment is set into motion by re-ceiving one of two kinds of messages from the algo-rithmic chain. The first type of message informs theexploitation manager that the boundary of processedimagery has moved. The second type of message de-livers unit detections. The data-driven portion blockswaiting for messages from the algorithmic chain.
The image-analyst-driven portion of the system,shown on the right side of Figure 12, apportionsscreens of imagery to image analysts on request. Theyare always given higher-priority imagery before lower-priority imagery.
FIGURE 12. Exploitation-manager architecture. The exploitation manager is a collection of processes (exploit-able-image former, router, image controller, and user-interface resource manager [UIRM]) that organize the algo-rithm results and imagery for display to the image analyst. The processes on the left side of the diagram must runin near real time; those on the right side respond to the needs of the image analyst.
Exploitation database
Sharedmemory
Driven byimage analyst
Driven by data
Algorithms
Request forROI imagery
ROI structures without imagery
ROI structures with imagery
Data ready message
Full-resolution anddownsampled imagery
Raw data
ROI imagery
Exploitable-imageformer
Image server Image controller
Exploitable-imagereferences
User- interface resource manager(UIRM)
Analysts
• SISTERSON, DELANEY, GRAVINA, HARMON, HIETT, AND WYSCHOGRODAn Architecture for Semi-Automated Radar Image Exploitation
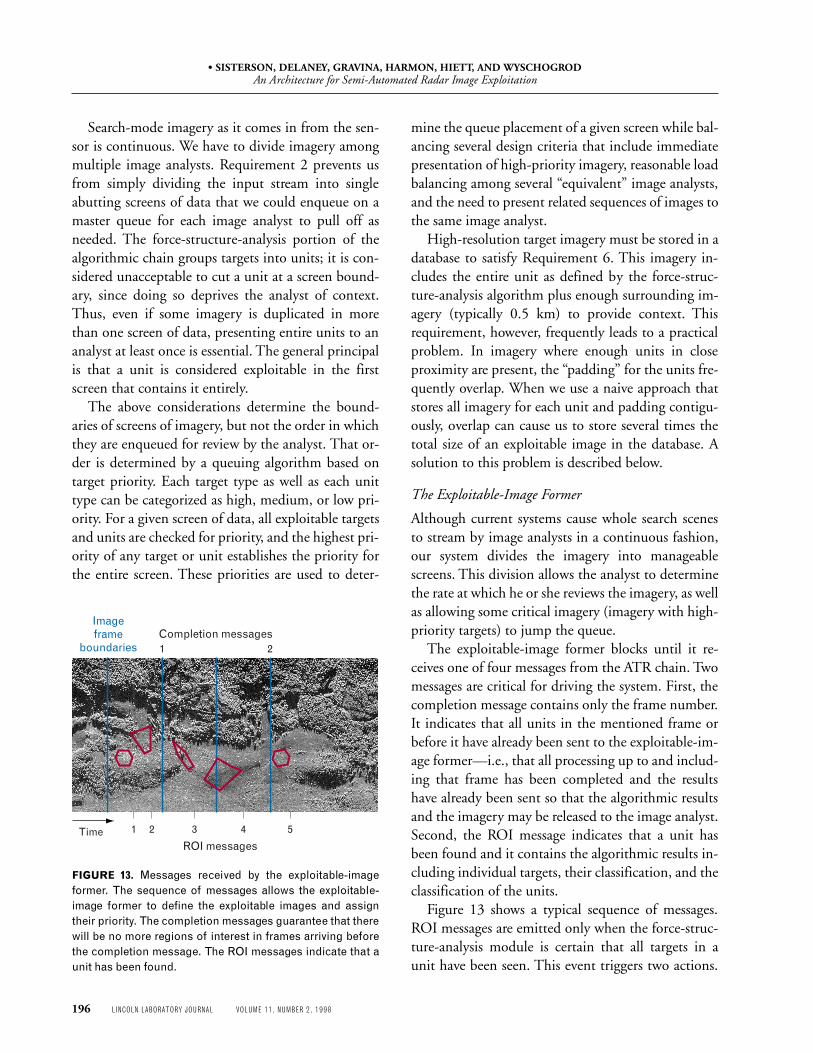
196 LINCOLN LABORATORY JOURNAL VOLUME 11, NUMBER 2, 1998
FIGURE 13. Messages received by the exploitable-imageformer. The sequence of messages allows the exploitable-image former to define the exploitable images and assigntheir priority. The completion messages guarantee that therewill be no more regions of interest in frames arriving beforethe completion message. The ROI messages indicate that aunit has been found.
Search-mode imagery as it comes in from the sen-sor is continuous. We have to divide imagery amongmultiple image analysts. Requirement 2 prevents usfrom simply dividing the input stream into singleabutting screens of data that we could enqueue on amaster queue for each image analyst to pull off asneeded. The force-structure-analysis portion of thealgorithmic chain groups targets into units; it is con-sidered unacceptable to cut a unit at a screen bound-ary, since doing so deprives the analyst of context.Thus, even if some imagery is duplicated in morethan one screen of data, presenting entire units to ananalyst at least once is essential. The general principalis that a unit is considered exploitable in the firstscreen that contains it entirely.
The above considerations determine the bound-aries of screens of imagery, but not the order in whichthey are enqueued for review by the analyst. That or-der is determined by a queuing algorithm based ontarget priority. Each target type as well as each unittype can be categorized as high, medium, or low pri-ority. For a given screen of data, all exploitable targetsand units are checked for priority, and the highest pri-ority of any target or unit establishes the priority forthe entire screen. These priorities are used to deter-
mine the queue placement of a given screen while bal-ancing several design criteria that include immediatepresentation of high-priority imagery, reasonable loadbalancing among several “equivalent” image analysts,and the need to present related sequences of images tothe same image analyst.
High-resolution target imagery must be stored in adatabase to satisfy Requirement 6. This imagery in-cludes the entire unit as defined by the force-struc-ture-analysis algorithm plus enough surrounding im-agery (typically 0.5 km) to provide context. Thisrequirement, however, frequently leads to a practicalproblem. In imagery where enough units in closeproximity are present, the “padding” for the units fre-quently overlap. When we use a naive approach thatstores all imagery for each unit and padding contigu-ously, overlap can cause us to store several times thetotal size of an exploitable image in the database. Asolution to this problem is described below.
The Exploitable-Image Former
Although current systems cause whole search scenesto stream by image analysts in a continuous fashion,our system divides the imagery into manageablescreens. This division allows the analyst to determinethe rate at which he or she reviews the imagery, as wellas allowing some critical imagery (imagery with high-priority targets) to jump the queue.
The exploitable-image former blocks until it re-ceives one of four messages from the ATR chain. Twomessages are critical for driving the system. First, thecompletion message contains only the frame number.It indicates that all units in the mentioned frame orbefore it have already been sent to the exploitable-im-age former—i.e., that all processing up to and includ-ing that frame has been completed and the resultshave already been sent so that the algorithmic resultsand the imagery may be released to the image analyst.Second, the ROI message indicates that a unit hasbeen found and it contains the algorithmic results in-cluding individual targets, their classification, and theclassification of the units.
Figure 13 shows a typical sequence of messages.ROI messages are emitted only when the force-struc-ture-analysis module is certain that all targets in aunit have been seen. This event triggers two actions.
1Time
Imageframe
boundariesCompletion messages
2 3 4
ROI messages
5
21
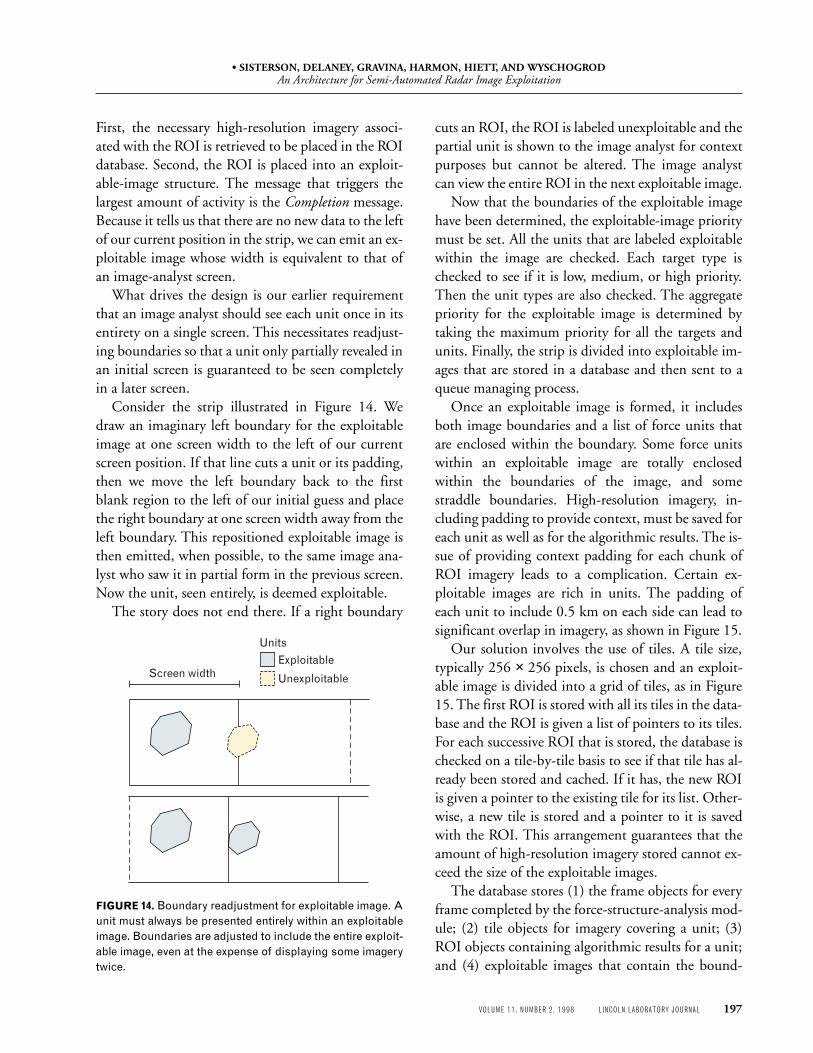
• SISTERSON, DELANEY, GRAVINA, HARMON, HIETT, AND WYSCHOGRODAn Architecture for Semi-Automated Radar Image Exploitation
VOLUME 11, NUMBER 2, 1998 LINCOLN LABORATORY JOURNAL 197
First, the necessary high-resolution imagery associ-ated with the ROI is retrieved to be placed in the ROIdatabase. Second, the ROI is placed into an exploit-able-image structure. The message that triggers thelargest amount of activity is the Completion message.Because it tells us that there are no new data to the leftof our current position in the strip, we can emit an ex-ploitable image whose width is equivalent to that ofan image-analyst screen.
What drives the design is our earlier requirementthat an image analyst should see each unit once in itsentirety on a single screen. This necessitates readjust-ing boundaries so that a unit only partially revealed inan initial screen is guaranteed to be seen completelyin a later screen.
Consider the strip illustrated in Figure 14. Wedraw an imaginary left boundary for the exploitableimage at one screen width to the left of our currentscreen position. If that line cuts a unit or its padding,then we move the left boundary back to the firstblank region to the left of our initial guess and placethe right boundary at one screen width away from theleft boundary. This repositioned exploitable image isthen emitted, when possible, to the same image ana-lyst who saw it in partial form in the previous screen.Now the unit, seen entirely, is deemed exploitable.
The story does not end there. If a right boundary
cuts an ROI, the ROI is labeled unexploitable and thepartial unit is shown to the image analyst for contextpurposes but cannot be altered. The image analystcan view the entire ROI in the next exploitable image.
Now that the boundaries of the exploitable imagehave been determined, the exploitable-image prioritymust be set. All the units that are labeled exploitablewithin the image are checked. Each target type ischecked to see if it is low, medium, or high priority.Then the unit types are also checked. The aggregatepriority for the exploitable image is determined bytaking the maximum priority for all the targets andunits. Finally, the strip is divided into exploitable im-ages that are stored in a database and then sent to aqueue managing process.
Once an exploitable image is formed, it includesboth image boundaries and a list of force units thatare enclosed within the boundary. Some force unitswithin an exploitable image are totally enclosedwithin the boundaries of the image, and somestraddle boundaries. High-resolution imagery, in-cluding padding to provide context, must be saved foreach unit as well as for the algorithmic results. The is-sue of providing context padding for each chunk ofROI imagery leads to a complication. Certain ex-ploitable images are rich in units. The padding ofeach unit to include 0.5 km on each side can lead tosignificant overlap in imagery, as shown in Figure 15.
Our solution involves the use of tiles. A tile size,typically 256 × 256 pixels, is chosen and an exploit-able image is divided into a grid of tiles, as in Figure15. The first ROI is stored with all its tiles in the data-base and the ROI is given a list of pointers to its tiles.For each successive ROI that is stored, the database ischecked on a tile-by-tile basis to see if that tile has al-ready been stored and cached. If it has, the new ROIis given a pointer to the existing tile for its list. Other-wise, a new tile is stored and a pointer to it is savedwith the ROI. This arrangement guarantees that theamount of high-resolution imagery stored cannot ex-ceed the size of the exploitable images.
The database stores (1) the frame objects for everyframe completed by the force-structure-analysis mod-ule; (2) tile objects for imagery covering a unit; (3)ROI objects containing algorithmic results for a unit;and (4) exploitable images that contain the bound-
FIGURE 14. Boundary readjustment for exploitable image. Aunit must always be presented entirely within an exploitableimage. Boundaries are adjusted to include the entire exploit-able image, even at the expense of displaying some imagerytwice.
Screen width
Units
Exploitable
Unexploitable
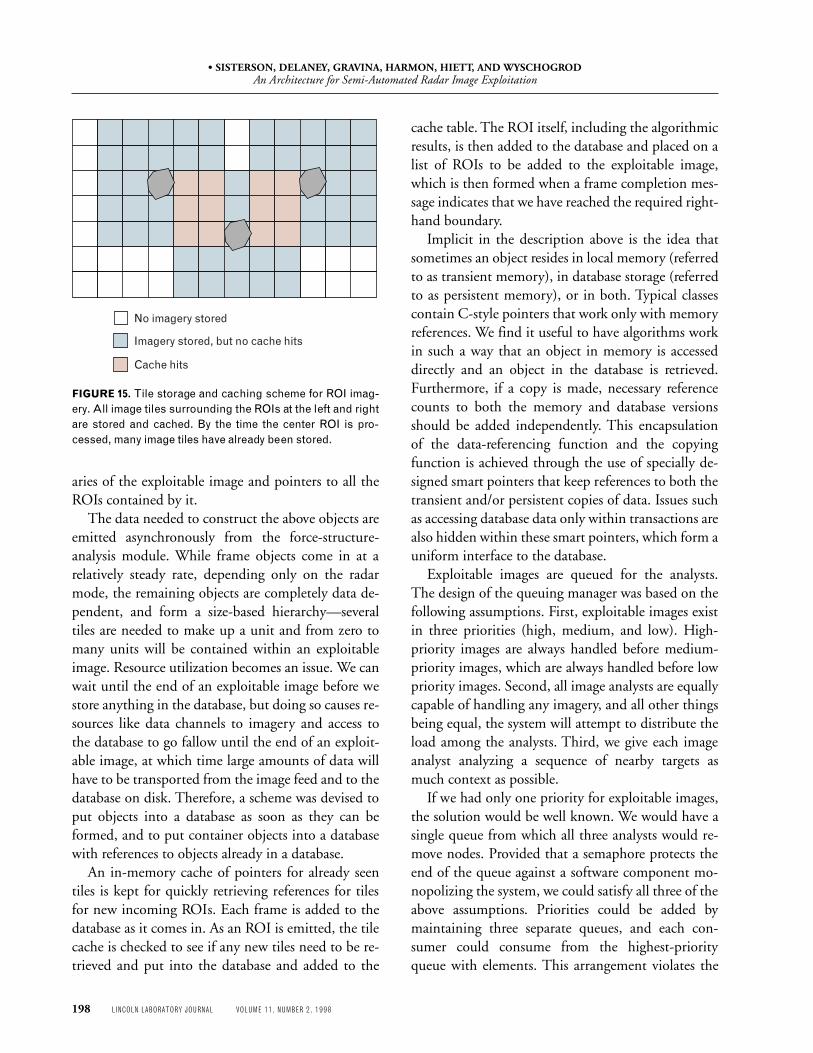
• SISTERSON, DELANEY, GRAVINA, HARMON, HIETT, AND WYSCHOGRODAn Architecture for Semi-Automated Radar Image Exploitation
198 LINCOLN LABORATORY JOURNAL VOLUME 11, NUMBER 2, 1998
aries of the exploitable image and pointers to all theROIs contained by it.
The data needed to construct the above objects areemitted asynchronously from the force-structure-analysis module. While frame objects come in at arelatively steady rate, depending only on the radarmode, the remaining objects are completely data de-pendent, and form a size-based hierarchy—severaltiles are needed to make up a unit and from zero tomany units will be contained within an exploitableimage. Resource utilization becomes an issue. We canwait until the end of an exploitable image before westore anything in the database, but doing so causes re-sources like data channels to imagery and access tothe database to go fallow until the end of an exploit-able image, at which time large amounts of data willhave to be transported from the image feed and to thedatabase on disk. Therefore, a scheme was devised toput objects into a database as soon as they can beformed, and to put container objects into a databasewith references to objects already in a database.
An in-memory cache of pointers for already seentiles is kept for quickly retrieving references for tilesfor new incoming ROIs. Each frame is added to thedatabase as it comes in. As an ROI is emitted, the tilecache is checked to see if any new tiles need to be re-trieved and put into the database and added to the
cache table. The ROI itself, including the algorithmicresults, is then added to the database and placed on alist of ROIs to be added to the exploitable image,which is then formed when a frame completion mes-sage indicates that we have reached the required right-hand boundary.
Implicit in the description above is the idea thatsometimes an object resides in local memory (referredto as transient memory), in database storage (referredto as persistent memory), or in both. Typical classescontain C-style pointers that work only with memoryreferences. We find it useful to have algorithms workin such a way that an object in memory is accesseddirectly and an object in the database is retrieved.Furthermore, if a copy is made, necessary referencecounts to both the memory and database versionsshould be added independently. This encapsulationof the data-referencing function and the copyingfunction is achieved through the use of specially de-signed smart pointers that keep references to both thetransient and/or persistent copies of data. Issues suchas accessing database data only within transactions arealso hidden within these smart pointers, which form auniform interface to the database.
Exploitable images are queued for the analysts.The design of the queuing manager was based on thefollowing assumptions. First, exploitable images existin three priorities (high, medium, and low). High-priority images are always handled before medium-priority images, which are always handled before lowpriority images. Second, all image analysts are equallycapable of handling any imagery, and all other thingsbeing equal, the system will attempt to distribute theload among the analysts. Third, we give each imageanalyst analyzing a sequence of nearby targets asmuch context as possible.
If we had only one priority for exploitable images,the solution would be well known. We would have asingle queue from which all three analysts would re-move nodes. Provided that a semaphore protects theend of the queue against a software component mo-nopolizing the system, we could satisfy all three of theabove assumptions. Priorities could be added bymaintaining three separate queues, and each con-sumer could consume from the highest-priorityqueue with elements. This arrangement violates the
FIGURE 15. Tile storage and caching scheme for ROI imag-ery. All image tiles surrounding the ROIs at the left and rightare stored and cached. By the time the center ROI is pro-cessed, many image tiles have already been stored.
No imagery stored
Imagery stored, but no cache hits
Cache hits
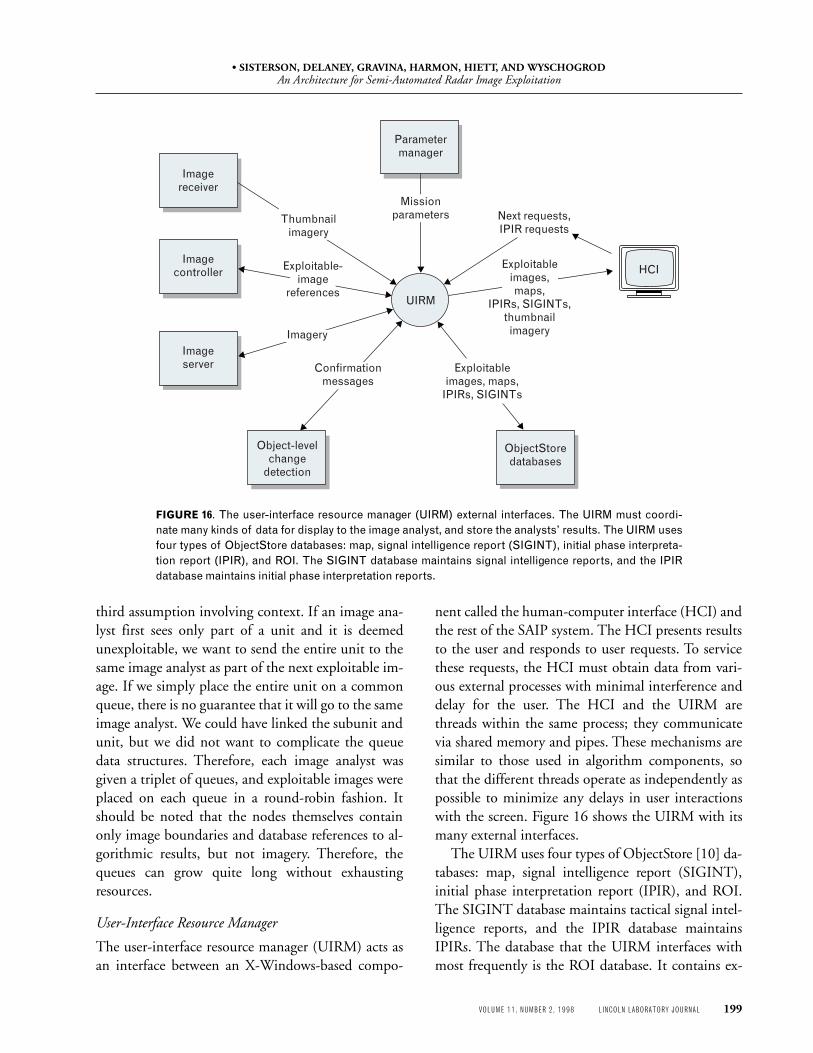
• SISTERSON, DELANEY, GRAVINA, HARMON, HIETT, AND WYSCHOGRODAn Architecture for Semi-Automated Radar Image Exploitation
VOLUME 11, NUMBER 2, 1998 LINCOLN LABORATORY JOURNAL 199
third assumption involving context. If an image ana-lyst first sees only part of a unit and it is deemedunexploitable, we want to send the entire unit to thesame image analyst as part of the next exploitable im-age. If we simply place the entire unit on a commonqueue, there is no guarantee that it will go to the sameimage analyst. We could have linked the subunit andunit, but we did not want to complicate the queuedata structures. Therefore, each image analyst wasgiven a triplet of queues, and exploitable images wereplaced on each queue in a round-robin fashion. Itshould be noted that the nodes themselves containonly image boundaries and database references to al-gorithmic results, but not imagery. Therefore, thequeues can grow quite long without exhaustingresources.
User-Interface Resource Manager
The user-interface resource manager (UIRM) acts asan interface between an X-Windows-based compo-
nent called the human-computer interface (HCI) andthe rest of the SAIP system. The HCI presents resultsto the user and responds to user requests. To servicethese requests, the HCI must obtain data from vari-ous external processes with minimal interference anddelay for the user. The HCI and the UIRM arethreads within the same process; they communicatevia shared memory and pipes. These mechanisms aresimilar to those used in algorithm components, sothat the different threads operate as independently aspossible to minimize any delays in user interactionswith the screen. Figure 16 shows the UIRM with itsmany external interfaces.
The UIRM uses four types of ObjectStore [10] da-tabases: map, signal intelligence report (SIGINT),initial phase interpretation report (IPIR), and ROI.The SIGINT database maintains tactical signal intel-ligence reports, and the IPIR database maintainsIPIRs. The database that the UIRM interfaces withmost frequently is the ROI database. It contains ex-
FIGURE 16. The user-interface resource manager (UIRM) external interfaces. The UIRM must coordi-nate many kinds of data for display to the image analyst, and store the analysts’ results. The UIRM usesfour types of ObjectStore databases: map, signal intelligence report (SIGINT), initial phase interpreta-tion report (IPIR), and ROI. The SIGINT database maintains signal intelligence reports, and the IPIRdatabase maintains initial phase interpretation reports.
Imagereceiver
Imagecontroller
Imageserver
Object-levelchange
detection
ObjectStoredatabases
HCI
Parametermanager
Next requests,IPIR requests
Exploitableimages, maps,
IPIRs, SIGINTs
Confirmationmessages
Imagery
Exploitable-image
references
Thumbnailimagery
Missionparameters
Exploitableimages,maps,
IPIRs, SIGINTs,thumbnail
imagery
UIRM
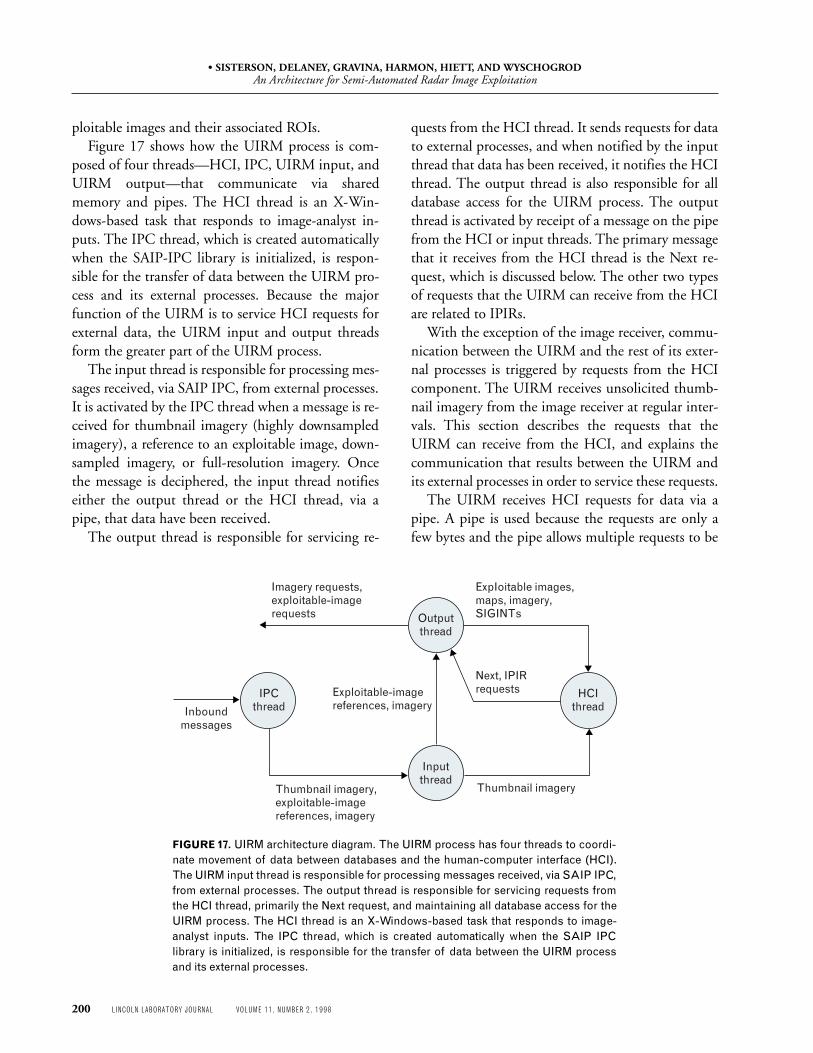
• SISTERSON, DELANEY, GRAVINA, HARMON, HIETT, AND WYSCHOGRODAn Architecture for Semi-Automated Radar Image Exploitation
200 LINCOLN LABORATORY JOURNAL VOLUME 11, NUMBER 2, 1998
ploitable images and their associated ROIs.Figure 17 shows how the UIRM process is com-
posed of four threads—HCI, IPC, UIRM input, andUIRM output—that communicate via sharedmemory and pipes. The HCI thread is an X-Win-dows-based task that responds to image-analyst in-puts. The IPC thread, which is created automaticallywhen the SAIP-IPC library is initialized, is respon-sible for the transfer of data between the UIRM pro-cess and its external processes. Because the majorfunction of the UIRM is to service HCI requests forexternal data, the UIRM input and output threadsform the greater part of the UIRM process.
The input thread is responsible for processing mes-sages received, via SAIP IPC, from external processes.It is activated by the IPC thread when a message is re-ceived for thumbnail imagery (highly downsampledimagery), a reference to an exploitable image, down-sampled imagery, or full-resolution imagery. Oncethe message is deciphered, the input thread notifieseither the output thread or the HCI thread, via apipe, that data have been received.
The output thread is responsible for servicing re-
quests from the HCI thread. It sends requests for datato external processes, and when notified by the inputthread that data has been received, it notifies the HCIthread. The output thread is also responsible for alldatabase access for the UIRM process. The outputthread is activated by receipt of a message on the pipefrom the HCI or input threads. The primary messagethat it receives from the HCI thread is the Next re-quest, which is discussed below. The other two typesof requests that the UIRM can receive from the HCIare related to IPIRs.
With the exception of the image receiver, commu-nication between the UIRM and the rest of its exter-nal processes is triggered by requests from the HCIcomponent. The UIRM receives unsolicited thumb-nail imagery from the image receiver at regular inter-vals. This section describes the requests that theUIRM can receive from the HCI, and explains thecommunication that results between the UIRM andits external processes in order to service these requests.
The UIRM receives HCI requests for data via apipe. A pipe is used because the requests are only afew bytes and the pipe allows multiple requests to be
FIGURE 17. UIRM architecture diagram. The UIRM process has four threads to coordi-nate movement of data between databases and the human-computer interface (HCI).The UIRM input thread is responsible for processing messages received, via SAIP IPC,from external processes. The output thread is responsible for servicing requests fromthe HCI thread, primarily the Next request, and maintaining all database access for theUIRM process. The HCI thread is an X-Windows-based task that responds to image-analyst inputs. The IPC thread, which is created automatically when the SAIP IPClibrary is initialized, is responsible for the transfer of data between the UIRM processand its external processes.
Outputthread
Inputthread
HCIthread
IPCthread
Imagery requests,exploitable-image requests
ExpIoitable images, maps, imagery, SIGINTs
Thumbnail imageryThumbnail imagery,exploitable-image references, imagery
Exploitable-imagereferences, imageryInbound
messages
Next, IPIRrequests
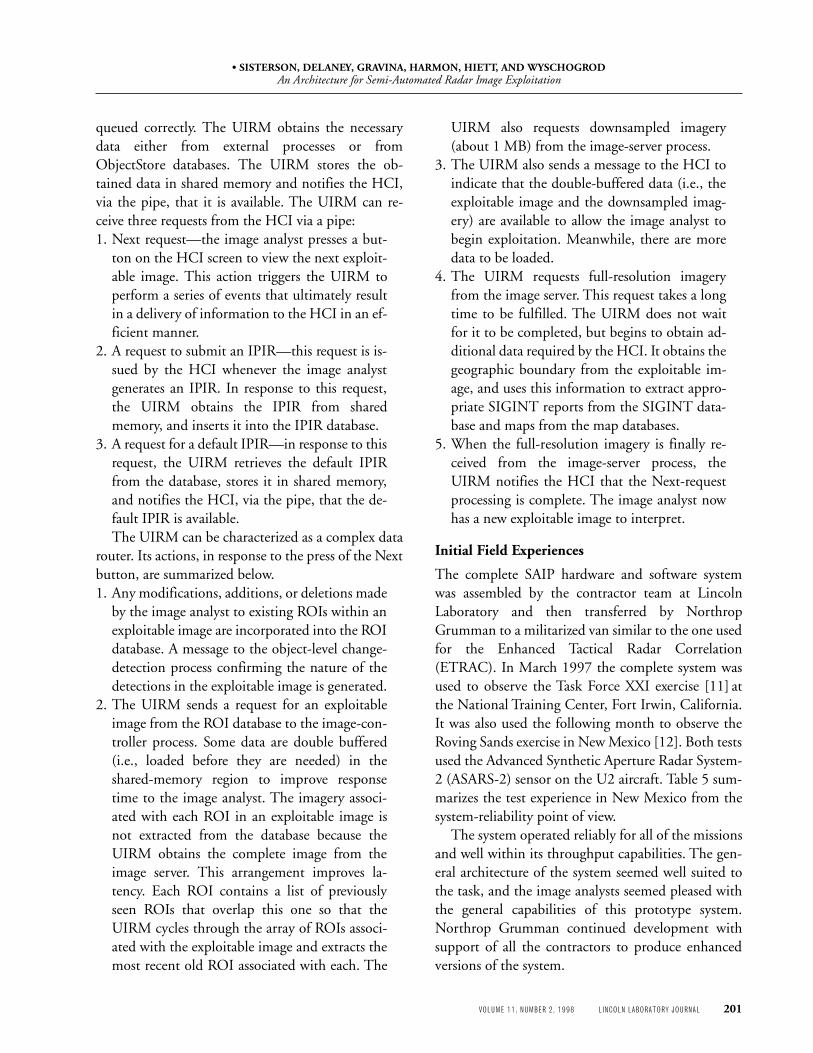
• SISTERSON, DELANEY, GRAVINA, HARMON, HIETT, AND WYSCHOGRODAn Architecture for Semi-Automated Radar Image Exploitation
VOLUME 11, NUMBER 2, 1998 LINCOLN LABORATORY JOURNAL 201
queued correctly. The UIRM obtains the necessarydata either from external processes or fromObjectStore databases. The UIRM stores the ob-tained data in shared memory and notifies the HCI,via the pipe, that it is available. The UIRM can re-ceive three requests from the HCI via a pipe:1. Next request—the image analyst presses a but-
ton on the HCI screen to view the next exploit-able image. This action triggers the UIRM toperform a series of events that ultimately resultin a delivery of information to the HCI in an ef-ficient manner.
2. A request to submit an IPIR—this request is is-sued by the HCI whenever the image analystgenerates an IPIR. In response to this request,the UIRM obtains the IPIR from sharedmemory, and inserts it into the IPIR database.
3. A request for a default IPIR—in response to thisrequest, the UIRM retrieves the default IPIRfrom the database, stores it in shared memory,and notifies the HCI, via the pipe, that the de-fault IPIR is available.The UIRM can be characterized as a complex data
router. Its actions, in response to the press of the Nextbutton, are summarized below.1. Any modifications, additions, or deletions made
by the image analyst to existing ROIs within anexploitable image are incorporated into the ROIdatabase. A message to the object-level change-detection process confirming the nature of thedetections in the exploitable image is generated.
2. The UIRM sends a request for an exploitableimage from the ROI database to the image-con-troller process. Some data are double buffered(i.e., loaded before they are needed) in theshared-memory region to improve responsetime to the image analyst. The imagery associ-ated with each ROI in an exploitable image isnot extracted from the database because theUIRM obtains the complete image from theimage server. This arrangement improves la-tency. Each ROI contains a list of previouslyseen ROIs that overlap this one so that theUIRM cycles through the array of ROIs associ-ated with the exploitable image and extracts themost recent old ROI associated with each. The
UIRM also requests downsampled imagery(about 1 MB) from the image-server process.
3. The UIRM also sends a message to the HCI toindicate that the double-buffered data (i.e., theexploitable image and the downsampled imag-ery) are available to allow the image analyst tobegin exploitation. Meanwhile, there are moredata to be loaded.
4. The UIRM requests full-resolution imageryfrom the image server. This request takes a longtime to be fulfilled. The UIRM does not waitfor it to be completed, but begins to obtain ad-ditional data required by the HCI. It obtains thegeographic boundary from the exploitable im-age, and uses this information to extract appro-priate SIGINT reports from the SIGINT data-base and maps from the map databases.
5. When the full-resolution imagery is finally re-ceived from the image-server process, theUIRM notifies the HCI that the Next-requestprocessing is complete. The image analyst nowhas a new exploitable image to interpret.
Initial Field Experiences
The complete SAIP hardware and software systemwas assembled by the contractor team at LincolnLaboratory and then transferred by NorthropGrumman to a militarized van similar to the one usedfor the Enhanced Tactical Radar Correlation(ETRAC). In March 1997 the complete system wasused to observe the Task Force XXI exercise [11] atthe National Training Center, Fort Irwin, California.It was also used the following month to observe theRoving Sands exercise in New Mexico [12]. Both testsused the Advanced Synthetic Aperture Radar System-2 (ASARS-2) sensor on the U2 aircraft. Table 5 sum-marizes the test experience in New Mexico from thesystem-reliability point of view.
The system operated reliably for all of the missionsand well within its throughput capabilities. The gen-eral architecture of the system seemed well suited tothe task, and the image analysts seemed pleased withthe general capabilities of this prototype system.Northrop Grumman continued development withsupport of all the contractors to produce enhancedversions of the system.
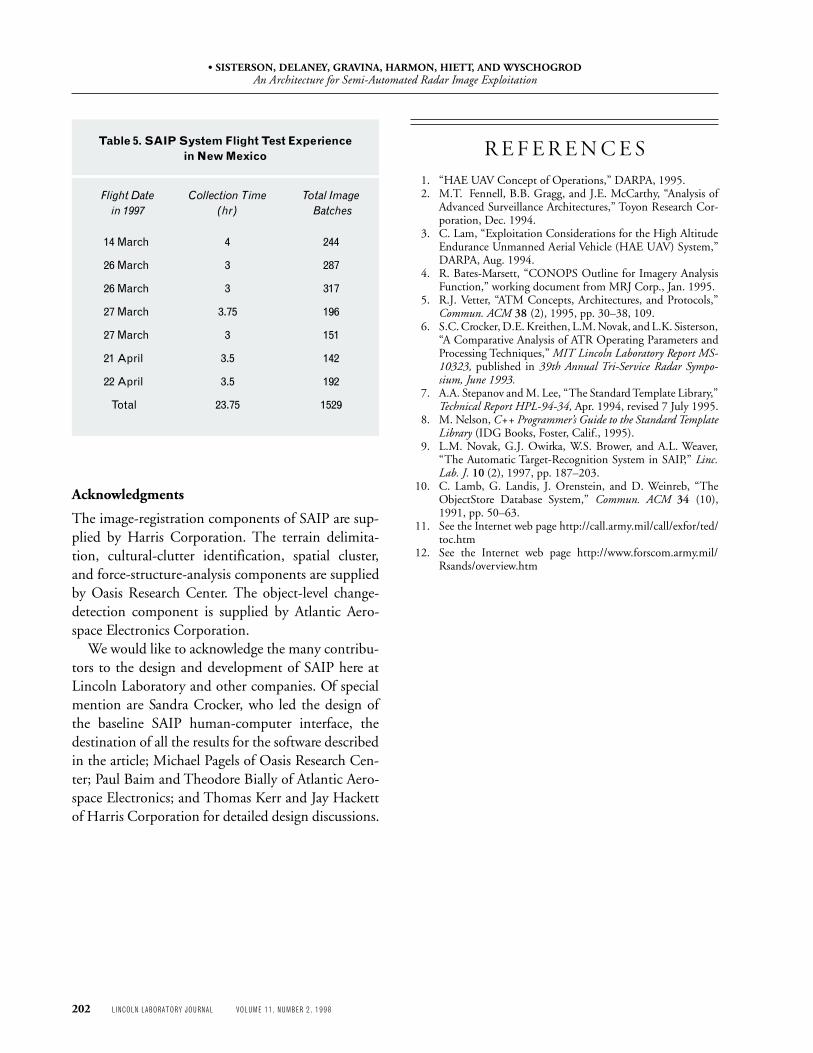
• SISTERSON, DELANEY, GRAVINA, HARMON, HIETT, AND WYSCHOGRODAn Architecture for Semi-Automated Radar Image Exploitation
202 LINCOLN LABORATORY JOURNAL VOLUME 11, NUMBER 2, 1998
Acknowledgments
The image-registration components of SAIP are sup-plied by Harris Corporation. The terrain delimita-tion, cultural-clutter identification, spatial cluster,and force-structure-analysis components are suppliedby Oasis Research Center. The object-level change-detection component is supplied by Atlantic Aero-space Electronics Corporation.
We would like to acknowledge the many contribu-tors to the design and development of SAIP here atLincoln Laboratory and other companies. Of specialmention are Sandra Crocker, who led the design ofthe baseline SAIP human-computer interface, thedestination of all the results for the software describedin the article; Michael Pagels of Oasis Research Cen-ter; Paul Baim and Theodore Bially of Atlantic Aero-space Electronics; and Thomas Kerr and Jay Hackettof Harris Corporation for detailed design discussions.
Table 5. SAIP System Flight Test Experiencein New Mexico
Flight Date Collection Time Total Image
in 1997 (hr) Batches
14 March 4 244
26 March 3 287
26 March 3 317
27 March 3.75 196
27 March 3 151
21 April 3.5 142
22 April 3.5 192
Total 23.75 1529
R E F E R E N C E S1. “HAE UAV Concept of Operations,” DARPA, 1995.2. M.T. Fennell, B.B. Gragg, and J.E. McCarthy, “Analysis of
Advanced Surveillance Architectures,” Toyon Research Cor-poration, Dec. 1994.
3. C. Lam, “Exploitation Considerations for the High AltitudeEndurance Unmanned Aerial Vehicle (HAE UAV) System,”DARPA, Aug. 1994.
4. R. Bates-Marsett, “CONOPS Outline for Imagery AnalysisFunction,” working document from MRJ Corp., Jan. 1995.
5. R.J. Vetter, “ATM Concepts, Architectures, and Protocols,”Commun. ACM 38 (2), 1995, pp. 30–38, 109.
6. S.C. Crocker, D.E. Kreithen, L.M. Novak, and L.K. Sisterson,“A Comparative Analysis of ATR Operating Parameters andProcessing Techniques,” MIT Lincoln Laboratory Report MS-10323, published in 39th Annual Tri-Service Radar Sympo-sium, June 1993.
7. A.A. Stepanov and M. Lee, “The Standard Template Library,”Technical Report HPL-94-34, Apr. 1994, revised 7 July 1995.
8. M. Nelson, C++ Programmer’s Guide to the Standard TemplateLibrary (IDG Books, Foster, Calif., 1995).
9. L.M. Novak, G.J. Owirka, W.S. Brower, and A.L. Weaver,“The Automatic Target-Recognition System in SAIP,” Linc.Lab. J. 10 (2), 1997, pp. 187–203.
10. C. Lamb, G. Landis, J. Orenstein, and D. Weinreb, “TheObjectStore Database System,” Commun. ACM 34 (10),1991, pp. 50–63.
11. See the Internet web page http://call.army.mil/call/exfor/ted/toc.htm
12. See the Internet web page http://www.forscom.army.mil/Rsands/overview.htm
• SISTERSON, DELANEY, GRAVINA, HARMON, HIETT, AND WYSCHOGRODAn Architecture for Semi-Automated Radar Image Exploitation
VOLUME 11, NUMBER 2, 1998 LINCOLN LABORATORY JOURNAL 203
. investigates and developssystems for synthetic apertureradar (SAR) and moving targetindicator (MTI) data acquisi-tion, processing, and exploita-tion as a staff member of theSurveillance Systems group.He joined Lincoln Laboratoryin 1989, after managing teamsin the private sector to buildsoftware for microprocessordevelopment, materials testing,and real-time hospital infor-mation systems. Before that,he researched experimentalhigh-energy nuclear physics atHarvard University. Keithholds an M.A. degree in natu-ral sciences from the Univer-sity of Cambridge in England,and a Ph.D. in high-energynuclear physics from ImperialCollege of Science and Tech-nology in London. He belongsto the American PhysicalSociety and the Association forComputing Machinery.
. is a staff member of the Sys-tems Analysis group. Heperforms systems analysis anddesigns software for under-ground facilities. John has alsoworked in systems analysis andsoftware design for Alphatechin Burlington, Massachusetts.He holds B.S., M.S., andPh.D. degrees in electricalengineering from StanfordUniversity in California.
. is a staff member in theSurveillance Systems group,developing real-time image-exploitation algorithms andsoftware. Before joining Lin-coln Laboratory in 1996, Samwas a research consultant withthe Department of RadiologyResearch at Beth Israel Hospi-tal, Harvard Medical School,where he conducted structuraland chemical magnetic reso-nance imaging (MRI) studiesof cartilage degradation inosteoarthritis. From 1990 to1995 he worked as an applica-tions scientist at Bruker In-struments, a scientific instru-ments manufacturer. There hedeveloped software, hardware,and research techniques for usein a wide variety of problemsincluding microscopic MRI,high-resolution imaging ofsolid materials, real-time imageacquisition in dynamic bio-logical and physical systems,imaging of human cognitivefunctioning, and multidimen-sional image analysis anddisplay. From 1988 to 1990,Sam worked as a postdoctoralresearch associate at RensselaerPolytechnic Institute, studyingthe magnetic and electricalproperties of novel high-temperature superconductors.Sam holds a B.S. degree inphysics from Rensselaer Poly-technic Institute in Troy, NewYork, and M.S. and Ph.D.degrees in physics from BrownUniversity in Providence,Rhode Island. He is a memberof the American PhysicalSociety.
. is a staff member in the SensorExploitation group. His workin software engineering focuseson parallel software systemsdesign and implementation.He joined the Laboratory in1985, after working withnetwork system software forthe Canadian EducationalMicrocomputer Corporation(CEMCORP). He holdsB.A.Sc. and M.A.Sc. degreesin electrical engineering fromthe University of Toronto inOntario, Canada.
• SISTERSON, DELANEY, GRAVINA, HARMON, HIETT, AND WYSCHOGRODAn Architecture for Semi-Automated Radar Image Exploitation
204 LINCOLN LABORATORY JOURNAL VOLUME 11, NUMBER 2, 1998
is an associate member of theRadar Imaging Techniquesgroup. She joined the Labora-tory in 1993, and her currentresearch work involves analyz-ing satellite images. From1986 to 1992 she held atechnical staff position atRaytheon, where she wasinvolved in the implementa-tion of large-scale real-timehardware and software systemsfor detection and discrimina-tion of infrared (IR) targets.From 1992 to 1993 sheworked at Textron, where shecontinued her work analyzingreal-time algorithms for detec-tion of moving IR targets.Margarita received a B.S.degree in electrical engineeringfrom the University of Massa-chusetts at Amherst.
is a former associate staffmember of the InformationSystems Technology group. Henow designs a risk manage-ment database system forBankBoston’s Treasury Systemsdivision. Dan worked at theLaboratory from 1989 to1998. He also worked in theAir Traffic Surveillance group,designing and implementing adetection and tracking algo-rithm for an airport surfacesurveillance system that wassubsequently licensed to theRaytheon Corp. and incorpo-rated into a surveillance systemprovided to the government ofIndia. Dan also developed aPerl-based system for detectingillegal transitions to root fromrecorded session transcripts.Before coming to the Labora-tory, he worked on optics andimage-processing projects atSparta Systems, and on vision-guided robotics projects atDraper Laboratories. He holdsa B.A. degree in physics fromColumbia University in NewYork; an M.A. degree in phys-ics from the State University ofNew York (SUNY) at StonyBrook; and an M.S. degree incomputer science from theCourant Institute of New YorkUniversity.