an application of - university of queensland159268/uq159268_oa.pdfthis paper discusses the...
TRANSCRIPT

1
An Application of Keller’s Brand Equity Model in a B2B
Context
Kerri-Ann L. Kuhn
Queensland University of Technology, Brisbane, Australia
Frank Alpert
The University of Queensland, Brisbane, Australia
Nigel K. Ll. Pope
Griffith University, Brisbane, Australia
This is a post-print version of the article:
Kuhn, Kerri, Frank Alpert and Nigel Pope (2008), “Developing and Testing an Application of
Keller’s Brand Equity Model in a B2B Context,” Qualitative Market Research, Vol. 11, No. 1,
40-58.
This article was reprinted in Brand Management (ed.,O. Riley), Sage Publications, 2009.
Please reference the original article for any use of this research.

2
Abstract
Purpose: The importance of branding in industrial contexts has increased, yet a
comprehensive model of business-to-business (B2B) branding does not exist, nor has there
been a thorough empirical study of the applicability of a full brand equity model in a B2B
context. This paper discusses the suitability and limitations of Keller’s Customer-Based
Brand Equity (CBBE) model and tests its applicability in a B2B market.
Methodology/approach: The study involved the use of semi-structured interviews with
senior buyers of technology for electronic tracking of waste management.
Findings: Findings suggest that amongst organisational buyers there is a much greater
emphasis on the selling organisation, including its corporate brand, credibility and staff,
than on individual brands and their associated dimensions.
Research limitations/implications: The study investigates real brands with real potential
buyers, so there is a risk the results may represent industry-specific factors that are not
representative of all B2B markets. Future research that validates the importance of the
Keller elements in other industrial marketing contexts would be beneficial.
Practical implications: The findings are relevant for marketing practitioners, researchers
and managers as a starting point for their B2B brand equity research.
Originality/value: Detailed insights and key lessons from the field with regards to how
B2B brand equity should be conceptualised and measured are offered. A revised brand
equity model for B2B application is also presented.
Keywords: Business-to-business branding; brand equity; buyer behaviour
Article Type: Research paper

3
Introduction
Powerful brands create meaningful images in the minds of customers (Keller, 1993). A
strong brand image and reputation enhances differentiation and has a positive influence on
buying behaviour (Gordon et al., 1993; McEnally and de Chernatony, 1999). While the
power of branding is widely acknowledged in consumer markets, the nature and importance
of branding in industrial markets remains under-researched.
Many business-to-business (hereafter, B2B) strategists have claimed brand-building
belongs in the consumer realm. They argue that industrial products do not need branding as
it is confusing and adds little value to functional products (see, for example, Collins, 1977;
Lorge, 1998; Saunders and Watt, 1979). Others argue that branding and the concept of
brand equity however are increasingly important in industrial markets, because it has been
shown that what a brand means to a buyer can be a determining factor in deciding between
industrial purchase alternatives (Aaker, 1991). In this context, it is critical for suppliers to
initiate and sustain relationships due to the small number of potential customers (Ambler,
1995; Webster and Keller, 2004). To date however, there is no model available to assist
B2B marketers in identifying and measuring brand equity. In this paper we take a step in
that direction by operationalising and empirically testing a prominent brand equity model in
a B2B context. This makes not only a theoretical contribution by advancing branding
research, but addresses a managerial need for information that will assist in the assessment
of industrial branding efforts.
Brand Equity in Consumer and Business Markets
A brand is a bundle of functional, economic and psychological benefits for the end user
(Ambler, 1995). Every brand retains a certain amount of brand equity, defined as the assets
or liabilities associated with the brand that add to, or subtract from, the value the product
provides (Aaker, 1996). This is reflected in buyers’ willingness to pay a premium for a
favoured brand in preference to others, recommend it to peers, and give consideration to
other company offerings (Hutton, 1997).
Different sources of brand equity have been proposed. Aaker (1996) for example, proposes
brand awareness, associations, other proprietary assets, perceived quality and loyalty.
Often though, there is no distinction made between consumer and industrial brands. The
4
differences between consumer and business markets have been discussed elsewhere (see,
for example, Hutt and Speh, 1998; Kotler and Keller, 2005), and organisational buyers have
been found to differ in their type of purchase and decision processes (Mudambi, 2002;
Thompson et al., 1997/1998; Wilson and Woodside, 2001). It would seem reasonable that
what makes a brand valuable in a B2B context will differ from that in a consumer
environment.
The most comprehensive brand equity model available in the literature is Keller’s (1993,
2001, 2003). Keller claims the Customer-Based Brand Equity (CBBE) model can be
applied in a B2B context, but detailed analysis, a full formal adaptation (such as a
redesigned questionnaire), and empirical evidence are not yet available. Keller recognises
likely general differences between consumer and B2B markets and addresses general issues
of B2B application, but his primary focus is on consumer markets. In an earlier issue of
Qualitative Market Research, Grace and O’Cass (2002) recognised similar limitations of
the Keller framework, but in relation to its coverage of services. We turn now to an
overview of the specific steps in the Keller model and present a discussion drawing from
B2B branding research.
Elements of the Keller Model
Brand equity, as defined by Keller (1993), occurs when a brand is known and has some
strong, favourable and unique associations in a consumer’s memory. As presented in
Figure 1, the CBBE model identifies four steps for building a strong brand. In this branding
ladder each step is dependent on successfully achieving the previous - from brand identity
to brand meaning, brand responses and finally brand relationships. These steps in turn
consist of six brand building blocks - salience, performance, imagery, judgments, feelings
and resonance. The ultimate aim is to reach the pinnacle of the CBBE pyramid - resonance
- where a completely harmonious relationship exists between customers and the brand.
Take in Figure 1
Keller’s (2003) argument is as follows. The first step in building a strong brand is to ensure
the correct brand identity. The purpose is to create an identification of the brand with
customers, and an association in their minds with a specific product class or need. To do

5
this, brand salience must exist, which represents aspects of brand awareness and the range
of purchase and consumption situations in which the brand comes to mind. The salience
building block is therefore made up of two sub-dimensions - need satisfaction and category
identification.
Business-to-business products also possess images, associations and perceptions of value,
but initial awareness and associations are often achieved by direct contact with company
salespeople (Gordon et al., 1993). In industrial markets branding is dependent on the
surrounding distribution network (Gordon et al., 1993; Rosenbroijer, 2001), making the role
of distributors particularly important in building equity. Large organisations often have a
buying centre consisting of a number of parties from various departments, as well as
specialists and other interest groups, all of whom impact the purchase decision (Gordon et
al., 1993; Morris et al., 1999; Rozin, 2004). This makes the process more complex, as each
member will possess different needs and will view the purchase situation, buying criteria
and alternative suppliers in various ways (Ghingold and Wilson, 1998). The Keller model
is focused primarily on an individual’s perceptions of brands in the assessment of brand
equity, but in a B2B context these other influencers can have an impact on brand equity as
well.
The second step establishes brand meaning by linking tangible and intangible brand
associations. Brand meaning is therefore characterised in either functional (brand
performance) or abstract (image-related) associations. Functional attributes are 1) primary
ingredients and supplementary features; 2) product reliability, durability and serviceability;
3) service effectiveness, efficiency and empathy; 4) style and design; and 5) price. Image
associations relate to the extrinsic properties of the product: 1) user profiles; 2) purchase
and usage situations; 3) personality and values; and 4) history, heritage and experiences
(Keller, 2003).
By contrast, industrial research suggests that brand value has other components including
the product, distribution services, support services and the company, each possessing both
tangible and intangible elements (Low and Blois, 2002; Mudambi et al., 1997). Keller’s
model tends to ignore elements relating to support services (specifically the rapport
between the service provider and customer) and the company (such as profitability, market
share and reputation), which may have greater importance in a B2B context. Similarly,
6
Thompson et al. (1997/1998) identify other brand attributes associated with the industrial
purchasing process. Again, many of these are consistent with Keller’s brand meaning
construct, but attributes such as technical capability, delivery reliability and responsiveness
are not included.
It appears that quality, reliability, performance and service are primary factors for building
brand loyalty in the industrial context, with quality being paramount (Bendixen et al., 2004;
Michell et al., 2001; Thompson et al., 1997/1998). Keller sees this in the higher order
pyramid block judgments, but ignores the customer relationship with the sales team due to
his concentration on consumer markets. The sales force is a major brand-building tool for
B2B marketers (Abratt and Mofokeng, 2001; Lorge, 1998). A buyer’s purchase choice
depends not only on their assessment of the product’s functional benefits, but on their
evaluation of the company’s sales people (Gordon et al., 1993; Michell et al., 2001). These
staff are company advocates who can affect the brand meaning in various ways (Hogg et
al., 1998; Kennedy, 1977; Tilley, 1999).
The Keller pyramid is also focused on the individual brand but B2B products are often
marketed under the manufacturer label, or a hybrid brand, where the company’s name is
used with a specific product name (Gordon et al., 1993; Michell et al., 2001). This makes
the company name an important decision variable. Factors relating to the company behind
the brand form only a minor part of the Keller model, but they are important in a B2B
context (Selnes, 1993; Thompson et al., 1997/1998). For example, Abratt (1986) found
supplier reputation to be more important than price, and Shaw et al. (1989) showed that
intangible attributes are often more important than product performance.
Brand response is the third step in the Keller model and represents opinions and evaluations
of the brand based on a combination of associations identified in brand meaning. These
judgments include overall quality, credibility, consideration and superiority. Brand feelings
are customers’ emotional responses and reactions to the brand. Keller (2003) identifies six
types: warmth, fun, excitement, security, social approval and self respect.
This approach reflects a customer focus on the functional, emotional and self-expressive
benefits of brands. In contrast, industrial brand management is characterised by branding at
the corporate level (Gylling and Lindberg-Repo, 2006), with greater customer emphasis on
7
risk-reduction than on expressive benefits (Mudambi, 2002). One way of managing and
decreasing risk and uncertainty for the organisation is to buy leading brands from reputable
companies (Mitchell, 1995; Mudambi, 2002). This supports the importance of feelings and
imagery in the organisational buying context (as argued by other researchers such as Lynch
and de Chernatony, 2004), but suggests that different types of feelings and imagery to those
specified by Keller, may be required in a B2B brand equity model.
Brand relationships constitute the final step in the pyramid where brand response is
converted to create an intense, active loyalty relationship between customers and the brand.
The pinnacle of the pyramid is resonance, which refers to the nature of the relationship
between the customer and the brand. It is described as having four elements: behavioural
loyalty, attitudinal attachment, sense of community and active engagement (Keller, 2001).
Customer loyalty generating factors have also been found to be important to the success of
industrial brands (Michell et al., 2001). Unlike consumer markets, the gain or loss of a few
customers can significantly impact an industrial manufacturer’s bottom line. This makes
brand loyalty particularly important as it is, in some respects, firm loyalty (Gordon et al.,
1993). Changes for one individual product may affect perceptions of all products and cause
a distributor to switch suppliers in all categories after a poor experience with an individual
good (Gordon et al., 1993). While there is a lack of research to confirm the existence of
attitudinal attachment and a sense of community in industrial markets, there is evidence of
active engagement. Hutton (1997) found willingness to communicate about the brand and
make brand referrals. He also found that some organisational buyers had developed such a
strong relationship with the brand they were willing to extend to other products with the
same brand name.
In order to assess the applicability of the Keller model in a B2B environment and identify
insights and challenges of such an application, we undertook a study of the market for
electronic tracking systems for waste management. This represents an interesting market
for investigation. The marketing of high-technology products is challenging and the use of
brands has been minimal until recently (Zajas and Crowley, 1995). An increasing number
of these companies however are now undertaking brand building activities with the
assumption they can create an asset that generates long-term profits (Aaker and Jacobson,
2001).
8
Electronic Tracking Systems for Waste Management
Australia’s Environmental Protection Agency (EPA) requires local authorities to maintain
records of the generation, collection, transportation and disposal of hazardous trade wastes
in their respective shires or counties. Legislation requires an audit trail to prevent illegal
dumping. Many local government authorities had been using a docket system, similar to
that operated in the United Kingdom and elsewhere in Europe. However, a need was
recognised by the waste industry to use environmental management technology in order to
comply with reporting requirements. In response, the profile of companies with electronic
means of waste tracking was raised.
Two main competitors operate in this market, offering different types of waste tracking
technologies - a bar code docket system versus a system which uses Global Positioning
System (GPS) satellites. The bar code system aims to streamline the billing process, track
the time and place at which a transporter is discharging waste, and identify a transporter or
load in the case of disruption at a treatment plant. In addition to these benefits, the GPS
system can track the movements of waste while aboard transportation vehicles, and record
any volume and load/unload events. The industry is in the introduction stage of the product
life cycle. At the time of the study, two councils were in the process of deployment of the
GPS system, and half a dozen councils were using the bar code system. Other local
authorities were postponing their decision as to which product they would use in order to
more accurately assess the two alternatives.
The current research was conducted in two stages. First, a study was performed to obtain
preliminary insights from buyers of waste tracking systems regarding branding issues. The
purpose was to test a pure Keller CBBE model and identify what problems would emerge
in its empirical application in a B2B context. A second study was then conducted to
validate the findings and address the limitations of Study 1. A larger sample was tested
using a revised questionnaire that was adapted specifically for the B2B context.
Study 1
Method
Face-to-face interviews were performed with senior management from a waste tracking
company to obtain information about the technologies, market environment, purchase

9
processes and councils. From this, a survey instrument was developed for use with a
sample of councils. The company provided contact details and allowed the use of its brand.
A sample of five Eastern Australian councils was selected for Study 1. Councils were
chosen based on their stage in the purchase decision process and their perceived level of
knowledge about the two main waste tracking brands (the brand using the GPS, from here
on termed Brand A, and the bar code docket system, Brand B). One council was known to
be using Brand A, two were known to be using Brand B, another council was close to
releasing a tender for a system, and the fifth was engaged in initial discussions with the
suppliers.
Respondents within the five councils were Trade Waste Officers who are responsible for
the pick-up and collection of trade waste in their respective shires. They often initiate and
influence the purchase decision, and ultimately use the technology. Interviews were
conducted by telephone and followed a semi-structured format. They lasted up to 35
minutes. The survey consisted of a series of closed and open-ended questions, addressing
each aspect of Keller’s Pyramid. Questions asked respondents about the two waste tracking
brands and were ordered based on the sequence of four steps and six brand building blocks
in the CBBE pyramid. The second part asked respondents how they felt about the
questionnaire to test their view of the content and comprehensiveness of the model. The
aim was to obtain direct feedback from respondents as to their opinion of the suitability of
the approach, and to identify limitations inherent in the Keller structure.
Findings
Study 1 revealed the following:
1. Respondents placed a greater emphasis on the manufacturers’ corporate brand
names rather than the individual product brands, and demonstrated greater
awareness of these, suggesting a B2B brand equity framework needs to give major
attention to the corporate brand names.
2. Respondents identified primarily with company brands and spoke about their
relationships with company representatives rather than product brands.
3. Brand elements such as slogans and brand names lacked relevance to respondents
who explicitly stated they were more interested in the product offering.
10
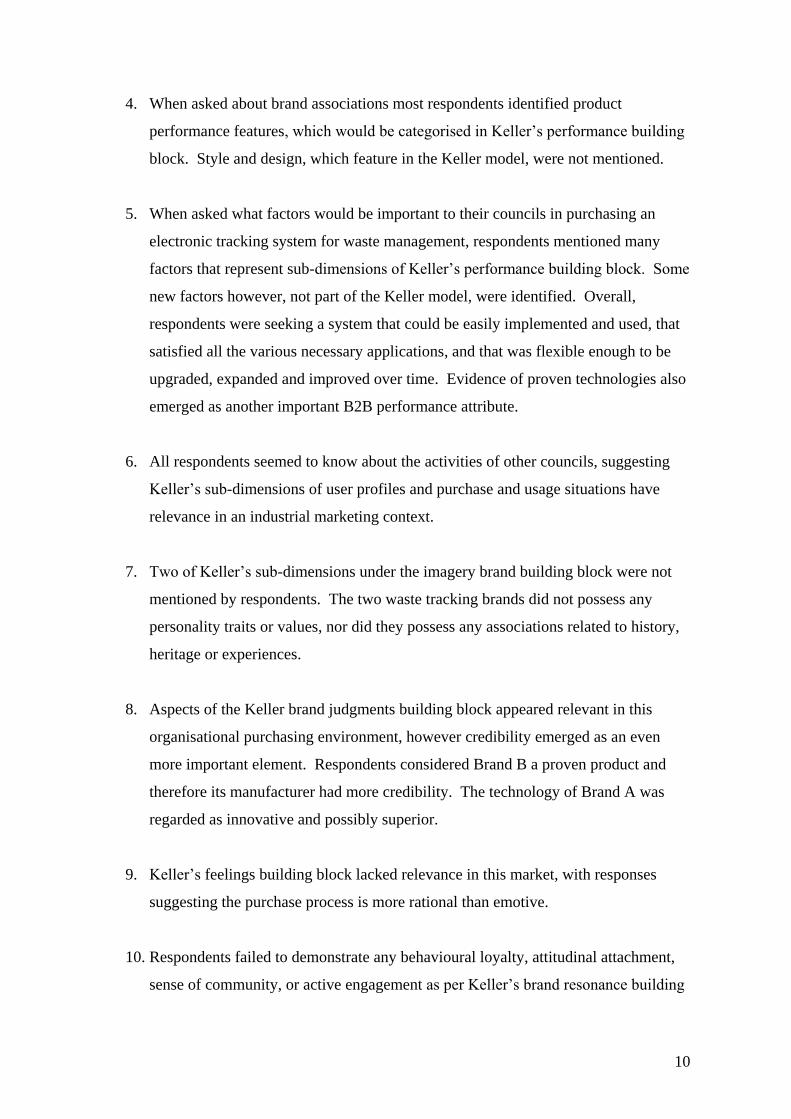
4. When asked about brand associations most respondents identified product
performance features, which would be categorised in Keller’s performance building
block. Style and design, which feature in the Keller model, were not mentioned.
5. When asked what factors would be important to their councils in purchasing an
electronic tracking system for waste management, respondents mentioned many
factors that represent sub-dimensions of Keller’s performance building block. Some
new factors however, not part of the Keller model, were identified. Overall,
respondents were seeking a system that could be easily implemented and used, that
satisfied all the various necessary applications, and that was flexible enough to be
upgraded, expanded and improved over time. Evidence of proven technologies also
emerged as another important B2B performance attribute.
6. All respondents seemed to know about the activities of other councils, suggesting
Keller’s sub-dimensions of user profiles and purchase and usage situations have
relevance in an industrial marketing context.
7. Two of Keller’s sub-dimensions under the imagery brand building block were not
mentioned by respondents. The two waste tracking brands did not possess any
personality traits or values, nor did they possess any associations related to history,
heritage or experiences.
8. Aspects of the Keller brand judgments building block appeared relevant in this
organisational purchasing environment, however credibility emerged as an even
more important element. Respondents considered Brand B a proven product and
therefore its manufacturer had more credibility. The technology of Brand A was
regarded as innovative and possibly superior.
9. Keller’s feelings building block lacked relevance in this market, with responses
suggesting the purchase process is more rational than emotive.
10. Respondents failed to demonstrate any behavioural loyalty, attitudinal attachment,
sense of community, or active engagement as per Keller’s brand resonance building

11
block.
11. When asked about the suitability of the Keller model approach, one respondent
mentioned he was unsure whether he should have responded based on his own
personal perspective or that of his council. This indicates a B2B brand equity model
should take into account the role of the organisation buying centre and the brand
perceptions of all members.
Discussion
Study 1 revealed difficulties in applying a pure Keller model in a B2B context, and
identified further elements potentially in need of inclusion. With the small sample size
however, there was the risk the results were not representative, providing justification for
an extended study with a larger sample to validate the findings. Study 1 also failed to
capture key insights due to the structure of the questionnaire. It was designed based on the
Keller model in its pure form, therefore the purpose of that question set was to assess the
equity of brands of electronic tracking systems for waste management, not their
manufacturers. Respondents who were unaware of the product brand names were not asked
subsequent questions relating to associations, feelings and so on, even if they were aware of
the manufacturer’s brand.
Study 2
The purpose of Study 2 was to take the pure Keller questionnaire from Study 1, adapt it for
B2B based on the feedback and results, and then test the revised survey on a larger sample.
Method
A sample of thirty Eastern Australian local authorities was selected for Study 2. Selection
was based on the population of the region represented (an indicator of whether a council has
a need for an electronic tracking system for waste management is the number of
constituents in the district). From a sample frame of 125 councils, those with less than
10,000 people were eliminated. Of the remaining fifty, thirty were selected based on their
system knowledge. Twenty-six useable responses were obtained.
12
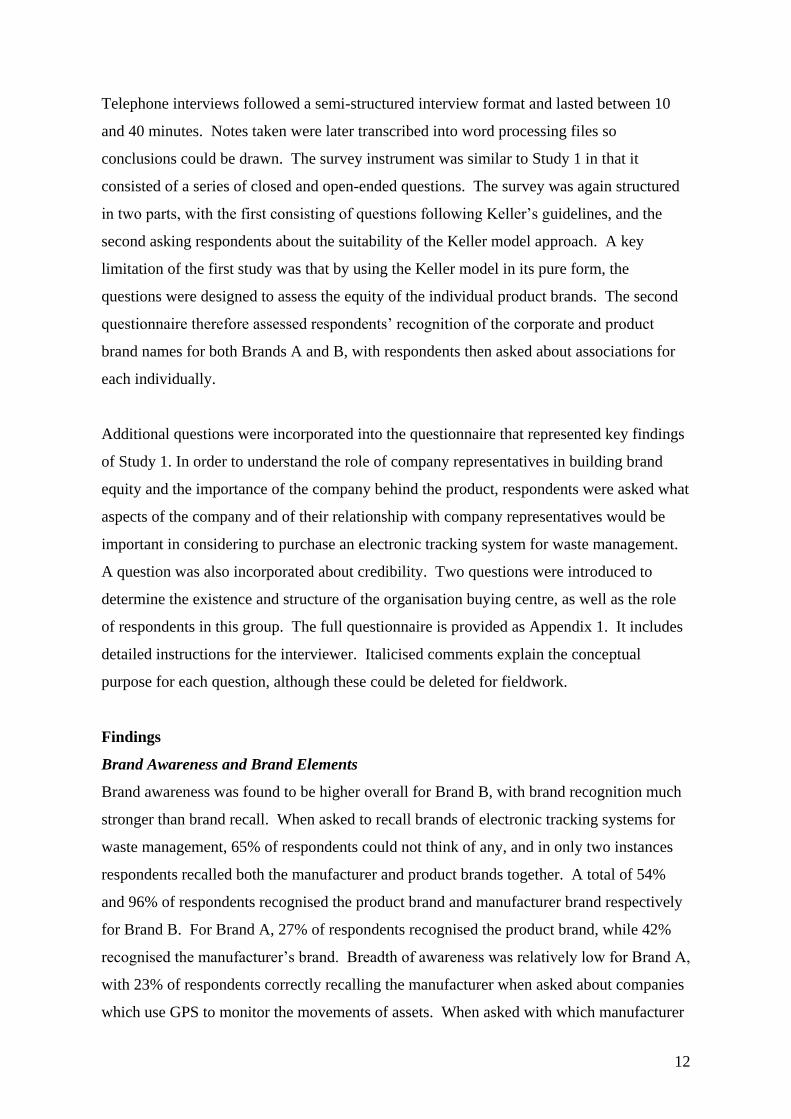
Telephone interviews followed a semi-structured interview format and lasted between 10
and 40 minutes. Notes taken were later transcribed into word processing files so
conclusions could be drawn. The survey instrument was similar to Study 1 in that it
consisted of a series of closed and open-ended questions. The survey was again structured
in two parts, with the first consisting of questions following Keller’s guidelines, and the
second asking respondents about the suitability of the Keller model approach. A key
limitation of the first study was that by using the Keller model in its pure form, the
questions were designed to assess the equity of the individual product brands. The second
questionnaire therefore assessed respondents’ recognition of the corporate and product
brand names for both Brands A and B, with respondents then asked about associations for
each individually.
Additional questions were incorporated into the questionnaire that represented key findings
of Study 1. In order to understand the role of company representatives in building brand
equity and the importance of the company behind the product, respondents were asked what
aspects of the company and of their relationship with company representatives would be
important in considering to purchase an electronic tracking system for waste management.
A question was also incorporated about credibility. Two questions were introduced to
determine the existence and structure of the organisation buying centre, as well as the role
of respondents in this group. The full questionnaire is provided as Appendix 1. It includes
detailed instructions for the interviewer. Italicised comments explain the conceptual
purpose for each question, although these could be deleted for fieldwork.
Findings
Brand Awareness and Brand Elements
Brand awareness was found to be higher overall for Brand B, with brand recognition much
stronger than brand recall. When asked to recall brands of electronic tracking systems for
waste management, 65% of respondents could not think of any, and in only two instances
respondents recalled both the manufacturer and product brands together. A total of 54%
and 96% of respondents recognised the product brand and manufacturer brand respectively
for Brand B. For Brand A, 27% of respondents recognised the product brand, while 42%
recognised the manufacturer’s brand. Breadth of awareness was relatively low for Brand A,
with 23% of respondents correctly recalling the manufacturer when asked about companies
which use GPS to monitor the movements of assets. When asked with which manufacturer

13
respondents associated Brand A, only 28% correctly recalled the manufacturer. When
prompted, all respondents who indicated they did not know, correctly recognised Brand A’s
manufacturer. Awareness of the manufacturer brand names was therefore shown to be
stronger than awareness of the product brands themselves.
For Brand A and its manufacturer, strong associations were evident with GPS tracking,
military technology, and one of the councils currently using the system. Associations for
Brand B and its manufacturer were: waste water/trade waste/bar codes/waste tracking
system, compliance and making sure things are done properly and again, names of councils
using the system. Overall, the majority of respondents listed more associations when asked
about the manufacturers than when asked about the individual product brands. Most of the
associations provided for the manufacturers related to the systems themselves. In many
instances the same associations were listed for the manufacturer and product brands. To
respondents the product brand and manufacturer brand name were synonymous.
Respondents placed more emphasis on the companies behind the brands than the brands
themselves. Two respondents specifically stated they did not use the product brand when
referring to the systems, but rather used the company names to distinguish between
products. When asked about awareness and associations for the manufacturers and the
product brands, other Trade Waste Officers expressed confusion and asked if these were the
same. The results highlight the importance of measuring the equity of manufacturers’
brand names.
Brand B did not have a slogan, but Brand A did. Only two respondents correctly identified
the brand associated with the slogan. The implication for branding appears to be that B2B
buyers care little about product slogans and more about the product offering.
Brand Associations
Key criteria for assessing brand associations in Keller’s model are their perceived
favourability and uniqueness. Trade Waste Officers were therefore asked open-ended
questions about which factors were most favourable, least favourable and most unique
about Brands A and B. Responses mostly referred to features of the products, which would
fall under the Keller building block performance. Respondents focused on aspects of the
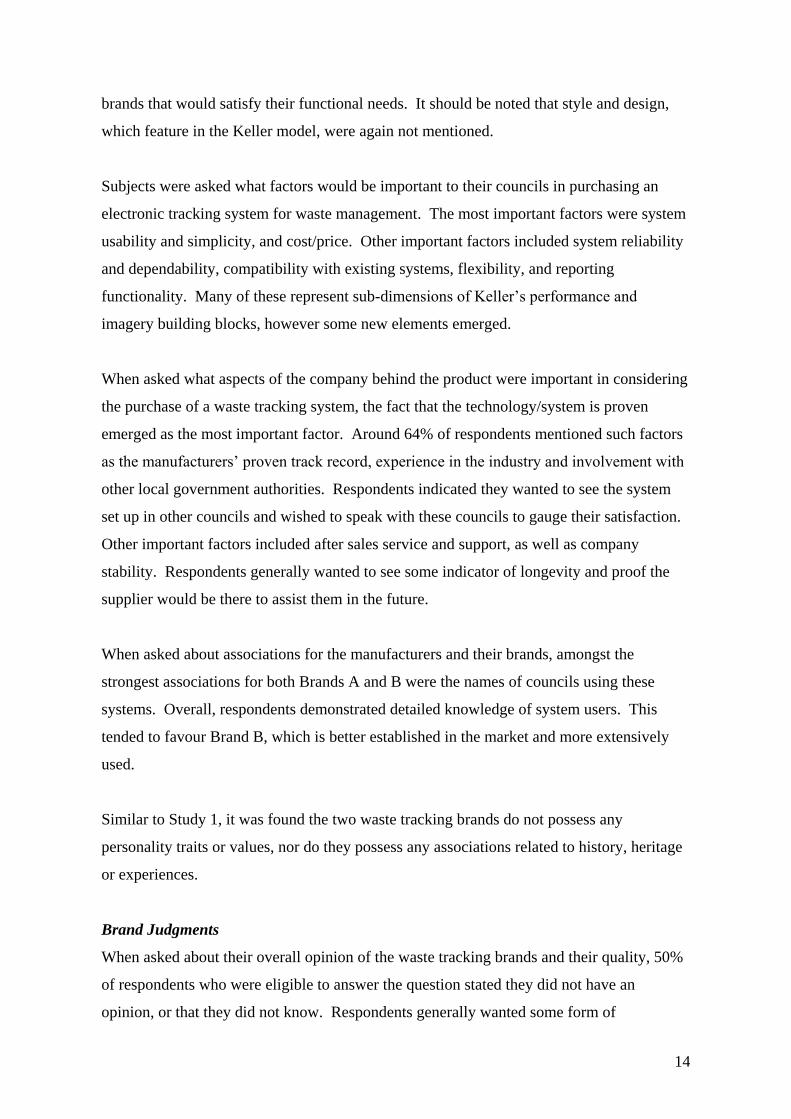
14
brands that would satisfy their functional needs. It should be noted that style and design,
which feature in the Keller model, were again not mentioned.
Subjects were asked what factors would be important to their councils in purchasing an
electronic tracking system for waste management. The most important factors were system
usability and simplicity, and cost/price. Other important factors included system reliability
and dependability, compatibility with existing systems, flexibility, and reporting
functionality. Many of these represent sub-dimensions of Keller’s performance and
imagery building blocks, however some new elements emerged.
When asked what aspects of the company behind the product were important in considering
the purchase of a waste tracking system, the fact that the technology/system is proven
emerged as the most important factor. Around 64% of respondents mentioned such factors
as the manufacturers’ proven track record, experience in the industry and involvement with
other local government authorities. Respondents indicated they wanted to see the system
set up in other councils and wished to speak with these councils to gauge their satisfaction.
Other important factors included after sales service and support, as well as company
stability. Respondents generally wanted to see some indicator of longevity and proof the
supplier would be there to assist them in the future.
When asked about associations for the manufacturers and their brands, amongst the
strongest associations for both Brands A and B were the names of councils using these
systems. Overall, respondents demonstrated detailed knowledge of system users. This
tended to favour Brand B, which is better established in the market and more extensively
used.
Similar to Study 1, it was found the two waste tracking brands do not possess any
personality traits or values, nor do they possess any associations related to history, heritage
or experiences.
Brand Judgments
When asked about their overall opinion of the waste tracking brands and their quality, 50%
of respondents who were eligible to answer the question stated they did not have an
opinion, or that they did not know. Respondents generally wanted some form of
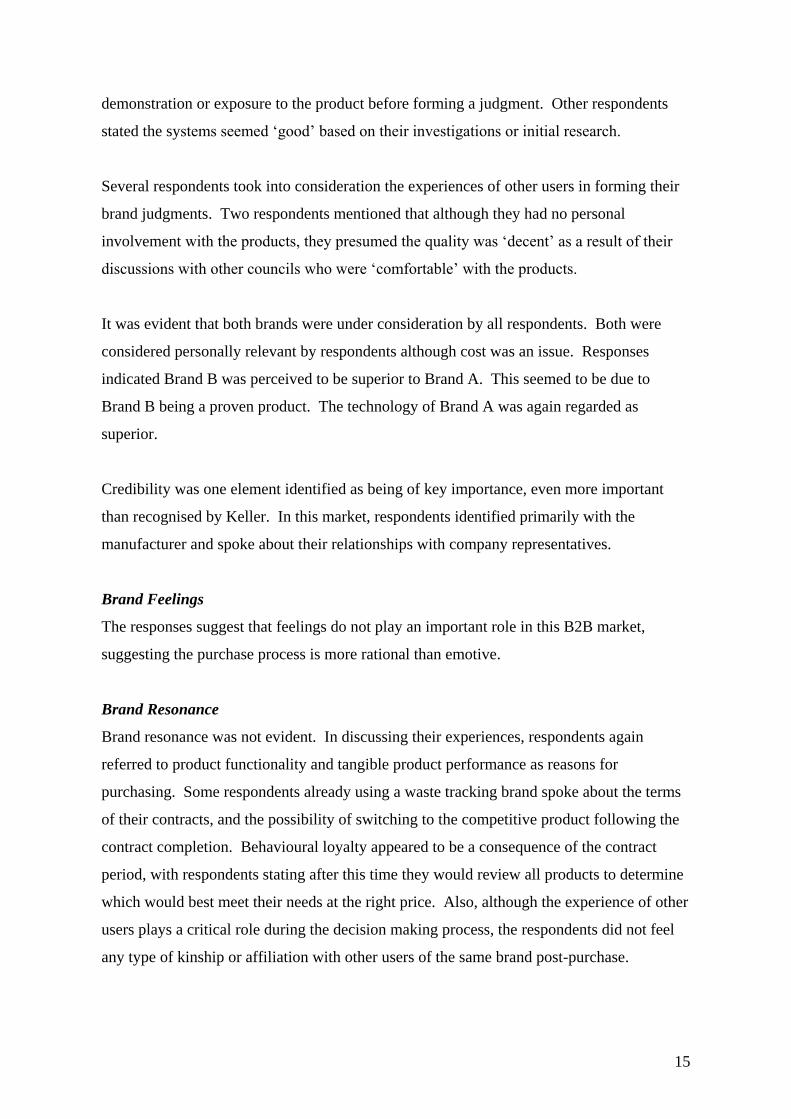
15
demonstration or exposure to the product before forming a judgment. Other respondents
stated the systems seemed ‘good’ based on their investigations or initial research.
Several respondents took into consideration the experiences of other users in forming their
brand judgments. Two respondents mentioned that although they had no personal
involvement with the products, they presumed the quality was ‘decent’ as a result of their
discussions with other councils who were ‘comfortable’ with the products.
It was evident that both brands were under consideration by all respondents. Both were
considered personally relevant by respondents although cost was an issue. Responses
indicated Brand B was perceived to be superior to Brand A. This seemed to be due to
Brand B being a proven product. The technology of Brand A was again regarded as
superior.
Credibility was one element identified as being of key importance, even more important
than recognised by Keller. In this market, respondents identified primarily with the
manufacturer and spoke about their relationships with company representatives.
Brand Feelings
The responses suggest that feelings do not play an important role in this B2B market,
suggesting the purchase process is more rational than emotive.
Brand Resonance
Brand resonance was not evident. In discussing their experiences, respondents again
referred to product functionality and tangible product performance as reasons for
purchasing. Some respondents already using a waste tracking brand spoke about the terms
of their contracts, and the possibility of switching to the competitive product following the
contract completion. Behavioural loyalty appeared to be a consequence of the contract
period, with respondents stating after this time they would review all products to determine
which would best meet their needs at the right price. Also, although the experience of other
users plays a critical role during the decision making process, the respondents did not feel
any type of kinship or affiliation with other users of the same brand post-purchase.
16
Active engagement was not evident. No respondents who had purchased an electronic
tracking system were willing to invest time, energy, money or other resources to get to
know the brands better beyond those expended during purchase and consumption (Keller,
2003). Some Trade Waste Officers indicated they speak with other local government
authorities about the brands they are using, but they did not actively engage in word-of-
mouth communication.
The findings reveal that the application of Keller’s resonance building block in this
organisational context poses difficulties. The buyers generally appeared to keep an
objective, detached perspective (rather than displaying enthusiasm or advocacy). This is a
major difference from consumer brands.
Company Representatives and Brand Equity
The company and its representatives play a major role in building brand equity. When
asked about their relationship with the brand, respondents spoke about their relationships
with company salespeople. This further reinforces that in an industrial context, it is buyers
and sales staff that interact, not customers and brands as in the consumer environment.
When asked what aspects of their relationship with the sales team and other company
representatives would be important in purchasing an electronic tracking system,
respondents offered a number of insights. The most important factor was the ability to
contact company representatives, followed by after-sales service/support, and staff honesty.
Respondents expressed their desire to have sales staff understand their individual needs and
work in partnership with them to satisfy requirements.
The Organisation Buying Centre
Prior research going back many years has shown the importance of the organisational
buying centre (see, for example, Robinson et al., 1967; Sheth, 1973; Spekman and Stern,
1979; Webster and Wind, 1972). For almost all respondents in the current study, the
decision to purchase is made by a buying centre, which involves a number of parties from
across the organisation. There was no uniform structure identified across the councils
surveyed, however all but one respondent mentioned others would be involved in the
decision in some way. In several cases external parties connected to council were also
directly involved, such as ratepayers and contracted transporters. Respondents expressed
concern about the impact of the technology on these users. Almost a quarter expressed

17
concern about equipment installation on the waste trucks specifically. Cost was also an
important factor and respondents spoke about who would willingly bear this. Finally,
almost 100% mentioned the regulatory body and its impact on the decision making process.
Discussion
The findings of the second study support those of Study 1, and reveal a number of
dimensions that should be considered when measuring the equity of B2B brands. Many of
these dimensions are found in Keller’s framework, however the emphasis on some of these
dimensions differs. Further factors have also been identified. We present a revised model
at Figure 2.
Take in Figure 2
Overall, assessing the brand equity of the corporate or manufacturer brand names would
seem more appropriate in a B2B context than measuring the equity of the individual
product brands. Second, the salience, performance, imagery and judgments building blocks
are applicable in an organisational context, although differences in the sub-dimensions for
these blocks have been identified. Some brand elements such as product slogans appear to
lack relevance to organisational buyers, while user profiles, purchase and usage situations
and credibility are even more important than suggested by Keller. Feelings did not play a
role in the industrial marketing context and the pinnacle of Keller’s CBBE pyramid,
resonance, may need modifications to be more relevant. Company representatives play a
role in building brand equity, thus indicating a need for this human element to be
recognised in a B2B brand equity model
An issue for a single industry case study such as this is of course that of generalisability, but
the findings are consistent with those of Mudambi (2002). Mudambi’s research identified
three clusters of B2B customers, each of which differs in terms of the importance of
branding in the purchase decision. Respondents in the current study most closely identify
with her “highly tangible cluster” as they indicated physical product improvements were
important, and their focus was on tangible, quantifiable and objective benefits of the
products and their manufacturers. The emotional and self-expressive benefits were
unimportant, but respondents highlighted the need for support from well-established,
18
reputable and flexible manufacturers. They acknowledged the importance of a high quality
physical product as well as augmented services. Mudambi claims a combination of a strong
company brand and an effort to differentiate individual brands is likely to be most effective
with firms in this cluster, as they are less receptive to branding. This appears to be the case
in the current study.
The generalisability of our findings may be stronger for industries fitting into Mudambi’s
highly tangible cluster. Our questionnaire however is general enough to pick up relevant
associations from other Mudambi industry clusters (such as where feelings are important),
and therefore could be used as a first step in considering how to measure brand equity.
Limitations and Future Research
This research begins the assessment and adaptation of a major brand equity model for the
B2B context, but it is by no means the end. Although insights and challenges have been
identified in applying Keller’s CBBE model, there is a risk the results may represent
industry-specific factors that are not representative of all B2B markets. One potential
limitation of the study is that no distinction was made between the B2B and business-to-
government environments. This represents a future research opportunity (though we
suspect the basic B2B brand equity framework would apply to both). Further, in choosing
trade waste management for investigation, it is possible context-specific factors even within
the Mudambi highly tangible cluster may have implications limited to this market. Those
aspects that were not important in the industry studied could be important in other
industries. Further research is therefore required to validate the findings in different
industrial marketing contexts.
The advantage of the current study is that it captures detailed insights and key lessons from
the field with regards to how B2B brand equity should be conceptualised and measured, by
investigating real brands with real potential B2B buyers. This study is both accessible and
appropriate for marketing practitioners, and even makes available a tested questionnaire
adapting Keller’s model. Though there are unresolved issues, it is still the most developed
questionnaire available in the literature, which can serve as a starting point for managers’
and researchers’ B2B brand equity research.

19
APPENDIX 1: Questionnaire

20
Section 1: The Waste Management Industry Q1 When you think of companies which use the
Global Positioning System or GPS to monitor the
movements of assets such as vehicles and
equipment, what brands can you think of?
(Allow the respondent to name as many as they can)
(Salience-awareness-depth-recall-product category)
1______________________________________
2______________________________________
3______________________________________
4______________________________________
5______________________________________
6______________________________________
7 Can’t think of any/ Don’t know
Q2 When you think of electronic tracking systems for
waste management, what brands can you think of?
(Allow the respondent to name as many as they can)
(Salience-awareness-depth-recall-product)
1______________________________________
2______________________________________
3______________________________________
4______________________________________
5______________________________________
6______________________________________
7 Can’t think of any/ Don’t know
Q3 Answering yes or no, have you ever heard of these
brands? (Salience-awareness-breadth-recognition)
Yes No
a) Brand A 1 2
b) Manufacturer A 1 2
c) Brand B 1 2
d) Manufacturer B 1 2
e) Brand C 1 2
f) Manufacturer C 1 2
g) Brand D 1 2
Q4 When I say Brand A, what are the first
associations that come to your mind? Anything
else? (ASK QUESTION ONLY IF RESPONDENT ANSWERS
YES IN Q3a). (Allow the respondent to name as many as
they can. Prompt for further responses)
(Salience-awareness & usage-brand specific OR Imagery-
brand meaning-brand associations)
1______________________________________
2______________________________________
3______________________________________
4______________________________________
5______________________________________
6______________________________________
7 Can’t think of any/ Don’t know
8 N/A (Not aware of Brand A)
Q5 When I say Brand B, what are the first associations that come to your mind? Anything
else? (ASK QUESTION ONLY IF RESPONDENT ANSWERS
YES IN Q3c)
(Allow the respondent to name as many as they can.
Prompt for further responses)
(Competitor salience-awareness & usage-brand specific
OR Competitor imagery-brand meaning-brand
associations)
1______________________________________
2______________________________________
3______________________________________
4______________________________________
5______________________________________
6______________________________________
7 Can’t think of any/ Don’t know
8 N/A (Not aware of Brand B)
Q6 With which company do you associate Brand A?
(ASK QUESTION ONLY IF RESPONDENTANSWERS
YES IN Q3a).
(Salience-awareness-depth-recall-company/brand
association)
1______________________________________
2 Can’t think of any/ Don’t know
3 N/A (Not aware of Brand A)
Q7 Do you associate Brand A with…?
(ASK QUESTION ONLY IF RESPONDENT ANSWERS
‘DON’T KNOW’ IN Q6, OTHERWISE INDICATE THEIR
RESPONSE BELOW BASED ON THE PREVIOUS
QUESTION)
(Salience-awareness-breadth-recognition-company/brand
association)
1 Manufacturer A
2 Manufacturer E
3 Manufacturer B
4 A company other than those already specified
5 N/A (Not aware of Brand A)
Q8 When I say Manufacturer A, what are the first
associations that come to your mind? Anything
else? (ASK QUESTION ONLY IF RESPONDENT ANSWERS
YES IN Q3b).
(Allow the respondent to name as many as they can.
Prompt for further responses)
(Salience-awareness & usage-company specific OR
Imagery-brand meaning-company associations)
1______________________________________
2______________________________________
3______________________________________
4______________________________________
5______________________________________
6______________________________________
7 Can’t think of any/ Don’t know
8 N/A (Not aware of Manufacturer A)
21
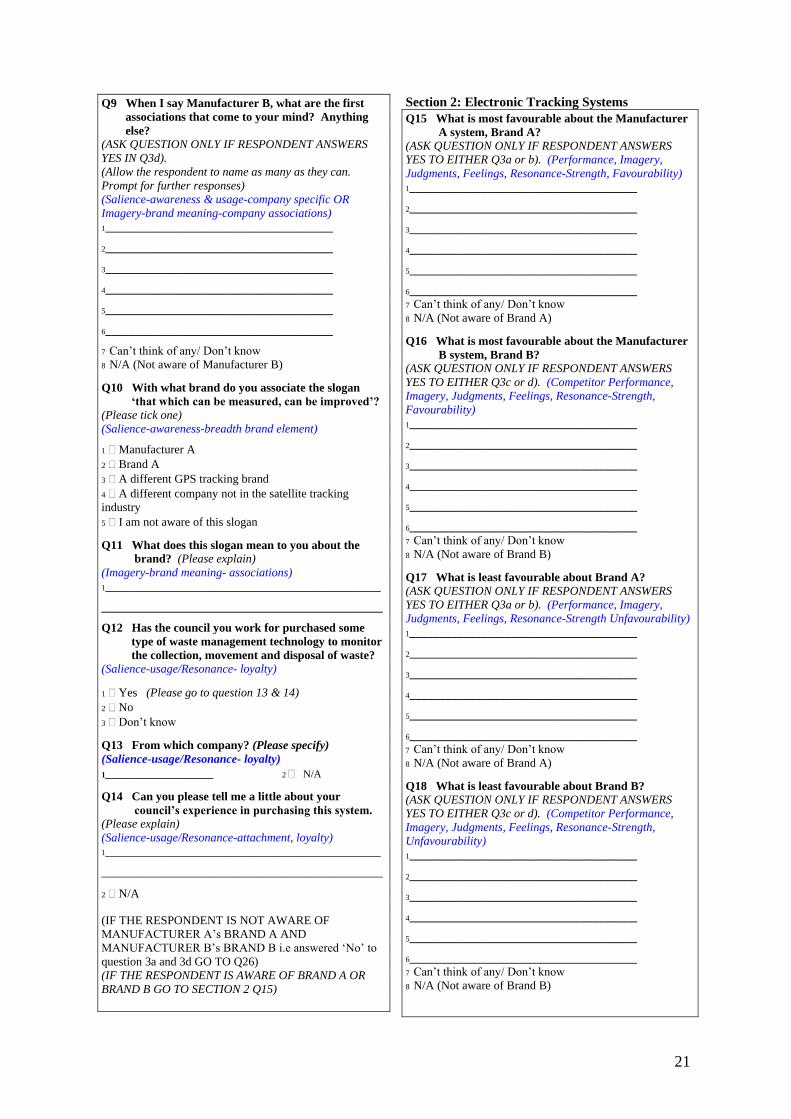
Q9 When I say Manufacturer B, what are the first
associations that come to your mind? Anything
else? (ASK QUESTION ONLY IF RESPONDENT ANSWERS
YES IN Q3d).
(Allow the respondent to name as many as they can.
Prompt for further responses)
(Salience-awareness & usage-company specific OR
Imagery-brand meaning-company associations)
1______________________________________
2______________________________________
3______________________________________
4______________________________________
5______________________________________
6______________________________________
7 Can’t think of any/ Don’t know
8 N/A (Not aware of Manufacturer B)
Q10 With what brand do you associate the slogan
‘that which can be measured, can be improved’?
(Please tick one)
(Salience-awareness-breadth brand element)
1 Manufacturer A
2 Brand A
3 A different GPS tracking brand
4 A different company not in the satellite tracking
industry
5 I am not aware of this slogan
Q11 What does this slogan mean to you about the
brand? (Please explain)
(Imagery-brand meaning- associations)
1______________________________________________
_______________________________________________
Q12 Has the council you work for purchased some
type of waste management technology to monitor
the collection, movement and disposal of waste?
(Salience-usage/Resonance- loyalty)
1 Yes (Please go to question 13 & 14)
2 No
3 Don’t know
Q13 From which company? (Please specify)
(Salience-usage/Resonance- loyalty) 1__________________ 2 N/A
Q14 Can you please tell me a little about your
council’s experience in purchasing this system.
(Please explain)
(Salience-usage/Resonance-attachment, loyalty)
1______________________________________________
_______________________________________________
2 N/A
(IF THE RESPONDENT IS NOT AWARE OF
MANUFACTURER A’s BRAND A AND
MANUFACTURER B’s BRAND B i.e answered ‘No’ to
question 3a and 3d GO TO Q26)
(IF THE RESPONDENT IS AWARE OF BRAND A OR
BRAND B GO TO SECTION 2 Q15)
Section 2: Electronic Tracking Systems
Q15 What is most favourable about the Manufacturer
A system, Brand A?
(ASK QUESTION ONLY IF RESPONDENT ANSWERS
YES TO EITHER Q3a or b). (Performance, Imagery,
Judgments, Feelings, Resonance-Strength, Favourability)
1______________________________________
2______________________________________
3______________________________________
4______________________________________
5______________________________________
6______________________________________ 7 Can’t think of any/ Don’t know
8 N/A (Not aware of Brand A)
Q16 What is most favourable about the Manufacturer
B system, Brand B?
(ASK QUESTION ONLY IF RESPONDENT ANSWERS
YES TO EITHER Q3c or d). (Competitor Performance,
Imagery, Judgments, Feelings, Resonance-Strength,
Favourability)
1______________________________________
2______________________________________
3______________________________________
4______________________________________
5______________________________________
6______________________________________ 7 Can’t think of any/ Don’t know
8 N/A (Not aware of Brand B)
Q17 What is least favourable about Brand A?
(ASK QUESTION ONLY IF RESPONDENT ANSWERS
YES TO EITHER Q3a or b). (Performance, Imagery,
Judgments, Feelings, Resonance-Strength Unfavourability)
1______________________________________
2______________________________________
3______________________________________
4______________________________________
5______________________________________
6______________________________________ 7 Can’t think of any/ Don’t know
8 N/A (Not aware of Brand A)
Q18 What is least favourable about Brand B?
(ASK QUESTION ONLY IF RESPONDENT ANSWERS
YES TO EITHER Q3c or d). (Competitor Performance,
Imagery, Judgments, Feelings, Resonance-Strength,
Unfavourability)
1______________________________________
2______________________________________
3______________________________________
4______________________________________
5______________________________________
6______________________________________
7 Can’t think of any/ Don’t know
8 N/A (Not aware of Brand B)

22
Q19 What is unique about Brand A?
(ASK QUESTION ONLY IF RESPONDENT ANSWERS
YES TO EITHER Q3a or b).
(Performance, Imagery, Judgments, Feelings, Resonance-
Uniqueness)
1______________________________________
2______________________________________
3______________________________________
4______________________________________
5______________________________________
6______________________________________ 7 Can’t think of any/ Don’t know
8 N/A (Not aware of Brand A)
Q20 What is unique about Brand B?
(ASK QUESTION ONLY IF RESPONDENT ANSWERS
YES TO EITHER Q3c or d).
(Competitor Performance, Imagery, Judgments, Feelings,
Resonance- Uniqueness)
1______________________________________
2______________________________________
3______________________________________
4______________________________________
5______________________________________
6______________________________________ 7 Can’t think of any/ Don’t know
8 N/A (Not aware of Brand B)
Q21 What are your feelings towards the Brand A
brand? Why? (Please explain)
(ASK QUESTION ONLY IF RESPONDENT ANSWERS
YES TO Q3a). (Feelings)
1______________________________________________
_______________________________________________
Q22 How would you describe your relationship with
the Brand A brand?
(ASK QUESTION ONLY IF RESPONDENT ANSWERS
YES TO Q3a).
(Resonance-attitudinal attachment)
1______________________________________________
_______________________________________________
Q23 What is your overall judgment of Manufacturer
A and their credibility?
(ASK QUESTION ONLY IF RESPONDENT ANSWERS
YES TO Q3b).
(Judgment-credibility)
1______________________________________________
_______________________________________________
Q24 How would you describe your relationship with
Manufacturer A and its representatives?
(ASK QUESTION ONLY IF RESPONDENT ANSWERS
YES TO Q3b).
(Resonance-community)
1______________________________________________
_______________________________________________
Q25 What is your overall opinion of the Brand A and/or Brand B brands and their quality? (Judgments-brand quality)
1______________________________________________
_______________________________________________
Q26 In considering to purchase an electronic tracking
system for waste management, what is or what
would be important to your council?
(Performance, Imagery, Judgments, Feelings, Resonance-
Strength, Favourability)
1______________________________________
2______________________________________
3______________________________________
4______________________________________
5______________________________________
6______________________________________
7 Can’t think of any/ Don’t know
Q27 In considering to purchase an electronic tracking
system for waste management, what aspects of
the company behind the product would be
important? Why?
(EXTRA: Company qualities eg mkt share, rep etc.)
1______________________________________________
_______________________________________________
Q28 What aspects of your relationship with the sales
team and other company representatives would
be important? Why?
(EXTRA: Relationship with the sales team)
1______________________________________________
_______________________________________________
Q29 In considering the purchase of an electronic
tracking system for waste management, who
would be involved in the decision to purchase?
(EXTRA: Organisational buying centre)
1______________________________________________
_______________________________________________
Q30 Would the other participants in the decision
making be aware of Brand A or Brand B, and if
not, would it be your job to educate them?
(EXTRA: Organisational buying centre)
1______________________________________________
_______________________________________________
Q31 What are other councils doing at present? Have
you had any contact with them?
(EXTRA: Monitoring other users and the importance of
customer referrals)
1______________________________________________
_______________________________________________

23
Q32 What do you think about councils who use Brand
A or other electronic tracking systems for waste
management? (Ask which they are referring to)
(Imagery-user profiles)
1______________________________________________
_______________________________________________
Q33 How interested would you be in learning more
about Brand A? 1 2 3 4 [___________[____________[____________] 5 Don’t know
Very Somewhat Not Very Not at all
Interested Interested Interested Interested
Q34 How interested would you be in learning more
about Brand B? 1 2 3 4 [___________[____________[____________] 5 Don’t know
Very Somewhat Not Very Not at all
Interested Interested Interested Interested
Q35 To what extent would you be willing to invest
time, energy, money or other resources to get to
know the brands better? Eg. Investing time to
learn more about the brand, visiting the web site,
talking to others about the brand.
(ASK QUESTION ONLY IF RESPONDENT ANSWERS
YES TO Q12).
(Resonance-engagement)
1______________________________________________
_______________________________________________
_______________________________________________
Section 3: Respondents’ Views of the Survey and
Applicability of the Keller Model I would now like to ask for your help in improving this
survey.
Q36 How did you find this questionnaire? Would you
make any changes to this survey if you were
investigating brand equity of electronic tracking
systems for waste management? (Please explain)
1______________________________________________
_______________________________________________
_______________________________________________
Q37 Do you have anything that you would like to add
before we conclude?
1______________________________________________
_______________________________________________
_______________________________________________
(CLOSING DIALOGUE) ‘That concludes the survey.
Thank you very much for your participation. If I have
further questions or if I require further advice can I
please contact you again in the future? ______ Thank
you. I appreciate your time. (WAIT) Have a nice day.
Good-bye’
(FILL IN CONTACT DETAILS IN SECTION 4 ALREADY
KNOWN AFTER HANGING UP FROM RESPONDENT.
COMPLETE SECTIONS 5 & 6 AFTER HANGING UP
FROM RESPONDENT.)
Section 4:Contact Details (Complete after hanging up from respondent)
Title: Mr / Mrs / Ms / Miss
Family Name: _________________________________
Given Names: _________________________________
Job Title: _____________________________________
Organisation: __________________________________
Work Phone: ( )______________________________
Section 5:Demographics (Complete after hanging up from respondent)
Q1 Number of liquid waste generators in the council’s
region?
1__________________ 2 Don’t know
Q2 Number of constituents/rate payers in the
council’s region?
1__________________ 2 Don’t know
Q3 Region of council?
1__________________ 2 Don’t know
Q4 Area of council - per capita per hectare?
1__________________ 2 Don’t know
Section 6:Additional Notes (Complete after hanging up from respondent)
WRITE IN REACTIONS TO QUESTIONS

24
FIGURE 1:
Keller’s Customer-Based Brand Equity Pyramid
Resonance
Judgments Feelings
Performance Imagery
Salience
Source: Keller, 2003
1. Identity
Who are you?
2. Meaning
What are you?
3. Response
What about you?
4. Relationships
What about you and me?

25
FIGURE 2:
A Revised Customer-Based Brand Equity Pyramid for B2B
Partnership
Solutions
Sales
Judgments Force
Relationships
Performance Reputation
Salience of the Manufacturer’s Brand
Source: Keller, 2003 and the current study
1. Identity
Who are you?
2. Meaning
What are you?
3. Response
What about you?
4. Relationships
What about you and me?

26
References
Aaker, D.A. (1991), Managing Brand Equity: Capitalising on the Value of a Brand Name,
Free Press, New York.
Aaker, D.A. (1996), Building Strong Brands, Free Press, New York.
Aaker, D.A. and Jacobson, R. (2001) “The value relevance of brand attitude in high-
technology markets”, Journal of Marketing Research, Vol 38 No 4, pp. 485-494.
Abratt, R. (1986) “Industrial buying in high-tech markets”, Industrial Marketing
Management, Vol 15 No 4, pp. 293-298.
Abratt, R. and Mofokeng, T.N. (2001) “Development and management of corporate image
in South Africa”, European Journal of Marketing, Vol 35 No 3/4, pp. 368-386.
Ambler, T. (1995) “Building brand relationships”, Financial Times Mastering Management
Series, Vol Dec No 6, pp. 8-11.
Bendixen, M., Bukasa, K.A. and Abratt, R. (2004) “Brand equity in the business-to-
business market”, Industrial Marketing Management, Vol 33 No 5, pp. 371-380.
Collins, L. (1977) “A name to conjure with - A discussion of the naming of new brands”,
European Journal of Marketing, Vol 11 No 5, pp. 339-363.
Ghingold, M. and Wilson, D.T. (1998) “Buying centre research and business marketing
practice: Meeting the challenge of dynamic marketing”, The Journal of Business and
Industrial Marketing, Vol 13 No 2, pp. 96-108.
Gordon, G.L., Calantone, R.J. and di Benedetto, A.C. (1993) “Brand equity in the business-
to-business sector: An exploratory study”, Journal of Product and Brand Management, Vol
2 No 3, pp. 4-16.
Grace, D. and O’Cass, A. (2002) “Brand associations: Looking through the eye of the
beholder”, Qualitative Market Research, Vol 5 No 2, pp. 96-111.
Gylling, C. and Lindberg-Repo, K. (2006) “Investigating the links between a corporate
brand and a customer brand”, Journal of Brand Management, Vol 13 No 4/5, pp. 257-267.
Hogg, G., Carter, S. and Dunne, A. (1998) “Investing in people: Internal marketing and
corporate culture”, Journal of Marketing Management, Vol 14 No 8, pp. 879-895.
Hutt, M.D. and Speh, T.W. (1998), Business Marketing Management: A Strategic View of
Industrial and Organisational Markets, 6th Ed, Dryden Press, Fort Worth.
27
Hutton, J.G. (1997) “A study of brand equity in an organisational-buying context”, Journal
of Product and Brand Management, Vol 6 No 6, pp. 428-439.
Keller, K.L. (1993) “Conceptualising, measuring and managing customer-based brand
equity”, Journal of Marketing, Vol 57 No 1, pp. 1-22.
Keller, K.L. (2001) “Building customer-based brand equity”, Marketing Management, Vol
10 No 2, pp. 14-19.
Keller, K.L. (2003), Strategic Brand Management: Building, Measuring and Managing
Brand Equity, 2nd Ed, Prentice Hall, New Jersey.
Kennedy, S.H. (1977) “Nurturing corporate images”, European Journal of Marketing, Vol
11 No 1, pp. 120-164.
Kotler, P. and Keller, K. (2005), Marketing Management, 12th Ed, Prentice Hall, New
Jersey.
Lorge, S. (1998) “Better off branded”, Sales and Marketing Management, Vol 150 No 3,
pp. 39-42.
Low, J. and Blois, K. (2002) “The evolution of generic brands in industrial markets: The
challenges to owners of brand equity”, Industrial Marketing Management, Vol 31 No 5, pp.
385-392.
Lynch, J. and de Chernatony, L. (2004) “The power of emotion: Brand communication in
business-to-business markets”, Journal of Brand Management, Vol 11 No 5, pp. 403-419.
McEnally, M.R. and de Chernatony, L. (1999) “The evolving nature of branding: Consumer
and managerial considerations”, Academy of Marketing Science Review, Vol 1999 No 2, p
1.
Michell, P., King, J. and Reast, J. (2001) “Brand values related to industrial products”,
Industrial Marketing Management, Vol 30 No 5, pp. 415-425.
Mitchell, V.W. (1995) “Organisational risk perception and reduction: A literature review”,
British Journal of Management, Vol 6 No 2, pp. 115-134.
Morris, M.H., Berthon, P. and Pitt, L.F. (1999) “Assessing the structure of industrial buying
centres with multivariate tools”, Industrial Marketing Management, Vol 28 No 3, pp. 263-
276.
28
Mudambi, S. (2002) “Branding importance in business-to-business markets: Three buyer
clusters”, Industrial Marketing Management, Vol 31 No 6, pp. 525-533.
Mudambi, S., Doyle, P. and Wong, V. (1997) “An exploration of branding in industrial
markets”, Industrial Marketing Management, Vol 26 No 5, pp. 433-446.
Robinson, P.J., Faris, C.W. and Wind, Y. (1967), Industrial Buying and Creative
Marketing, Allyn and Bacon, Boston.
Rosenbroijer, C.J. (2001) “Industrial brand management: A distributor’s perspective in the
UK fine-paper industry”, Journal of Product and Brand Management, Vol 10 No 1, pp. 7-
25.
Rozin, R.S. (2004) “Buyers in business-to-business branding”, Journal of Brand
Management, Vol 11 No 5, p 344-345.
Saunders, J.A. and Watt, F.A. (1979) “Do brand names differentiate identical industrial
products?”, Industrial Marketing Management, Vol 8 No 2, pp. 114-123.
Selnes, F. (1993) “An examination of the effect of product performance on brand
reputation, satisfaction and loyalty”, European Journal of Marketing, Vol 27 No 9, pp. 19-
35.
Shaw, J., Giglierano, J. and Kallis, J. (1989) “Marketing complex technical products: The
importance of intangible attributes”, Industrial Marketing Management, Vol 18 No 1, pp.
45-53.
Sheth, J.N. (1973) “A model of industrial buyer behaviour”, Journal of Marketing, Vol 37
No 4, pp. 50-56.
Spekman, R.E. and Stern, L.W. (1979) “Environmental uncertainty and buying group
structure: An empirical investigation”, Journal of Marketing, Vol 43 No 2, pp. 54-64.
Thompson, K.E., Knox, S.D. and Mitchell, H.G. (1997/1998) “Business to business brand
attributes in a changing purchasing environment”, Irish Marketing Review, Vol 10 No 2,
pp. 25-32.
Tilley, C. (1999) “Built-in branding: How to engineer a leadership brand”, Journal of
Marketing Management, Vol 15, pp. 181-191.
Webster, F.E. and Wind, Y. (1972) “A general model for understanding organisational
buying behaviour”, Journal of Marketing, Vol 36 No 2, pp. 12-19.

29
Webster Jr, F.E. and Keller, K.L. (2004) “A roadmap for branding in industrial markets”,
Journal of Brand Management, Vol 11 No 5, pp. 388-402.
Wilson, E.J. and Woodside, A.G. (2001) “Executive and consumer decision processes:
Increasing useful sensemaking by identifying similarities and departures”, Journal of
Business and Industrial Marketing, Vol 16 No 5, pp. 401-414.
Zajas, J. and Crowley, E. (1995) “Commentary: Brand emergence in the marketing of
computers and high technology products”, Journal of Product and Brand Management, Vol
4 No 1, pp. 56-63.