an analytical assessment of the risks to the
TRANSCRIPT

An analytical assessment of the risks to thesustainability of the Portuguese public debt
Cláudia BrazBanco de Portugal
Maria Manuel CamposBanco de Portugal
October 2019
AbstractIn spite of recent favourable developments in sovereign debt markets and the strengthenedinstitutional framework at the European level, in several euro area countries - includingPortugal - the high government debt ratios remain a source of concern. This article presentsan analytical assessment of the sustainability of the Portuguese public debt, partly basedon a framework for debt sustainability analysis (DSA) developed by the Eurosystem in2015. The analysis shows that risks to sustainability have diminished in the recent past,although remaining elevated. In addition, it suggests that continued improvements in therisk assessment of Portuguese public debt are likely in a context of sound fiscal policies anda benign internal and external environment. (JEL: H60, H63, H68)
Introduction
In spite of recent favourable developments in sovereign debt markets andthe strengthened institutional framework at the European level, in severaleuro area countries - including Portugal - the elevated government
debt ratios remain a source of concern. This makes the assessment ofgovernment liquidity and solvency crucial for policy makers and the generalpublic. Liquidity is related to the ability of governments to service short-run commitments and to roll-over maturing debt at reasonable cost. In turn,solvency represents the governments’ ability to generate future primarybudget surpluses whose net present value is, at least, as high as the net presentvalue of the outstanding stock of debt, so that its inter-temporal budgetconstraint is fulfilled.1
Frameworks for debt sustainability analysis (DSA) allow assessing gov-ernments’ liquidity and solvency conditions, while providing a synthetic
Acknowledgements: The authors gratefully acknowledge the technical support and suggestionsby Nuno Alves, Othman Bouabdallah, Cristina Checherita-Westphal, Jorge Cunha, SimonePesce, Pedro Próspero, Paulo Rodrigues, João Semeano and Ana Sequeira. The analyses,opinions and findings of this paper represent the views of the authors, which are not necessarilythose of Banco de Portugal or the Eurosystem.E-mail: [email protected]; [email protected]. Refer to Amador et al. (2016) and Bouabdallah et al. (2017) for a thorough discussion on therelevant concepts related to debt sustainability.

Banco de Portugal Economic Studies 2
manner of conveying policy-relevant messages. Most international institu-tions have been using DSA frameworks to assess the risks to public financessustainability for several decades. Their relevance was confirmed by theeuro area sovereign debt crisis and the mounting of public debt ratios.These methodologies have evolved over time, becoming more thorough andcomplex, but remain very much conditional on (more or less) conventionalassumptions. The future path of debt is subject to many drivers and highlyuncertain.
The European Commission introduced in 2014 a DSA tool (EuropeanCommission 2014) which has been subject to refinements and improvementsthereafter. It is used regularly in several analyses and published reports (seeBox 1 for further details) and is an important part of the European Union (EU)multilateral fiscal surveillance mechanism, with explicit references to debtsustainability in several Stability and Growth Pact (SGP) provisions.
In 2015, the Eurosystem developed a comprehensive DSA framework foreuro area sovereigns that has been used in the context of fiscal surveillancefor the analysis of risks and vulnerabilities (Bouabdallah et al. 2017). TheEurosystem framework was reviewed in 2018 and further refinementsintroduced.2 This framework comprises three main building blocks: (i) adeterministic DSA; (ii) a stochastic DSA; and (iii) a block of other relevantindicators capturing liquidity and solvency risks. The information embeddedin the three blocks can be condensed into an overall four-colour heat map ofdebt sustainability risks (red for very high risk, orange for high risk, yellow formedium risk and green for contained risk), providing guidance on the overallassessment of risks to debt sustainability.
This article analyses the developments in the assessment of the risks toPortuguese public debt sustainability on the basis of the different blocksdefined in the Eurosystem DSA tool. In addition, for a synthetic analysis,three different weighting schemes are proposed, based on expert judgement,to determine an overall risk score. It is concluded that risks to sustainabilityhave diminished in the recent past, as the benchmark deterministic scenario isbecoming more favourable and several other indicators have been showingsigns of improvement. On the basis of balanced choices for the weightingschemes, Portugal would be classified in the orange category, showing highrisks to public debt sustainability. However, the adoption of sound fiscalpolicies, coupled with a benign internal and external environment wouldallow the maintenance of the downward risk trajectory.
This article is organised as follows. After an overview of the Eurosystemmethodology, three sections describe the main blocks of this framework. Eachsection presents a description of the indicators, the quantitative criteria for the
2. Based on the technical work of a Eurosystem team coordinated by C. Checherita-Westphal(ECB) (see Checherita-Westphal et al. (2018)). This work benefited from further feedback andcomments provided by the members of the Working Group on Public Finance (WGPF).

3
respective evaluation and an illustration with the current results for Portugal.The following section analyses the developments since 2015 in Portugal ineach of the three main blocks and computes an overall risk score on the basis ofproposed alternative aggregation schemes. Finally, the last section concludes.
Overview of the Eurosystem methodology
Ideally, a DSA tool should be as comprehensive as possible and encompassmedium to long-term debt projections based on credible and realisticassumptions (both economically and politically). Sensitivity analyses toadverse shocks should also be considered. Moreover, it should include abroad-based set of indicators and instruments capable of signalling as muchas possible a wide range of risks. These should be sufficient to gauge the short-term liquidity risks, as well as those related to long-term solvency.
The DSA framework developed in Bouabdallah et al. (2017) and used inthe context of the Eurosystem takes these concerns into account. Indeed, theDSA entails three blocks: a deterministic block; a stochastic block; and a blockof "other indicators" - see Table 1 for a schematic depiction.
Deterministic block Stochastic OtherBenchmark Shock scenarios block indicators
Blo
cks
Rule-basedcentral scenario
Narrative shocks aroundthe benchmark: (1) No-fiscal policy change withageing costs; (2) Historical;(3) Combined stress test;(4) Interest rate (country-specific) shock; (5) Potentialoutput shock
BVAR-basedassessment ofuncertainty
(1) Liquidity risk; (2) Mar-ket uncertainty and polit-ical risk; (3) Structure ofdebt; (4) Scope for contin-gent liabilities; (5) Financialposition and competitive-ness; (6) Institutions andgovernance
Cri
teri
a
(1) Debt level in T+10;(2) Debt dynamics
(3) Fiscal fatigue (benchmark)
At T+5:(1) Probability of
debt standing above90% of GDP;
(2) Probability ofdebt not stabilizing;
(3) Dispersion insimulated debt paths
Assumed thresholds or in-sample distribution
Aggregation: Heatmap
TABLE 1. Schematic representation of the Eurosystem DSA framework
Source: Adapted from Bouabdallah et al. (2017), with further 2018 revisions.
The deterministic block comprises both a benchmark scenario and a set ofadverse shock scenarios, all with a 10-year horizon. Regarding the benchmark,its mechanics are based on plausible assumptions for the evolution ofmacroeconomic and fiscal drivers of the debt ratio. It embeds a fiscal rulethat assumes minimum compliance with the EU fiscal governance framework.

Banco de Portugal Economic Studies 4
The shock scenarios are thought to measure the resilience of the benchmarkto (more) adverse assumptions. All simulations are then evaluated in termsof the level reached by the debt ratio at the end of the horizon and itsdynamics. The benchmark is also evaluated in terms of the potential for fiscalfatigue, related to the governments’ likelihood of sustaining high primarysurpluses given historical developments. As to the stochastic block, it providesa probabilistic measure of the uncertainty around the future debt path,considering a five-year horizon. Finally, the "other indicators" aim at signallingother short and medium to long-term risks to debt sustainability otherwisenot captured in the previous blocks. The insight provided by each of the threeblocks can be merged into a single country-specific sustainability score andmapped into an easy to read and communicate four-colour heatmap in whichred stands for "very high risks", orange for "high risks", yellow for "moderaterisks" and green for "contained risks" to debt sustainability.
The deterministic analysis
Most DSA frameworks rely to some extent on deterministic long-term projections for the debt ratio. Typically, as it is the case in theEurosystem methodology, these projections are anchored in the following debtaccumulation equation:
∆bt =iirt − gt1 + gt
∗ bt−1 − pbt + ddat (1)
which provides a simple accounting framework to breakdown the changes inthe public debt ratio (∆bt) into: i) the "snowball effect" given by the differencebetween the implicit interest rate on public debt (iirt) and the growth rateof nominal GDP (gt) multiplied by the previous year debt ratio (bt−1); ii) theprimary balance as a percentage of GDP (pbt); and iii) deficit-debt adjustmentsas a ratio to GDP (ddat).
The benchmark deterministic scenario
The benchmark scenario is constructed for a 10-year period, with simulationscarried out currently up to 2028. It essentially assumes that governmentsbroadly comply with the minimum requirements under the SGP after theESCB projection horizon. Moreover, this scenario relies on several otherassumptions, which are presented below.
The benchmark scenario considers the fiscal projections made in thecontext of the European System of Central Banks (ESCB) exercises up to

5
year T+33. From year T+4 onwards, and for countries under the preventivearm of the SGP, as is currently the case of Portugal, the minimum annualadjustment towards reaching the budgetary medium-term objective (MTO) isconsidered. This is determined by the ’flexibility matrix’4 but, for prudency,the consolidation effort actually required is adjusted downwards by 0.25percent of GDP. This figure reflects an estimate of the possible maximumdeviation allowed without triggering sanctions under the SGP. In addition,the maximum effort is capped at 0.5 percent of GDP per year.5 It should benoted that any possible additional fiscal effort required for the fulfilment ofthe debt rule is not reflected in the benchmark.
The evolution of the structural primary balance (spb) beyond T+3 is drivenby the convergence to the MTO. In conjunction with an estimate for thecyclical component and an assumption for temporary measures, it allowsfor the determination of the primary balance (pb). The cyclical component(cyc) is derived as the product of the output gap by the budgetary semi-elasticity derived on the basis of the ESCB methodology (for an applicationto the Portuguese case, see Braz et al. 2019). Temporary measures (temp) areassumed to be nil beyond T+3.
For the computation of both the headline balance and the structuralbalance a projection of interest payments is required. Interest payments (inp)for former programme countries are calculated as the sum of interest paid onmarket debt (inpmk) and interest paid on loans obtained from official creditors(inpof ):
inpt = inpmkt + inpoft (2)
Interest outlays from official loans are computed on the basis ofinformation on the underlying interest rates and the scheduled redemptionprofile. Interest payments on market debt are given by the followingexpression:
inpmkt = nmdmk
t−1 ∗ iirmkt−1 + mdmk
t−1 ∗1
2∗ (iirmk
t−1 + amirt)+
1
2∗ (−pbt + inpmk
t + inpoft + ddat − ∆Doft ) ∗ amirt (3)
3. In the case of Portugal, these fiscal projections are confidential and not made public.4. Introduced by the European Commission Communication on ’Making the best use of theflexibility within the existing rules of the Stability and Growth Pact’ in 2015. See https:
//eur-lex.europa.eu/legal-content/EN/TXT/PDF/?uri=CELEX:52015DC0012&from=EN.5. For countries subject to an Excessive Deficit Procedure (EDP) the annual structural effortrequired under the latest EDP recommendation is considered, unless it is above the governmentplans in the Stability Programme. For countries at or above the MTO, a gradual fiscal stimulus -limited to 1 percent of GDP per year - is assumed such that countries remain at, or return to, therespective MTOs.

Banco de Portugal Economic Studies 6
wherenmdmk - market debt with a residual maturity of more than one year;iirmk - implicit interest rate on market debt (defined as the ratio of interestpayments on market debt of year t divided by the market debt stock of at theend of t− 1);mdmk - market debt with a residual maturity of one year or less;amir - average market interest rate (defined below);pb - primary balance;dda - deficit-debt adjustments, which, as a default assumption, are set to zerobeyond the forecasting horizon;∆Dof - change in the stock of official loans.
Solving for inpmkt and assuming as a proxy for gross financing needs the
following expression: gfnt = mdmkt−1− (spbt + cyct + tempt) + inpmk
t−1 + inpoft +
ddat − ∆Doft , the previous formula can be simplified as:
inpmkt =
nmdmkt−1 ∗ iirmk
t−1 + mdmkt−1 ∗ 1
2 ∗ iirmkt−1 + 1
2 ∗ (gfnt − inpmkt−1) ∗ amirt
1 − 12 ∗ amirt
(4)
For market debt that does not mature within the year, the previous yearimplicit interest rate is assumed to hold, while for the maturing marketdebt a different assumption is made for each half of the year: in the firstsemester interest paid stems from the previous year implicit interest rate,as it is considered that all debt matures at the end of June; in the secondsemester, rolled-over debt is financed at the average market rates. The (proxyfor) net financing needs (the headline deficit, deficit-debt adjustments and therepayment of official loans) is financed at market conditions and is consideredto be issued, on average, at the middle of the year.
The average market interest rate (amir) is assumed as representative ofthe market interest conditions for the debt to be issued in each year. For thestructure of this debt, it is used as a proxy the structure of the residual maturityof the stock of debt, split in debt with residual maturity below one year,between one and five years, and above five years. The calculation formulais as follows:
amir =1
2(stn + stn12m)sd1 +
1
2(stn12m + ltn5y)sd1−5 +
1
2(ltn5y + ltn10y)sd5
(5)
wherestn - 3-month government security yield;stn12m - 12-month government security yield;ltn5y - 5-year government bond yield;ltn10y - 10-year government bond yield;

7
sd1 - share of market debt with residual maturity below 1 year;sd1−5 - share of market debt with residual maturity between 1 and 5 years;sd5 - share of market debt with residual maturity above 5 years.
The interest rate assumptions are country-specific. Across the simulationhorizon, spot yields for the 12-month, 5-year and 10-year maturities areextended with forward par yields. The latter are derived from yield curvesestimated with recourse to the model established by Svensson (1994)6. The3-month government security yield corresponds to expectations implied infutures contracts for developments in the 3-month Euribor rate. For eachcountry, the market debt maturity structure converges linearly to the currenteuro area average in 2035 (sd1 = 20 percent; sd1−5 = 40 percent; sd5 = 40percent).
Lastly, it is important to note that, once the MTO has been reached oroverachieved, any further interest payments savings resulting from debtreduction or lower implicit interest rate are considered to be used for fiscaleasing (and not towards further debt reduction) for prudency reasons. Also,in order to avoid a structural break between T+3 and T+4, an adjustment iscarried out to smooth the transition from the forecast exercise period to themore extended horizon, on which interest payments projections are reliant onthe above-mentioned formula.
Regarding macro variables, the ESCB projections are considered withinthe forecast horizon, with the exception of potential GDP for whichprojections are made for the whole DSA time horizon.7 From T+4 onwards,real GDP growth (y) projections are derived from a simple stylised modelthat takes into account persistence effects (through an autoregressive process),potential GDP growth (yp) and the previous year output gap (OG)8, as wellas the impact of additional fiscal consolidation or stimulus (measured by thechange in the structural primary balance - ∆SPB) through a fiscal multiplier,
6. In order to derive the implicit average annual interest rate from the market price of a couponbearing bond, each future interest payment on this bond has to be discounted by the differentcurrent average interest rates related to the time at which the future payment occurs. To facilitatethe term structure estimation, it is useful to impose a functional form between interest rates andtime to maturity. The ECB has chosen a functional form proposed by Nelson and Siegel - andextended by Svensson. The respective parameters are estimated and made public by the ECB ona daily basis; see ECB (2008).7. The Eurosystem’s DSA takes into account estimates for potential output produced by theESCB Working Group on Forecasting. For specific details on the estimation of potential outputfor Portugal, refer to Braz et al. (2019).8. In the absence of additional fiscal consolidation or stimulus, the closure of the output gap isensured in 5 years.

Banco de Portugal Economic Studies 8
set at 0.55. Specifically,
yt =
{0.5yt−1 + 0.5ypt − 0.55∆SPBt − 0.2OGt−1 if (yt−1 − ypt ) ∗OGt−1 > 0ypt − 0.55∆SPBt − 0.2OGt−1 if (yt−1 − ypt ) ∗OGt−1 < 0
(6)
The two-regime representation ensures a smoother path for real GDPgrowth by not including the autoregressive term in the cases where the outputgap is already closing [(yt−1 − ypt ) ∗OGt−1 < 0].
The GDP deflator growth rate is assumed to converge linearly, after theshort-term forecasting horizon, to the ECB objective for price stability.
The deterministic shock scenarios
In order to reflect the uncertainty around the projection of future debt pathand its sensitiveness to the underlying assumptions, the deterministic blockof the Eurosystem’s DSA encompasses several alternative adverse scenarios.These result from specific narrative shocks applied as of the first year ofthe simulations (T+1). Although they are homogeneously applied to eachcountry, the shocks are inherently country-specific. Adverse shocks affectingreal GDP growth impact the evolution of primary balances through country-specific fiscal elasticities. Moreover, the fiscal rule embedded in the benchmarkscenario does not operate, so that fiscal policy does not react to deteriorationsin structural positions. Shocks to interest payments, in turn, are capturedthrough a risk premium channel according to which a 1 pp increase inthe deficit-to-GDP or in the debt ratios implies an increase in spreads by,respectively, 25 and 4 basis points. Specific details on each of the shockscenarios are provided below.
Historical. Keeps all the assumptions of the benchmark unchanged, exceptas regards real GDP growth and the primary balance (net of support tothe banking sector). In particular, as of T+1, both variables are assumed toconverge within three years to their historical averages recorded over 2001-2013. Convergence to the long-run historical figures typically implies lowereconomic growth and smaller primary balances compared to the benchmarkscenario, thus providing insight on the uncertainty around some of the keydriving assumptions of the debt path.
No-fiscal policy-change with ageing costs. Assumes the absence of consolidationas of T+3. In particular, this implies that the structural primary balanceremains constant at the level corresponding to the last year of the ESCBprojection. Additionally, the fiscal burden associated with population ageing(as estimated in the risk scenario of the 2018 Ageing Report) is taken intoaccount, rendering this scenario particularly adverse for countries projected

9
to face higher ageing-related challenges (and those for which the structuralbalance is forecast to fall short of the MTO in T+3).
Combined stress test. In this scenario, shocks are applied to real GDP growth,the GDP deflator and the 10-year sovereign bond spreads. These are calibratedas per the country-specific assumptions underlying the adverse systemicrisk scenario from the 2018 bank stress tests performed by the EuropeanBanking Authority (EBA). In practice, these shocks are applied from 2019to 2021 and imply that, at the end of 2020, real GDP stands below the levelrecorded in 2017, yielding negative growth rates in that period. In addition,the scenario assumes an hysteresis effect through which (half of) the shock toreal GDP affects potential growth in the longer-term, thus yielding a furtherdeterioration in the structural fiscal position. This is the most adverse scenarioconsidered in the DSA, rendering the highest debt-to-GDP ratio at the end ofthe horizon.
Country-specific interest rate shock. For each country, the interest rate-growthdifferential converges to its historical average (computed over 1999-2017) bythe end of the simulation horizon. The shock is applied to the implicit interestrate on market debt, holding GDP growth and inflation as in the benchmarkscenario and assuming no additional consolidation efforts. This implies thatthe shock affects the debt path gradually over the horizon, as market debtmatures and is replaced by new issuance. In order to ensure that this remainsan adverse scenario, in the case of countries for which the historical interest-rate growth differential is either negative or stands below the benchmark, it isassumed to converge to 0.5 pp.
Structural shock. Potential GDP growth is negatively affected by a shockcalibrated on the basis of an empirical measure of past uncertainty. Inparticular, the contributions of capital and total factor productivity convergein 10 years to the medians of the respective historical distributions, reducedby one standard-deviation. Regarding the labour factor, it is kept as in thebenchmark. Note that this downward shock to potential growth does notallow it to become negative, as the resulting rates are floored at zero. As to theremaining macroeconomic and fiscal variables, they are assumed to evolve inline with the scenario of no-fiscal policy-change with ageing costs.
Quantitative evaluation criteria
Both the benchmark and the alternative shock scenarios are evaluated interms of the debt level at the end of the 10-year simulation horizon and thedynamics exhibited by the debt ratio over that period. The benchmark isfurther evaluated against a fiscal fatigue indicator.

Banco de Portugal Economic Studies 10
The rationale for the debt level criterion lies in the notion that a high levelof public debt implies stronger sustainability risks. It is typically associatedwith larger gross financing needs and requires the maintenance of higherprimary balances to make it sustainable over the long-term, thereby reducingthe margin for counter-cyclical fiscal policy. In the short-term, it may alsohave unfavourable effects if perceived by market participants as a signal offiscal distress, potentially triggering liquidity crises. The Eurosystem’s DSAevaluates the debt level as a percentage of GDP at T+10 both in the benchmarkand in the shock scenarios on the basis of five thresholds: 30%; 60% (asembedded in the EU fiscal surveillance framework); 90%; 120%; and 150%.In order to mitigate cliff effects in the vicinity of these thresholds, the score isderived using a continuous scheme with non-linear smoothing around them.Panel (A) in Figure 1 illustrates this scheme. In terms of the traffic-light coloursystem, green is allocated to countries for which, at T+10, the debt ratio is ator below 60% of GDP, ratios between 61% and 90% yield a yellow, whereasred corresponds to debt-to-GDP levels above 90%.
0
1
2
3
4
5
6
30 45 60 75 90 105 120 135 150 165
Score
Debt level (% of GDP) at end of simulation horizon (T+10)
(A) Debt level criterion
0
1
2
3
4
‐4 ‐3.5 ‐3 ‐2.5 ‐2 ‐1.5 ‐1 ‐0.5 0 0.5 1 1.5 2
Average slope over the simulation
Slope criterion
0
1
2
3
4
T‐2 T‐1 T T+1 T+2 T+3 T+4 T+5 T+6 T+7 T+8 T+9 T+10
'16 '17 '18 '19 '20 '21 '22 '23 '24 '25 '26 '27 '28
Score
Year in which debt peaks
Peak criterion
2,33
1,67
(B) Dynamics criterion
FIGURE 1: Scoring systems for evaluating the debt level and dynamics criteria
Sources: Own illustration, based on the Eurosystem method.Notes: For convenience, the horizontal axis in the chart referring to the peak criterion presentsthe relevant years for assessment in the June 2019 DSA exercise (in which T=2018).
Regarding the debt dynamics criterion, it aims at capturing the fact that acontinuously downward debt path can be perceived by market participantsas a sign of improving conditions, even if the level remains high. By thesame token, rising debt levels may generate sustainability concerns. In orderto reflect these considerations, two dimensions are taken into account whenevaluating the debt paths in both the benchmark and the shock scenarios: theyear in which debt peaks and the slope of its trajectory.
In particular, the later the debt ratio reaches its peak, the higher thecorresponding risk score. Countries in which the debt peaked at least

11
two years before the start of the simulation period (ie, in or before T-1,corresponding to 2017 or earlier in the current exercise), have the lowest riskscore of 1. The score increases by 0.4 for each additional year of delay up to ascore of 3 if debt peaks after T+3 (or if it fails to reach a maximum withinthe simulation period). For the slope sub-criterion, the score is a functionof a weighted average of the annual changes of the debt ratio over thesimulation period. Reflecting the higher uncertainty around the final yearsof the simulation, the largest weight is given to the change in the first year(T+1, weighting 10) and it decays to a weight of 1 in the last year. The averageslope is granted a score from 1 to 3, being more (less) favourable for countriessimulated to have sharper declines (increases) over the horizon. Panel (B) inFigure 1 illustrates the scoring schemes applicable to the peak and the slopesub-criteria.
Finally, the overall score for the dynamics criterion is derived as theaverage between the scores referring to the peak and the slope indicators.The only exception refers to countries where the debt level remains below30% of GDP throughout the simulation horizon, which get a score of 1 in thedynamics criterion. Overall scores of 1.67 or below are allocated to the greenrisk category, while yellow corresponds to scores higher than 1.67 but lowerthan 2.33. A score of 2.33 or above yields a red classification.
The DSA benchmark scenario is also evaluated in terms of a fiscal fatiguecriterion gauging the governments’ ability to sustain primary surpluses.Indeed, the benchmark assumes compliance with SGP fiscal commitments(though only to the minimal extent required to avoid sanctions). This makes ita somewhat benign scenario in the sense that structural primary balances arenot allowed to post significant deteriorations. Such assumption may imply themaintenance of large primary surpluses for a long period, which, dependingon the past track-record, may not be credible. In order to capture the inherentrisks, the fiscal fatigue criterion is based on the comparison between thesimulated behaviour of the primary balance over the horizon with thefollowing benchmarks: a country-specific historical threshold correspondingto the highest of the five-year moving averages (MA5) of primary balancerecorded from 1999 to 2018 (B); a country-specific historical benchmark thattakes into account the fact that current debt levels may be different from thoserecorded in the past in the same country (Badj,t)9; and common thresholds of3.1% and 4% of GDP, derived from the literature.
9. When estimating a fiscal reaction function for a panel of euro area countries, Checherita-Westphal and Zdarek (2017) found a coefficient of 0.04 for the impact of a change in the debtlevel in the primary balance. In line with this estimate, Badj,t = B + 0.04 ·Diffdebt,t, whereDiffdebt,t corresponds to the difference between each MA5 of the debt ratio in the simulationperiod and the debt ratio recorded in the year of the highest MA5 primary balance over 1999-2018.

Banco de Portugal Economic Studies 12
In particular, for each year of the simulation period, the relevant thresholdsare defined on the basis of the relationship between B and Badj,t:
• A score of 1 (low risk) is given if the MA5 of the primary balance is belowmin(B,Badj,t);
• If it falls between min(B,Badj,t) and max(B,Badj,t) or if the averageprimary balance over the simulation is higher than 3.1% of GDP but lowerthan 4%, the score is set at 2 (medium risk);
• High risks of fiscal fatigue, with a score of 3, correspond to years in whichthe five-year average exceeds max(B,Badj,t) or the 10-year simulatedaverage primary balance is, at least, as high as 4% of GDP.
The final fiscal fatigue score corresponds to the highest score recorded overthe simulation period.
Results of the deterministic analysis for Portugal
In the benchmark scenario, Portugal’s debt ratio is estimated to declinegradually, standing at 89.1% in 2028 (Figure 2). The debt level criterion points,as such, to medium-risks (corresponding to a 2.4 score). A -3.5 p.p. weightedaverage slope over the simulation horizon, together with a score of 1 forthe peak criterion, yields a low risk score in the overall dynamics criterion.Regarding the structural balance, the MTO deducted by the maximumdeviation allowed to avoid sanctions under the SGP (0.25% of GDP) wouldbe reached in 2022 and maintained thereafter. The cyclical component wouldconverge rapidly to zero, temporary measures are assumed to be nil after2022 and interest payments as a ratio to GDP decline up to 2022 and increaseonly slightly in the last years of the simulation horizon. As a result, theprimary balance stands in the [2.7; 3.5]% of GDP range, averaging 2.9% ofGDP between 2019 and 2028. This implies high risks related to fiscal fatigue.10
The average growth of nominal GDP underlying the simulation is around 3%.Figure 3 shows that the most severe scenario for Portugal is the one
referring to the combined stress test. Both in this and in the historical scenario,the debt-to-GDP ratio would fail to stabilize within the simulation horizon(yielding a score of 3 in the dynamics criterion, as per Figure 1) and wouldreach a high level in T+10 (respectively yielding scores of 5 and 4.1, in linewith panel (A) of the same figure). The remaining scenarios would also resultin a higher debt level at the end of the horizon, but would not jeopardize thedownward slope exhibited since 2014 and prolonged in the benchmark.
10. It should be noted that for the purpose of determining the fiscal fatigue score, the highestMA5 of the primary balance (B) in the 1999-2018 period in Portugal is 0.8% of GDP and thebenchmark adjusted for debt levels (Badj,t) varies in the [-0.5; 0.1]% of GDP interval.

13
0
20
40
60
80
100
120
140
‐10
‐5
0
5
10
15
20
2001
2002
2003
2004
2005
2006
2007
2008
2009
2010
2011
2012
2013
2014
2015
2016
2017
2018
2019
2020
2021
2022
2023
2024
2025
2026
2027
2028
Primary deficit Interest‐growth differential DDA Change in debt Debt
FIGURE 2: Benchmark debt path and its breakdown in Portugal | In percent of GDP
Sources: Statistics Portugal, Banco de Portugal and authors’ calculations.
708090
100110
120130140150160170
2018 2019 2020 2021 2022 2023 2024 2025 2026 2027 2028
Benchmark Historical NFPC with ageing
Combined stress test Interest rate shock Structural shock
FIGURE 3: Portuguese public debt path in alternative scenarios | In percent of GDP
Sources: Statistics Portugal, Banco de Portugal and authors’ calculations.
The stochastic analysis
The deterministic component of the DSA is complemented by a stochasticanalysis (SDSA). The latter relies on a set of probabilistic scenariosfor the future evolution of public debt, developed on the basis of itsempirical relationship with its drivers. In particular, given past responses,macroeconomic drivers are projected according to stochastically simulated

Banco de Portugal Economic Studies 14
shocks and plugged-in the debt change equation (1) following the samemechanics as in the benchmark scenario, generating alternative debt paths.
In the Eurosystem’s DSA, the shocks are simulated from the residualsof a quarterly two-lag VAR model estimated using a Bayesian approach(BVAR) (see Bouabdallah and Cozmanca 2019). The model encompasses fourendogenous variables (real GDP growth, GDP deflator growth, short-termgovernment security yields and the real effective exchange rate) and twoexogenous variables (a commodity price index and US LIBOR), assumingblock-exogeneity. Currently, the estimation sample spans the 1996Q2-2018Q4period. An independent Normal-Wishard prior is assumed. The priors forthe auto regressive parameters are set at 0.5, whereas the prior means of theexogenous coefficients are set at 0, as implied by block-exogeneity.
The independent Normal-Wishard prior implies that the residualcovariance is treated as unknown and that the variance of the distributionof coefficients has a flexible structure. In this set-up, parameters cannot beanalytically estimated and, thus, the posterior distributions are obtainednumerically. In particular, the Eurosystem’s SDSA relies on the iterative Gibbssampling method with 10.000 iterations to obtain random draws from theunconditional posterior distribution of the parameters of interest.
The covariance matrices obtained from Gibbs’ method are used to simulatea high number of possible paths for the aforementioned macro variables.Finally, alternative debt paths are generated over a five-year period throughthe same mechanics as in the benchmark, including the working of the fiscalrule, and considering the simulated cyclical developments.
The large number of debt paths that are simulated using this procedureallow for the derivation of a stable distribution that can be characterisedon the basis of several moment statistics or probabilistic analyses. In theEurosystem’s DSA, the simulated distribution is evaluated using three criteria,all focusing at the end of the five-year horizon:
• The uncertainty around the simulations, measured as the differencebetween the 5th and the 95th percentiles of the distribution of the debtratio at T+5. For each country, this dispersion is benchmarked against thatreferring to the euro area sample and, if it stands above the respective 66th
percentile, countries are granted a risk score of 3 (meaning that higheruncertainty is associated with higher sustainability risks). If dispersion isbetween percentiles 66 and 33, countries are assigned to the medium riskcategory (score of 2), whereas for countries ranked below the 33th, the riskscore is 1, signalling low risks.
• The probability of debt standing above 90% of GDP in T+5.• The probability of debt not stabilizing by T+5.
For the two last criteria, probabilities above 66% receive a score of 3 andare allocated to the red risk category. If the probabilities stand between 33and 66%, countries are placed in the yellow category and receive a score of 2.

15
Finally, if they are lower than 33%, signalling low risks for debt sustainability,countries are granted a score of 1 and placed in the green category. The overallscore for the SDSA is obtained as the simple average between the scores of thethree indicators.
70
80
90
100
110
120
130
140
150
160
2018 2019 2020 2021 2022 2023
5th–95th percentile 10th–90th percentile 40th–60th percentile
Historical Combined stress test Interest rate shock
Structural shock NFPC with ageing Benchmark
FIGURE 4: Stochastic DSA results for Portugal| In percent of GDP
Sources: Statistics Portugal, Banco de Portugal and authors’ calculations.
Figure 4 depicts a fan chart illustrating confidence bands that representdifferent degrees of uncertainty in the debt paths simulated for Portugal inthe latest SDSA iteration. They show that the benchmark scenario largelycoincides with the median of the respective distribution. The figure alsohighlights that the paths corresponding to the most severe adverse scenarios(historical and combined stress test) should be interpreted as highly unlikely,given past developments.
Based on the results summarized in Figure 4, Portugal is placed in theintermediate risk category as regards the dispersion indicator. Unsurprisingly,given the current debt-to-GDP level, the probability of debt standing above90% of GDP in T+5 (2023) is assessed to be high (red category). Nonetheless,the likelihood of it remaining on a declining trend is also high, yielding alow probability of debt not stabilizing within the five-year horizon (green riskcategory). Overall, the SDSA score for Portugal is 2, signalling medium risksto debt sustainability.
Other indicators
In addition to the deterministic and stochastic DSA blocks, the Eurosystem’sDSA also relies on six groups of other indicators that aim at signalling short-

Banco de Portugal Economic Studies 16
and medium to long-term sustainability risks, so as to capture potentialliquidity and solvency vulnerabilities. In particular, there are two blocksfocusing on short-term risks (liquidity risk, and market uncertainty andpolitical risk) and four other blocks providing a longer-term perspective(structure of public debt, scope for contingent liabilities, net financial positionof the economy, and institutional and governance factors).
The liquidity risks are assessed on the basis of the short-term financingneeds 11. The latter reflect the gross needs related to financing the budgetdeficit and the debt maturing within one year12, net of liquid financialassets (currency and deposits). In turn, indicators for market uncertainty andpolitical risk aim at gauging the current ease of refinancing. This assessmentis based on the markets’ perception of sovereign risk (as measured by the10-year government bond spread vis-à-vis the German Bund and the currentsovereign rating) and the political risk indicator produced by a private entity,the PRS Group. Larger financing needs and political risks and poorer marketrisk perception naturally imply higher short-term sustainability (liquidity)risks.
Potential sources of concern in terms of medium- to long-termsustainability are captured by the four additional blocks of indicators.Indicators for the current structure of debt take into account its maturity andits composition in terms of currency and type of interest rate. Higher sharesof short-term debt, debt denominated in foreign currencies and debt with avariable interest rate are, in principle, associated with higher vulnerability toadverse shocks which translates into higher sustainability risks.
Higher sustainability risks are also a priori associated with a wider scopefor contingent liabilities. The latter refer to the potential fiscal costs thatmay arise should certain events materialize. These include the costs relatedwith demographic changes, captured by an "ageing indicator" hinging onthe Commission’s long-term sustainability indicator S2 and the latest AgeingReport13. Moreover, other contingent liabilities are accounted for using a
11. Financing needs estimated for the current year in the June exercise or the following year inthe December exercise.12. The debt maturing in the year encompasses long-term securities maturing within thefollowing 12 months, the stock of short-term debt outstanding at the end of the previous year(both taken from the ECB Centralized Securities Database) and the scheduled repayment ofofficial loans.13. In particular, the ageing indicator is obtained as the average (2/3; 1/3) between a scorecompatible with the Commission’s long-term sustainability indicator (countries are assigned1, 2 or 3 depending on the long-term sustainability risks as signalled by the S2 indicator) andthe score applicable to the debt level obtained by adding the estimated long-term costs ofageing to the debt level at the end of the DSA period in the benchmark scenario. The estimatedcosts of ageing correspond to the cumulative impact of age-related spending in the debt levelover the 2028-2060 period, as per the AWG risk scenario in the 2018 Ageing Report. In thelatest Commission’s Fiscal Sustainability Report, the score compatible with the S2 indicatorfor Portugal stands at 1 (as the S2 indicator signals low risks). In turn, adding the estimated

17
synthetic indicator that is based on the existing stock of guarantees grantedby the general government, the amounts under public-private partnerships(PPP) and non-performing loans granted by government entities. Additionalcontingent liabilities related to the financial sector are also captured by afinancial risks indicator derived from the overall assessment of risk andvulnerabilities in the regular ECB Macro-Prudential Report, which is notpublicly available.
The risks to public debt sustainability stemming from the net financialposition of the economy are assessed through indicators deemed to havehigh predictive power in signalling sovereign distress: the net internationalinvestment position; the private sector stock of debt; and a set ofexternal competitiveness indicators from the EU’s Macroeconomic ImbalanceProcedure (MIP) scoreboard. The latter refer, in particular, to the changes inunit labour costs and the real effective exchange rate (over the last three years),the (three year average) current account balance and the change in the exportmarket shares (over the last five years).
Finally, risks stemming from each country’s institutional and governanceframework are factored in through a set of indicators providing someinsight on the quality of institutions. In particular, this category includesthe World Bank’s worldwide governance indicators and the TransparencyInternational’s corruption perception index. These indicators are intendedto proxy the governments’ proneness to payback its debt, with higherinstitutional quality being associated with lower sustainability risks.
Each individual indicator is evaluated using thresholds derived from theempirical literature or based on the reference figures used by the EuropeanCommission (when assessing fiscal sustainability risks or in the context of theMIP) and the IMF. When such benchmarks are not available, the thresholds aredetermined on the basis of the percentile distribution in a sample of advancedeconomies as defined by the IMF. The only exception is the sub-indicadorreferring to the share of debt with variable interest rate, for which the relevantsample corresponds to euro area countries across 2001-2018.
Depending on the relevant figures for a specific country and the respectivethresholds, each individual indicator is given a score of 1 (indicating lowrisk), 2 (for medium risk) or 3 (high risk). For each block of indicators -liquidity, market uncertainty and political risk, structure of debt, scope forcontingent liabilities, net financial position of the economy, and institutionsand governance - an overall score is derived on the basis of the individualscores and a weighting scheme. Finally, the score for each block is classifiedaccording to the heatmap colours using the appropriate thresholds: green for
cumulative costs of ageing to the debt level at the end of 2028 in the DSA benchmark scenarioputs the debt-to-GDP ratio close to 120%, which, according to the criterion described in panel(A) of Figure 1, yields a score of 3.4.

Banco de Portugal Economic Studies 18
scores below 1.67; yellow for scores ranging between 1.67 and 2.33; and redfor scores above 2.33.
The results currently obtained for Portugal show that, out of the full setof indicators, the most relevant risks to Portuguese public debt sustainabilitystem from the weak net financial position of the economy, the high share ofshort-term debt and the sizeable stock of contingent liabilities (see Table 3 forthe aggregate scores of each category of indicators).
Sustainability assessment for Portugal: recent developments
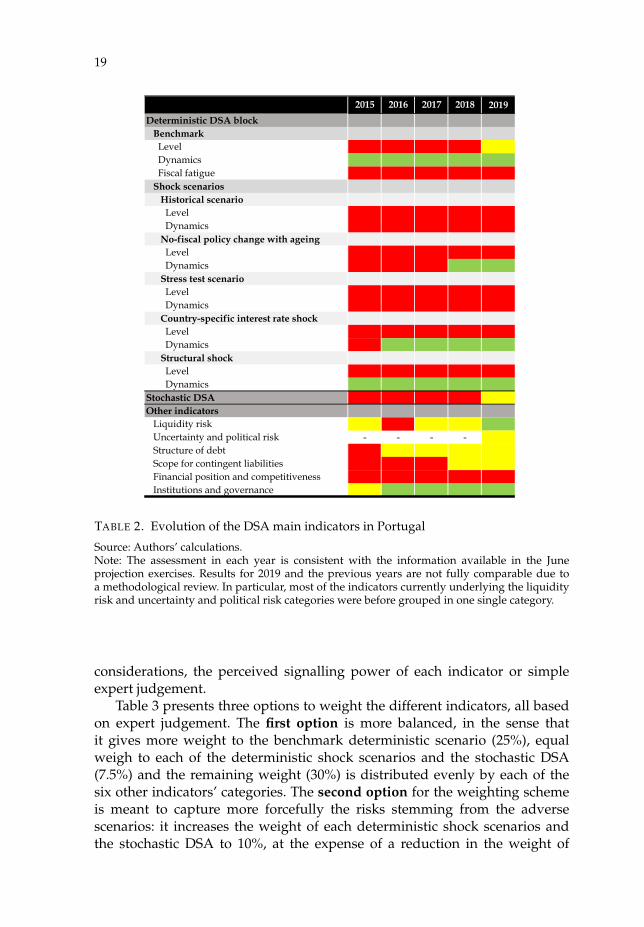
In Portugal, several risk indicators included in the three DSA blocks havebeen improving since 2015 (Table 2). On the basis of the colour-scheme,the favourable evolution is noticeable in the debt level and dynamicscriteria in both the benchmark and the "no-fiscal-policy-change with ageing"deterministic scenarios, in the stochastic DSA and in some categories of theother indicators.
Regarding the improvement in the deterministic and stochastic blocks, it isworth highlighting that the current perspective for debt ratio developments ismuch more favourable than the one existing in 2015. Different factors concurto this outcome: revisions of the debt ratio in the base year; lower deficits,which one can typically expect given the prudency principle applied in theelaboration of ESCB fiscal projections and also the stronger than anticipateddrop in interest rates; and higher than expected nominal GDP growth. Whilethis more benign developments translate relatively fast to the risk assessmentbased in the level and dynamics criteria of the deterministic scenarios, theywill take much longer to be reflected in the fiscal fatigue criterion.
On the other indicators block, the improvement in both the 10-yearPortuguese government bond spreads and the sovereign ratings contributedto the positive evolution of the risk assessment in the liquidity and uncertaintyand political risk categories. Regarding the structure of debt, the relativelyhigh share of short term debt continues to weigh on this risk indicator, butthe reduction in the share of debt with variable interest rate and in foreigncurrency had a small favourable impact. The financial sector risks, on thecontingent liabilities category, have declined somewhat, while the overallscore of the indicators on the financial position and competitiveness and oninstitutions and governance remained broadly unchanged.
The risks to debt sustainability as highlighted in the three DSA blocks canbe summarised in a single sustainability score providing an encompassingassessment that is easy to understand and communicate. The aggregationof the scores of each block into a single indicator is conditional on thechoice of a weighting scheme. Such choice may take into account empirical
19
2019
Deterministic DSA block Benchmark Level Dynamics Fiscal fatigue Shock scenarios Historical scenario Level Dynamics No-fiscal policy change with ageing Level Dynamics Stress test scenario Level Dynamics Country-specific interest rate shock Level Dynamics Structural shock Level DynamicsStochastic DSAOther indicators Liquidity risk Uncertainty and political risk - - - - Structure of debt Scope for contingent liabilities Financial position and competitiveness Institutions and governance
2015 2016 2017 2018
TABLE 2. Evolution of the DSA main indicators in Portugal
Source: Authors’ calculations.Note: The assessment in each year is consistent with the information available in the Juneprojection exercises. Results for 2019 and the previous years are not fully comparable due toa methodological review. In particular, most of the indicators currently underlying the liquidityrisk and uncertainty and political risk categories were before grouped in one single category.
considerations, the perceived signalling power of each indicator or simpleexpert judgement.
Table 3 presents three options to weight the different indicators, all basedon expert judgement. The first option is more balanced, in the sense thatit gives more weight to the benchmark deterministic scenario (25%), equalweigh to each of the deterministic shock scenarios and the stochastic DSA(7.5%) and the remaining weight (30%) is distributed evenly by each of thesix other indicators’ categories. The second option for the weighting schemeis meant to capture more forcefully the risks stemming from the adversescenarios: it increases the weight of each deterministic shock scenarios andthe stochastic DSA to 10%, at the expense of a reduction in the weight of

Banco de Portugal Economic Studies 20
the benchmark scenario to 10%. Finally, the third option favours the otherindicators in the overall risk assessment, increasing their joint weight to 45%,while counterbalancing it by a cut to 10% in the weight of the benchmarkscenario.
Block/indicator Score Weighting options(a)
1 2 3
1 Deterministic DSA block 62.5% 60.0% 47.5%1.1 Benchmark 25.0% 10.0% 10.0%
Level 2.4 10.0% 4.0% 4.0%Dynamics 1.0 10.0% 4.0% 4.0%Fiscal fatigue 3.0 5.0% 2.0% 2.0%
1.2 Shock scenarios 37.5% 50% 37.5%Historical scenario 7.5% 10% 7.5%Level 4.0 3.8% 5.0% 3.8%Dynamics 3.0 3.8% 5.0% 3.8%No-fiscal policy change with ageing 7.5% 10.0% 7.5%Level 2.5 3.8% 5.0% 3.8%Dynamics 1.0 3.8% 5.0% 3.8%Stress test scenario 7.5% 10.0% 7.5%Level 5.0 3.8% 5.0% 3.8%Dynamics 3.0 3.8% 5.0% 3.8%Country-specific interest rate shock 7.5% 10.0% 7.5%Level 2.9 3.8% 5.0% 3.8%Dynamics 1.0 3.8% 5.0% 3.8%Structural shock 7.5% 10.0% 7.5%Level 3.0 3.8% 5.0% 3.8%Dynamics 1.0 3.8% 5.0% 3.8%
2 Stochastic DSA 2.0 7.5% 10% 7.5%
3 Other indicators 30.0% 30.0% 45.0%Liquidity risk 2.0 5.0% 5.0% 7.5%Uncertainty and political risk 1.6 5.0% 5.0% 7.5%Structure of debt 1.8 5.0% 5.0% 7.5%Scope for contingent liabilities 1.7 5.0% 5.0% 7.5%Financial position and competitiveness 2.6 5.0% 5.0% 7.5%Institutions and governance 1.4 5.0% 5.0% 7.5%
Overall results for Portugal: sustainability risk score and category 2.18 2.27 2.17
TABLE 3. Overall debt sustainability assessment in Portugal
Source: Own representation.Notes: (a) The three weighting schemes and the resulting overall scores were defined by theauthors for illustrative purposes.
The overall risk score for each of the weighting options is also shownin Table 3. Having in mind the classification in the four-colour scheme (red- very high sustainability risks for scores above 2.5; orange - high risksfor scores between 2.5 and 2.0; yellow - moderate risks if the score stands

21
between 2.0 and 1.5; and green - contained risks for scores lower than 1.5),Portugal currently emerges as a high risk country (orange category) in thethree alternative schemes. Although the overall risk classification dependsultimately on the selected weighting scheme, the high number of indicatorsconsidered in the analysis ensures a robust score in case a balanced approachis adopted. Also, moving forward, it appears likely that in the absenceof external shocks and under the maintenance of the recent trajectories -anchored in sound fiscal policies, a low interest rate environment and resilientgrowth - Portugal may transit to the moderate risk category in a relativelyshort period of time.
Concluding remarks
DSA frameworks are very useful tools for harmonised assessments ofsovereign debt vulnerabilities in different countries and across time. Similarlyto other methodologies, in the Eurosystem DSA tool the trade-off betweencomprehensiveness and simplicity becomes apparent when methodologicalaspects are analysed in some detail. The tool is extremely rich and thorough,covering different instruments and indicators. This comes at the cost of acertain degree of complexity, which is mitigated by the presentation of resultsin a heatmap colour-scheme and the possibility of aggregation in a singlescore.
Although the framework allows for the possibility of an easy-to-graspquantitative assessment, its importance should not be overstated as thedetermination of a single score is somehow dependent on the weighting ofthe different indicators. As such, results should be interpreted with caution. Inparticular, small changes in the overall sustainability risk score may not implyan actual revision in the public debt vulnerability assessment. Larger positiveand persistent score changes should, however, act as a warning system fornational policies. In addition, the tool does provide valuable insights on theevolution of the several determinants of debt sustainability and allows forcomparative analysis when applied cross-country.
The results obtained for Portugal point to the existence of high risks tothe sustainability of public debt. These stem not only from the currentlyhigh level of government indebtedness and the resulting vulnerability toadverse shocks (as illustrated in the deterministic shock scenarios), butalso from structural imbalances (as captured by the financial position andcompetitiveness indicators). However, when compared to results obtained inprevious years, the most recent data points to an improvement in severaldimensions of sustainability as captured by the Eurosystem’s DSA tool.Also, further improvements in the sustainability assessment are likely tooccur, provided that the conduct of fiscal policy remains compatible withthe maintenance of high primary surpluses and fiscal buffers are built-up,

Banco de Portugal Economic Studies 22
particularly taking advantage of the current low interest rate environment.This is crucial to increase the resilience of the Portuguese public debtdownward path to adverse shocks.
Box 1. The European Commission’s DSA framework
The assessment of fiscal sustainability is a major component of EU’ssurveillance framework. The European Commission regularly issuesreports focusing on the matter, including the Ageing Report, the FiscalSustainability Report (both published every three years) and the annualDebt Sustainability Monitor. The Commission’s framework provides anoverall classification of risks to public finances that largely relies onits sustainability indicators: S0, an early-warning indicator focusing onshort-term risks; S1, measuring the fiscal effort required for the debt-to-GDP ratio to reach 60% in the medium-term; and the long-termsustainability indicator S2, which represents the fiscal effort requiredto stabilise the debt-to GDP ratio over an infinite horizon, taking intoaccount ageing costs. Since 2015, the Commission includes a DSA aspart of its overall sustainability assessment, by combining it with S1when gauging medium-term challenges. This ensures that the impactof different macroeconomic and fiscal assumptions on debt dynamics isdully accounted for. As of 2018, this DSA framework is also used to assesslong-term sustainability in conjunction with S2, in order to overcome thelimitations of this indicator.a
Like the Eurosystem’s methodology, the Commission’s DSA relieson deterministic debt projections for a 10-year horizon and a stochasticanalysis focusing on a five-year period. The deterministic part consists ofa baseline scenario assuming no-fiscal policy change (with the structuralprimary balance remaining constant at the level corresponding to thelast year in the Commission’s forecast), taking into account ageing-related expenditures, and a historical scenario (according to which thestructural primary balance converges to its historical average in fouryears).b The risk assessment focuses on three indicators: the debt-to-GDPlevel at the end of the 10-year simulation period; the year at which thedebt ratio peaks; and the comparison between the average structuralprimary balance over the simulation horizon and a benchmark providedby the distribution of the same variable in a sample of EU-28 countries(currently over 1980-2018). Thus, this assessment partly disregards thesignals in terms of debt dynamics captured by the slopes of the simulatedpaths. Moreover, gauging the plausibility of primary balances over thesimulations could benefit from a stronger country-specific component- as it is the case with the fiscal fatigue indicator in the Eurosystem’sDSA framework. The resilience of the deterministic paths is assessed by

23
applying standardized shocks to the growth rate of GDP, the interest rateand the primary balance, and looking at the resulting debt-to-GDP ratioat the end of the horizon and at the peak year.
Regarding the stochastic analysis, it is based on the simulation ofa large number of shocks (2000) derived on the basis of the country-specific historical volatilities and affecting the primary balance, real GDPgrowth, interest rates and the exchange rate. The resulting simulationsare evaluated in terms of the probability of debt standing above the initiallevel after a five-year period and the dispersion of the distribution ofsimulated debt paths.
Note that, although not relevant for the determination of therisk category, the Commission’s framework includes other alternativescenarios. The respective results may be used complementarily asadditional risk or mitigating factors for the purpose of an overallassessment. Such assessment may also take into account additionalsensitivity tests and other indicators such as short- and long-termprojections for financial needs, market perception, the existing debtprofile in terms of maturity, type of currency and holders, as well asgovernments’ assets and liabilities. Most of these considerations are anintegral part of the Eurosystem’s DSA, which further incorporates risksstemming from institutional factors.
The Commission’s overall assessment of fiscal sustainability risks isnot summarised in a single score. It rather relies on a three-colour scheme(red, yellow and green, respectively for high, medium or low risks) thatmay apply differently across time horizons (short, medium or long-term).While the short-term assessment is based solely on the S0 indicator, theresults of the DSA contribute to the evaluation of the medium and long-term risk categories, as mentioned before.
In particular, for the overall classification of medium-term fiscal risks,the DSA and the S1 indicator have equal contributions. However, for thesake of prudence, if they point to different categories, the one implyinghigher risks prevails. As regards the long-term, the S2 indicator prevailsover the DSA if the latter points to a lower risk category. On the contrary,if the DSA points to higher risks, the overall classification correspondsto the category immediately above the one implied by S2 (eg, if the DSApoints to high or medium risks and S2 signals low risks, risks to debtsustainability would be classified as medium in the long-term).
a. In particular, the S2 indicator does not capture vulnerabilities stemming from the factthat debt ratios may stabilize at a very high level.b. For additional details on the assumptions underlying the various scenarios in theCommission’s DSA, refer to Box 1.1 in the 2018 Fiscal Sustainability Report.

Banco de Portugal Economic Studies 24
References
Amador, J., C. Braz, M.M. Campos, S. Sazedj, and L. Wemans (2016). “Publicdebt sustainability: Methodologies and debates in European institutions.”Banco de Portugal Occasional Paper 1.
Bouabdallah, O., C. Checherita-Westphal, T. Warmedinger, F. Drudi, R. Setzer,R. De Stefani, and A. Westphal (2017). “Debt sustainability analysis for euroarea sovereigns: a methodological framework.” Occasional Paper Series 185,European Central Bank.
Bouabdallah, O. and B. Cozmanca (2019). “Stochastic debt sustainabilityanalysis for euro area countries: a novel approach.” Presentation deliveredin the Central Bank of Malta Public Finance Workshop.
Braz, C., M. Campos, and S. Sazedj (2019). “The new ESCB methodology forthe calculation of cyclically adjusted budget balances: an application to thePortuguese case.” Banco de Portugal Economic Studies, V(2), 19–42.
Checherita-Westphal, C., O. Bouabdallah, J. Domingues-Semeano, S. VanParys, J. Zimmer, D. Papaoikonomou, M. Alloza, P. Burriel, P. Rizza,M. Polemidiotis, O. Delobbe, M. Campos, and J. Kivisto (2018). “Technicalrevisions to the ESCB debt sustainability analysis (DSA) method.” Mimeo.
Checherita-Westphal, C. and V. Zdarek (2017). “Fiscal reaction function andfiscal fatigue: evidence for the euro area.” Working Paper 2036, EuropeanCentral Bank.
ECB (2008). “The new euro area yield curves.” ECB Monthly Bulletin, February.European Commission (2014). “Assessing public debt sustainability in EU
member states: a guide.” Occasional Papers, 200, September.Svensson, L. (1994). “Estimating and interpreting forward interest rates:
Sweden 1992-1994.” NBER Working Paper, (4871).