integrated assessment of socio-economic risks of · pdf fileintegrated assessment of...
TRANSCRIPT

Seediscussions,stats,andauthorprofilesforthispublicationat:https://www.researchgate.net/publication/298906016
Integratedassessmentofsocio-economicrisksofhazardoushydrologicalphenomenainSlavyanskmunicipaldistrict
ArticleinNaturalHazards·March2016
ImpactFactor:1.72·DOI:10.1007/s11069-016-2290-4
READS
7
5authors,including:
StepanZemtsov
RussianPresidentialAcademyofNational…
42PUBLICATIONS12CITATIONS
SEEPROFILE
Allin-textreferencesunderlinedinbluearelinkedtopublicationsonResearchGate,
lettingyouaccessandreadthemimmediately.
Availablefrom:StepanZemtsov
Retrievedon:27June2016

1
INTEGRATED ASSESSMENT OF SOCIO-ECONOMIC RISKS OF HAZARDOUS
HYDROLOGICAL PHENOMENA IN SLAVYANSK MUNICIPAL DISTRICT
Stepan P. Zemtsov1*, Mariya D. Goryachko
2, Vyacheslav L. Baburin
2, Inna N. Krylenko
3,
Natalia M. Yumina3
1 Institute of applied economic research, The Russian Presidential Academy of National Economy and Public
Administration. 119571, Russia, Moscow, Prospect Vernadskogo 82.
Phone: +7 495 6294386. E-mail: [email protected] 2 Department of economic and social geography of Russia, Faculty of Geography, Lomonosov Moscow State
University. 119991, Russia, Moscow, Leninskiye Gory 1. Phone: +7 495 9393812. E-mail: [email protected] 3 Department of hydrology, Faculty of Geography, Lomonosov Moscow State University
119991, Russia, Moscow, GSP-1, 1 Leninskiye Gory. Phone: +7 495 9392238. E-mail: [email protected]
*Corresponding author (e-mail: [email protected])
ABSTRACT
In 2012 the damage costs of floods in Russia amounted to about €300m, and these floods
have caused nearly 200 fatalities (Kotlyakov et al. 2013). Risk assessment is one of the most
pressing scientific topics in Russia, but most of the works are devoted to natural hazards
assessment. The purpose of this work is to estimate the influence of hazardous hydrological
phenomena on society. The field research was conducted in the Slavyansk municipal district in
the Krasnodar region (the south-western part of Russia), which is a highly populated coastal
territory with a high frequency of hazardous hydrological events.
Modified methods of the Ministry of the Russian Federation for Affairs for Civil
Defence, Emergencies and Elimination of Consequences of Natural Disasters (EMERCOM)
were used for potential economic damage calculation. The paper did not only focus on direct,
tangible risks, but also included social risk (i.e. risk to life and health). Social vulnerability has
been calculated directly as a percentage of vulnerable people, estimated in opinion polls, while in
many recent papers the social vulnerability index was calculated as a combination of several
statistical indicators. The resulting percentage of vulnerable people was converted to numbers of
potential victims. Finally the social risk was expressed by financial indicators in terms of the cost
of the value of statistical life lost (Mrozek & Taylor 2002; Viscusi & Aldy 2003).
Social risk can be underestimated in comparison with economic risk because of a low
“value of life” in Russia (no life insurance, neglecting of basic safety rules, etc.) (Guriev 2009).
INTRODUCTION
Various natural hazards are quite common on the territory of Russia (Miagkov 1995;
Golitsyna & Vasilyeva 2001; Borodko & Kotlyakov 2007; Shoygu et al. 2010), constantly
causing destruction and death. Most widespread hazards are in mountain and coastal areas.

2
Incidents with a regional impact resulting from mountain hazards, including mud- and
debris flows, resulted in between 10 and 50 victims each (Fuchs et al. 2013). Minor events are
regularly reported; however, details other than qualitative are not available on the national scale.
Out of 144 cases of torrent events that caused damage to the population in 1991–2008, 130
occurred in the Northern Caucasus, five in the East Siberia and four in the Far East. In 2001–
2008, compared with 1991–2000, the number of torrent events with known damage almost
doubled in the Russian mountain regions, which may be a result of urbanisation and changes in
the land cover (Shagin 2010; Fuchs et al. 2013; Sokratov et al. 2013).
Hydrological phenomena on plain areas (floods, storm surges, ground water level rise,
etc.) are one of the main natural hazards in Russia (Miagkov 1995; Petrova 2006; Shoygu et al.
2010; Koronkevich et al. 2010; Gladkevich et al. 2011). More than 10 million people, or 7.2 per
cent of the population, are exposed (Shakhramanjyan 2001; Ministry of Finance 2011), and the
area, affected by flooding, covers over 0.5 million km2, or 2.9 per cent of Russian territory
(Shakhramanjyan 2001; Taratunin 2008).
Estimations of EMERCOM and of the Institute of Geography of the Russian Academy of
Sciences (RAS) have shown that the 2012 flood losses in Russia amounted to about €300m and
caused nearly 200 fatalities; Krymsk citizens in the Krasnodar region in August 2012
experienced particularly destructive consequences (Kotlyakov et al. 2013.).
In Russia, most of the works are related to physical-geographical characteristics and the
probability evaluation of hazardous phenomena (Gladkevich et al. 2011). An important scientific
area is the development of hazard maps (Merz et al. 2007; de Moel et al. 2009). One of the
results of such an evaluation is the zoning map of Russia according to the degree of flood hazard
for coastal areas, which is based on information about maximum flood levels during the passage
of high water in the rivers, as well as the probability of exceeding these levels (Borodko &
Kotlyakov 2007). Maps of flood intensity (Koronkevich et al. 2010), based on the same
information about the height and frequency of flooding, were developed by a group of authors in
the Institute of Geography in the RAS. Maps of flooding danger (Shoygu et al. 2010), based on
data of Hydrometeorological centre of Russia, were created in the Institute of Civil Defence.
There are many classifications of floods, defining the hazard level, taking into account
the probability, duration and area of flooding (Dobroumov & Tumanovska 2002), the depth and
duration of flooding (Karlin 2008), the repeatability, maximum water levels, duration and area of
river flooding (Taratunin 2008). The main characteristics for flood hazard description are:
maximum exceedance levels of early flooding, probability levels of early flooding (Golitsyna &
Vasilyeva 2001; Borodko & Kotlyakov 2007), total duration of flooding (Semenov & Korshunov
2008) and proportion of flooded area (Koronkevich et al. 2010).

3
However, most of the works are based on natural factors and did not take into account a
number of socio-economic indicators. An assessment of flooding impact on socio-economic
development is rarely considered (Petrova 2006; Shagin 2010; Gladkevich et al. 2011). Apart
from common river flooding, flood events in coastal regions are the one the main themes in risk
management (Baburin et al. 2009; Arkhipkin & Mukhametov 2011; Zemtsov et al. 2012, 2013),
but the focus in this works is on the assessment of potential economic damage (Avakyan &
Polyushkin 1991; Borsch & Mukhin 2000), while in studies focusing on flood in other European
countries social vulnerability is more often reported (Birkmann 2007; Fekete 2010; Fuchs et al.
2011; Field et al. 2012; Fuchs et al. 2012, Aubrecht et al., 2013; Birkmann et al. 2013). The main
gap for Russian studies is a lack of works dedicated to the vulnerability of communities.
There are three different hardly integrated approaches for risk assessment related to
natural hazards1 (Fuchs et al. 2011), and scientists from different spheres can use various and
unrelated methods for quantification (Fuchs et al. 2012). Geoscientists are tending to explore
natural hazards, and how they affect the environment (Keiler et al. 2010; Papathoma-Köhle et al.
2011). Economic consequences of disaster events are the main task for economists and related
scientists (Noy 2009). Social loss is the problem of sociology-related disciplines, because a research
should take into account social structures and interactions (Cutter & Finch 2008; Cutter et al. 2008).
Any hazardous event has a disaster risk2, which can be defined as a composition of event
occurrence probability and associated potential damages (Ologunorisa & Abawua 2005; Pistrik &
Tsakiris 2007; Mikhailov et al 2010). Usually, three main categories of potential damages can be
distinguished: environment, infrastructure and people, and consequently, three approaches for
disaster risk quantification can be observed: environmental, economic and social risks. Social-
economic risk in the work is a product of hazardous event occurrence probability and potential
economic (e.g. loss of profit) and social (e.g. injuries or destruction of social network) losses.
Every system (ecological, technological or social) has its own level of resistance to disaster risk.
The opposite term is vulnerability or “the degree of damage that can be expected depending on
the characteristics of an ‘element at risk’ with respect to a certain hazard” (Fuchs et al. 2011)3.
Vulnerability can be divided into susceptibility, coping and adaptive capacity of the object
(Birkmann 2006, 2007; Fekete 2010; Fuchs et al. 2012, Birkmann et al. 2013).
In our study we focus on socio-economic systems of coastal zones and their vulnerability
during and after flood events. The main purpose of the work is to estimate the potential
1 Hazard is “a physical event, phenomenon or human activity with the potential to result in harm. A hazard does not
necessarily lead to harm” (Gouldby & Samuels 2005) 2 Risk is “a probability multiplied by consequence in which the multiplication is to be understood as including the
combination across all floods” (Gouldby & Samuels 2005) 3 Another proper definition is “a characteristic of a system that describes its potential to be harmed. This can be
considered as a combination of susceptibility and value” (Gouldby & Samuels 2005)
4
consequences of flooding on society, using economic damage and social vulnerability
assessment techniques. One of the main scientific motivations for the paper was to assess not
only economic, "tangible" risk, but also social risk components, and integrate them.
Although Russia has one of the lowest socio-economic risks world-wide, and only 9.4%
of Russian population is exposed to natural hazards (World Risk Report 2012), the risk among
regions is very unevenly distributed. As such, the risk for coastal areas is considerably higher
than the risk for inner land, because of a significantly higher temporal and spatial concentration
of hazards, higher density of population4 and national wealth (infrastructure and fixed assets) in
coastal areas (Martinez et al. 2007).
In the work of Gladkevich et al. (2011), related to the complex multifactorial flood risk
assessment in Russia, the Russian regions were divided into groups of different flood exposure
by using a flood hazard index5 (Fig. 1); this index was used in our work to identify the most
affected and most exposed regions. The Krasnodar region6 in the south-western part of Russia
has a very high flood risk index and one of the highest rates for natural hazards in general
(Myagkov 1995; Golitsyna & Vasilyeva 2001). Therefore, the Krasnodar region was chosen for
an in-depth analysis of vulnerability and risk. In the work of Zemtsov et al. (2013) social
vulnerability of municipal communities in the Krasnodar region was assessed by developing an
integrative index. This index was based on the World Risk Index methodology (World risk index
2012; Birkmann, 2006, 2007). The coastal municipal districts in the Kuban river mouth were
identified as specifically high-risk territories because of high probability and duration of
flooding, high population density on the coast of the rivers and seas (Matishov & Matishov
2013) and a significant portion of the population engaged in agriculture and tourism, which are
more vulnerable to flooding than population working in the industrial sector or other spheres.
The Slavyansk municipal district was chosen for detailed analyses of causes and effects
of the risk. The area is located in the delta of the Kuban River (Fig. 2) at a height of 1-2 meters
above sea level. Hazardous hydrological phenomena are regular (Mikhailov et al 2010), affecting
the economy and threatening the health and lives of people. According to Table 1, approximately
3600 people were injured by floods during the last twenty years. In order to assess the
vulnerability within this region we used a method that combined both economic and social
approaches of vulnerability quantification.
4 In this case, we are talking about the coastal areas of warm seas (the Black, the Baltic seas and the sea of Japan)
5 Index of hazard = 0.5*(duration of flooding) + 0.2*(maximum depth of flooding) + 0.1*(probability of flooding) +
0.1*(percentage of flooding area) + 0.1*(curve type of water discharge, which is forming riverbed). Curve of water
discharge, forming riverbed, determines the danger of channel and floodplain rearrangement 6 Krasnodar is the regional capital, which is presented on the map

5
1. METHODS AND DATA
Risk from flooding can be divided into several different types (ecological, social,
economic, etc.) and corresponding categories of damages (loss of vegetation, building
destruction, etc.) (Zemtsov et al. 2013) (Table 2). Starting with a scientific or engineering
approach, risk is regularly defined as a product of a flooding probability and associated potential
damages (Ologunorisa & Abawua 2005; Mikhailov et al. 2010; United Nations 2013).
jik
kijSocial
j
jik
kijEconomic
j
jikr
rkijj
r r
rr DpDpDpDpRR,,,,,,,
(1)
where R is an integrated socio-economic risk, or potential annual loss (million € per year), as the
sum of two types of risks r: economic and social; p is a flooding probability (in shares),
according a category of flood danger j; D is an expected maximum potential damage (DEconomic
;
DSocial
) (million €) of an object i (e.g. a settlement), according its category of damage k7.
Floods in the Kuban river delta have been classified according to the degree of danger j
into three categories (Dobroumov & Tumanovska 2002; EMERCOM 2011)8: widespread
process of ground water level rise (average probability (p) for most of the settlements is 0.99 per
year), floods because of the failure of earth dams with a medium level of danger (0.01)9 and
catastrophic flooding after the breakout of large reservoirs such as the Krasnodar reservoir, and a
subsequent destruction of the earth dams (0.001).
The basic model for integral damage calculation (D) in discrete form is
ji ji
ijijiijk SVdDD, ,
(2)
where d is a maximum potential value of an exposed object i (i varies according to the category
of damage k) per unit of area (million € per km2); V is an vulnerability indicator of an object i (in
shares), depending on flood hazard zone j (by categories of danger: 1 – groundwater level rise, 2
– medium flooding, 3 – catastrophic flooding); S is the size of an area, covered by i (km2).
)( ijijij CSusfV (3)
where f is a function, Sus is the susceptibility of an object to flooding, C is an ability of an object
to resist the impacts of flooding.
To calculate the economic risk, several categories of potential damage were identified:
investmentPlannedinvestmentExistestatealtureInfrastrucassetsFixedeAgricultur
Economic DDDDDDD ___Re_ (4)
7 All used indicators were entered as separate layers in a geographical information system.
8 Probability of natural and technogenic disasters were estimated according to data of local department of
EMERCOM (collected during field trip) 9 Russian authorities over the last 20 years almost did not invest in the construction and maintenance of earthen
dams
6
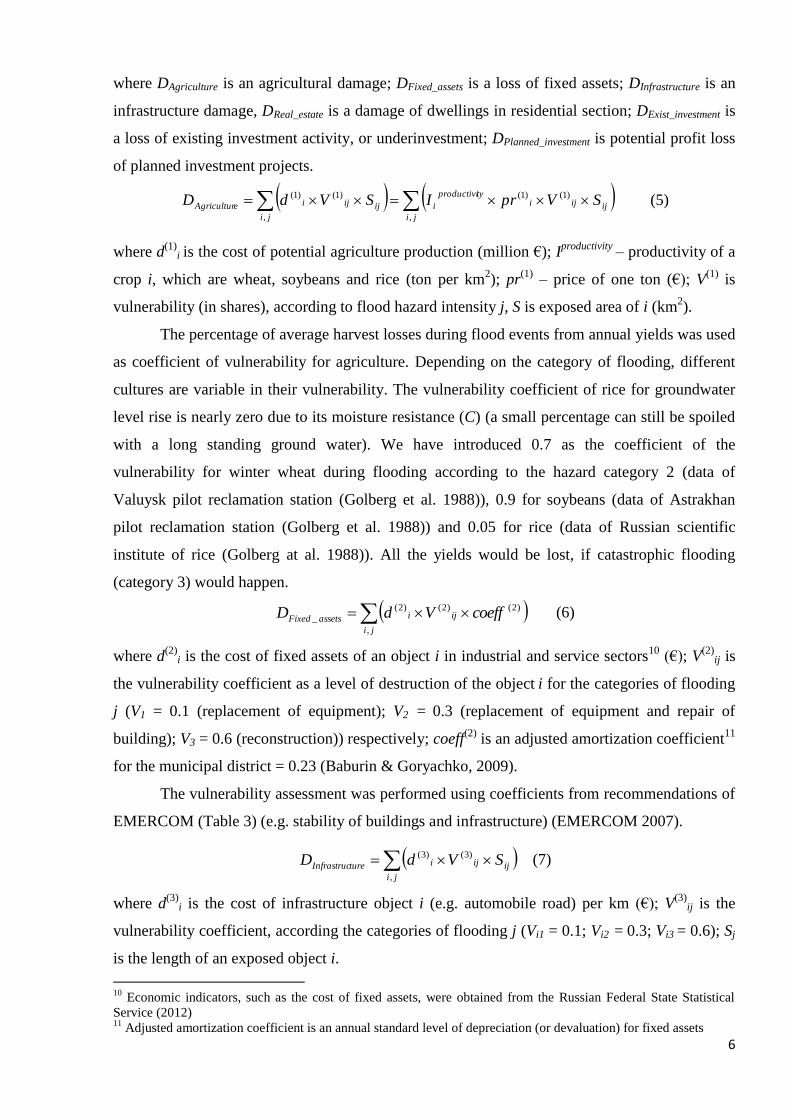
where DAgriculture is an agricultural damage; DFixed_assets is a loss of fixed assets; DInfrastructure is an
infrastructure damage, DReal_estate is a damage of dwellings in residential section; DExist_investment is
a loss of existing investment activity, or underinvestment; DPlanned_investment is potential profit loss
of planned investment projects.
ji
ijijityproductivi
i
ji
ijijieAgricultur SVprISVdD,
)1()1(
,
)1()1( (5)
where d(1)
i is the cost of potential agriculture production (million €); I
productivity – productivity of a
crop i, which are wheat, soybeans and rice (ton per km2); pr
(1) – price of one ton (€); V
(1) is
vulnerability (in shares), according to flood hazard intensity j, S is exposed area of i (km2).
The percentage of average harvest losses during flood events from annual yields was used
as coefficient of vulnerability for agriculture. Depending on the category of flooding, different
cultures are variable in their vulnerability. The vulnerability coefficient of rice for groundwater
level rise is nearly zero due to its moisture resistance (C) (a small percentage can still be spoiled
with a long standing ground water). We have introduced 0.7 as the coefficient of the
vulnerability for winter wheat during flooding according to the hazard category 2 (data of
Valuysk pilot reclamation station (Golberg et al. 1988)), 0.9 for soybeans (data of Astrakhan
pilot reclamation station (Golberg et al. 1988)) and 0.05 for rice (data of Russian scientific
institute of rice (Golberg at al. 1988)). All the yields would be lost, if catastrophic flooding
(category 3) would happen.
ji
ijiassetsFixed coeffVdD,
)2()2()2(
_ (6)
where d(2)
i is the cost of fixed assets of an object i in industrial and service sectors10
(€); V(2)
ij is
the vulnerability coefficient as a level of destruction of the object i for the categories of flooding
j (V1 = 0.1 (replacement of equipment); V2 = 0.3 (replacement of equipment and repair of
building); V3 = 0.6 (reconstruction)) respectively; coeff(2)
is an adjusted amortization coefficient11
for the municipal district = 0.23 (Baburin & Goryachko, 2009).
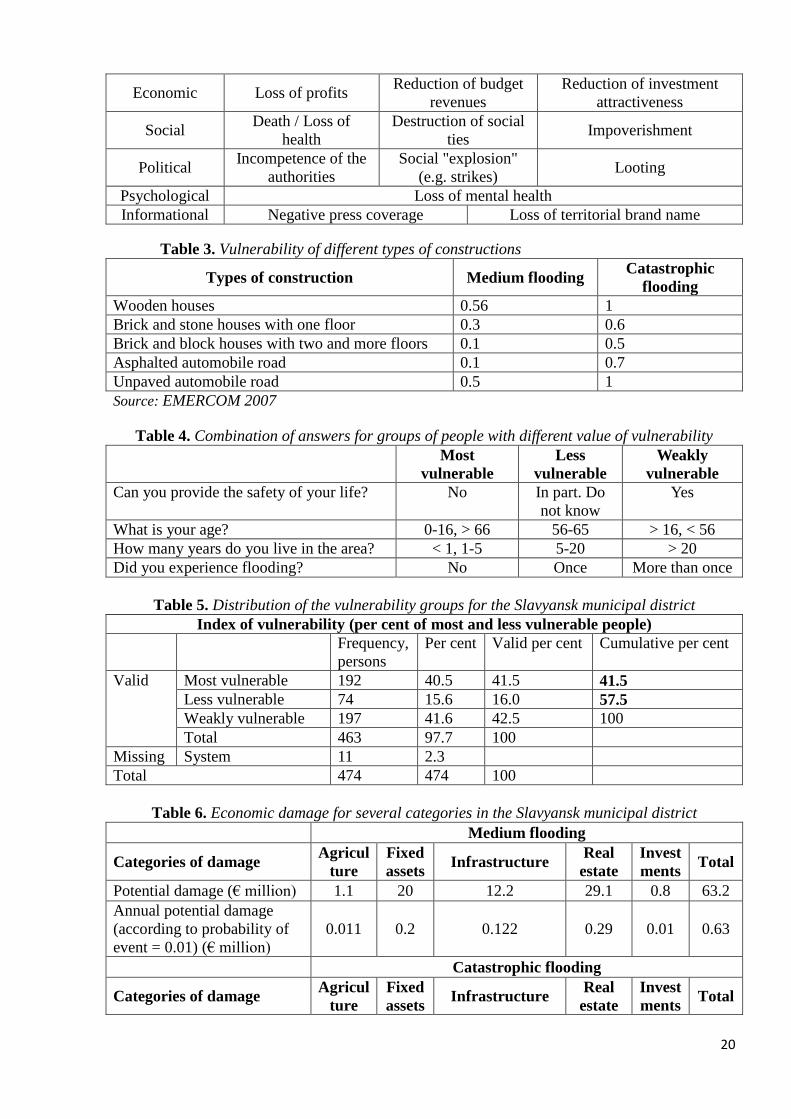
The vulnerability assessment was performed using coefficients from recommendations of
EMERCOM (Table 3) (e.g. stability of buildings and infrastructure) (EMERCOM 2007).
ji
ijijitureInfrastruc SVdD,
)3()3( (7)
where d(3)
i is the cost of infrastructure object i (e.g. automobile road) per km (€); V(3)
ij is the
vulnerability coefficient, according the categories of flooding j (Vi1 = 0.1; Vi2 = 0.3; Vi3 = 0.6); Sj
is the length of an exposed object i.
10
Economic indicators, such as the cost of fixed assets, were obtained from the Russian Federal State Statistical
Service (2012) 11
Adjusted amortization coefficient is an annual standard level of depreciation (or devaluation) for fixed assets

7
cji
ijcijciestateal SVdD,,
)4()4(
_Re (8)
where d(4)
i is the market price of an object i per m2 (€); V
(4)ijc is the rate of destruction (in shares)
of objects i for event j, according to three types of construction c: wooden houses, brick and
stone houses with one floor and brick and block houses with two and more floors; S is an
exposed area (m2). The vulnerability coefficients for objects can be determined by table 3. The
used methodology is the official guideline for damage calculation in Russia (EMERCOM 2007).
A map of residential property prices of Slavyansk-on-Kuban, which was developed for the
research, was based on data from free media and local real estate agencies.
10
2012
2002
_
__
_
t
tassetsFixed
tassetsFixed
tInvestment
tassetsFixed
tInvestment
investmentExist
MDRF
RF
MD
MD
D (9)
where t is a year; MDInvestment
t is an amount of investment to fixed assets in the Slavyansk
municipal district (€); MDFixed_assets
t is the cost of fixed assets in the district (€); RFInvestment
t is an
amount of investment to fixed assets in the Russian Federation (€); RFFixed_assets
t is the cost of
fixed assets in the country (€).We have made a strong assumption, that all the underinvestment
of the district were related to its unattractiveness because of natural hazards.
T
t ijti
ti
ji
iinvestmentPlannedVCOF
CIFdD
2012)5(
,
)5(
_)1(
(10)
where d(5)
i is a total investment of an project i (€); t is a year, T is a number of years of
investment project i realization; CIF is a cash-in-flow and COF is a cash-out-flow of a project i
(€)12
; V(5)
ij is a vulnerability estimation, according to the different hazard zones j. Our assumption
was that groundwater level rise can generate additional 10% to the total annual cash-out-flow, medium
flooding – 50% and catastrophic scenario can double the total annual cash-out-flow. There was a
database of planned or expected investment projects with its common financial characteristics.
Component analysis of the data (Fekete 2010), collected in opinion polls, was conducted
to identify, in the first step, the most related and valuable questions and, in the second step, to
estimate the proportion of weakly, less and most vulnerable people in settlements according to
the answers of the questions. This proportion was named vulnerability index. Polls were
representative by age and gender, 485 respondents participated in the survey. Based on selected
questions (Table 4) we defined three groups of people with different vulnerability: most
vulnerable (41.5% of the total population in Slavyansk district), less vulnerable (16%) and
weakly vulnerable (42.5%). The first indicator will be used as an index of social vulnerability
12
For more information about cash-in-flow and cash-out-flow calculation see DeFusco et al (2001)

8
(V5) for medium flooding; the sum of the first and the second indicators (57.5%) is a social
vulnerability index for catastrophic flooding.
ji
LDeath
ijDeath
ijiji
ji
LVictims
ijVictims
ijijiLSocial coeffVVScoeffVVSD
,
)6(
,
)6(
(11)
where L is an approach of estimation (L1 is proposed by the authors; L2 is used by Russian
government nowadays); ρ is a population density of a settlement i (person per km2); S is a an
exposed (flood prone) area of settlement i (km2); V
(6) is the social vulnerability index (in shares);
VVictims
is the share of vulnerable people, who are potential victims and potentially will have
health problems after a flooding (0.02 is for a medium flooding; 0.05 is for a catastrophic
flooding (EMERCOM 2007)13
); coeffVictims
is an indicator of an average health losses per one
person: L1 is a share of an average health insurance coverage in the USA, adjusted for gross
domestic product difference between the USA and Russia (€ 5,000 per capita, Guriev 2010), and
L2 is an average free medical insurance coverage for dismemberment in Russia (€ 1,200 per
capita); VDeath
is the death rate or the share of potentially dead persons during a flooding (0.05 is
for medium; 0.1 is for catastrophic flooding (EMERCOM 2007)); coeffDeath
is a financial
estimation of a statistical life loss value: L1 is an average value of life insurances in the USA14
,
adjusted for gross domestic product difference between the USA and Russia (€1.5m per life lost
(Guriev 2010))15
and L2 is the loss of a family with respect to the primary earner (approximately
€ 50,000 per life lost (EMERCOM 2007)).
Subsequently, some risk simulations for settlements were conducted to show the temporal
(people at night are less prepared) and seasonal (tourists are less prepared) dynamics.
2. DISCUSSION OF RESULTS
In the following section, examples of the study results are provided.
Fig. 3 shows the map of flood zones, according the danger categories, and population
density in settlements. The blue colour areas show the potential catastrophic flooding areas after
a breakout of the Krasnodar reservoir and the destruction of the earth dams. The black hatched
13
The methodology was developed in Soviet period. Number of victims and injuries depends on intensity, duration,
height and destructive power of flooding. Nowadays, it is more like a practical guide for assessment, consisting of
normative values without any explanation of its origin. Our flooding parameters were compared to EMERCOM
methodology. For similar information see Kahn (2005), Penning-Rowsell et al. (2005), Jonkman et al. (2008) 14
Monetization of life loss is debatable issue in literature (Mrozek & Taylor 2002; Viscusi & Aldy 2003), but we
apply it in the paper because it is one of the most reasonable approaches for comparing economic and social risks.
High value of life can be expressed as life and medical insurance (Guriev 2009), and it is one of the best ways to
evaluate social losses, because the best way to assess anyone’s value of life is his own assessment. If the life
insurance is high and common in society, it is hard for government or business to ignore safety rules 15
This method can be called as a “real loss for society”, because it corresponds to all direct (e.g. lost possible future
profits, taxes, etc.) and indirect (e.g. previous education and health expenditure, future demographic losses, etc.)
losses in financial terms

9
areas show flooding areas of a medium danger category because of breaks of the embankment
dams. The diagonal stripes indicate a widespread process of groundwater level rise.
2.1. ECONOMIC DAMAGE
The maximum potential agricultural damage can be around €1m for a medium event and
almost €32m for the modelled catastrophic event. The agricultural system is quite sustainable for
non-catastrophic events due to high level of resilience of rice, which is the main crop.
The fixed assets damage is approximately €20m for the medium scenario and €75.7m for
the catastrophic event, which is high because of industrial buildings location in flood-prone
areas.
The infrastructure damage for the entire area, following a catastrophic flood event, can
amount to €12m, but it is €6m per year for the ground water level rise damages16
. Most of the
infrastructural objects (road network, power network, etc.) are in federal property, and
reconstruction of the objects is financed by federal government. Nevertheless, it affects social
and economic vulnerability of the local communities, especially of the settlements Achuevo and
Zaboyskiy, which are far from the municipal capital Slavyansk-on-Kuban, where the
EMERCOM unit is located.
The calculation of the real estate damages was based on the map of residential property
prices and the map of different building vulnerability (Table 3), which was developed during the
field campaign. The modelled damage after a catastrophic flood could amount to €150m, and
every year some buildings are affected by scouring/subsurface erosion. To estimate this impact,
we worked out the map of the drainage/sewage system of Slavyansk-on-Kuban, which indicated
that only blocks of brick buildings in the city centre are well protected. However, most of the
city does not have any drainage system or the drainage system is composed from earthen canals.
Even the existing system of drainage is insufficient for discharging the storm hydrograph
because of the low elevation differences of the drainage system (less than 1 m) and weakness of
the suction pumps. Moreover there is a particular challenge in clearing the drainage system from
sediments and vegetation, because local budget is in deficit and local residents are not aware of
the system requirements.
The annual investment losses of existing businesses are €38m, according to the data of
2002-2012. The total planned investment losses are about €42m for the projects with a
vulnerability index equal to 1 and €0.8m for the projects in the medium flood area.
16
It is difficult to separate the damage associated exclusively with raising of groundwater from the damage caused
by the change in temperature during the winter season

10
Total annual losses from groundwater level rise are approximately €8m17
. It can be sum
up with the annual investment losses of existing businesses: €46m is the annual damage from
unfavourable geographical location without any disasters. It is more than the total annual budget
profit of the municipality (€40m). The total potential medium damages are about to €63m, and
the losses from catastrophic events can exceed €314m. Using probability coefficients for
different categories of flooding, the damage value is €0.63m and €0.31m per year for medium
and catastrophic flooding respectively.
2.2. SOCIAL DAMAGE
The vulnerability of the local communities (settlements) has been calculated on the basis
of opinion polls. The percentage of people, who positively answered the additional questions
about preparedness for and responses to flooding are shown in Fig. 4. Every answer in the figure
is an indicator of vulnerability. The analysis shows that most of the citizens are unaware of and
are not prepared to flood events.
There are two indices in Fig. 4. Integral index is the arithmetic mean of the indices, which
were calculated for every community as a share of people in it, who gave a positive answer to the
questions in the figure (the index is calculated by the equation of linear scaling (min - max)
procedure (Fekete, 2010)). The vulnerability index is the percentage of the most vulnerable
people (Table 4 and 6)18
. Comparison between two indices on community level as a form of
verification for the social vulnerability index shows that there is no need for applying all
questions as an vulnerability indicators (Pearson's correlation coefficient between the indices is
0.9), because the most valuable questions were extracted through the component analysis.
The potential social damage (Table 7) was financially estimated (Tables 8 and 9).
The total potential social damage as a real loss for society is about €11.1m for a medium
scenario and about €272m for a catastrophic scenario (€0.52m and €10.9m according to the
government estimations), meanwhile, the economic damage is about €63m and €314m19
respectively. There is still a perception in Russia that the main damage from natural disasters is
related to buildings and infrastructure losses, which may be true for groundwater level rise20
and
medium flooding; but the potential social losses from death and health problems after
17
The highest value of the damage was calculated for the rise of groundwater, because it is annual and has an impact
on virtually all objects of agriculture, infrastructure, fixed assets and real estate, while the probability of flooding is
much lower (0.99 to 0.01 and 0.001 in comparison). There are invisible effects during long periods of time 18
The resulting vulnerability index estimation (0.58) for the Slavyansk municipal district, based on opinion polls,
corresponds to the municipal risk index results (0.59) (Zemtsov et al., 2012) 19
Krymsk tragedy damage, including government compensations for family member losses, was estimated as nearly
€300m (Kotlyakov et al. 2013) 20
The social damage from groundwater level rise is extremely small, and it is not considered in the work

11
catastrophic floods can be equal to the economic damage. Moreover, the number of vulnerable
people in summer can be two times greater than it was evaluated, because of the high touristic
attraction of the Azov seacoast and fishing marshes.
Social risks can be underestimated in comparison with the economic risk due to a low
value of human life resulting from the perception of citizens and governmental agencies (no life
or health insurance, neglecting of basic safety rules, etc.) (Guriev 2009).
CONCLUSION
The conducted field research data allowed us to identify the weaknesses in the
preparedness for the defined flood hazard scenarios in the Slavyansk municipal district, e.g.
improper state of embankment dams and storm sewers, lack of dredging in rivers, planning and
implementation of investment projects without risk analysis, etc. The main result of an opinion
poll is unwillingness of the population to face hazardous hydrological phenomena, e.g. non-
participation in local groups for protection, lack of knowledge of evacuation routes, ignorance of
an alarm system, etc. As a result approximately 5.3% of the total district population (6922
citizens) are classified as vulnerable to medium flooding, and 27% (35 134) are vulnerable to
catastrophic scenario. Areas and communities with different degrees of risk were identified. The
potential damage for a number of settlements (e.g. Achuevo and Derevyankovka) exceeded the
costs of protection measures, which raises a question of relocation.
The conducted research has shown the importance of both social and economic
components of the risk assessment. Using the previously discussed methods individually does
not bring the desired results because of the deficiencies of the Russian statistics. It is essential for
the accurate risk assessments to use the complex of methods (statistical, field observations, etc.)
on the micro scale level (settlements). The work has a practical importance for the safety of the
local communities.
The study showed that despite our understanding of the low damage from groundwater
level rise, it is the major economic risk for the municipality because of its widespread occurrence
(almost all the territory), high frequency (almost every year), constant but invisible and not
disturbing indirect effects and absence of the reliable drainage system in most of the settlements.
One of the most important results of the work was the accurate estimation of the
economic and the social risks in the equivalent measures, which could be achieved only on the
settlements level data. Although in Russia the system of protection is directed toward buildings
and infrastructure protection as the most expansive components of the socio-economic system; it
is worth noting that according to our calculations the social risk can be similar in financial values

12
during extreme natural events. The social damage may be underestimated in comparison with the
economic damages due to the low perception of the life value, the low responsibility of the local
authorities (most of the incident compensations are federal), which in turn will continue to
negatively affect the vulnerability and especially, the coping capacity in Russia.
The high risk of the coastal zones is caused by the combination of the hazardous
phenomena, high population density and high economic activity density. In Slavyansk municipal
district (as well as in other parts of Russia (Petrova 2004)), the increase of hazardous natural
events (possibly caused by the climate change) has coincided with the increasing risk and the
recurrence of the technogenic catastrophes because of the errors in the territorial planning, the
organization of the warning and the prevention systems and underinvestment of the protection
systems. Sustainable development of the Russian regional and local communities is limited by
these factors.
The primacy of the economic risk assessments persists in the Russian academic and
administrative tradition, partly due to the orientation of the Russian statistics on accounting of
the material assets. The nonmaterial parts of the national wealth (people, knowledge, social
networks, etc.) are much more difficult to evaluate.
There are approved standards, norms and regulations of EMERCOM for most risk and
damage calculations, including the standards of the number of victims’ calculations for the
varying flooding intensity. This approach can be called technocratic, or economic. The
developed standards are often adopted for the entire country and do not take into account the
regional specific, do not consider the intangible factors, such as social capital and cognitive
specifics of different communities. It is believed that the threat of the natural disasters can be
completely eliminated by creating the required protective systems, changing the environment
and development of the necessary labour and other resources of EMERCOM.
On the other hand, the role of social capital, including the prevention of the natural
disasters and coping with its consequences, is considered as an important component of
community resilience in many studies. This approach can be called socially oriented.
The concept of vulnerability in this context is a crucial link between the approaches.
Moreover, the concept of vulnerability allows building links between scientists from different
directions, EMERCOM, politicians and citizens. Vulnerability is a universal tool for measuring
the stability / instability of an exposed object (tree, building or person, etc.) in relation to the
disaster; it can be presented as a fraction of the potential losses (percentage of forest or land
degradation, percentage of injured people, etc.). Using this description of the term, the article
serves the purpose of building a bridge between the economic and the social approaches.
13
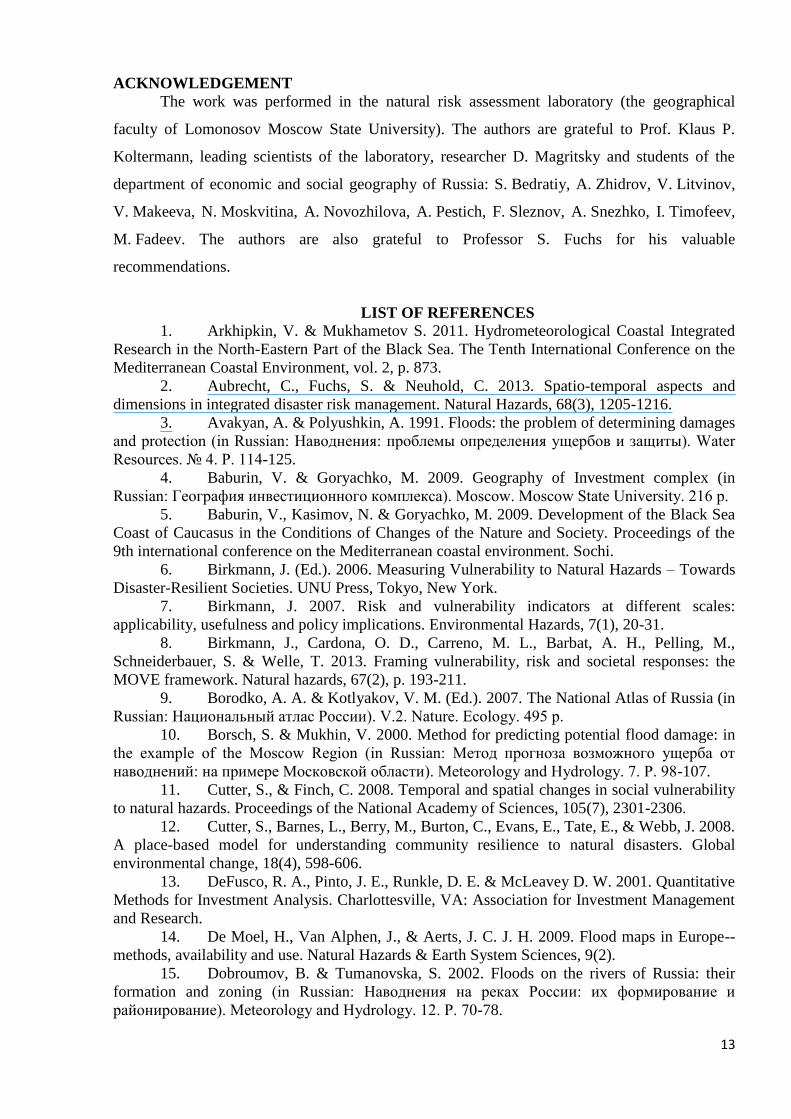
ACKNOWLEDGEMENT
The work was performed in the natural risk assessment laboratory (the geographical
faculty of Lomonosov Moscow State University). The authors are grateful to Prof. Klaus P.
Koltermann, leading scientists of the laboratory, researcher D. Magritsky and students of the
department of economic and social geography of Russia: S. Bedratiy, A. Zhidrov, V. Litvinov,
V. Makeeva, N. Moskvitina, A. Novozhilova, A. Pestich, F. Sleznov, A. Snezhko, I. Timofeev,
M. Fadeev. The authors are also grateful to Professor S. Fuchs for his valuable
recommendations.
LIST OF REFERENCES 1. Arkhipkin, V. & Mukhametov S. 2011. Hydrometeorological Coastal Integrated
Research in the North-Eastern Part of the Black Sea. The Tenth International Conference on the
Mediterranean Coastal Environment, vol. 2, p. 873.
2. Aubrecht, C., Fuchs, S. & Neuhold, C. 2013. Spatio-temporal aspects and
dimensions in integrated disaster risk management. Natural Hazards, 68(3), 1205-1216.
3. Avakyan, A. & Polyushkin, A. 1991. Floods: the problem of determining damages
and protection (in Russian: Наводнения: проблемы определения ущербов и защиты). Water
Resources. № 4. P. 114-125.
4. Baburin, V. & Goryachko, M. 2009. Geography of Investment complex (in
Russian: География инвестиционного комплекса). Moscow. Moscow State University. 216 p.
5. Baburin, V., Kasimov, N. & Goryachko, M. 2009. Development of the Black Sea
Coast of Caucasus in the Conditions of Changes of the Nature and Society. Proceedings of the
9th international conference on the Mediterranean coastal environment. Sochi.
6. Birkmann, J. (Ed.). 2006. Measuring Vulnerability to Natural Hazards – Towards
Disaster-Resilient Societies. UNU Press, Tokyo, New York.
7. Birkmann, J. 2007. Risk and vulnerability indicators at different scales:
applicability, usefulness and policy implications. Environmental Hazards, 7(1), 20-31.
8. Birkmann, J., Cardona, O. D., Carreno, M. L., Barbat, A. H., Pelling, M.,
Schneiderbauer, S. & Welle, T. 2013. Framing vulnerability, risk and societal responses: the
MOVE framework. Natural hazards, 67(2), p. 193-211.
9. Borodko, A. A. & Kotlyakov, V. M. (Ed.). 2007. The National Atlas of Russia (in
Russian: Национальный атлас России). V.2. Nature. Ecology. 495 p.
10. Borsch, S. & Mukhin, V. 2000. Method for predicting potential flood damage: in
the example of the Moscow Region (in Russian: Метод прогноза возможного ущерба от
наводнений: на примере Московской области). Meteorology and Hydrology. 7. P. 98-107.
11. Cutter, S., & Finch, C. 2008. Temporal and spatial changes in social vulnerability
to natural hazards. Proceedings of the National Academy of Sciences, 105(7), 2301-2306.
12. Cutter, S., Barnes, L., Berry, M., Burton, C., Evans, E., Tate, E., & Webb, J. 2008.
A place-based model for understanding community resilience to natural disasters. Global
environmental change, 18(4), 598-606.
13. DeFusco, R. A., Pinto, J. E., Runkle, D. E. & McLeavey D. W. 2001. Quantitative
Methods for Investment Analysis. Charlottesville, VA: Association for Investment Management
and Research.
14. De Moel, H., Van Alphen, J., & Aerts, J. C. J. H. 2009. Flood maps in Europe--
methods, availability and use. Natural Hazards & Earth System Sciences, 9(2).
15. Dobroumov, B. & Tumanovska, S. 2002. Floods on the rivers of Russia: their
formation and zoning (in Russian: Наводнения на реках России: их формирование и
районирование). Meteorology and Hydrology. 12. P. 70-78.

14
16. EMERCOM. 2007. The Method for Determining of the Damage that Can Affect
Life and Health of Persons, Property of People and Entities as a Result of Shipping Waterworks
Accident (in Russian: Методика определения размера вреда, который может быть причинен
жизни, здоровью физических лиц, имуществу физических и юридических лиц в
результате аварии судоходных гидротехнических сооружений). Moscow.
17. EMERCOM. 2011. Guidelines for the organization and implementation of
activities aimed at reducing the effects of spring floods and floods (in Russian: Методические
рекомендации по организации и проведении мероприятий, направленных на снижение
последствий весеннего половодья и паводков). Moscow.
18. Fekete, A. 2010. Assessment of Social Vulnerability to River Floods in Germany.
Bonn, UNU-EHS. Graduate Research Series vol. 4.
19. Field, C. B., Barros V., Stocker T. F., Dahe Q., Dokken D. J., Plattner G-K., Ebi
K. L., Allen S. K., Mastrandrea M. D., Tignor M., Mach K. J., Midgley P. M. (Ed.). 2012.
Managing the risks of extreme events and disasters to advance climate change adaptation: special
report of the intergovernmental panel on climate change. Cambridge University Press.
20. Fuchs, S., Birkmann, J. & Glade, T. 2012. Vulnerability assessment in natural
hazard and risk analysis: current approaches and future challenges. Natural Hazards, 1-7.
21. Fuchs, S., Keiler, M., Sokratov, S. & Shnyparkov, A. 2013. Spatiotemporal
dynamics: the need for an innovative approach in mountain hazard risk management. Natural
hazards, 68(3). P. 1217-1241.
22. Fuchs, S., Kuhlicke, C. & Meyer, V. 2011. Editorial for the special issue:
vulnerability to natural hazards—the challenge of integration. Natural Hazards, 58(2), 609-619.
23. Gladkevich, G, Frolova, N. & Terskiy, P. 2011. Complex Multifactorial Risk
Assessment of Flooding in Russia (in Russian: Комплексная многофакторная оценка
опасности наводнений в России). In The Resources and quality of surface waters: evaluation,
prognosis and management. Moscow.
24. Golberg, M., Volobueva, G. & Faley A. 1988 (in Russian: Опасные явления
погоды и урожай). Hazardous weather conditions and harvest. Minsk. Uradzhay.
25. Golitsyna, G. S. & Vasilyeva, A. A. (Ed.). 2001. Natural hazards in Russia.
Volume 6. Hydrometeorological hazards (in Russian: Природные опасности России.
Гидрометеорологические опасности). Moscow. "Crook". P. 25-63.
26. Gouldby, B., & Samuels, P. 2005. Language of risk-project definitions. Floodsite
project report T32-04-01.
27. Guriev, S. 2009. Myths of Economics (in Russian: Мифы экономики). Moscow:
Alpina Business Books.
28. Jonkman, S. N., Vrijling, J. K., & Vrouwenvelder, A. C. 2008. Methods for the
estimation of loss of life due to floods: a literature review and a proposal for a new method.
Natural Hazards, 46(3), 353-389.
29. Kahn, M. E. 2005. The death toll from natural disasters: the role of income,
geography, and institutions. Review of Economics and Statistics, 87(2), 271-284.
30. Karlin, L. N. (Ed.), Vankevich, R. Ye., Tumanovskaya, S. M., Andreyeva, Ye. S.,
Yefimova, Y. V., Khaymina, O. V., Klevanniy, K. A., Frumin, G. T., Yeromina, T. R.,
Yershova, A. A. 2008. Hydrometeorological risks (in Russian: Гидрометеорологические
риски). Saint-Petersburg. RSHMU. 282 p.
31. Keiler, M., Knight, J., & Harrison, S. 2010. Climate change and
geomorphological hazards in the eastern European Alps. Philosophical Transactions of the Royal
Society A: Mathematical, Physical and Engineering Sciences, 368(1919), 2461-2479.
32. Koronkevich, N. Barabanov, N. & Zaitsev, I. (Ed.). Extreme hydrological
situations (in Russian: Экстремальные гидрологические ситуации). 2010. - Moscow: Media-
Press. 464 p.
15
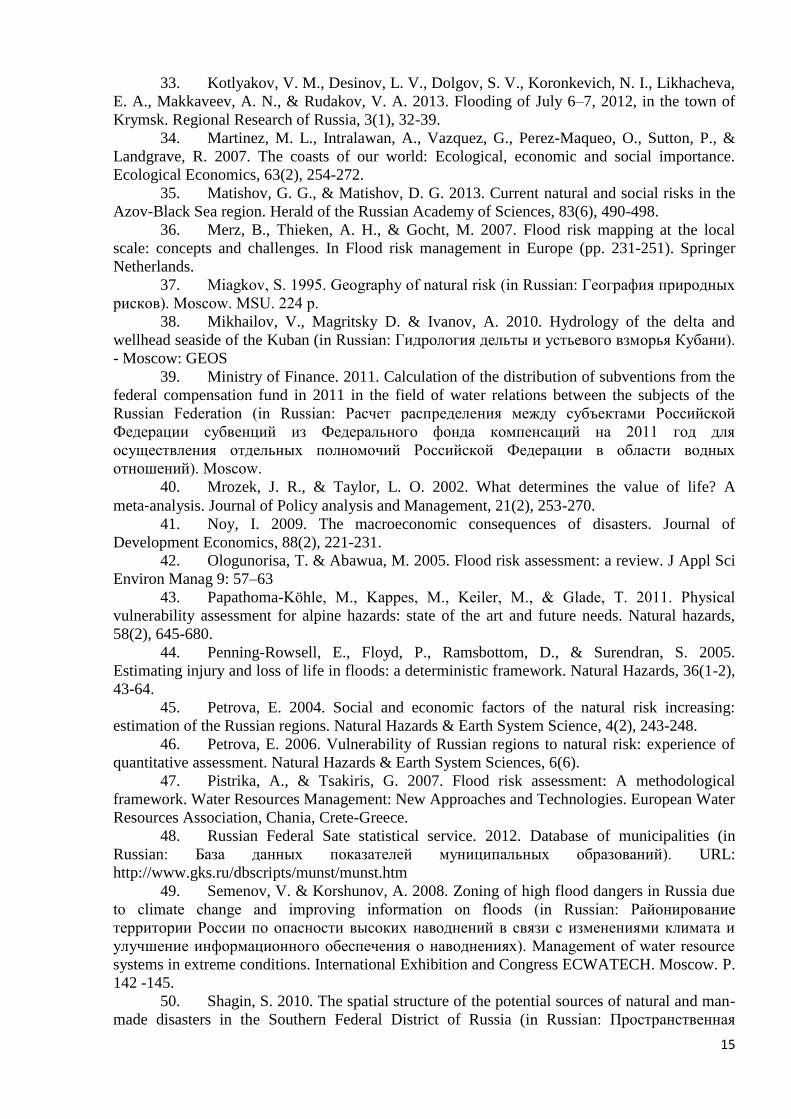
33. Kotlyakov, V. M., Desinov, L. V., Dolgov, S. V., Koronkevich, N. I., Likhacheva,
E. A., Makkaveev, A. N., & Rudakov, V. A. 2013. Flooding of July 6–7, 2012, in the town of
Krymsk. Regional Research of Russia, 3(1), 32-39.
34. Martinez, M. L., Intralawan, A., Vazquez, G., Perez-Maqueo, O., Sutton, P., &
Landgrave, R. 2007. The coasts of our world: Ecological, economic and social importance.
Ecological Economics, 63(2), 254-272.
35. Matishov, G. G., & Matishov, D. G. 2013. Current natural and social risks in the
Azov-Black Sea region. Herald of the Russian Academy of Sciences, 83(6), 490-498.
36. Merz, B., Thieken, A. H., & Gocht, M. 2007. Flood risk mapping at the local
scale: concepts and challenges. In Flood risk management in Europe (pp. 231-251). Springer
Netherlands.
37. Miagkov, S. 1995. Geography of natural risk (in Russian: География природных
рисков). Moscow. MSU. 224 p.
38. Mikhailov, V., Magritsky D. & Ivanov, A. 2010. Hydrology of the delta and
wellhead seaside of the Kuban (in Russian: Гидрология дельты и устьевого взморья Кубани).
- Moscow: GEOS
39. Ministry of Finance. 2011. Calculation of the distribution of subventions from the
federal compensation fund in 2011 in the field of water relations between the subjects of the
Russian Federation (in Russian: Расчет распределения между субъектами Российской
Федерации субвенций из Федерального фонда компенсаций на 2011 год для
осуществления отдельных полномочий Российской Федерации в области водных
отношений). Moscow.
40. Mrozek, J. R., & Taylor, L. O. 2002. What determines the value of life? A
meta‐analysis. Journal of Policy analysis and Management, 21(2), 253-270.
41. Noy, I. 2009. The macroeconomic consequences of disasters. Journal of
Development Economics, 88(2), 221-231.
42. Ologunorisa, T. & Abawua, M. 2005. Flood risk assessment: a review. J Appl Sci
Environ Manag 9: 57–63
43. Papathoma-Köhle, M., Kappes, M., Keiler, M., & Glade, T. 2011. Physical
vulnerability assessment for alpine hazards: state of the art and future needs. Natural hazards,
58(2), 645-680.
44. Penning-Rowsell, E., Floyd, P., Ramsbottom, D., & Surendran, S. 2005.
Estimating injury and loss of life in floods: a deterministic framework. Natural Hazards, 36(1-2),
43-64.
45. Petrova, E. 2004. Social and economic factors of the natural risk increasing:
estimation of the Russian regions. Natural Hazards & Earth System Science, 4(2), 243-248.
46. Petrova, E. 2006. Vulnerability of Russian regions to natural risk: experience of
quantitative assessment. Natural Hazards & Earth System Sciences, 6(6).
47. Pistrika, A., & Tsakiris, G. 2007. Flood risk assessment: A methodological
framework. Water Resources Management: New Approaches and Technologies. European Water
Resources Association, Chania, Crete-Greece.
48. Russian Federal Sate statistical service. 2012. Database of municipalities (in
Russian: База данных показателей муниципальных образований). URL:
http://www.gks.ru/dbscripts/munst/munst.htm
49. Semenov, V. & Korshunov, A. 2008. Zoning of high flood dangers in Russia due
to climate change and improving information on floods (in Russian: Районирование
территории России по опасности высоких наводнений в связи с изменениями климата и
улучшение информационного обеспечения о наводнениях). Management of water resource
systems in extreme conditions. International Exhibition and Congress ECWATECH. Moscow. P.
142 -145.
50. Shagin, S. 2010. The spatial structure of the potential sources of natural and man-
made disasters in the Southern Federal District of Russia (in Russian: Пространственная

16
структура потенциальных источников чрезвычайных ситуаций природного и
техногенного характера на территории Южного федерального округа России). Dissertation
for the degree of Doctor of Geographical Sciences. Astrakhan.
51. Shakhramanjyan, M. A., Nigmetov, G. M., Larionov, V. I., Nikolaev, A. V.,
Frolova, N. I., Suchshev, S. P., & Ugarov, A. N. 2001. Advanced procedures for risk assessment
and management in Russia. International Journal of Risk Assessment and Management, 2(3),
303-318.
52. Shoygu, S., Bolov, V., Komedchikov, N. & Trokhina, N. (Ed.). 2010. Atlas of
natural and technological hazards and risks of emergencies in the Russian Federation (in
Russian: Атлас природных и техногенных опасностей и рисков чрезвычайных ситуаций
Российской Федерации). Moscow. Design. Information. Cartography. 696 p.
53. Sokratov, S., Seliverstov, Y., Shnyparkov, A. & Koltermann, P. 2013.
Anthropogenic impact on flooding and debris flow activity (in Russian: Антропогенное
влияние на лавинную и селевую активность). Ice and snow 2 (122): p. 121-128.
54. Taratunin, A. 2008. Floods in the Russian Federation (in Russian: Наводнения на
территории Российской Федерации). Yekaterinburg: FSUE RosNIIVH. 432 p.
55. United Nations. 2013. Global assessment report on disaster risk reduction.
Geneva, UNISDR.
56. Viscusi, W. K., & Aldy, J. E. 2003. The value of a statistical life: a critical review
of market estimates throughout the world. Journal of risk and uncertainty, 27(1), 5-76.
57. World Risk Report. 2011. Bundnis Entwicklung Hilft. Bonn.
58. Zemtsov, S., Kidyaeva, V. & Fadeev, M. 2013. Socio-economic risk assessment
of flooding for Russian coastal regions. In ERSA conference papers (No. ersa13p1271).
European Regional Science Association.
59. Zemtsov, S., Krylenko, I. & Yumina, N. 2012. Socio-economic Assessment of
Flood Risk in Coastal Areas of the Azov-Black Sea Coast in the Krasnodar Region (in Russian:
Социально-экономическая оценка риска наводнений в прибрежных зонах Азово-
Черноморского побережья Краснодарского края). In The Environmental and social risks in
the coastal zone of the Black Sea and Azov Sea. Peter Koltermann and Sergey Dobrolyubov,
eds. Moscow: Publishing House of Triumph.
Fig. 1. Flood hazard index for Russian regions in 2010
Source: Gladkevich et al. 2011

17
Fig. 2. Coastal municipal districts of the Krasnodar region. Slavyansk municipal district is
highlighted by red border

18
Fig. 3. Population density of the Slavyansk district settlements with respect to hazard zones

19
Fig. 4. Percentage of respondents by their answers in settlements, %
Table 1. The most destructive hazardous hydrological phenomena in the Kuban river delta in the
last 20 years
Date Flood reason Damage
1998, March Heavy rains and
groundwater level
rise
Around 5000 km2, 132 settlements, more than 22
thousand houses were flooded, 113 economic objects
were damaged. Huge flood activated landslide
processes in Temryuk city. Around 107 private houses
were damaged and 300 people were injured in Temryuk
municipal district.
2001, December
— 2002,
January
Ice jams,
heavy rains and
reservoir releases
Huge area along the river and part of Temryuk city
were flooded (around 0.74 km2). 3283 people were
injured
2002, July Snow melting and
heavy rains
One of the river dams was broken. 1.5 km2 of rice fields
and pump station were flooded
2011, February Surge Water level rose on 1.5 m
Source: Mikhailov et al 2010
Table 2. Types of socio-economic risks and corresponding damage categories
Types of risks
(r) Categories of damages (j)
Environmental Soil erosion and
salinization
Water pollution and
fish death
Contamination
of drinking
water
Forest
degradation
Technological
Destruction of
infrastructure (roads,
bridges, pipelines,
power lines, sewer)
Destruction of assets
of industrial
enterprises
Destruction of housing
20
Economic Loss of profits Reduction of budget
revenues
Reduction of investment
attractiveness
Social Death / Loss of
health
Destruction of social
ties Impoverishment
Political Incompetence of the
authorities
Social "explosion"
(e.g. strikes) Looting
Psychological Loss of mental health
Informational Negative press coverage Loss of territorial brand name
Table 3. Vulnerability of different types of constructions
Types of construction Medium flooding Catastrophic
flooding
Wooden houses 0.56 1
Brick and stone houses with one floor 0.3 0.6
Brick and block houses with two and more floors 0.1 0.5
Asphalted automobile road 0.1 0.7
Unpaved automobile road 0.5 1
Source: EMERCOM 2007
Table 4. Combination of answers for groups of people with different value of vulnerability
Most
vulnerable
Less
vulnerable
Weakly
vulnerable
Can you provide the safety of your life? No In part. Do
not know
Yes
What is your age? 0-16, > 66 56-65 > 16, < 56
How many years do you live in the area? < 1, 1-5 5-20 > 20
Did you experience flooding? No Once More than once
Table 5. Distribution of the vulnerability groups for the Slavyansk municipal district
Index of vulnerability (per cent of most and less vulnerable people)
Frequency,
persons
Per cent Valid per cent Cumulative per cent
Valid Most vulnerable 192 40.5 41.5 41.5
Less vulnerable 74 15.6 16.0 57.5
Weakly vulnerable 197 41.6 42.5 100
Total 463 97.7 100
Missing System 11 2.3
Total 474 474 100
Table 6. Economic damage for several categories in the Slavyansk municipal district
Medium flooding
Categories of damage Agricul
ture
Fixed
assets Infrastructure
Real
estate
Invest
ments Total
Potential damage (€ million) 1.1 20 12.2 29.1 0.8 63.2
Annual potential damage
(according to probability of
event = 0.01) (€ million)
0.011 0.2 0.122 0.29 0.01 0.63
Catastrophic flooding
Categories of damage Agricul
ture
Fixed
assets Infrastructure
Real
estate
Invest
ments Total

21
Potential damage (€ million) 32.3 75.7 13.9 150.1 42.1 314.1
Annual potential damage
(according to probability of
event = 0.001) (€ million)
0.032 0.076 0.014 0.15 0.04 0.31
Table 7. Calculation of potential victims and killed
Medium flooding
Communities Exposed
population
Vulnerability
index
Vulnerable
people Victims Deaths
Achuevo 403 0.14 57 2 0
Zaboyskiy 2306 0.23 530 11 5
Prikubanskiy 297 0.43 128 3 0
Slavyansk-on-Kuban 0 0.49 0 0 0
Total 16 481 0.42 6922 138 7
Catastrophic flooding
Communities Exposed
population
Vulnerability
index
Vulnerable
people Victims Deaths
Achuevo 403 0.21 85 4 0
Zaboyskiy 2306 0.38 876 44 4
Prikubanskiy 297 0.51 151 8 0
Slavyansk-on-Kuban 38 305 0.6 22 983 1149 115
Total 60 575 0.58 35 134 1757 176
Table 8. Social damage calculation according two approaches
Medium flooding Catastrophic flooding
Communiti
es
Real loss for
society (1000 €)
Government
estimation (1000 €)
Real loss for
society (1000 €)
Government
estimation (1000 €)
Victi
ms
Deaths Victims Deaths Victi
ms
Deaths Victims Deaths
Achuevo 10 0 2.4 0 20 0 4.8 0
Zaboyskiy 55 7500 13.2 250 220 6,000 52.8 200
Prikubans
kiy
15 0 3.6 0 40 0 9.6 0
Slavyansk-
on-Kuban
0 0 0 0 5745 172 500 1378.8 5750
Total
district
690 10 500 165.6 350 8785 264 000 2108.4 8800
Table 9. Social damage calculation (per year)
Communiti
es Medium flooding with p = 0.01 Catastrophic flooding with p = 0.001
Real loss for
society (1000 €)
Government
estimation
(1000 €)
Real loss for society
(1000 €)
Government
estimation
(1000 €)
Total
potential
damage
Annu
al risk
Total
potential
damage
Annu
al risk
Total
potential
damage
Annual
risk
Total
potential
damage
Annu
al risk
Achuevo 10 0.1 2.4 0.024 20 0.02 4.8 0.005
Zaboyskiy 7,555 7.555 263.2 2.632 6220 6.22 252.8 0.25
Prikubans
kiy
15 0.15 3.6 0.036 40 0.04 9.6 0.01

22
Slavyansk-
on-Kuban
0 0 0 0 178 245 178.25 7128.8 7.13
Total
district
11 190 111.9 515.6 5156 272 785 272.8 10 908.4 10.91