an analysis of transfer pricing theoryand an …
TRANSCRIPT

AN ANALYSIS OF TRANSFER PRICING THEORY AND AN INVESTIGATION INTO
THE DOMESTIC TRANSFER PRICING
PRACTICES OF LARGE LISTED SOUTH AFRICAN INDUSTRIAL COMPANIES
by
Imtiaz A.S. Vally
A dissertation submitted in fulfilment of the
academic requirements for the degree of
Master of Accountancy
in the Department ofAccountancy,
University ofNatal.
1997
Supervisor: Professor Dr C. Ndu
Co-supervisor : Professor D. C1ulow
Pietermaritzburg
1997

ABSTRACT
An analysis oftransfer pricing theory reveals that there are three main objectives of a transfer pricing
system: the attainment of goal congruence, the facilitation of fair divisional performance evaluation
and the promotion of divisional autonomy. A critical evaluation of suggested theoretically correct
transfer pricing methods suggests that the simultaneous attainment of all three objectives is a difficult
goal to be realised by a single transfer pricing method. The most appropriate method to suit a
particular set ofcircumstances is contingent upon those circumstances.
The transfer pricing objective considered most important in practice by large listed South
African industrial companies is the facilitation of fair divisional performance evaluation. Objectives
relating to simplicity and ease of application are also rated more highly than goal congruence. Both
these findings are somewhat surprising based on the review of current literature.
The domestic transfer pricing methods used by large listed South African industrial companies
are fairly evenly split between cost and non-cost-oriented methods. The most frequently used primary
transfer pricing method is market price. The use of mathematical programming and economic
marginal cost prices is practicallynon-existent. These findings are consistent with the findings of some
recent overseas studies.
Policies relating to the selection ofthe transfer pricing method, the purchase of intermediate
goods and services and the settlement of transfer pricing disputes reflects some head office
management involvement in the transfer price decision process in most cases.
Three organisational variables appear to have a significant association with a firm's choice of
transfer pricing method. Firstly, companies with a low level of interdivisional trading use non-cost-

oriented transfer pricing methods whereas companies with a high level of interdivisional trading use
cost-oriented methods. Secondly, transfer pricing methods selected as a result of some head office
management involvement tend to be cost-oriented whereas methods selected by the divisions
themselves tend to be non-eost-oriented. Thirdly, cost-oriented methods tend to be used in companies
in which transfer pricing disputes are normally settled by some form ofhead office intervention and
non-eost oriented methods are used in those companies in which disputes are normally settled by the
divisions themselves.
11
ACKNOWLEDGEMENTS
I thank my supervisor Professor Or Chiaku Ndu and co-supervisor Professor David Clulow for their
guidance and their interest shown in this study.
Financial support for the carrying out ofthis study was provided by the University ofNatal Research
Fund.
I certify that this entire dissertation, unless
specifically indicated to the contrary in the
text, is my own original work.
Imtiaz A.S. Vally
ill

LIST OF TABLES
LIST OF DIAGRAMS
CHAPTER
CONTENTS Page
Vll
x
1 INTRODUCTION
1.1 Introduction 1
1.2 Statement of the problem I
1.3 Objectives ofthe study 2
1.4 Research methodology 3
1.5 Structure ofthe dissertation 4
1.6 Potential contributions of the study 4
1.7 Limitation of scope 5
1.8 Limitations of the research findings 5
1.9 References 7
2 AN ANALYSIS OF TRANSFER PRICING THEORY
2.1 Introduction 8
2.2 The theoretical objectives of a transfer pricing system 8
2.3 The primary objective ofa transfer pricing system 13
2.4 A summary of suggested theoretically correct transfer·
pricing methods 13
2.5 Economic marginal cost method 13
2.6 Variable plus fixed cost method 32
2.7 Opportunity cost method 37
2.8 Incremental cost method 49
2.9 Cost plus an allowance for profit method 58
2.10 Market price method 63
IV

2.11 Negotiated price method
2.12 Dual price method
2.13 Mathematical programming methods
2.14 Purpose based method
2.15 Conclusion
2.16 References
75
79
82
83
87
88
3 A REVIEW OF RECENT EMPIRICAL STUDIES INTO
TRANSFER PRICING PRACTICES
3.1 A summary ofrecent empirical studies into transfer
pricing practices 91
3.2 Finnie (1978) 92
3.3 Choudhury (1979) 94
3.4 Tang (1979) 96
3.5 Wu & Sharp (1979) 102
3.6 Benke & Edwards (1980) 104
3.7 Borkowski (1988) 107
3.8 Geboers, et a1 (1989) 112
3.9 Tang (1993) 118
3.10 Conclusion 120
3.11 References 122
4 EMPIRICAL RESEARCH DESIGN AND METHODOLOGY
4.1 Objective of the empirical investigation
4.2 Research design
4.3 Data collection techniques
4.4 Population definition
4.5 Questionnaire design
4.6 Pilot testing
·v
123
123
124
125
125
129

4.7 Final survey
4.8 Overall response
4.9 References
130
131
132
5 EMPIRICAL RESEARCH FINDINGS
5.1 Introduction 133
5.2 Characteristics of the respondent firms 133
5.3 Transfer pricing objectives 145
5.4 Transfer pricing methods 149
5.5 Other policy issues 157
5.6 Identification ofhypotheses 163
5.7 Identification ofthe appropriate
statistical test 163
5.8 Hypotheses testing 165
5.9 Conclusion 171
5.10 References 173
6 CONCLUSION
6.1 Summary of findings
6.2 Limitations of the research
6.3 Areas for future research
6.4 Reference
BIBLIOGRAPHY
APPENDIX A: Pilot Survey Questionnaire
APPENDIX B: Follow-up Letter
APPENDIX C: Detailed Chi-square Tests
VI
174
174
175
177
178
183
190
191

LIST OF TABLES
Table Page
2.1 Summary of suggested theoretically correct
transfer pricing methods 14
3.1 Summary ofrecent empirical studies covering
domestic transfer pricing practices 91
3.2 The primary purpose of the transfer pricing
systems used by respondent firms - Finnie (1978) 92
3.3 Transfer pricing procedures (methods) used by
respondent firms - Finnie (1978) 93
3.4 Transfer pricing methods used by respondent
firms - Choudhury (1979) 95
3.5 Dominant transfer pricing objectives ofU.S. and
Japanese companies - Tang (1979) 97
3.6 Domestic transfer pricing methods used by
respondent firms - Tang (1979) 99
3.7 Dominant transfer pricing methods used by
respondent firms - Tang (1979) 100
3.8 The rankings of transfer pricing objectives - Wu
& Sharp (1979) 103
3.9 The rankings of transfer pricing systems - Wu
& Sharp (1979) 104
3.10 Transfer pricing methods used by participating
firms - Benke & Edwards (1980) 106
3.11 Domestic transfer pricing methods used by respondent
firms - Borkowski (1988) . 108
3.12 Environmental and organisational variables tested by
Borkowski (1988) 110
vu

3.13 The extent ofuse of transfer prices among respondent
firms - Geboers, et al (1989) 113
3.14 Analysis according to size of companies using transfer
prices - Geboers, et al (1989) 114
3.15 Analysis according to size of companies not using transfer
prices - Geboers, et a1 (1989) 114
3.16 The objectives of transfer pricing methods used by
respondent firms - Geboers, et al (1989) 115
3.17 Transfer pricing methods used when a market price is
available - Geboers, et al (1989) 117
3.18 Transfer pricing methods used when a market price is
not available - Geboers, et al (1989) 117
3.19 The use of transfer prices by industry - Tang (1993) 118
3.20 Number ofdomestic transfer pricing methods used by
companies -Tang (1993) 119
3.21 Domestic transfer pricing methods used by the respondent
firms - Tang (1993) 121
4.1 Industrial classification ofpopulation 126
4.2 Responses to the pilot survey 130
4.3 Responses to the final survey 131
4.4 Responses to both surveys 131
5.1 Industrial classification ofthe respondent firms 134
5.2 Size classification ofrespondent firms 135
5.3 Percentage interdivisional transfers 135
5.4 The extent ofuse of transfer pricing analysed
by industry and in total 136
5.5 The extent ofuse of transfer pricing analysed
by company size 140
5.6 The extent ofuse of transfer pricing analysed by the
VID

level of interdivisional trading 140
5.7 Reasons for not using transfer pricing 143
5.8 Ranking oftransfer pricing objectives 146
5.9 Distribution ofrespondents by dominant
transfer pricing objective 147
5.10 Number ofdomestic transfer pricing methods used 149
5.11 Primary transfer pricing methods used by respondent firms 153
5.12 Secondary transfer pricing methods used by respondent firms 155
5.13 A comparison ofprimary transfer pricing methods used 156
5.14 A comparison ofprimary and secondary transfer pricing
methods used 157
5.15 Responsibility for the selection ofdomestic transfer pricing
methods 158
5.16 Outside purchase policy 160
5.17 How transfer pricing disputes are normally settled 160
5.18 Hypothesis 1: Company size and the orientation of
domestic transfer pricing methods 167
5.19 Hypothesis 2: Level of interdivisional trading and
the orientation ofdomestic transfer pricing methods 167
5.20 Hypothesis 3: The main transfer pricing objective and
the orientation ofdomestic transfer pricing methods 168
5.21 Hypothesis 4: Responsibility for transfer price selection
and the orientation ofdomestic transfer pricing methods 168
5.22 Hypothesis 5: Outside purchase policy and the orientation
ofdomestic transfer pricing methods 169
5.23 Hypothesis 6: Manner of settling transfer price disputes
and the orientation ofdomestic transfer pricing methods 169
5.24 Summary of statistical tests 170
IX
LIST OF DIAGRAMS
Diagram Page
2.1 Perfect competition 15
2.2 Imperfect competition 16
2.3 Single joint output level 18
2.4 Monopolistic buyer 21
2.5 Constant marginal costs 23
2.6 Imperfect competition 25
2.7 Net marginal revenue curve 27
2.8 Imperfectly competitive intermediate market 29
2.9 Opportunity cost ofsupplying division 42
2.10 Opportunity cost ofreceiving division 44
2.11 Optimal transfer price 45
2.12 Less than optimal transfer quantity 48
2.13 Perfectly competitive intermediate market 65
2.14 Different divisional output levels 67
5.1 Transfer price usage in total 138
5.2 Transfer price usage by industry 139
5.3 Transfer price usage by company size 141
5.4 Transfer price usage by level of interdivisional trading 142
5.5 Reasons for not using transfer pricing 144
5.6 Dominant transfer pricing objective 148
5.7 Number oftransfer pricing methods used 150
5.8 Primary transfer pricing methods used 152
5.9 Secondary transfer pricing methods used 154
5.10 Responsibility for the selection oftransfer pricing methods 159
5.11 Outside purchase policy 161
5.12 Settlement of transfer price disputes 162
x

CHAPTERl
INTRODUCTION
1.1 INTRODUCTION
The transfer price is the price attached to the interdivisional transfers of goods and services in a
divisionaJise4 group. As such it influences the revenues ofthe selling division and the expenses ofthe
receiving division and thus has a direct bearing on the reported profits of the divisions engaged in
interdivisional trading. This in turn affects divisional performance evaluation and managerial incentive
bonuses. Various authors have suggested different methods ofdetermining an appropriate transfer
price bearing in mind the objectives of group profit maximisation, fair divisional performance
evaluation and the promotion ofdivisional autonomy.
Generally the consolidated group profit will not be affected by the choice oftransfer pricing
method but the allocation oftbat profit between the divisions will vary, depending on the level of the
transfer price. Hence divisional managers of companies with substantial interdivisional trading
consider transfer pricing to be very important from a divisional perspective.
The level of the transfer price however is also important from a group perspective. If the
intermediate market iscbaracterised by imperfect competition, an inappropriately chosen transfer
price could resuh in a divisional manager maximising his own profit at the expense of overall group
profit maximisation. This could occur if, for example, an increase in the transfer price caused the
buying division to demand fewer quantities ofthe intermediate product causing the supplying division
to sell excess quantities ofthe intermediate product at a distress price in the external market, to the
detriment ofthe group as awhole. It is therefore critical that the transfer pricing method used within
a group of companies is carefully considered.
1.2 STATEMENT OF THE PROBLEM
In a comprehensive discussion on the theory oftransfer pricing, Thomas (1980) makes reference to
1

a statement made by Seed (1970) to the effect that the accounting topic of transfer pricing singularly
consumes more management time and energy than any other accounting problem In a study carried
out by Benke & Edwards (1980) all interviewees indicated that they considered transfer pricing to
be important, with the majority referring to transfer pricing as very important.
Despite the importance of the topic however, there have been relatively few comprehensive
empirical studies carried out in the area of transfer pricing. For example, in a review of empirical
studies into transfer pricing practices conducted during the period 1974 to 1983, Grabski (1985)
indicates that only two studies surveyed more than a hundred corporations at one time.
Whilst subsequent studies carried out overseas may have addressed this deficiency
internationally (for example Borkowski (1988) and Tang (1993)), the criticism still applies within a
South African context. The only South African empirical study of any note is one carried out by
Geboers, et al(1989). This study however summarises data obtained from only nineteen companies
listed on the Johannesburg Stock Exchange and is therefore classified as being exploratory rather than
comprehensive. A widespread study into the transfer pricing practices of South African companies
is therefore lacking and this study represents an attempt to address this deficiency.
1.3 OBJECTIVES OF THE STUDy
The objectives of this study are:
1. To analyse the theory of transfer pricing.
2. To review past empirical studies into the domestic transfer pricing practices of overseas
and South African companies.
3. To present for the first time, comprehensive data on the domestic transfer pricing practices
of large listed South African industrial companies. In particular, data was gathered on the
transfer pricing methods used by these companies, the objectives of these companies' transfer
pricing systems and other policy issues surrounding transfer pricing, such as the responsibility
for choosing the transfer pricing method and the manner of settling disputes.
2

1,4 RESEARCH MEmODOLOGY
The research methodology of this study may be classified as both analytical and empirical. The
analytical part of the study is directed toward the attainment of objectives one and two identified
above. For this purpose a review ofthe literature on transfer pricing available at the library of the
University ofNatal, Pietermaritzburg was carried out. Additional literature was soureed from other
institutions using the inter-library loan facility. A printout of the Human Sciences Research Council
database relating to completed higher degree research studies into transfer pricing was also obtained.
In addition the Sabinet database was also searched for relevant literature. Full details of the literature
reviewed are provided at the end of each chapter and in a bibliography at the end.
Empirical research methodology was adopted with a view to attaining the third objective of
the study indicated above. Since the objective of the empirical analysis was to obtain comprehensive
data from a large number of companies the case study approach was considered impractical and a
statistical study was opted for. The population tested consisted ofthe 279 largest listed South African
industrial companies identified in the June 1996 edition ofthe Financial Mail Special Survey ofTop
Companies. Data from these companies was obtained by means of a questionnaire survey. The
questionnaire was mailed to the financial director of each company.
Apilot study was conducted to identify any weaknesses in the design ofthe questionnaire and
to assess the feasibility of conducting a full-scale study. All non-responses were followed up with a
second mailing. The pilot study did not reveal any serious deficiencies in the design of the
questionnaire and the response rate of 60% indicated that a full-scale study was feasible. For the
purposes of the full-scale study all remaining companies in the population were circularised. Again
non-responses were followed up via a second mailing. A response rate of46% was achieved for the
full-scale study.
To assist in data analysis and interpretation, the raw data were summarised in tabular format.
For ihe purposes ofthis tabulation mathematical techniques such as relative and absolute frequencies,
and proportional analysis were employed. Graphical analysis in the form of pie and bar charts was
also used to facilitate data interpretation. Ordinal data analysis was conducted using arithmetic mean
calculations to rank the data.
3

Statistical chi-square testing was used to test the significance of hypothesised relationships
between certain organisational variables and the orientation of the transfer pricing methods used by
the respondent firms. For this purpose, data were arranged into contingency tables and chi-square
values computed using Minitab, a statistical software package. Based on a comparison of computed
chi-sqwu:e values with critical test values selected from a chi-square distrIbution table, the hypotheses
were either accepted or rejected.
1.5 STRUCTURE OF THE DISSERTATION
The balance ofthis study is divided into five chapters. Chapters two and three relate to the literature
review and may therefore be classified as being analytical in nature.
In chapter two, the theory oftransfer pricing is analysed at a conceptual level. This analysis
is necessary in order to obtain a sound theoretical understanding of the subject and represents the
starting point of the study . Chapter three then proceeds with a review of the findings of recent
empirical studies into the domestic transfer pricing practices of South African and overseas
compames.
Chapters four and five relate to the accumulation and analysis of empirical data on the
domestic transfer pricing practices oflarge listed South African industrial companies. As such these
two chapters constitute the empirical part of the study. Chapter four describes the preliminary
planning phase ofthe empirical study and details the empirical research methodology. Chapter five
contains an analysis of the data obtained by means of the questionnaire survey and details the
statistical tests carried out with a view to identifying potential relationships between variables.
Chapter six concludes the study with a summary ofthe research findings and provides directions for
future research.
1.6 POTENTIAL CONTRIBUTIONS OF THE STUDy
Management accounting students and practitioners who wish to obtain a good technical grasp of
transfer pricing theory will benefit from a study of chapter two which contains a comprehensive
4

analysis oftransfer pricing theory. Chapters three, four and five deal with transfer pricing in practice
and will therefore be of particular interest to practitioners who may wish to know what other
companies' transfer pricing practices are. These chapters will also be of interest to students of
management accounting who wish to obtain a practical perspective on transfer pricing. Chapter five
also presents for the first time extensive data on South African domestic transfer pricing practices and
to this extent represents a contribution to knowledge.
1.7 LIMITATION OF SCOPE
This entire dissertation is set within the context ofdomestic transfer pricing theory and practice. The
international dimensions of transfer pricing are not considered as the objective of the study is to
analyse the subject of transfer pricing purely within the context of decentralised organisational
structures based on the principles of goal congruence, divisional autonomy and the need to assess
divisional performance. Support for such an approach can be found in Grabski (1985) and Borkowski
(1988). In this regard Grabski (1985) maintains "multinational transfer pricing strategies are generally
the result of both the regulations enforced by the various taxing authorities ... and the foreign
exchange rates." Writings in this area "do not focus on the issues of decentralization and
organisational optimisation is ignored." Borkowski (1988) states further that "the main impetus
behind international transfer pricing comes from the tax effects of a transfer from an international
subsidiary on the parent corporation. In firms using transfer pricing in domestic subsidiaries or
divisions, taxes are ofless concern. International transfer pricing is thus considered a separate topic."
1.8 LIMITATIONS OF THE RESEARCH FINDINGS
1. As is commonwith all statistical studies, the results of the survey may not be extrapolated beyond
the bounds ofthe population surveyed.
2. For the purposes of conducting the hypothesis testing certain organisational variables were
identified for testing. It is possible that other more important variables impacting on a firm's choice
5

of transfer pricing method exist and have been ignored for testing (Borkowski 1988 52).
3. Ahhough all questionnaire responses were reviewed for internal inconsistencies, it is nonetheless
difficult to assess the validity ofthe survey responses. Not all responses were completed by the group
financial director and it is therefore possible that the person completing the questionnaire may not in
all cases be ideally suited to doing so.
6
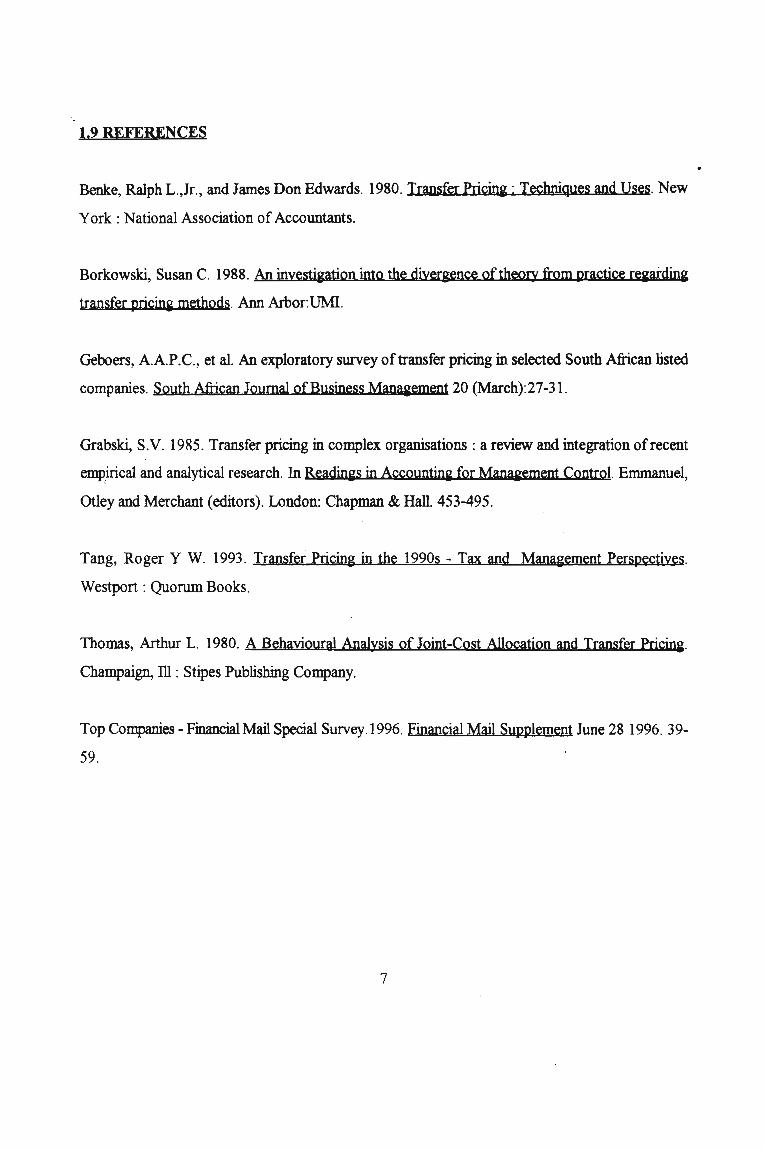
1.9 REFERENCES
Benke, Ralph L.,Jr., and James Don Edwards. 1980. Transfer PricinG' Techniques and Uses. New
York: National Association of Accountants.
Borkowski, Susan C. 1988. An investiGation into the divergence oftheOIY from practice reGarding
transfer pricini methods. Ann Arbor:UMI.
Geboers, A.A.P.C., et al. An exploratory survey of transfer pricing in selected South African listed
companies. South African Journal ofBusiness Maniliemeut 20 (March):27-3 1.
Grabski, S.V. 1985. Transfer pricing in complex organisations: a review and integration ofrecent
emp,irical and analytical research. In Readings in Accounting for Manaiement Control. Emrnanuel,
Otleyand Merchant (editors). London: Chapman & Hall. 453-495.
Tang, Roger Y W. 1993. Transfer Pricing in the 1990s - Tax and Management Perspectives.
Westport : Quorum Books.
Thomas, Arthur L. 1980: A Behavioural Analysis of Joint-Cost Allocation and Transfer Pricing.
Champaign, III : Stipes Publishing Company.
Top Companies - Financial Mail Special Survey. 1996. Financial Mail Sypplement June 28 1996. 39
59.
7

CHAPTER 2
AN ANALYSIS OF TRANSFER PRICING THEORY
2.1 INTRODUCTION
In this chapter transfer pricing theory is analysed at a conceptual level The theory oftransfer pricing
may be divided into two parts as follows:
1. The theoretical objectives ofa transfer pricing system.
2. Suggested theoretically correct transfer pricing methods designed to attain these objectives.
2.2 THE THEORETICAL OBJECTIVES OF A TRANSFER PRICING SYSTEM
The main oqjectives ofa sound transfer pricing system may be summarised as follows. The transfer
pricing system should:
a) Facilitate goal congruence (Benke & Edwards 1980 18).
b) Fairly reflect the performance ofdivisional management
(Benke & Edwards 1980 18).
c) Promote divisional autonomy (Thomas 1980 129).
Each ofthese will be discussed in turn.
a) The facilitation of KOal conifUence
The majority of companies operating in a market based economy have as their prime goal the
maximisation ofprofit. In a divisionalised company the attainment of this objective is delegated to
8
divisional management and managerial performance is assessed based on divisional contribution to
group profit.
Where interdivisional trading takes place, a buying division, in order to maximise its
contribution to group profit, will attempt to pay the minimum price to the selling division whilst the
selling division's behaviour would be the exact opposite. The transfer price settled on, given divisional
autonomy, will be that which maximises the profits of each individual division relative to what could
otherwise be achieved if the divisions did not trade with each other. In most cases this behaviour
would coincidentally conform with the overall group objective ofprofit maximisation. In such a case
the transfer price will be classified as being goal congruent.
There are however circumstances in which, because of the level of the transfer price
applicable, divisional management may act in a manner which will maximise their individual
contributions to group profit but which will not be cons~tent with the objective of group profit
maximisation. In such a case the transfer price will be classified as lacking in the promotion of goal
congruence (Benke & Edwards 1980 6). Consider the following example..
Illustrative example: Goal consrnence
A company has two divisions, A and B. Division A operates at full capacity and sells 100 000 units
ofProduct A annually. The product costs R8 to manufacture and is sold externally at RII per unit.
Division B sells 50 000 units ofProduct B annually. The product costs R6 to manufacture
and is sold externally at R8 per unit.
Division B also has spare capacity to process 100 000 units ofProduct A further into Product
Cwhich could then be sold externally at R20 per unit. Additional processing costs will amount to R2
per unit. Division B cannot purchase Product A in the outside market.
If Division A does not supply Division B with Product A, Division B will not be able to
produce Product C. Under these circumstances overall group profit will appear as shown in Exhibit
1.
If Division A does supply Division B with 100 000 units of Product A at a market based
transfer price of RII per unit and Division B processes Product A further into Product C, overall
group profit will be as shown in Exhibit 2.
9

400000
EXHIBITl
DMSIONAL PROFIT STATEMENT - NO INTERDMSIONAL TRADING
Group
R
Division A DivisionB
R R
Sales 1 100000 400000
Processing costs (800000) (300000)
Profit 300000 100000
EXHIBIT 2
DMSIONAL PROFIT STATEMENT - INTERDMSIONAL TRADING
Division A Division B Group
R R R
Existing profit 300000 100000
Product c:Sales 2000000
Processing costs (200000)
Transfer cost (1100 000)
Profit 300000 800000 1 100000
Interdivisional trade in Product A at a transfer price ofRI I per unit causes Division Bls and
the overall group profit to increase by R700 000. Division A is indifferent. Thus a transfer price of
RII per unit is considered goal congl1lent as it motivates Division B's management to act in a
manner which promotes its and the group's economic well being.
Assume now that the company follows a policy ofsetting all transfer prices based on cost plus
10

10 %. Thus ifDivision A supplies Division B with 100 000 units ofProduct A, it will be transferred
to Division Bat R8.80 per unit. Overall group profit will be as shown in Exhibit 3.
EXHIBIT 3
DIVISIONAL PROFIT STATEMENT - INTERDIVISIONAL TRANSFERS AT COST
PLUS 10 %
Existing profit
Reduction in
existing profit
100000 * (RII-8.80)
Product c:
Sales
Processing costs
Transfer cost
Profit
Division A
R
300000
(220000)
80000
Division B
R
100000
2000000
(200000)
(880000)
1020000
Group
R
1 100000
At a transfer price ofR8.80 per unit, Division A will be disinclined to supply Division B with
Product A since its profit will decrease by R220 000. However overall group profit has increased by
R700 000 in relation to a situation ofno interdivisional transfers. Thus ifDivision B is unable to
source ahemative supplies ofProduct A Division A, by not supplying Product A to Division B, will
be acting in a manner which conflicts with group objectives. In order to maximise its own profits
Division A is causing the group to lose R700 000 ofadditional profit. In such a case the transfer price
based on cost plus 10 % will be considered to be lacking in the promotion of goal congruence.
11

b) Fair divisional performance evaluation
The transfer price used should fairly retlect the contribution ofa division to group profitability. Profit
distortions should be avoided. Too high a transfer price will overstate the contribution ofthe selling
division and understate the contribution ofthe receiving division. Too Iowa transfer price will have
the opposite effect (Benke & Edwards 198021). Such a distortion will demotivate divisional
management if it considers itselfprejudiced by the transfer pricing system. Resource mis-allocation
could also result as resources are diverted away from the apparently less profitable division to the
apparently more profitable division (Abdel-khalik & Lusk 1974 8).
An example of a case where the transfer pricing system will distort accurate performance
measurement will be ifa transfer price is set so as to minimise group taxation. Assume there are two
subsidiaries within a group that trade with each other. The supplying subsidiary is in a tax paying
position whilst the receiving subsidiary possesses an assessed loss. It is in the interests of the group
for the transfer price to be set at as Iowa level as will be acceptable to the Receiver ofRevenue so
as to maximise group after tax profit. However if this price is lower than what the supplying division
could obtain in the external market then the supplying diVision will be aggrieved that it is effectively
forced to sell to the receiving division at a lower price. In such a case, although the transfer price
promotes goal congruence it conflicts with the objective ofaccurate performance evaluation as the
supplying division is effectively subsidising the receiving division.
c) Promote divisional autonomy
"Decentralization is the delegation of a great deal of authority to the lowest level of management
responsibility that can make important decisions" (Engler 1987705). In order to promote divisional
autonomy therefore, the determination of transfer prices in a decentralised corporation should be
delegated to divisional management. Absolute delegation however could result in a division selfishly
making decisions which maximises its own profits but results in a suboptimal decision for the
organisation as a whole (Solomons 1965 166). To the extent that head office steps in to correct the
12
situation, divisional autonomy and its attendant motivational advantages are compromised.
2.3 THE PRIMARy OBJECTIVE OF A TRANSFER PRICING SYSTEM
From the discussion thus far, it is apparent that conflicts could easily arise between the simultaneous
attainment of the three main objectives of a sound transfer pricing system identified above. Where
conflicts arise between the simultaneous attainment ofall three objectives it appears that in practice
. attainment ofthe objective ofgroup profit maximisation takes precedence (Abdel-khalik & Lusk 1974
9).
Academics however maintain "that a conflict between the objectives ofeach division and the
organisation comprising the divisions will not exist ifa proper model is implemented. Hence academic
interest has centred on presenting a set of rules that integrate the complex elements of the
organisation in order to allow for divisional autonomy while recognising global organisational goals"
(Abdel-khalik & Lusk 19749).
The discussion will now turn to a consideration ofthese rules and an assessment ofthe extent
to which they comply with the above objectives.
2.4 A SUMMARy OF SUGGESTED THEORETICALLY CORRECT TRANSFER PRICING
METHODS
Table 2.1 summarises the various transfer pricing methods which have been proposed by writers in
the past. In the following sections each ofthese theories will be analysed and critically evaluated.
2.5 ECONOMIC MARGINAL COST MEmOD
1. Basic economic theory
"The principal contributor to the theory oftransfer pricing is economist Jack Hirshleifer" (Benke &
Edwards 1980 139). Hirshleifer based his transfer pricing theory on the basic economic theory of
13

Table 2.1 Summary of suggested theoretically correct transfer pricing methods
SUiiested Methods
1. Cost price methods
A. Economic marginal cost
B. Variable plus fixed cost
C. Opportunity cost
D. Incremental cost
E. Cost plus
2. Market price method
3. Negotiated price method
4. Dual price method
5. Mathematical programming methods
6. Purpose based method
Principal Contributors
Hirshleifer
Vendig
Onsi; Holstrum and Sauls
Goetz
Gordon; Vendig
Hirshleifer; Cook
Fremgen
Edwards and Roemmich
Baumol and Fabian
Bierman
Source: Adapted from Tang, Roger Y W. 1979. Transfer Pricing Practices in the United States
and Japan. New York:Praeger. 10.
marginal revenue (increase in total revenue attributable to the sale ofone additional unit) and marginal
cost ( increase in total cost attributable to the production of one additional unit). In general terms,
this theory states that a firm will maximise its profits by expanding output upto the point where
marginal revenue equals marginal cost. Expanding output beyond the point of intersection of the
marginal revenue and marginal cost curves is inadvisable as the cost associated with the production
of an additional unit exceeds the revenue that will be derived from the sale of that unit. This is
graphically depicted in the Diagrams 2.1 and 2.2.
Diagram 2.1 depicts a situation where the firm sells its product in a perfectly competitive
market. In such a situation because the firm is unable to influence the selling price of its product,
marginal revenue (ie. the increase in total revenue attributable to the sale of one additional unit) will
14

--------.
Perfect competitionRands
225
200175..---------,t......;.-=-~
150
125
100
75
50
25
1 2 3 4 5 6 7 8 9 10
Units
Diagram 2.1
Source: Benke, Ralph L.,Jr and James Don Edwards. 1980. Transfer Pricing: Techniques and
Uses. New York:National Association ofAccountants. 63.
15

------ ---------------:----------:----:------1
Imperfect competitionRands ..
225
200
175
150
125
100
75
50
25
Marginal revenue
1 2 3 4 5 6 7 8 9 10Units
Diagram 2.2
Source: Benke, Ralph L.,Jr and James Don Edwards. 1980. Transfer Pricing: Techniques and
Uses. New York:National Association ofAccountants. 63.
16

always equal the price of the product. Hence the marginal revenue curve is flat at the level of the price
of the product (RI75).
After declining initially, the marginal cost curve turns upward. The point at which the marginal
cost curve intersects the marginal revenue curve establishes the point of optimal output
(approximately 7.5 units in this case).
Diagram 2.2 depicts a situationwhere the firm sells its product in an imperfect market. In this
case the downward sloping nature of the marginal revenue curve is influenced by the fact that in an
imperfect market a firm is forced to reduce its selling price in order to sell additional units. There is
therefore an inverse relationship between output and marginal revenue. As sales increase the selling
price per unit (and marginal revenue) decreases. The point at which the marginal cost curve intersects
the marginal revenue curve establishes the point of optimal output (approximately 6.5 units in this
case). Bearing these principles in mind let us now consider the transfer pricing theories developed by
Hirshleifer.
2. Detennining the transfer price and output level where the selling division seDs all its output
to the receiving division
The first situation that Hirsbleifer (1956,1964) considers is the determination of an appropriate
transfer price where the selling division (Division A) sells all its output to the buying division
(Division B). The selling division may be forced to do so because there is no intermediate market
for its product or a state oftechnological dependence exists between the two divisions which makes
it uneconomical for either division to deal externally as far as the intermediate product is concerned.
A single joint output level is therefore to be determined for both the buying and selling divisions
simultaneously so as to maximise the firm's profit. This is graphically represented in Diagram 2.3.
Diagram 2.3 depicts the situation in which Division A sells the intermediate product to
Division B which on-sells the product in the final external market. McA represents the marginal cost
curve ofDivision A McB represents the marginal cost curve ofDivision B. McC represents the sum
ofDivision A's and Division B's marginal cost curves. MrF represents the marginal revenue curve of
Division B and the firm (perfect competition).
17

-
Single joint output levelRands
D
E
MeB
----------
Nee = MeA + MeB
P + MeB..-l-------------::::-:=~---- MrF
MeA
p
o Units Q
Diagram 2.3
Source: Adapted from Hirshleifer, Jack. 1964. Internal Pricing and Decentralized Decisions. In
Management Controls: New Directions in Basic Research. Bonini, Jaedicke, and Wagner
(editors), New York:Mc Graw Hill, Inc. 31.
18

The point of intersection ofMrF and McC determines the optimal output level in order to
maximise the firm's profits. A yerticalline (DQ) is drawn through this point of intersection to the
horizontal axis. The point of intersection ofthis vertical line with the horizontal axis determines the
common optimal output level for the two divisions (00 in this case). The transfer price at which
quantity OQ will be transferred from Division A to Division B is established graphically by drawing
a horizontal line EP through the point ofintersection ofMeA and DQ to the vertical axis. The point
ofintersection of this horizontal line with the vertical axis determines the appropriate transfer price
(OP in this case). Thus the firm's profit will be maximised ifDivision A manufactures quantity 00
and sells it to Division B at price OP.
A critical appraisal of the economic marginal cost (single joint output 1eyeI) transfer pricing
method
a) Preserving divisional autonomy and achievini goal congruence
The optimal joint output level could be centrally determined (no divisional autonomy) or one ofthe
divisions could autonomously arrive at the same conclusion (partial divisional autonomy). In the latter
case the buying division for example, could obtain from the supplying division a schedule indicating
the quantity it would be willing to supply at different transfer prices. The buying division could then
derive a net revenue curve (final market price minus transfer price) and determine the point of
intersection ofits net revenue curve with its marginal cost curve to determine its optimal output level.
The quantity so arrived at would automatically coincidewith that which would otherwise be arrived
at centrally (ie. the buying division would demand quantity OQ at price OP in order to~e its
profits) (Hirshleifer 1956). But how do we know that the supplying division would be willing to sell
quantity OQ at price OP in this case?
Refer to Diagram 2.3. IfDivision A sells all its output to Division B at transfer price OP the
line PE will effectively represent Division A's marginal revenue curve. Thus from Division A's
perspective profit will be maximised at quantity OQ by selling at price OP as this represents the
point of intersection of its marginal revenue and marginal cost curves.
To confirm that Division B's profit is also maximised at quantity 00, refer to Diagram 2.3
19

once more. Division B's overall marginal cost curve is represented by the dashed curve P + McB (ie.
the cost ofthe transferred in product (OP) plus its own marginal costs.) Again quantity OQ represents
the point of intersection of Division B's marginal revenue and cost curves and Division B itself
maximises its profit at this level. Thus it would appear that the above transfer pricing method which
permits partial divisional autonomy also achieves goal congruence as it maximises the firm's and
divisional profit. There is one caveat to this however.
Given partial divisional autonomy Hirshleifer points out that there is incentive for the
decision making division to adopt monopoliStic tendencies in its buying (selling) decisions. Such
behaviour would result in an individual division maximising its own profits to the detriment of firm
wide profits thus frustrating goal congruence. Let us consider Diagram 2.4.
WIth reference to the Diagram 2.4, McC, MrF, McA and McB are as previously defined. Nr .
represents the net revenue curve ofDivision B and is arrived at by subtracting the marginal cost of
producing the intermediate product from the final market price at each output level. The curve "mr"
is a quasi-marginal revenue curve marginal to Nr. The point ofintersection ofNr and McB determines
the optimal output level from Division B's perspective. Notice that this point of intersection occurs
at the same output level at which McC intersects with Mrf (the firm wide optimal output level). Thus
ifDivision B is given the autonomy to determine its optimal output level and does so based on its net
revenue curve as already explained, the transfer pricing system would promote a measure of
autonomy and simultaneously achieve goal congruence (quantity OL will be transferred at price ON).
However should this autonomy be extended to permitting Division B to base its output decision by
reference to the quasi-marginal revenue curve "mr", then Division B's actions would conflict with
group-wide profit maximisation aspirations.
This would occur because Division B's profits would be maximised at the point of intersection
ofcurves "mr" and McB resulting in Division B demanding (and Division A supplying) quantity OR
instead of OL at a transfer price of OU. The impact of this on group and divisional profit is
summarised as follows:
Group profit - This is reduced to area MBWf from MBQ, a reduction of area TWQ.
Division A - Its profits are reduced from area NYD to area UYS, a reduction ofNUSD.
Division B - Its profits are increased from area JGH to JKCZ.
20

Monopolistic buyer
MeA
MeBH" Nr = MrF - MeA
McC=McA+McB
MrF
L."mr"
..Units R
u
z
BY
,G
T. M I----------T------r--
Rands
Diagram 2.4
Source: Adapted from Hirshleifer, Jack. 1956. On the Economics of Transfer Pricing. Journal of
Business 29 (July): 174.
21
Thus by pennitting a measure of divisional autonomy without safeguarding against the
propensity ofa division to capitalise on its monopolistic position, the transfer pricing system for the
determination of a single joint level of output as described above would not meet all the objectives
ofa sound transfer pricing system. Curtailing monopolistic behaviour dilutes autonomy while added
autonomy militates against goal congruence.
The discussion above is based on the assumption ofthe receiving division being in charge of
determining the joint level of output. The roles could however easily be reversed with autonomy
being extended to the supplying division instead. The flaws inherent in the transfer pricing system as
descnbed above however apply equally to the latter situation.
It appears that authority to determine the joint level ofoutput can be extended to one division
only and the other division would have to follow suit for Hirshleifer (1956 175) states that "bilateral
bargaining might lead to a rather poor solution in these circumstances". Thus onlypartial divisional
autonomy is attainable under this method at best.
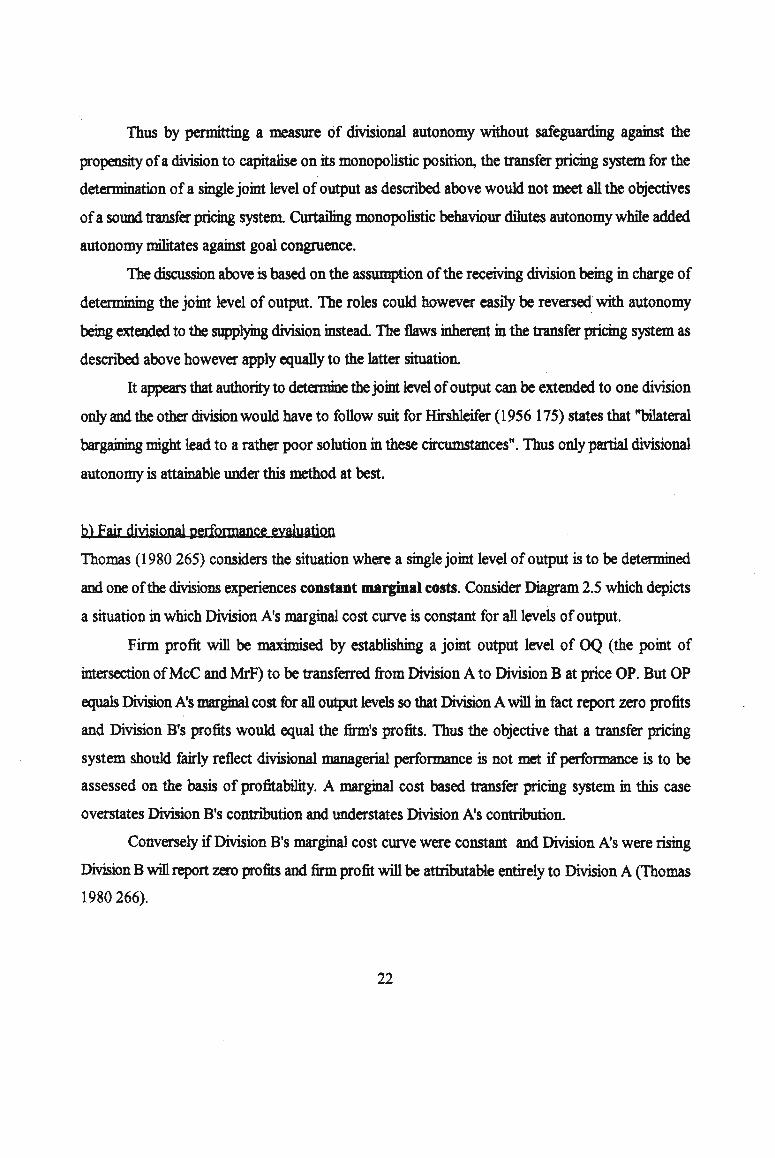
b) Fair divisional perfoonance evaluation
Thomas (1980 265) considers the situation where a single joint level of output is to be determined
and one ofthe divisions experiences constant marginal costs. Consider Diagram 2.5 which depicts
a situation in which Division A's marginal cost curve is constant for all levels of output.
Firm profit will be maximised by establishing a joint output level of OQ (the point of
intersection ofMcC and MrF) to be transferred from Division A to Division B at price OP. But OP
equals Division A's marginal cost for an output levels so that Division Awill in fact report zero profits
and Division B's profits would equal the firm's profits. Thus the objective that a transfer pricing
system should fairly reflect divisional managerial Performance is not met if Performance is to be
assessed on the basis of profitability. A marginal cost based transfer pricing system in this case
overstates Division B's contribution and understates Division A's contribution.
Conversely ifDivision B's marginal cost curve were constant and Division A's were rising
Division Bwill report zero profits and firm profit will be attributable entirely to Division A (Thomas
1980266).
22

Constant marginal costsRands o
MeC = MeA + MeB
1-------------:::::0+""-- MrF
P I--'---------~i__- MeA
MeB
o Units
Diagram 2.5
Q
Source: Adapted from Thomas, Arthur L. 1980. A Behavioural Analysis ofJoint-Cost Allocation
and Transfer Pricing. Champaign, III : Stipes Publishing Company.265.
23

Thomas further points out that to achieve fair divisional performance evaluation, a transfer pricing
system should possess the following qualities:
"1. Divisions should benefit from increases in their efficiencies and be penalized for
decreases in their efficiencies.
2. Actions (or inactions) by one division shouldn't affect other division's profits. In
particular, one division's profits shouldn't be affected by changes in another
division's separate costs." (Thomas 1980 148)
Thomas (1980 148) then proceeds to present illustrations which prove that Hirshleifer's
marginal cost approach lacks the above qualities. For example, he demonstrates that when the
supplying division experiences an upward sloping marginal cost curve, decreases in its efficiency
could actually decrease the receiving division's profits whereas increases in its efficiency can both
increase the receiving division's profits and decrease its own profits. He also demonstrates that when
the receiving division becomes less efficient the supplying division's profits could also be reduced.
This susceptibility of marginal cost transfer pricing systems to allow events in one division to
unilaterally affect the profitability of another division detracts from the objective of fair divisional
performance evaluation.
ImperfectlY compctjtjye final market
In Diagram 2.3 it is assumed that Division B sells its output in a perfectly competitive market (hence
the flat marginal revenue curve). IfDivision B sold its output in an imperfectly competitive market
an that would change in Diagram 2.3 is the slope ofMrF, which would be downward sloping rather
than flat. This is graphically represented in the Diagram 2.6. The method ofdetermining the joint
optimal output level and the corresponding transfer price remains unchanged.
Developing the analysis further necessitates a revision of the assumption that there is no
intermediate market for the product ofDivision A
24

__"'-----------~--.....-----~---=-~-----:-------I
Imperfect competitionRands
D
MeB
MeC = MeA + MeB
+ MeB
----------MrF
/MeAp I----------~~--~--- E
o Units
Diagram 2.6
Q
Source: Adapted from Hirshleifer, Jack. 1964. Internal Pricing and Decentralized Decisions. In
Management Controls: New Directions in Basic Research. Bonini, Jaedicke, and Wagner
(editors), New York:Mc Graw Hill, Inc. 31.
25

3. Determinipg the transfer price and output level where the supplying divjsiop may seD
externally in aQ imperfectly competitive intermediate market or internally
The scenario which envisages an imperfectly competitive intermediate market for the product of
Division A is considerably more complex and' is based on the assumption of demand and
tecbnological independence between the,two divisions. By demand independence, is meant that
the quantity sold by the supplying division (Division A) in the external intermediate market will not
affect the quantity sold by the receiving' division (Division B) in its final external market. Conversely
the quantity sold by Division B in its final external market does not influence the external demand in
the intermediate market. Tecbnological independence means that the production cost functions of
both divisions are independent ofthe level of interdivisional trading.
For the sake of simplicity, Division A is assumed to be a monopolist as far as the supply of
its product is concerned. Thus Division A has the option of selling its product in the intermediate
market or to Division B. Division B has no'option but to purchase its product from Division A as
there is no alternative supplier. It is however not critical to the analysis whether the final market for
Division B's product is perfect or imperfect.
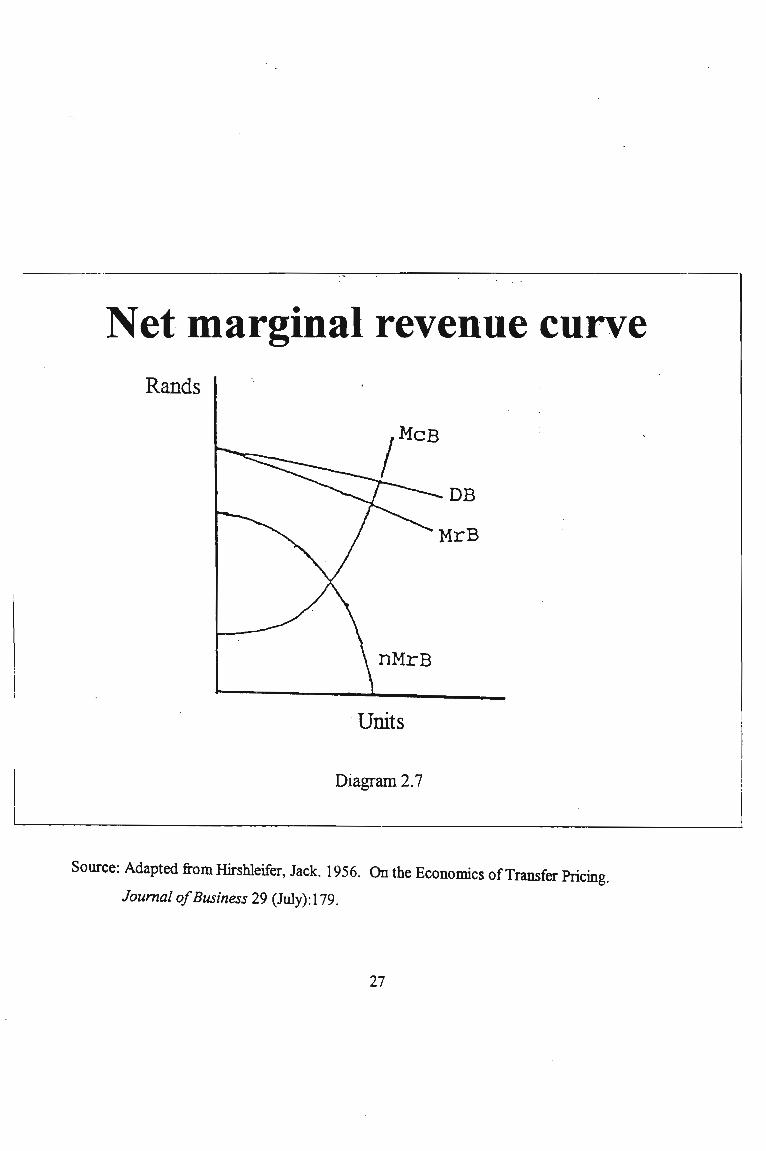
The frrst step in the analysis requires the receiving division to determine its net marginal
revenue at various output levels. For this purpose net marginal revenue is defined as the marginal
revenue associated with the sale of the final product in the external market minus marginal cost.
Assuming the final external market is imperfectly competitive, the net marginal revenue curve ofthe
buying division is depicted in Diagram 2.7.
In Diagram 2.7 McB represents the marginal cost curve of Division B. DB represents the
demand curve faced by Division B in the external market (assumed to be imperfectly competitive).
MrB represents the marginal revenue curve derived from the demand curve DB. nMrB represents the
net marginal revenue curve ofDivision B (ie. MrB -McB).
26
Net marginal revenue curveRands
'Units
Diagram 2.7
Source: Adapted from Hirshleifer, Jack. 1956. On the Economics ofTransfer Pricing.
Journal o/Business 29 (July): 179.
27

The next step in the analysis calls for a summation, at each output level, of the net marginal
revenue curve ofDivision B and the marginal revenue curve ofDivision A (which A derives by selling
in an imperfectly competitive intermediate market)to arrive at LMR. The point of intersection of
LMR and the marginal cost curve of Division A establishes the optimal firm wide level of output.
This is graphically represented in Diagram 2.8.
In Diagram 2.8 DB, MrB and nMrB are as defined under Diagram 2.7. DA represents
Division A's intermediate market demand curve (imperfect competition) and MrA is the marginal
revenue curve derived from this demand curve. LMR is equal to nMrB plus MrA Ifa line (AQ) is
dropped from the point of intersection ofMcA (Division A's marginal cost curve) and LMR to the
horizontal axis the point of intersection of this line with the horizontal axis establishes the amount
Division A should produce in order to maximise the firm's profits (00 in this case).
Similarly, ifa horizontal line (AP) is drawn from the point of intersection ofMcA and LMRto the vertical axis, the point of intersection ofthis line with the vertical axis establishes the transfer
price (OP in this instance). The number ofunits transferred from Division A at the transfer price OP
is determined by the point ofintersection of AP with nMrB. Thus Division B will purchase OL units
from Division A at the transfer price OP. It therefore follows that the number of units to be sold
externally in the intermediate market by Division A is 00 - OL, which is also equal to OK (the point
of intersection of AP and MrA) The price at which quantity OK will be sold in the intermediate
external market will be established by reference to the intermediate market demand curve, DA (OR
in this instance). As the demand curve will always lie above MrA it follows that the price at which
quantity OK will be sold in the intermediate market will always be higher than the transfer price.
The general conclusion to be drawn from the above analysis therefore is that in a situation
where the supplying division sells its product in two markets, the external intermediate market and
internally, the internal transfer price will be lower than the intermediate market price. Had the transfer
price been set at the inten;nediate market price, the supplying division would have oversupplied and
the buying division would have underpurchased, leading to less than optimal firm profits (Benke &
Edwards 1980 144).
28

Imperfectly competitiveintermediate market
MeA
DB
""R
P~--~-------~--~'C'MR'MrA 0&..
Rands
o K Units L Q
Diagram 2.8
Source: Adapted from Hirshleifer, Jack. 1964. Internal Pricing and Decentralized Decisions. In
Management Controls: New Directions in Basic Research. Bonini, Jaedicke, and Wagner
(editors), New York:Mc Graw Hill, Inc. 33.
29
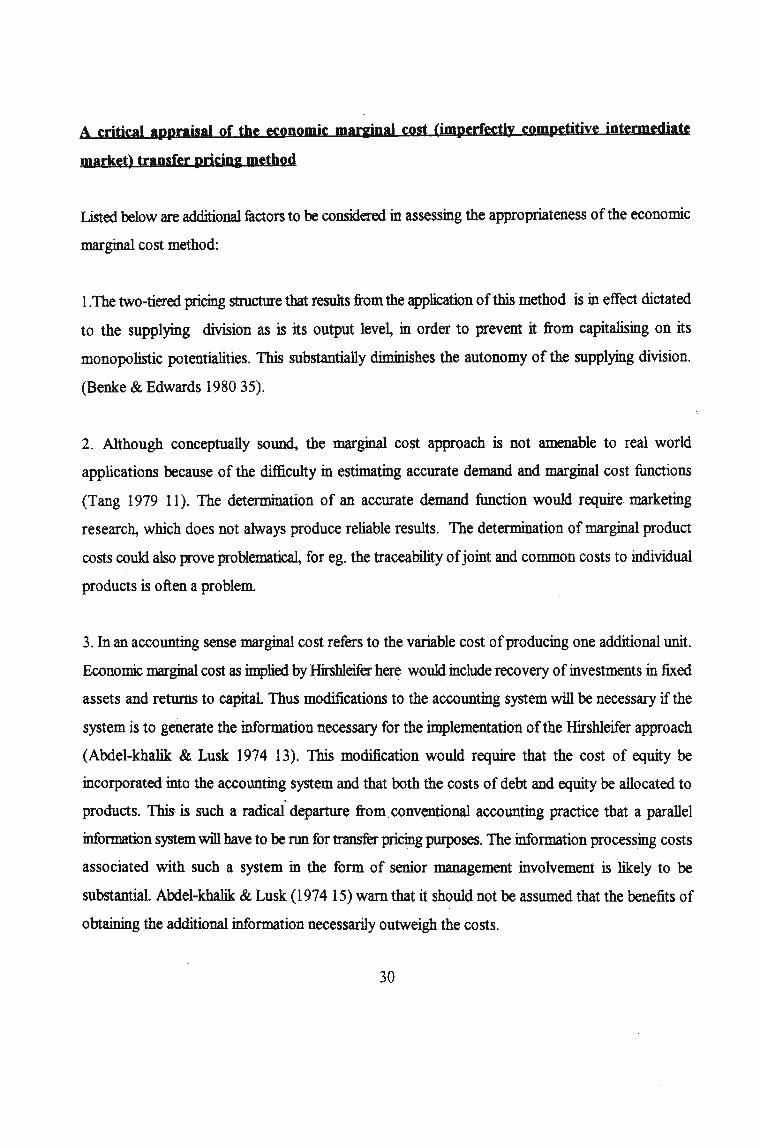
A critical appraisal of the economic marginal cost (imperfectly competitive intermediate
market) transfer pricipg method
Listed below are additional factors to be considered in assessing the appropriateness of the economic
marginal cost method:
1.The two-tiered pricing structure that results from the application of this method is in effect dictated
to the supplying division as is its output level, in order to prevent it from capitalising on its
monopolistic potentialities. This substantially diminishes the autonomy of the supplying division.
(Benke & Edwards 1980 35).
2. Although conceptually sound, the marginal cost approach is not amenable to real world
applications because of the difficulty in estimating accurate demand and marginal cost functions
(Tang 1979 11). The determination of an accurate demand function would require marketing
research, which does not always produce reliable results. The determination of marginal product
costs could also prove problematical, for ego the traceability ofjoint and common costs to individual
products is often a problem.
3. In an accounting sense marginal cost refers to the variable cost of producing one additional unit.
Economic marginal cost as implied by Hirshleifer here would include recovery ofinvestments in fixed
assets and returns to capital Thus modifications to the accounting system will be necessary if the
system is to generate the information necessary for the implementation ofthe Hirshleifer approach
(Abdel-khalik & Lusk 1974 13). This modification would require that the cost of equity be
incorporated into the accounting system and that both the costs of debt and equity be allocated to
products. This is such a radical departure from. conventional accounting practice that a parallel
information system will have to be run for transfer pricing purposes. The information processing costs. .
associated with such a system in the form of senior management involvement is likely to be
substantial. Alxlel-khalik & Lusk (1974 15) warn that it should not be assumed that the benefits of
obtaining the additional information necessarily outweigh the costs.
30
4. The assumption of demand and technological independence is questionable in practice (Abdel
khalik & Lusk 1974 14).
5. There is an incentive under the marginal cost system for divisional management to mis-represent
cost data. This will maximise divisional profit but resuh in overall suboptimisation (Abdel-khalik &
Lusk 1974 15).
6. As the model is cost based inefficiencies incurred in the supplying division will be passed on to the
buying division. In order to avert this, divisions may seek the implementation ofa control procedure
to isolate the inefficiency in the supplying division. This external form. ofcontrol however may impair
divisional autonomy (Abdel-khalik & Lusk 1974 15).
7. The model considers two divisions only. Complexities associated with multiple divisions dealing
in multiple products are ignored (Abdel-khalik & Lusk 1974 15). Solomons (1965 183) points out
however that in the case ofa single division manufacturing multiple products the ascertainment of the
separate marginal costs of the individual products is not necessarily any more complex than
determining marginal cost for a single product, provided that the fixed costs do indeed remain fixed
and perfect accuracy is not called for.
8. If the supplying division is able to reduce costs through enhanced productivity, marginal cost
pricing will not result in an increase in profit for the supplying division as the receiving division will
reap the increased profit due to a lower transfer price. On the other hand ifthe transfer price remains
unadjusted so that the benefit of increased cost efficiencies accrues to the supplying division there
is no incentive for the receiving division to change its production mix or expand output to capitalise
on the relatively cheaper input prices. Measures could be employed to counter this difficulty but such
measures deviate from the theoretical principles ofmarginal cost pricing (Onsi 1970 537-538).
9. Marginal cost pricing assumes all necessary resources are available to produce the optimal output.
This is an unrealistic assumption as profit centres may experience monetary or physical constraints
31

·such as manpower. If these are not dealt with in the system the solution may be impractical (Onsi
1970538).
It can be concluded from the above points that there are significant limitations to the economic
marginal cost transfer pricing method which need to be considered before the method can be applied
in practice.
2.6 VARIABLE PLUS FIXED COST MEmOD
Vendig (1973) proposes a two-part transfer pricing system. The receiving division should be charged
a standard variable cost per unit transferred plus a lump sum share of the fixed costs of the
supplying division. Vendig demonstrates the advantage ofsuch a system by comparing it to a singular
full-cost transfer pricing system which could resuh in a lack of goal congruence. Consider the
following example.
lllustratiye Example- Variable plus fixed cost method
The receiving division CUlTently sells 5 000 000 units ofa product at RI.OO. Transfer-in costs are 70c
a unit (full cost). Additional processing costs are Sc a unit. The division therefore currently reports
a profit ofS 000 000 • R(I.OO-0.70-0.05) =RI 250 000.
A competitor enters the market and begins selling the product at 60c a unit. If the division
dropped its price to 60c in order to compete its profit statement would appear as shown in Exhibit
4.
In view of the loss the division would be inclined to discontinue the sale of the product.
However from a group perspective, given additional information that the full-cost transfer price
represents a fixed element of 30c and a variable element of 4Oc, it makes sense for the division to
continue selling the product since it will make a positive contribution to group profit of 60c - 40c
Sc =15c a unit (sales, less an variable costs). Since the above performance report of the division does
not reflect this fact there is no incentive for the division to take the correct goal congruent decision.
32

EXHIBIT 4
RECEIVING DIVISION PROFIT STATEMENT AT REDUCED SELLING PRICE
Sales
Variable costs
Transfer-in
Processing
Loss
5000 000 * .60 =
5 000 000 * .70 =
5 000 000 * .05 =
R
3000000
(3500000)
( 250 QQO)
( 750000)
An obvious remedy to this problem is to base the transfer price on variable cost only. However such
a system overemphasises the short term and ignores the reality of the necessity to recover fixed costs
in the long run. To remedy this problem Vendig proposes a two-part transfer pricing system Such
a system fosters both a long-term and a short-term perspective to decision making which
simultaneously is beneficial to individual divisions and the group as a whole.
In ten:nS ofthe two-part transfer price the variable cost portion ofthe transfer price should .
be based on standard variable cost per unit. The fixed cost portion ofthe transfer price should be
based on that proportion ofthe capacity costs of the supplying division which are directly traceable
to the product. Furthermore the fixed costs should be charged in one lumpsum at the beginning of
the reporting period. This adds emphasis to the fact that the fixed cost is a committed cost which
must be recovered by a contribution to profit and cannot be varied in the short-term The profit
statement of the receiving division assuming a two-part transfer price and a lump-sum fixed cost
transfer ofRI 500000 (5000000 * 30c) would appear as shown in Exhibit 5.
33

EXHIBITS
RECEIVING DIVISION PROFIT STATEMENT: TWO-PART TRANSFER PRICE
Sales
Variable costs
Transfer-in
Processing
Marginal contribution
Fixed costs
Lump-sum supplying
division transfer
Division contribution
5000000 * .60 =
5 000 000 * .40 =
5 000 000 * .05 =
R
3000000
(2000000)
( 2500DO)
750000
(1 500000)
( 750000)
The advantage ofthis profit statement that is afforded by the two-part transfer price is that
it considet:s both short-term (variable cost) and long-term (fixed cost) factors. Thus an evaluation
could be madebfthe division or the group on a short- term or a long-term basis or on both bases
simultaneously. For the current reporting period the division should be evaluated on its marginal
contribution to group profit ofR750 000 which was previously not apparent. Thus, charging fixed
costs as a period cost ensures that the receiving division's decision concerning the volume oftransfers
is liot distorted by the conversion of the supplying division's fixed costs into the variable costs
of the receiving division, as is the case in a singular full-cost transfer pricing system (Solomons 1965
203) . However in the long run head office should take cognisance ofthe fact that a potential saving
of RI 500 000 could be made in terms of directly traceable capacity costs if the receiving division
34

were closed down.
A critical appraisal of the yariable plus fIXed cost transfer pricing method
a) Promotion ofefficiency
An advantage ofthe system is that "including variable cost at standard rather than at actual in the
transfer price would tend to motivate the manufacturing segments to operate as efficiently as possible
in order to produce a favourable variance" CVendig 1973 35).
Only those variances which are controllable by the supplying division however should be
attributed to it. Ifthe buying division is responsible for inefficiencies, for example overtime worked
in order to fulfil a rush order, then these costs should be charged to the buying division (Fremgen .
197027).
Benke & Edwards (1980 26) however maintain that in the latter case this may not be a
satisfactory solution as disputes will inevitably arise as to what portion of the variance is truly
attributable to the receiving division. For example, the receiving division could conjure up an
argument that overtime had to be worked because of inept scheduling on the part of the supplying
division. The system therefore does have behavioural implications.
b) Goal Con&JUence
As stated above, a short-term and a long-term decision making perspective is accommodated. This
promotes goal congruent behaviour.
c) Fair divisional performance evaluation
The method dbes not fairly reflect the contribution ofthe supplying division to group profitability as
the supplying: division would always break even since transfers are at full cost. In fact from the
supplying division's perspective profit centre accounting is an impossibility and. the division would
have to be evaluated as a cost centre. However circumstances could arise where evaluation of the
supplying division as a cost-centre could also prove problematical. An example of this would be
where the buying divisions use the supplying division as a type ofcentralised warehouse and draw
35

minimum quantities of inventory at regular intervals in order to minimise their own holding costs.
In such a case evaluation of the supplying division even as a cost centre may prove problematical
because its own holding costs would be influenced by the decisions made by other divisions (Fremgen
197027).
cl) Disputes
The identification of traceable fixed costs could prove problematical and disputes could arise. The
manager of the receiving division would not want fixed costs that are not directly traceable to the
product to be included in the transfer price. Uhimately the transfer price could end up reflecting the
negotiating skills of the divisional managers rather than true costs.
e) Changes in planned capacity
In determining capacity costs of the manufacturing division directly attributable to the receiving
division Vendig suggests the base should be the planned average operating level at the time the plant
was designed. If the current average expected usage is significantly different then divisional,
management would have to negotiate the appropriate charge level (Vendig 1973 35). Again this
renders the system vulnerable to reflecting the negotiating skills of the parties rather than a fair
transfer price for capacity costs.
oCost increases
As stated above, because transfers are at standard price the supplying division is motivated to reduce
its costs as nnlth as poSSIble. It would therefore seek to have large production runs to achieve
economies ,ofscale. However "there are times when there are very good reasons for costs to be
increased in order to take advantage ofprofit opportunities" (Cook 1955 90). For example, to fill
special orders:which make a positive contribution to profit. But, ifproducers tend to be evaluated
on cost performance alone, they will resist such special requests which increase their costs, thereby
fiustrating goal congruence. "This, then, is the basic dilemma ofany cost-control system" (Cook 1955
90).
36

~) Two production lines
It sometimes happens that a company runs two production lines, one with higher costs than the other.
The question therefore arises: should the receiving division be charged with the variable and fixed .
costs of the cheaper or more expensive production line if it does not absorb all the production or
should the costs be averaged out? (Cook 195591).
h) Cheatina
Being a cost-based system it is susceptible to cheating, particularly from the supplying divisions
perspective. For example there is incentive to l~ggle reports, hide methods improvements, and make
simple operations look difficuh when a time-study man is watching" so that favourable variances may
be reported (Cook 1955 87).
i) Cost classification
It is assumed that all costs can be classified as being either fixed or variable. Breaking down costs into
their fixed and variable elements is not a straightfolWard exercise.
2.7 OppoRTUNITY COST METHOD
Two opportunity cost based methods will be discussed; (1) variable cost plus opportunity cost and
(2) marginal opportunity cost.
I. Vanablli'''' plut opportunity cost method-
Onsi (1970)proposesthe use ofan opportunity cost based transfer pricing system which he maintains
addresses someofthe deficiencies inherent in economic marginal cost transfer pricing. In particular
the system he proposes is able to account for physical and financial constraints that exist at head
office and divisional level and which tend to be ignored under economic marginal cost analysis.
37

Onsi (1970) defines opportunity cost as follows:
Intermediate market exists
Ifan external marlcet exists for the intermediate product then the external market price
represents the opportunity cost for internal transfer pricing purposes.
No intermediate market
Ifthere is no external market for the intermediate product, then the opportunity cost
ofproducing the intermediate product is represented by the contribution that could
be derived by producing some other product that has an outside market.
The opportunity cost principle is illustrated by Onsi (1970) using the following illustrative
example.
Wustratiye eumple: Variable cou plus opportunity cost method
The supplying division produces two products, A & B. Product A has no outside market and is
transferred to the receiving division. Variable costs ofA amount to R3 per unit. Product B is sold
in the outside market and yields a contribution ofR8 per unit. There are two resource constraints;
WI 60 units and W2 40 units. Product A utilises 3 units ofWI and 2 units ofW2. Product B utilises
6 units ofWI and 4 units ofW2. Our objective is to determine a transfer price for Product A.
Solution
The decomposition principle is utilised to solve this problem. The underlying mathematical steps
applied in arriving at a solution are not discussed here as this is unimportant. It is the output variables
of the model in the form of shadow prices which represent the opportunity costs of using scarce
resources which are the significant determinants ofthe transfer price.
38

The above problem can be expressed in linear programming format asfollows:
Objective function: Maximise profit =?A + 8B
subject to:
Wl: 3A+6B~60
W2: 2A+4B~40
A,B 2: 0
As the price ofProduct A is unknown, it must be assumed initially that the supplying division
will maximise its profits by producing Product B only. Under this assumption the optimal solution
is to produce 10 units ofB, yielding a contribution of 10 * R8 = R80. Producing 10 units ofB will
resuh in both resources being fully utilised and a shadow price ofWl=8/10 and W2=8/10. These
shadow prices can now be used to calculate the profit foregone for each unit ofA produced.
As Product A uses 3 units ofW1 and 2 units ofW2 the opportunity cost ofusing these scarce
resources is (3 • 8/10) + (2 * 8/1 0) = R4. This means that for each unit ofA produced and sold
internally the group is foregoing a profit ofR4. (The accuracy ofthe shadow prices can be double
checked as follows. B utilises twice as many resources as A Thus for every unit ofA produced ~
a unit ofB is given up. As B yields a contribution ofR8 the opportunity cost ofproducing one unit
ofA is Y2 • R8 =R4). The following formula is now applied to calculate the transfer price for each
unit ofA produced and transferred to the receiving division:
Transfer price = Variable cost + opportunity cost
= . R3 + R4
= R7
A <:ritical appraisal of the variable cost plus opportunity cost transfer pricina method
a) Goal coQifUence
Onsi (1970539) points out that ifidle capacity exists, problems may be experienced in motivating
39

the supplying division to utilise this idle capacity to produce the intermediate product. As the shadow
price of idle resources is zero no additional contribution will be earned by the supplying division if
it increased its scale of operations. Divisional management will be reluctant to take on additional
responsibilities without any rewards.
From the group perspective however it may be desirable for the supplying division to produce
the intermediate product as contnbution in the receiving division may be positive. Thus the method
does not promote goal congruence under these circumstances.
b) Operational problems
Onsi (1970 539-542) identifies some operational problems arising from the use ofopportunity costs.
Ifthe contribution margin ofthe product that is sold externally by the supplying division is high the
resuhant high transfer price ofthe intermediate product may render the product unaffordable to the
receiving division. From a group perspective this is not really a problem as the system still generates
a plan consistent with group profit maximisation. However the receiving division may be bound by
contractual commitments to produce the product. In these circumstances the receiving division
should not be allowed to ask the supplying division to subsidise its production by lowering the
transfer price as the supplying division should not be penalized by decisions it did not make.
The converse also holds true. Ifthe contribution margin ofthe alternative product sold by the
supplying division is low, the transfer price ofthe intermediate product will also suffer. Attempts by
the supplying division to get the receiving division to subsidise its operation should also be resisted.
In the long run, the supplying division will have to introduce new products with higher contribution
margins to improve its profitability.
cl Shadow price&
Abdel-khalik & Lusk (1974 16) pOint to the following difficulties with regard to the use of shadow
prices in linear programming:
I. Program inputs are centrally determined. This strengthens the case for centralisation
to achieve communication efficiencies and the whole concept of decentralised profit
40

centres may be brought into question.
2. Following on from the above, divisional morale may be negatively affected due to the
imposition of shadow price determined transfer prices by head office.
3.If a division deviates from the optimal solution then pre-determined shadow prices as a
measure of opportunity cost are rendered inaccurate.
4. The linearity assumption limits the scope of the application of the model in non-linear
situations.
2. Marginal opportunity cost method
This transfer pricing method, proposed by Holstrum & Sauls (1973), is based on the premise that it
is only beneficial to the group for interdivisional transfers to take place if the opportunity cost of the
receiving division is greater than the opportunity cost of the supplying division, where opportunity
cost is defined as "the benefit foregone by failing to undertake the next best alternative" (Holstrum
& Sauls 1973 29). Consistent with this theory is the proposition that the transfer price should be
greater than the opportunity cost ofthe supplying division (in order to motivate it to supply) and less
than the opportunity cost of the receiving division (in order to motivate it to buy). In these
circumstances "whenever it is beneficial from a firm-wide view to have a transfer occur, such a
transfer is also beneficial to each division. Conversely, whenever the transfer is detrimental from a
firm-wide view, it is also detrimental to the performance measurement (profit) of one or both
divisions" (Holstrum & Sauls 1973 29). In this way the method ensures goal congruence.
Diagram 2.9 depicts the marginal revenue curve (AB) and the marginal cost curve (CD) of
the supplying division. The marginal revenue curve is horizontal as the market for the intermediate
product is assumed to be perfectly competitive. Ignoring interdivisional transfers the profit
maximising quantity to be produced and sold by the supplying division in the intermediate market is
OQ at price OA (the intersection of the marginal revenue and marginal cost curves). Thus for any
41

Rands
Opportunity cost ofsupplying division
c.;,OCW'l\Inify cext • AEO BA~~"":":"~:':":':"'---::"':'-_~;;:C-----------
O.~--------"""'------------Q
Diagram 2.9
Units
Source: Adapted from Holstrum, Gary L., and E. H. Sauls. 1973. The Opportunity Cost Transfer
Price. Management Accounting (D.S.A.) 54 (May):29
42

quantity up to 00 opportunity cost is represented by the line AE.
To motivate the supplying division to expand output beyond 00 the price offered for each
incremental unit will have to at least equal marginal cost. Hence opportunity cost for units in excess
ofOQ is represented by the line ED. The full opportunity costs of the supplying division are therefore
represented by the curve AED. Bearing this in mind let us now turn our attention to the cost and
revenue curves of the receiving division.
In Diagram 2.1 0, the horizontal line CD represents the market price prevailing in the
intermediate product market. The curve GH represents the net marginal revenue curve of the
receiving division (net marginal revenue =marginal revenue derived from the sale of the final product
- marginal costs incurred in the receiving division). The receiving division may buy the intermediate
product in the intermediate market or from the supplying division. In respect ofquantities up to 00
the best alternative to obtaining the intermediate product from the supplying division is to obtain it
externally in the intermediate market at price OC. Thus for quantities upto 00 opportunity cost is
represented by the line Cl For quantities in excess of OQ, the maximum price the receiving division
would be willing to pay for the intermediate product is limited to net marginal revenue as any price
in excess ofnet marginal revenue will result in a loss on these incremental units. The full opportunity
cost ofthe receiving division across the range ofquantities is therefore represented by the curve cm.Bearing this in mind let us now turn our attention to Diagram 2.11. The curves AED
(Diagram 2.9) and cm (Diagram 2.10) are superimposed in Diagram 2.11. Reading off the co
ordinates of the point of intersection of the two curves establishes the optimal quantity to be
transferred, 00, and the transfer price OP. A transfer price below OP will result in the supplying
division transferring fewer than OQ units as the opportunity cost (marginal cost) of the incremental
units will be greater than the revenue derived therefrom. Similarly a transfer price above OP will
result in the receiving division demanding a quantity less than OQ as its net revenue on the
incremental'units will be less than the transfer price. Only a transfer quantity of00 at price OP will
result in profit maximisation for the individual divisions and the group as a whole.
43

Opportunity cost ofreceiving division
Rands
oIntermediate mkt. price
.Units
IIIIjII Net marginal revenue - GJHII
Qo
CO·pportunltycost • CJH
G
Diagram 2.10
Source: Adapted from Holstrum, Gary L., and E. H. Sauls. 1973. The Opportunity Cost Transfer
Price. Management Accounting (U.S.A.) 54 (May):30.
44

_ .._._---.,...------------:::----:------:----~
Optimal transfer price
Rands
Jct---------.......Opportunity cost ofreceiving division = CJ H
P
AI---------------~Opportunity cost of supplying division = AED
D
H
o Units
Diagram 2.11
Q
Source: Adapted from Holstrum, Gary L., and E. H. Sauls. 1973. The Opportunity Cost Transfer
Price. Management Accounting (U.S.A.) 54 (May):31.
45

A critical appraisal of the mal'linal opportunity cost transfer pricina: method
a)Imperfectly competitive inteunediate market and ioal CODiJUence
Earlier when discussing Hirshleifer's marginal cost transfer pricing system reference was made to the
fact that if the buying or selling division is allowed to manifest monopolistic behaviour this would
result in an output level which maximises divisional profit but which reduces group profit. The
transfer pricing system proposed by Holstrum & Sauls is similarly susceptible to suboptimality. A
monopolistic buying division could dictate a transfer price lower than OP whilst a monopolistic selling
division could dictate a transfer price higher than OP. In both cases the resuhing quantity transferred
between the divisions ifhead office does not intervene would be less than the optimal quantity OQ.
This would mean that the increase in either division's profit would be more than offset by the
reduction in group profitability. Thus the system will not promote goal congruence in these
circumstances. On the other hand ifhead office were to step in to curb monopolistic behaviour in
order to maximise group profit, divisional autonomy would be impaired.
b) Divisional performance evaluation
The fairness of the system in evaluating divisional performance depends on whether there is a well
developed intermediate market for the product or not.
In the case of a well developed intermediate market, a transfer pricing system based on
marginal opportunity cost will automatically result in an accurate assessment of divisional
performance evaluation as the system penalises suboptimal behaviour on the part of the causant. For
example, ifthe manufacturing division fails to produce the optimal quantity only its profits will suffer.
The receiving division can simply purchase the intermediate product in the external market to make
up the shortfall (Holstrum & Sauls 1973 32).
46

Ifthere is no intermediate market then an accounting system which records interdivisional
transfers at the optimal opportunity cost transfer price would resuh in unfair divisional performance
evaluation if the quantity transferred is less than optimal (Holstrum & Sauls 1973 32). Consider
Diagram 2.12. GH represents the opportunity cost of the supplying division and EF represents the
opportunity cost of the receiving division. The optimal opportunity cost based transfer price and
quantity is OJ and OQ respectively. At this output level group profit is represented by the triangle
ELG. The profit that accrues to the supplying and receiving divisions is represented by the triangles
JLG and ED respectively.
Assume now that the supplying division, due to its personal circumstances, (for example, a
strike), is unable to supply output OQ but instead produces OQs (ie. the single joint level of output
for the group as a whole is OQs since there is no intermediate market). Group profit would now be
represented by the quadrilateral EKMG implying a reduction in group profit represented by triangle
KIM. Ofthis reduction KNL would be recorded in the books of the receiving divisionand NML in
the books ofthe supplying division. This is however unfair to the receiving division. The fact of the
matter is that the entire reduction in profitability is attributable to the supplying division and it is
unfair for the profits of the receiving division to be affected by the unilateral action of the supplying
division.
To rectify this deficiency in the performance evaluation system caused by this transfer pricing
method Holstrum & Sauls (1973 33) recommend a supplementary journal entry be passed which
would effectively credit the receiving division with the loss represented by triangle KNL and debit
the supplying division therewith. This modification to the primary transfer pricing system however
adds an added dimension ofcomplexity to the system and disputes could arise.
c) Divisional autonomy
It appears that for the system to' function practically the transfer price will have to be centrally
determined by head office after the necessary information has been forwarded to it. This implies an
impairment ofdivisional autonomy.
47

---------- --------------
Less than optimaltransfer quantity
Rands
Diagram 2.12
Source: Holstrum, Gary L., and E. H. Sauls. 1973. The Opportunity Cost Transfer Price.
Management Accounting (D.S.A.) 54 (May):33.
48

d) CheatinK
Holstrum & Sauls (1973 33) indicate that for the system to function effectively it should be fleXIble
enough to allow for revisions in the transfer price to take place during the reporting period.
Mechanisms should therefore be in place to allow for a division to request a review ofthe transfer
price in response to environmental changes. They acknowledge however that such a system is open
to abuse in that a division will tend to report only unfavourable developments and suppress
knowledge offavourable developments. This will have to be countered by head office independently
gathering information or instituting audits ofdivisional records. This again detracts from divisional
autonomy.
2.8 INCREMENTAL COST METHOD
Goetz (1967) is quite emphatic in his assertion that the only relevant goal congruent transfer price
is one based on incremental cost. "I contend that both market price and average historical cost, with
or without a markup, will be both (1) irrelevant and (2) mischievous in that· either will motivate
divisional managers to make decisions inimical to the welfare of the company. The unique correct
transfer price here, and eVeI)Where in intra-eompany transfers, is incremental cost" (Goetz 196743).
Definition of incremental cost
Incremental cost is defined as the amotult by which total costs will increase (decrease) ifactivity is
increased (reduced). For this purpose activity is defined as a batch ofjobs. If three additional jobs are
contemplated then the relevant incremental cost is the increase in total cost associated with
undertaking all three jobs simuhaneously. Based on this definition Goetz proceeds to prove his case
based on the following illustrative example.
Dlustrative example - Incremental cost method
Assume a company has four divisions: A,B,C and D. Division D is a computer service bureau which
49

services the other three divisions. It hires its computer from a manufacturer at a cost ofR 4000 per
week plus R 50 per hour for hours in excess of 40 per week. Weekly demands on Division D's
services are as follows.
Division Jobs Hours per Total
job hours
A 15 1 15
B 1 15 15
C 2 6 12
~
Division D thus incurs a weekly cost ofR 4000 + (2 * R 50) =R 4100. This translates into
an average cost per hour ofR 4100/42 ~ R 97.62. External computer service companies are assumed
to render a similar service at an external market price ofR 120 per hour.
There are three conceivable transfer prices which can be determined from the above
information - incremental cost, market price and actual cost.
1. Incremental cost transfer price
The incremental cost transfer price, as defined by Goetz, that will be charged to each division is
calculated as follows:
Division A: There are two conceivable incremental cost transfer prices. If jobs are not
batched the transfer price will be R 50 per job because total company cost will
be reduced by R 50 ifanyone of the 15 jobs is discontinued.
Ifjobs are batched (between 2 and 15 jobs (inclusive) per batch) the
transfer price will be R 100 per batch, irrespective of the number ofjobs per
batch. This is so because the reduction in total company cost is limited to
R100 ifa batch constituting 2 or more jobs is eliminated.
50

Division B: The incremental cost attributable to this one job is R 100 because if it is
eliminated total company cost is reduced by RI 00. Division B should thus be
charged a transfer price ofR 100.
Division C: Similarly, ifjobs are not batched the transfer price will be R 100 per job.
If the jobs are batched (2 jobs per batch) the transfer price will be RI00 per
batch.
2. Market based transfer price
A market based transfer pricing system will resuh in a transfer price for each division calculated as
follows:
Division A: R 120 * 1 hour = R 120 per job
Division B: R 120 * 15 hours = R 1800 per job
Division C: R 120 * 6 ho,urs =R 720 per job
3. Transfer price based on actual cost
A transfer price based on actual cost is calculated as follows:
Division A: R 97.62 * 1 hour = R 97.62 per job
Division B: R 97.62 * 15 hours =R 1464.30 per job
Division C: R 97.62 * 6 hours =R 585.72 per job
Assume now that the manager ofDivision C devises some alternative means, costing R 950
externally, of performing the two jobs performed by Division D. If the transfer price is based on
market price the manager ofDivision C will be motivated to contract externaDy. He will arrive at
his decision as follows:
51

Cost ofpurchasing internally
Alternative external means
Net advantage of alternative means
2 * R 720 = R 1440
R 950
R 490
Similarly, ifthe transfer price is based on actual cost the decision will be the same, based on
the following analysis:
Cost ofpurchasing internally
Alternative external means
Net advantage of alternative means
2 * R585.72 = R 1171.44
R 950.00
R 221.44
Both ofthe above decisions however can be shown to be lacking in goal congruence. From
the perspective of the group as a whole the correct decision is not to go for the alternative external
means but to contract internally. This is reflected in the analysis below:
Cost saving ifpurchased externally
Cost ofpurchasing externally
Net cost of external purchase
R 100 (total hours reduced from 42 to 30)
R950
R850
Ifthe transfer price had been based on incremental cost then the manager of C would have
made the correct goal congruent decision, arrived at as follows:
Incremental cost transfer price
Alternative external means
Net cost ofexternal purchase
52
Ifjobs are
batched
R 100
R950
R 850
Ifjobs are
not batched
R200
R950
R750

Thus transfer pricing systems based on incremental cost achieve one of the primary objectives
of a sound transfer pricing system, ie. the promotion of goal congruence.
A critical appraisal QC the incremental cost transfer pricing meil'lQd
a) Fair divisional perfonnance evaluation
Attainment of the objective of fair divisional performance evaluation under an incremental cost
transfer pricing system is not feasible. As Goetz (1967) puts it:
"... 'profit' centres have no validity, are worse than useless, where-ever (sic) one
organisational sul:xiivision does work for another; ... divisional managers cannot be
evaluated in terms of 'profits' made by their divisions" (Goetz 1967437).
The reason why divisional managers should not be evaluated based on profits under an
incremental cost transfer pricing system relates to the fact that the system is susceptible to allowing
the profits ofone division to be influenced by the unilateral actions of another division. Goetz (1967
438) presents the following example to illustrate this point.
Example
Based on the original information, let us assume that the manager of Division C finds an alternative
means ofdoing one ofhis jobs that will cost R 40 externally. Based on the following analysis he will
decide to contract externally.
Incremental cost transfer price
Alternative external means cost
Net advantage ofpurchasing externally
53
RIOO
R 40
R 60
Contracting outside will result in Division D reducing total computer hours to 36 (42-6). At
a total usage level of 36 hours the incremental cost of computer hours is nil. This implies that the
transfer price charged to Divisions A and B will be reduced to zero from whatever it was previously
and the profitability of the two divisions will rise accordingly. Thus these two divisions will appear
to be more profitable purely as a resuh of factors over which they had no control Clearly accurate
divisional performance evaluation is compromised by the dynamics of an incremental cost transfer
pricing system.
b) Lack of goal conWJence
Edwards & Roemmich (197635-36) present an illustration which highlights the weakness of an
incremental cost transfer pricing system as far as the attainment of goal congruence is concerned. Let·
us consider their example.
Example
Division A manufactures Product A which it can sell in the intermediate market for RS.OO.
Incremental costs are Rl.75. Ifthe product is not sold in the intermediate market it will be transferred
to Division B which will incur additional processing costs ofR2.00. Division B will realise R9.00
from the sale of the final product. Capacity in Division B is limited to 100 000 units of the
intermediate product. If Division B does not deal in the intermediate product it has the capacity to
deal in an alternative good, details ofwhich are as follows:
Raw material cost
Processing costs
Final selling price
Capacity limit
No interdivisional transfers
R 6.00
R 2.50
RIO.OO
150 000 units
If the supplying division sold the intermediate product in the external intermediate market and the
54
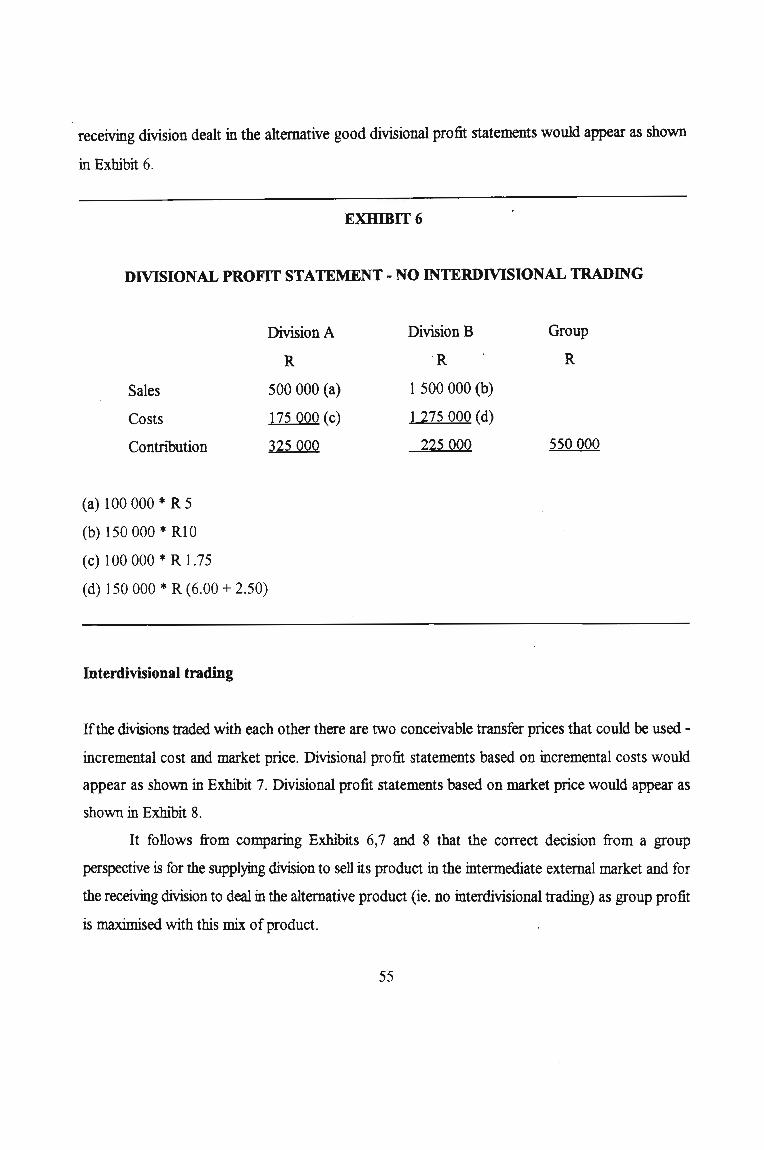
receiving division dealt in the alternative good divisional profit statements would appear as shown
in Exhibit 6.
EXHIBIT 6
DIVISIONAL PROFIT STATEMENT - NO INTERDIVISIONAL TRADING
Division A Division B Group
R R R
Sales 500000 (a) 1 500000 (b)
Costs 175 000 (c) 1 275000 (d)
Contribution 325000 225000 550000
(a) 100 000 * R 5
(b) 150000 • RIO
(c) 100000 * R 1.75
(d) 150000 * R (6.00 + 2.50)
Interdivisional trading
Ifthe divisions traded with each other there are two conceivable transfer prices that could be used
incremental cost and market price. Divisional profit statements based on incremental costs would
appear as shown in Exhibit 7. Divisional profit statements based on market price would appear as
shown in Exhibit 8.
It follows from comparing Exhibits 6,7 and 8 that the correct decision from a group
perspective is for the supplying division to sell its product in tlIe intermediate external market and for
the receiving division to deal in the alternative product (ie. no interdivisional trading) as group profit
is maximised with this mix of product.
55

EXHIBIT 7
DMSIONAL PROFIT STATEMENT - INCREMENTAL COST TRANSFER PRICE
Supplying Receiving Group
Division Division Total
R R R
Sales 175000 (a) 900000 (b)
Costs 175000 (c) 375000 (d)
Contribution 0 525000 525000
(a) 100000 * Rl.75
(b) 100000 * R9.00
(c) 100000 * Rl.75
(d) 100000 * R(1.75 + 2.00)
If the transfer pricing system were based on market price little difficulty would be
experienced in persuading the receiving division to make the correct goal congruent decision of
processing the alternative product as its profits rise by R25 000 (compare Exhibits 6 and 8). The
supplying division is indifferent as to interdivisional trading under a market based transfer pacing
system.
56

EXHIBIT 8
DIVISIONAL PROFIT STATEMENT - MARKET BASED TRANSFER PRICE
Supplying Receiving Group
Division Division Total
R R R
Sales 500000 (a) 900 000 (b)
Costs 175000 (c) 700000 (cl)
Contribution 325000 200 OQO 525000
(a) 100000 * R 5.00
(b) 100000 * R 9.00
(c) 100000 *R 1.75
(d) 100000 *R (5.00 + 2.00)
The incremental cost transfer pricing system on the other hand has the defect ofmotivating
the receiving division to agitate for the intermediate product to be processed further by it so that it
can report aprofit ofR525 000 instead ofR225 000 which would result ifno interdivisional trading
took place. The supplying division on the other hand will motivate for its product to be sold in the
external market so that it can report a profit of R325 000 instead ofnil. Naturally to resolve this
conflict head office will intervene and instruct the receiving division to manufacture the alternative
product. This however impairs divisional autonomy. All these problems will be avoided ifa market
based transfer pricing system is employed as opposed to an incremental cost transfer pricing system
57

2,9 COST PLUS AN ALLOWANCE FOR PROFIT METHOD
Two cost plus models will be discussed. The first model was proposed by Gordon (1970) and is set
within the context ofa socialist economy. The second model is the three-part transfer pricing model
proposed by Vendig (1973) and represents an extension of the two-part transfer pricing model
discussed earlier.
1. Adaptation of a Social;st economic model
Gordon (1970) sets forth an elaborate system for the determination of transfer prices in a
decentralised socialist economy. Although pitched at a macro-economic level the relevance ofthe
system devised by Gordon stems from the fact that this "transfer price system may also be used in the
administration of a large firm in a capitalist economy" (Gonion 1970 427). Thus government and
individual firms in a socialist economy can be likened to the head office and decentralised divisions
ofa large firm in a capitalist economy.
The functioning ofthe system proposed by Gordon is based on the following two basic rules:
1. Head office establishes the rules for determining transfer prices.
2. All other decisions (output, purchase, production) are decentralised and are to be
made by divisional management bearing the objective ofdivisional profit maximisation
in mind. In order to secure compliance with this objective divisional management is
to be given a profit incentive.
Rules for determining transfer prices
The system devised by Gordon calls for the updating of transfer prices on a quarterly basis. The first
step in the system entails the determination ofa standard transfer price at the standard output level.
This is calculated according to the following formula:
58

Standard transfer price = standard variable cost per unit + [standard annual fixed cost +
standard annual profit] -:- standard output for the year
Gordon classifies variable costs as those costs which vary in relation to output in the short
tenn. He regards fixed costs as consisting ofcapital costs (depreciation, interest) and payroll costs.
Payroll costs are regarded as being fixed since the level ofthe payroll expense is a top management
decision that is incorporated in the budget. Whilst subordinate levels of management may change
variable costs with output, payroll costs may not be changed unless top management revises the
budget. Between budgetary changes therefore, payroll costs remain fixed regardless of output.
The standard annual profit allowance is determined by head office and varies directly in
relation with divisional capital employed and payroll costs.
It must be stressed that the actual transfer price applicable to a quarter and set at the
beginning of that quarter is not the standard transfer price but a variant of it, dependent on the
relationship between the projected sales for that quarter and the standard output.
The formula for calculating the actual transfer price for the forthcoming quarter is as follows:
Actual transfer price = standard transfer price + y [projected sales for the quarter
(annualized) - standard annual output];
where;
y is a factor set by head office and depends on how sensitive head
office believes prices should be to fluctuations in sales level.
The effect of the above formula on the actual transfer price is as follows:
1. If projected sales are greater than standard output, the actual transfer price is
greater than the standard transfer price.
2. Ifprojected sales are less than standard output, the actual transfer price is less than
the standard transfer price.
59

The application ofthe actual transfer price formula is subject to the proviso that if the actual
transfer price so determined falls below standard variable cost per unit then the actual transfer price
should be set at standard variable cost.
A critical apPraisal of the cost plus IQ allowance for profit transfer pricing method
a) Divisional autonomy
Limited divisional autonomy is permitted. A division determines its own transfer price but under the
rules and subject to certain variables set by head office. Given this constraint, divisional managers
however are permitted to make their own output, purchase and production decisions in a manner
consistent with maximising divisional profit.
Thomas (1980 207) does make the point however that in effect the central office dictates the
transfer price since different parties applying the same rule in the same circumstances will arrive at
the same transfer price. Therefore divisions are not granted any real autonomy.
b) Cost classification
It is assumed that all costs can be classified as being either fixed or variable. Breaking down costs into
their fixed and variable elements is not a straightforward exercise.
Furthermore, the transfer price will vary according to volume and joint costs ego head office
administration costs will have to be allocated. The allocation ofjoint costs is necessarily arbitrary
(Abdel-khalik and Lusk 197421).
cl Fair divisional performance evaluation
Since head office determines the profit element of the transfer price the system is of little value in
evaluating managerial performance (Fremgen 1970 27).
d) Goal coniJ1lence
"Full standard cost plus a return on investment could cause a division to buy an intermediate outside
because the price was below the transfer price, even though the incremental cost of production
60

internally in another division would have been below the outside price. Obviously in such a situation,
outside purchase would add more to the company's outlays than production within the company
would have done. Such purchases would therefore reduce the company's profit...even though the
purchasing division, looked at by itself, might be better off as a result of the outside purchase"
(Solomons 1965 182).
e) Multiple products
Although Gordon assumes a single product environment, the necessity for practical purposes to
apportion fixed costs over several products which may be made by a division increases the complexity
of the system and may result in arbitrary allocations (Solomons 1965 183).
t) Technoloiical innovation
A cost-plus system may have the effect of deterring a manufaeturingdivision from searching for
technological innovation in order to reduce costs because ifcosts are reduced, then profits based on
costs will accordingly be reduced (Abdel-khalik & Lusk 1974 21).
2, The Three-Part Transfer Price
Vendig (1973) proposes a three-part transfer pricing system The first two components ofthe three
part transfer pricing system are as per the two-part transfer pricing system discussed earlier (see page
32). However to enhance the two-part transfer pricing system Vendig proposes a third charge be
included in the transfer price to compensate the supplying division for capital employed in
manufacturing the intermediate product. The capital charge will thus be a lump-sum charge similar
to the fixed cost charge and is calculated as follows:
Capital charge = Traceable fIXed assets • desired rate of return
The desired rate of return is determined by head office. The framework for the presentation of a
divisional profit statement under the three-part transfer pricing system is as shown in Exhibit 9.
61

EXHIBIT 9
RECEIVING DMSION PROFIT STATEMENT: THREE-PART TRANSFER PRICE
R
Sales x xxx xxx
x xxx xxx
(x xxx xxx)
( xxx XX2\)
Variable costs
Transfer in (variable cost of supplying division)
Additional proceSsing costs
Marginal contribution
Fixed costs
Lump-sum transfer of supplying division fixed costs (x xxx xxx)
Receiving division fixed costs (xxx)
Division contribution x xxx xxx
Capital charge
Traceable fixed assets of supplying division
Receiving division's capital charge
Divisional residual income
( xx xxx)
(xxx)
x xxx xxx
"The three-part transfer price thus keeps separate the three distinct parts of a transfer price
which can be exceedingly useful in evaluating both long-range and short-range situations" (Vendig
197336).
A critical appraisal of the three-part tnnsfer pridne method
cV Goalconif\lent decision ma.kina
It enhances the two-part transfer price. It improves the quality of information available for long-range
decision making as the capital charge is based on traceable fixed assets (Vendig 1973 36).
62

b) PerfQrmance evaluatiQn
Including a capital charge makes fQr better perfQrmance evaluation of the receiving division. As
Qpposed to the two-part transfer pricing system it enables the implementation of profit centre
accounting with its attendant motivational advantages for the supplying division. However the value
Qf this is limited because the desired rate Qfreturn is determined by head Qffice.
c) Emphasis Qn return Qn investment
It fQrces management "to think in terms Qfreturn on investment, which is what the company is in
business fQr" (Cook 1955 91).
d) vertical intesratiQp
A disadvantage of the system is that in a vertically integrated grQUP with many tiers the divisions
closest to the final market may find it increasingly difficuh to recover their costs due to prQfit add-ons
at each transfer stage. Thus the system may deter divisions from entering intQ interdivisional
transactions even though it may be in the interests Qfthe group for transfers to take place (CoQk 1955
92).
2,10 MARKET PRICE METHOD
Two authors, Hirshleifer (1956,1964) and Cook (1955), suggest the use ofmarket values in setting
transfer prices. Whilst Hirshleifer proposes his theory under certain specific conditions using
ecQnomic marginal cost analysis, Cook's theory is developed in a less rigorous form and is Qf greater
general application. Let us consider the circumstances under which Hirshleifer's theory applies firstly.
L. Perfectly competitive intennCdiate market
Hirshleifer (1956,1964) suggests that where the supplying division has the option Qftransferring its
pfQduct internally Qf selling it externally in a perfectly competitive intermediate market then the
appropriate transfer price shQuld be the market price prevailing in the intermediate market.
63

The analysis is however based on the simplifying assumption that a situation ofdemand and
technological independence exists between the two divisions. By demand independence is meant
that the quantity sold by the supplying division (Division A) in the external intermediate market will
not affect the quantity sold by the receiving division (Division B) in its final external market.
Conversely the quantity sold by Division B in its final external market does not influence the external
demand in the intermediate market. Hence Division A will not hesitate to sell its product externally
(in the intermediate market that is) ifDivision B does not offer at least the external market price and
Division B will not hesitate to buy externally if it is able to do so more cheaply. Technological
independence means that the production cost functions ofboth divisions are independent of the level
ofinterdivisional trading. The determination ofthe appropriate transfer price and output level in these
circumstances is graphically depicted in Diagram 2.13.
With reference to Diagram 2.13, OP represents the price Division A can obtain by selling its
goods externally in a perfectly competitive intermediate market. PE represents the marginal revenue
curve of Division A and McA the marginal cost curve of Division A. Division A will therefore
maximise its profits by selling OQ units. (At this point marginal revenue equals marginal cost of
Division A).
McB represents the marginal cost curve of Division B, excluding the cost of the bought-in
product. Irrespective ofwhether the bought-in product is purchased from Division A or externally,
Bwill have to pay a price of OP for the product as the intermediate market is perfectly competitive.
The dashed curve P + McB represents the overall marginal cost curve ofDivision B (ie. including the
cost (OP) for the transferred-in product~.
IfDivision B is able to sell its final product in a perfectly competitive external market at price
OT, MrF represents the marginal revenue curve of Division B. Division B will therefore maximise its
own profits by selling OQ units (at this point marginal revenue equals marginal cost ofDivision B).
But a single output level ofOQ for both divisions is consistent with a firm profit maximising
level of output too, for at OQ, McC (firm marginal cost) equals MrF (firm marginal revenue).
64

Rands
Perfectly competitiveintermediate market
OD
HeB
Epl---------::::-~--T--
Hee = HeA + NeB
P + HeB'-,
L-----------=:-:::'lr-- MrFT MeA
o Units Q
Diagram 2.13
Source: Adapted from Hirshleifer, Jack. 1964. Internal Pricing and Decentralized Decisions. In
Management Controls: Ne'rV Directions in Basic Research. Bonini, Jaedicke, and Wagner
(editors), New York:Mc Graw Hill, Inc. 31.
65

This therefore proves that if the intermediate market for Division A's product is perfectly
competitive then a transfer price equal to the market price in the intermediate market will cause both
divisions to act in a manner which will maximise their own and the firms's overall profit level. This
does not go to say that both divisions are forced to trade with each other and that a single joint level
ofoutput will always apply between the two divisions. All that is being propounded here is that ifthe
divisions are to trade with each other then the transfer price must be set at the market price as this
will ensure firm and divisional profit maximisation.
The fact that a single joint level ofoutput will not always apply in these circumstances can be
established by reference to Diagram 2.14.
With reference to Diagram 2.14, OP represents the price Division A can obtain by selling its
goods externally in a perfectly competitive intermediate market. MrA represents the marginal
revenue curve of Division A and McA the marginal cost curve of Division A. Division A will
therefore maximise its profits by selling OB units. At this point marginal revenue equals marginal cost
ofDivision A.
McB represents the marginal cost of Division B, excluding the cost of the transferred-in
product. Irrespective of whether the transferred-in product is purchased from Division A or
externally, B will have to pay a price of OP for the product. The dashed curve P + McB represents
the overall marginal cost curve of Division B (ie. including the cost (OP) of the transferred-in
product).
IfDivision B is ~ble to sell its final product at price OM, MrF represents the marginal revenue
curve of Division B. Division B will therefore maximise its own profits by selling OA units (at this
point marginal revenue equals marginal cost ofDivision B). We can see from this that a single joint
level ofoutput will not always be required for firm profit maximisation. However if trading is going
to take place the transfer price must be set at market price for the transfer price to be goal congruent.
Thus ifDivision B is going to purchase from Division A under the firm profit maximising scenario,
the maximum number ofunits it will purchase is OA at a transfer price ofOP. The number ofunits
sold by Division A externallywill be the difference between OB and the number taken up by Division
B. IfDivision B takes up all its requirements (OA) from Division A then Division A will sell AB units
externally.
66

Different divisional outputlevels
Rands p + MeB
NrF ----N ----- HeA-- --P MrA
NeB
o Units
Diagram 2.14
A B
Source: Adapted from Hirshleifer, Jack. 1964. Internal Pricing and Decentralized Decisions. In
Management Controls: Nel1' Directions in Basic Research. Bonini, Jaedicke, and Wagner
(editors), New York:Mc Graw Hill, Inc. 31.
67

Imperfectly competitive final market
The above analysis has assumed that the market for B's final product is perfectly competitive; hence
the flat marginal revenue curve (MrF). Changing this assumption to one of an imperfectly
competitive market for the final product ofB does not in any way change the analysis. All that would
happen is that MrF would be downward sloping instead of flat. The method ofoutput and transfer
price determination remains unchanged.
General conclusion
The general conclusion to be drawn from the above analysis is that where the selling division is able
to sell its product in an intermediate market characterised by perfect competition, the appropriate
transfer price, (irrespective of the market characteristics of the final product) is the market price
prevailing in the perfectly competitive intermediate market.
A critical appraisal of Birshleifer's market price transfer pricing method
a) Goal congruence
The method promotes goal congruence as it results in group profit maximisation.
b) Fair divisional perfonnance evaluation
Divisional performance evaluation is fair because market price is objectively determinable.
c) Divisional autonomy
Divisional autonomy is enhanced because divisions can be granted the freedom to trade with each
other or to trade externally. There is generally no incentive for head office to intervene in this respect
since market perfection will ensure that group profit will remain unaffected by the decision to contract
internally or externally.
68

cl) Practical relevance
Thomas (1980136) points to the following requirements for market perfection:
1. Market participants should have perfect knowledge of market prices and product
characteristics.
2. Prices should be certain and uninfluenced by market participants.
3. Neither ofthe divisions should incur transportation costs, transfer taxes, bad debt losses,
brokerage fees or other transactions costs.
Thomas (1980 136) concludes that these conditions are difficult to satisfy and therefore the
incidences ofperfect markets are rare. Benke & Edwards (1980 35) however are ofthe opinion that
ifthe market imperfections are slight then the method could still be used at a small loss of efficiency.
c) ChangiOl~ market prices
If market prices are constantly changing, difficulties may be experienced in setting the budget.
Movements in the market price which are inconsistent with budget estimates may result in time
consuming renegotiations and perceptions ofunfaimess (Emmanuel & Gee 1982).
2. A less rigorous approach to market based transfer pricing theory
Cook (1955) adopts a more intuitive approach in arguing a case for the utilisation of market prices
in setting transfer prices and his system is ofmore general application than Hirshleifer's. The system
is based on the following two assumptions:
AssumptioDs
1. There is a well developed external market for the intermediate product and divisions are free to
purchase and sell internally or externally, depending on where the greatest profit for them lies.
69
2. In a decentralised system, profitability based performance evaluation systems are expected to
motivate divisional management to maximise divisional profit.
Conditions precedent
The existence ofthe above two assumptions will have the direct consequence ofmaximising group
profit provided precautionary measures are implemented to prevent divisional management from
taking action to increase divisional profit at the expense of group profit. This can be achieved by
applying the following two conditions:
Condition 1
If an opportunity exists to increase divisional profit which will increase group profit then
transfers should take place between divisions.
Condition 2
If an opportunity exists to increase a division's profits but group profit will thereby be
reduced then the divisions should not be compelled to engage in transfer activities.
Compliance with these conditions will ensure that the system will not result in transfers taking
place which reduce group profitability and will encourage transfers which will increase group profits.
As far as the first condition is concerned there is no real problem even if transfers do not take
place between divisions. Ifthe transfer price is based on market price then irrespective ofwhether the
divisions trade with each other or externally, group profit will remain the same (Thomas 1980 135).
Whatever the buying division does not buy internally, it can purchase externally at the same market
price; whatever the selling division does not sell internally it can sell externally at the same price.
It woukl appear that Cook's recommendation that transfers should take place is allowing for
situations where the net prices buyers and seners get in the external market is affected by transactions
costs such as selling and bad debts expenses which would be avoided on internal sales; for he says
70

"this difference is really a reflection ofthe gains ofintegration; ifthere were no difference between
these net prices, there would be no operating advantages to having profit centres in the same
company" (Cook 1955 89).
The actual transfer price if external selling expenses are avoided by trading internally would
be higher than the net selling price to motivate the selling division to sell internally and lower than the
gross market price to motivate the buying division to deal internally. Cook suggests that the exact
price within this range should be the subject ofnegotiation between the two parties. .
The application ofthe second condition is best explained by means ofan example. Assume
the receiving division calculates that it can increase its profits by selling additional units at a lower
price, to be matched by a reduction in input costs. The receiving division may then approach the
supplying division with an offer to buy additional units ofthe intermediate product at a lower price.
From the supplying division's penpective, provided incremental revenues are greater than incremental
costs and it has spare capacity it will supply the incremental units at a lower price. Ifboth divisions
are making a profit and output is expanded it follows that group profit will be increased as a resuh
ofthe transfers.
Assume however that the incremental costs ofthe supplying division exceed the price offered
by the receiving division. In the absence of a compulsion to make the transfer (as the condition
holds), the transfer will not take place. Is this the correct goal congruent decision? Cook attempts to
explain to the reader that it is because group profit will be reduced ifthe transfer does take place but
fails to do so with any degree ofclarity and in fact apologizes to the reader ifhe finds the argument
difficult to follow, saying he can think ofno easy way to explain the point. The fact of the matter is
that the point is rather a simple one and can be explained quite easily by means ofan example.
Example
Two divisions within a group trade with each other. Transfers are recorded at market price, which
is currently RIO per unit for the intermediate product. Additional information can be gleaned by
considering the profit statement as shown in Exhibit 10.
71
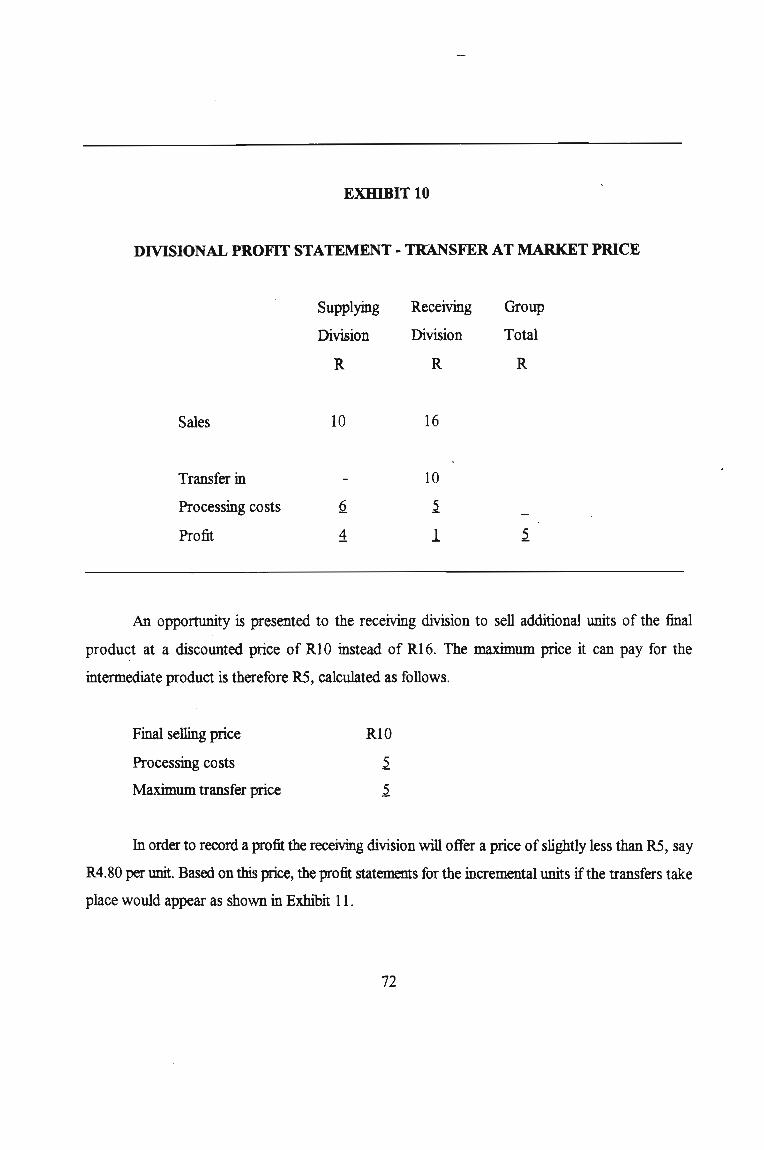
EXHIBIT 10
DIVISIONAL PROFIT STATEMENT - TRANSFER AT MARKET PRICE
Sales
Transfer in
Processing costs
Profit
Supplying
Division
R
10
Receiving
Division
R
16
10
2
1
Group
Total
R
An opportunity is presented to the receiving division to sell additional units of the final
product at a discounted price of RIO instead of R16. The maximum price it can pay for the
intermediate product is therefore RS, calculated as follows.
Final selling price
Processing costs
Maximum transfer price
RIO
2
2
In order to record a profit the receiving division will offer a price of slightly less than RS, say
R4.80 per unit. Based on this price, the profit statements for the incremental units if the transfers take
place would appear as shown in Exhibit 11.
72

EXHIBIT 11
DMSIONAL PROFIT STATEMENT - TRANSFER AT LESS THAN MARKET PRICE
Supplying Receiving Group
Division Division Total
R R R
Sales 4.80 10.00
Transfer in
Processing costs
(Loss)/Profit
4.80
5,00
0,20 (.LQQJ
It is clear from the above profit statement that it is in the interests of the group that the
transfers do not take place since the group would record a loss of RI.OO per unit on the incremental
units. The supplying division for its part would also reject a transfer since it would incur a loss of
RI.20 per unit. Thus if the supplying division is not forced to effect the transfer (as the condition
holds) its actions would result in group profit maximisation.
Looked at from a group perspective the reason why it is correct for the transfer not to take
place centres around the fact that the increase in total revenue (RIO.OO per unit) is less than the
increase in total costs (RI 1.00 per unit).
The specified condition results in goal congruency when group profit is reduced as a result
of the transfer because the supplying division in effect rejects a transfer if the sales ofthe receiving
division are not sufficient to cover the incremental costs ofboth divisions and this in effect is also the
condition for group profit maximisation (Cook 1955 89).
73
A critical appraisal of Cook's market price transfer pricing method
aJ Productivity improvements
Using market based transfer prices motivates the supplying division to reduce its costs as much as
possible and to emphasize innovation and research and development. This will result in improved
productivity (Onsi 1970 535).
b) Non-existence ofa market price
The system is ofvery little value in the case ofa product with no known market price, eg products
made to specification (Fremgen 1970 27-28).
c) Goal congruence
In order to achieve goal congruence market based transfer pricing systems must reliably reflect the
prices that can be realised by seners in the open market. Difficulties are quite commonly experienced
in this respect, for example, ifthe selling division has excess capacity which ifreleased into the open
market would cause a collapse in the price structure, then the current market price is an unreliable
indicator ofmarket value, and ifused could result in incongruous decision making (Cook 1955 89).
d) Diyisional autonomy
Blind adherence to market based transfer prices ignores the possibility that both divisions and the
group might be better offdealing with each other at a price below market value, for example, where
the selling division is working below capacity (Emmanuel & Gee 1982). Thus head office may need
to intervene from time to time to review the situation. Such intervention however detracts from the
principles ofdivisional autonomy (Cook 1955 90).
e) Opportunity costs
Opportunity costs of producing a product relative to other products are accounted for in market
prices which enhances the usefulness of a market based system (Edwards & Roemmich 1976 35).
74

oValue addedMarket price provides an objective measure of value added by each segment of the firm for the
purposes ofperformance evaluation (Edwards & Roemmich 1976 35).
a) Divisional performance evaluation
If the objective of top management is to evaluate the division as an independent company, then
market based transfer prices are a highly effective and objective means of achieving this (Fremgen
197027).
h) Internal samis
There is a tendency for market prices to be reduced by discounts to reflect savings on promotion and
selling costs on internal sales. Theoretically this constitutes a departure from the market price basis.
Furthermore, if division managers truly have discretion regarding sources of supply and customers
it is questionable whether promotion and selling efforts are necessarily reduced on interdivisional sales
(Fremgen 1970 28).
2.11 NEGOTIATED PRICE MEmOD .
Fremgen (1970) is of the opinion that the negotiated price method is "the basis for transfer pricing
that is most valid for a truly decentralized firm" (Frem.gen 1970 28). Under this method the buying
and selling divisions negotiate a price with each other on the basis that they are independent firms out
to get the best deal for themselves regardless ofthe consequences ofthe deal on the opposite party.
Such a system can only function ifboth divisions have the authority to deal internally or externally
as they wish. Ifthe divisions cannot deal externally the system becomes a farce. The basic premise
underlying a negotiated transfer pricing system is that all prices at a macroeconomic level are the
result ofa negotiation process, whether tacit or explicit. Just as market- forces result in the efficient
allocation ofresources in the economy so too will negotiated prices result in the efficient allocation
ofresources within a divisionalised company. In this way goal congruence will be achieved.
75

De effect of DeJ0tjatioD wheg theR is a knowg market price
Where a market price exists for the intertDec:tiate product and the supplying division is operating under
conditions offun capacity, then it is unlikely that it would be willing to accept a transfer price below
current market value. The buying division would also realise that it would be a waste ofenergy on
its part to attempt to negotiate a price below market value. Thus there is very little scope for
negotiation in these circumstances and if interdivisional transfers took place they would occur at
prevailing market value.
If the supplying division is operating below run capacity however, then it would be willing
to sen additional units to the receiving division provided that it received a price in excess ofmarginal
cost. Any units sold above marginal cost (and below the price per unit from an ahemative source of
supply) will result in an increase in divisional and group profit. In these circumstances the buying
division would be willing to negotiate as it would fancy its chances ofsecuring a price below CUITent
market value and as close to marginal cost as possible. Thus the actual transfer price will lie
somewhere between marginal cost and market price and the negotiated settlement would be beneficial
to the buying division, the selling division and the group as a whole.
De effect of g_tiatiog "heg theR is DO known market price
Where there is no market price for the intermediate product the minimum transfer price will have to
be the marginal cost ofthe supplying division. The extent to which the actual transfer price lies above
the minimum will be a function ofthe negotiating process and there is no reason why this process
between the two divisions should be any. less efficient than ordinary negotiations. between two
independent contractors. If later on the buyer or sener experiences difficulties in covering its costs
and wishes to re-negotiate then this is an indication ofthe lack ofbargaining skills on the part of the
party concerned rather than any inherent deficiency in a negotiated transfer pricing system.
76

A critical appraisal of the negotiated transfer pricing method
a) Pressure on management time
It has been argued that negotiations are too time-consuming and wasteful ofmanagement's resources.
However it is unclear as to why they should be considered more time consuming than normal
negotiations between two independent contractors (Fremgen 1970 31).
However the fact cannot be ignored that prices under other transfer pricing methods are more
readily and objectively determinable.
b) Personality conflicts
Personality conflicts may override the negotiation process. Again it is unclear as to why the transfer
pricing system should be afllicted worse than normal ext~ bargaining situations (Fremgen 1970
31). In fact Spicer (1988) suggests that "contrary to the impression given in much ofthe literature
on transfer pricing, conflicts over internal transfers or transfer prices can have a control purpose and
are not necessarily dysfunctional. If properly managed, disputes can provide a means whereby
corporate managers acquire critical, local information about internal transfers and their alternatives."
c) Divisional performance evaluation
An argument against negotiated prices is that the profits of a division may be reflective of the
negotiating skills ofthe parties rather than their operational skills. However one wonders whether this
is necessarily a deficiency since the ability to negotiate with external parties is a characteristic of a
good manager. Thus to the extent top management wishes to evaluate the division as an independent
company negotiated transfer prices are appropriate (Fremgen 1970 31).
d) Applicability
Negotiated transfer prices are not appropriate for a highly centralised corporation which may have
limited interdivisiona1 trading (Fremgen 1970 31).
77

e) Goal CODiJllence
Edwards & Roemmich (1976 36) present an illustrative example to demonstrate that negotiated prices
do not always resuh in goal congruence. Let us consider their example.
Example
Assume the receiving division markets two products, A & B. Details ofthe individual products are
as follows:
Product A ProductB
R R
Final selling price 12.00 14.50
Supplying division variable costs (3.25) (2.75)
Additional processing costs in
receiving division (UQ) (l.,W
Group contribution margin . ..2..ll UQ
Machine hours per unit (supplying division)
Group contribution per machine hour
Demand constraint
4 hours
Rl.5625
30000 units
5 hours
R 1.70
26000 units
Given that machine hours are limited to 200 000 hours the optimal production mix from a
group perspective is to manufacture 26000 units ofProduct Band 17 500 units ofProduct A This
will yield a contribution ofR330 375 [(26000 • R8.50) + (17 500 • R6.25)].
Assuming the divisions negotiate a transfer price of R8.00 and RlO.OO for intermediate
Product A and intermediate Product B respectively, per unit profit from the receiving division's
perspective is calculated as follows:
78
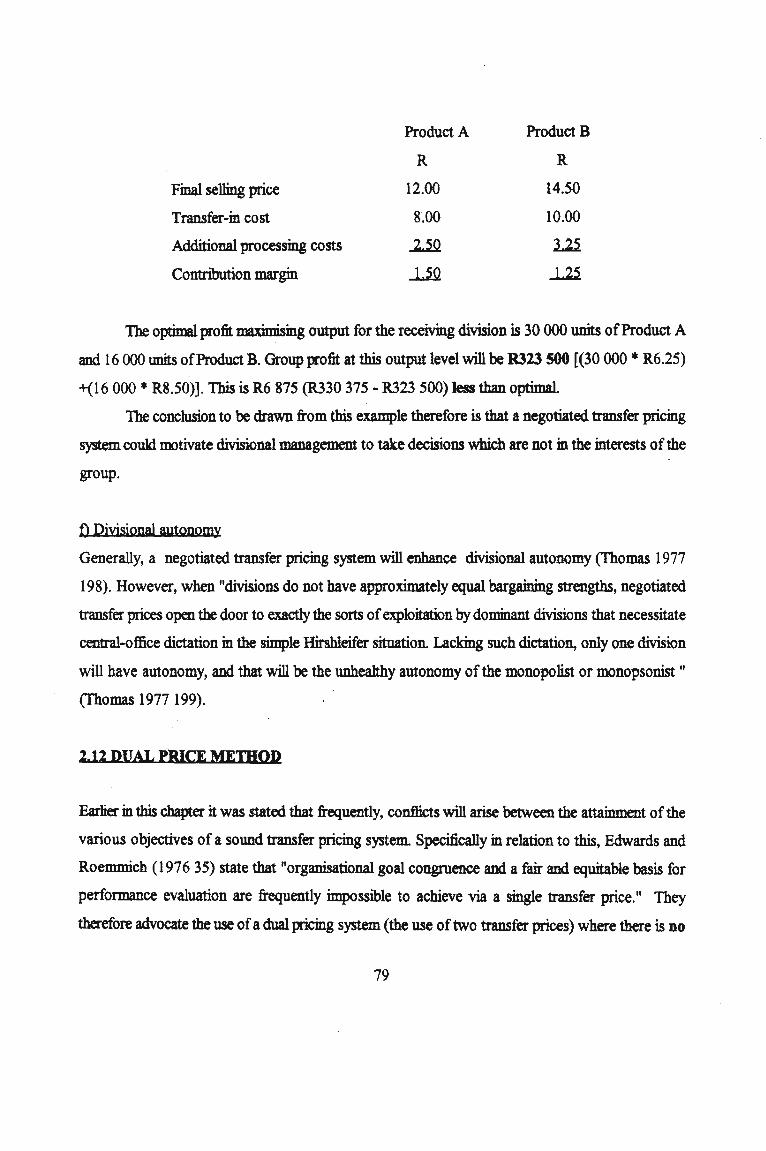
Product A ProductB
R R
Final selling price 12.00 14.50
Transfer-in cost 8.00 10.00
Additional processing costs ..UQ Ui
Contribution margin J..S.Q ..us.
The optimal profit maximising output for the receiving division is 30 000 units ofProduct A
and 16000 tmits ofProduct B. Group profit at this output level will be R323 SOO [(30 000 • R6.25)
+(16000 • R8.50)]. This is R6 875 (R330 375 - R323 500) less than optimal.
The conclusion to be drawn from this example therefore is that a negotiated transfer pricing
system could motivate divisional management to take decisions which are not in the interests of the
group.
1) Divisional autonomy
Generally, a negotiated transfer pricing system will enhance divisional autonomy (Thomas 1977
198). However, when "divisions do not have approximately equal bargaining strengths, negotiated
transfer prices open the door to exactly the sorts ofexploitation by dominant divisions that necessitate
central-office dictation in the simple Hirsbleifer situation. Lacking such dictation, only one division
will have autonomy, and that will be the unheahhy autonomy ofthe monopolist or monopsonist "
(Thomas 1977 199).
2,12 DUAL P1UCE METHOD
Earlier in this chapter it was stated that frequently, conflicts will arise between the attainment of the
various objectives of a sound transfer pricing system Specifically in relation to this, Edwards and
Roemmich (1976 35) state that "organisational goal congruence and a fair and equitable basis for
performance evaluation are frequently impossible to achieve via a single transfer price." They
therefore advocate the use ofa dual pricing system (the use oftwo transfer prices) where there is no
79
external market for the intermediate product. (They acknowledge the merits of a single transfer price
based on market values where an external market does exist for the supplying division's product).
Under a dual pricing system the supplying division is evaluated on a basis different from the receiving
division, whilst not losing sight of the prime objective of overall group profit maximisation.
The receiving division
The intermediate product should be costed out to the receiving division at incremental cost."Since
the receiving centre is then evaluated based upon total selling price minus incremental costs for the
entire organization, the receiving centre thus accrues all of the profit from the processing ofa good"
(Edwards & Roemmich 1976 37). As "this system of transfer pricing results in all of the
organisational profits accruing to the last processor ofa good.... this has the highly desirable effect
ofrnotivating the receiving centre to act in a manner consistent with organisational goals" (Edwards
and Roemmich 1976 37). Thus using incremental cost will cause the receiving division to take
decisions which maximise its own profits and concurrently result in group profit maximisation.
The supplying division
The principal difficulty in using an incremental cost transfer pricing system from the supplying
division's perspective is that it will not realise a contribution from intracompany sales and, in the
absence of external sales, will always report a loss equivalent to its fixed costs. Accurate divisional
performance evaluation is therefore not possible and there is no incentive for the supplying division
to necessarily take goal congruent decisions. In order to facilitate fair divisional performance
evaluation and to motivate the supplying division to take goal congruent decisions Edwards &
Roemmich (1976) suggest that the supplying division should be classified as a cost centre and
evaluated based on its ability to match actual costs with predetermined standards. "This encourages
the supplying centre to produce the inputs required by the receiving centre at the lowest possible
costs for a given standard ofquality. In this manner the efforts ofthe supplying centre to maximise
its performance rating will be consistent with the maximisation oforganisational profit" (Edwards &
80

Roemmich 1976 37).
Thus from the supplying division's perspective transfer price is effectively set at standard cost
as its "profit" for performance evaluation purposes is as fonows:
Profit =Standard cost - actual cost
The dual transfer pricing system that is suggested therefore is the use ofan incremental cost
transfer price from the perspective of the receiving division and standard cost as the effective
transfer price from the perspective ofthe supplying division.
Edwards and R.oemnDcb caution however that, though the use ofan incremental cost transfer
price has the desirable effect ofmotivating the receiving division to act in a goal congruent manner,
efficiencies and inefficiencies of the supplying division are also passed on to the receiving division.
For cost control evaluation purposes therefore, they recommend that the receiving division shoukl
also be evaluated based on the standard cost ofwork done in the division itself.
A critical appraisal of the dual price transfer p"cine method
a) The accountina information sYstemA dual transfer pricing system does not filcilitate the preparation of consolidated financial statements.
Since the cost ofone division does not equal the revenue ofanother division contra accounts will not
be eliminated entirely. Thus two sets of accounts will have to be maintained, one for divisional
performance evaluation and the other for external reporting purposes.
b)PnnnotiQnofdtici~
The system enhances the promotion ofefficiency. Because the revenue of the supplying division is
limited to standard cost the supplying division is encouraged to "operate as efficiently as possible in
order to produce a favourable variance" (Vendig 1973 35).
C() Settin& ofstandards
The setting of standards for the supplying division may prove problematical. "Standard setting
involves some guesswork, and standards are easily manipulated" (Benke & Edwards 198071).
81

2,13 MATHEMATICAL PROGRAMMING MEmODS
The application ofmathematical programming techniques to solving transfer pricing problems arose
as a resuh of the shortcomings of the marginal cost transfer pricing models to deal with multiple
division, multiple product, decentralised scenarios (Abdel-khalik and Lust 1974 15).
Baumol and Fabian (1964) discuss the application ofthe decomposition procedure in solving
decentralisatio problems. The oijective ofthis section however is not to delve into the mathematical
intricacies underlying the application of this procedure for whilst "it's vital that mathematical
programming approaches be developed rigorously...once others have done so, it is equally vital to
explore these methods' key properties (and the main issues to which they give rise) without getting
tangled in the sorts ofdetail that have been the besetting sin ofmuch recent literature" (Thomas 1977
167).
The procedure in general terms
The procedure could begin with head office tentatively specifying appropriate transfer prices (Thomas
1977 172). Given these transfer prices, divisions are required to specify production plans with the
objective ofmaximising divisional profits. These production plans are then forwarded to head office.
Head office will review the plans for a possible lack ofgoal congruence and adjust transfer prices
accordingly. Divisions will be informed ofthese new transfer prices and will once again be asked to
specify optimal production plans. These plans will again be forwarded to head office where they will
once again be reviewed for goal congruence and so the procedure continues. After a number of such
iterations divisions will eventually specify a production plan which, subject to head office's last
specifications, will maximise divisional profit and simuhaneously maximise group profit.
A critiq1apppiul of the matbcmltjqJ programmjDg tpnsfer pricing methods
A) Divisional autonomy
The method appears to be participatory. The fact of the matter however is that divisional autonomy
82

is merely an illusion for in the final analysis decision making is essentially centralised. ''The last phase
of the process is usually dictated by central management" (Watson & Baumler 1975408). In fact
decomposing decision making to divisional level on the basis ofhead office spedOeatioDS appears
to be an exercise in futility. Head office might just as wen have specified resource allocations at the
outset.
b) Cbeatini
The system is as suscepttble to cheating as the marginal cost system (Abdel-khalik & Lusk 1974 20).
s<) Divisional perfonpance evabmtion
Changes in the efficiencies ofother divisions (or some other divisional action) including divisions with
which one does not trade, has the effect of affecting profits ofother divisions (Thomas 1980 182).
As explained earlier, this is not conducive to fair divisional performance evaluation.
2.14 PURPOSE BASED METHOD
It is perhaps appropriate to conclude the review and evaluation ofdifferent transfer pricing.systems
by considering a very sober document written by Bierman as far back as 1959. In this article Bierman
displays no pretences about solving the transfer pricing dilemma by applying an all inclusive method,
but in fact argues that different transfer pricing systems are appropriate to different circumstances.
The choice of method is dependent upon the purpose to which the accounting information will be
applied. In a decentralised setting divisional financial reports are utilised for the fonowing pmposes:
1) divisional performance evaluation
2) decision making3) input to the preparation of external financial statements.
Fnlfilling these different pmposes caDs for the application ofdifferent transfer pricing systems.
83

1. Divisional performance evaluation
Bierman (1959430-431) suggests a dual transfer pricing system be used if the objective is to evaluate
divisional performance. Revenues attributed to the supplying division are to be determined on a
different basis from the buying cost ofthe transferred product to the receiving division.
Supplying division
Ifdivisional financial reports are to be used as a basis for assessing divisional managerial performance
then the revenues generated by the selling division from the transferred product should be based on
market prices. These prices best reflect the conditions that divisional managers would be faced with
if they were operating an independent company and therefore form a sound objective basis for
evaluating managerial performance (Bierman 1959 30).
This method is not without its problems however. Bierman identifies the following as being
problematical in using market based transfer prices to suit this purpose:
1. The determination of the external market price could become clouded
by issues such as special payment terms (Bierman 1959 431).
2. If the selling division saves on selling expenses to what extent should this benefit
be shared between the buying and selling divisions? (Bierman 1959 431).
3. The determination ofprice when there is no external market for the product of the
supplying division. In this case the suggestion is that the price should be determined
by negotiation (with its attendant problems as previously discussed) or failing that then
by head office arbitration (Bierman 1959 431). Naturally the latter course impairs
divisional autonomy.
Receiving division
The suggestion by Bierman (1959431) is that purchases of the intermediate product by the receiving
84

division should be recorded at the marginal cost of the supplying division. This would fulfil, he
states, one ofthe conditions necessary to motivate the selling division to optimise its output. Bierman
does not explain this point in any detail and one can perhaps deduce the logic behind this suggestion
based on a contrast between perfectly and imperfectly competitive intermediate markets.
Ifthe external market for the intermediate product is perfectly competitive then the marginal
cost of the supplying division will equal the external market price (for it will not expand output
beyond the point of intersection ofthe marginal revenue and marginal cost curves). This effectively
results in a single transfer price for both divisions based on market prices where the intermediate
market is perfectly competitive.
Ifhowever the external intermediate market is imperfectly competitive then market price and
marginal cost would not coincide (market price would lie above marginal cost). Presumably Bierman
is catering for this circumstance by specifying the use ofmarginal cost instead ofmarket prices as the
general rule. This situation was also considered by Hirshleifer. Whereas Hirshleifer suggested that
both buying and supplying divisions should use marginal cost Bierman suggests the supplying
division use market price (presumably to fully reflect the gains it would realise if it were granted the
autonomy to capitalise on its monopolistic position in the imperfectly competitive external market)
and the buying division should use marginal cost otherwise its output would be suboptimal from a
group perspective. This has the dual effect of enhancing the autonomy and performance evaluation
of the supplying division and preserving organisational goal congruence.
2. Decision makina purposes
Differentialrevenues and differential costs are always relevant for decision making purposes. Thus
the transfer pricing system should provide information on the costs added to the product as it is
transferred from division to division. For this purpose it would seem that a transfer pricing system
based on marginal or incremental cost would be most appropriate (Bierman 1959 431).
. 85

3. External (mantial reportina
In terms ofGenerally Accepted Accounting Practice inventory should be valued at full manufacturing
cost. An absorption costing transfer pricing system should therefore be used for this purpose.
A critiCal appraisal of the purpose based transfer pricina method
Practical awlicatioD
It is interesting to note that what Bierman is in fact propagating is the concept ofdifferent costs for
different purposes. Whilst the practicalities of his suggestions made in 1959 would have been
questionable then, interesting parallels can now be drawn between his system and the recent
popularity of activity based costing systems.
In their book "Relevance Lost - The Rise and Fall ofManagement Accounting" Johnson &
Kaplan (1987) argue that management accounting systems have become subservient to the needs of
external reporting. Traditional cost accounting they argue was based on information that was too
highly aggregated to be of any use for decision making purposes. They advocate the use Ofactivity
based costing which is based on a more detailed analysis ofoverhead expenses. They explain further
that they have no quarrel with the use of traditional cost accounting systems for external reporting
purposes and in fact advocate the use oftwo costing systems, one for internal reporting and one for
external reporting purposes. Whilst such a suggestion would have been laughed offhalf a century ago
as being prohibitively expensive to maintain, such an argument no longer holds they state, in view of
the dramatic reduction in information processing costs which have occurred in recent years.
A similar argument could be put forth in support of a purpose based method of transfer
pricing. Since three different transfer pricing systems are called for by Bierman a division could be
called upon to produce three different sets offinancial reports, with each set being used for a different
purpose.
86

2.15 CONCLUSION
In this chapter various transfer pricing theories were analysed and evaluated. It is evident that no
single transfer pricing method can be classified as being universally applicable to suit all
circumstances. This is because too many different types of decisions are likely to be based on a
particular chosen method and in too many different circumstances. Each method has its advantages
and disadvantages, depending on the circumstances (Thomas 1980212).
87

2.16 REFERENCES
Abdel-Kbalik, A Rasbad and Edward J. Lusk. 1974. Transfer Pricing-A Synthesis. The ACCQUotina
Review 49 (January):8-23.
Baumol, WtlHam 1., and Tibor Fabian. 1964. Decomposition, Pricing for Decentralization and
External Economies. Mangement Science 11 (September): 1-32.
Benke, Ralph L.,Jr., and James Don Edwards. 1980. TrAQVer Pricin& . TecbniQJles and Uses. New
York: National Association ofAccountants.
Bierman, Harold, Jr. 1959. Pricing Intracompany Transfers. The ACCQUntina Review 34 (July): 429
432.
Cook, Paul W. 1955. Decentralization and the Transfer-Price Problem. Journal Qf Business 28
(April): 87-94.
Edwards, 1. Don, and RQger A Roemmich. 1976. Transfer Pricing: The Wrong Tool fQr Performance
EvaluatiQn.CQst and Manaaement 50 (January - February): 35-37.
Emmanuel, C.R. and Kenneth P. Gee. 1982. Transfer pricing: a fair and neutral procedure. In
Readinp in Accountina fQr MJmaFnent Control. Emmanuel, Odey and Merchant (editors). London:
Chapman & Hall.415-424.
Engler, Calvin.1987. Manaprial ACCOUIltina.705. HQmewood, m.:Irwin.
Fremgen, James M. 1970. Transfer Pricing and Management Goals. M30liement Accountina
(D.S.A) 52 (December): 25-31.
88
Goetz, Billy E. 1967. Transfer Prices: An Exercise in Relevancy and Goal Congruence. ~
Accountina Review 42 (July):435-440.
Gordon, M)Ton 1. 1970. A Method ofPricing for a Socialist Economy. The Accounting Review 45
(Ju1y):427-443.
Hirshleifer, Jack. 1956. On the Economics ofTransfer Pricing. Journal ofBusiness 29 (July): 172
184.
Hirshleifer, Jack. 1964. Internal Pricing and Decentralized Decisions. In M8.Il8iement Controls: New
Directions in Basic Research. Bonini, Jaedicke, and Wagner (editors). New York: Mc Graw Hill,
Inc.27-37.
Holstrum, Gary L., and E. H. Sauls. 1973. The Opportunity Cost Transfer Price. Management
Accounting (US.A) 54 (May):29-33.
Johnson, H.T. and Kaplan, R.S. 1987. Relevance Lost: the Rise and Fall ofManagement Accounting.
Boston: Harvard Business School Press.
Ons~ Moharned. 1970. A Transfer Pricing System Based on Opportunity Cost. The Accounting
Review 45 (July):535-543.
Solomons, David. 1965. Divisional Perfonnance : Measurement and Control. Homewood, 1ll.:Irwin.
Spicer, B.H. 1988. Towards an organizational theory of the transfer pricing process. In Readings in
Accounting for MaIlaiernent Control. Ernrnanuel, Otley and Merchant (editors). London: Chapman
& Hall.425-452
Tang, Roger YW. 1979. Transfer Pricing Practices in the United States and Japan. New York:
89

Praeger.
Thomas, Arthur L. 1980. A Behavioural Analysis of Joint-Cost Allocation and Transfer Pricing.
Champaign, ill : Stipes Publishing Company.
Vendig, Richard E. 1973. A Three-Part Transfer Price. Management Accounting (D.S.A.) 55
(September):33-36.
Watson, D.J.H. and John V. Baumler. 1975. Transfer pricing: a behavioural context. In Readings
in Accounting for Manaiement Control. Emmanuel, Otleyand Merchant (editors). London: Chapman
& Hall. 403-414.
90

CHAPTER 3
A REVIEW OF RECENT EMPIRICAL STUDIES INTO TRANSFER PRICING
PRACTICES
3.1 A SUMl\lARY OF RECENT EMPIRICAL STUDIES INTO TRANSFER PRICING
PRACTICES
In this chapter some recent empirical studies covering domestic transfer pricing practices are
discussed. Table 3.1 contains a summary ofthe studies to be analysed. This analysis will serve as
a framework for formulating the empirical research design and methodology strategies for the
current study and for identifying issues to be investigated. The latter will be discussed in more
detail in chapter 4.
Table 3.1 Summary of recent empirical studies covering domestic transfer pricing practices
Country Research method
Finnie (1978) United Kingdom Questionnaire
Choudhury (1979) United Kingdom Questionnaire
Tang (1979) United States and Japan Questionnaire
Wu & Sharp (1979) United States Questionnaire
Benke & Edwards (1980) United States Interview
Borkowski (1988) United States Questionnaire
Geboers~ et al (1989) . South Africa Questionnaire
Tang (1993) United States Questionnaire
Source: Adapted from Grabski.1985. Transfer pricing in complex organizations in Readings in
Accountingfor Managerial Control. Emmanuel, Otley and Merchant (editors)~ London:
Chapman & Hall; 493-495; and author additions.
91
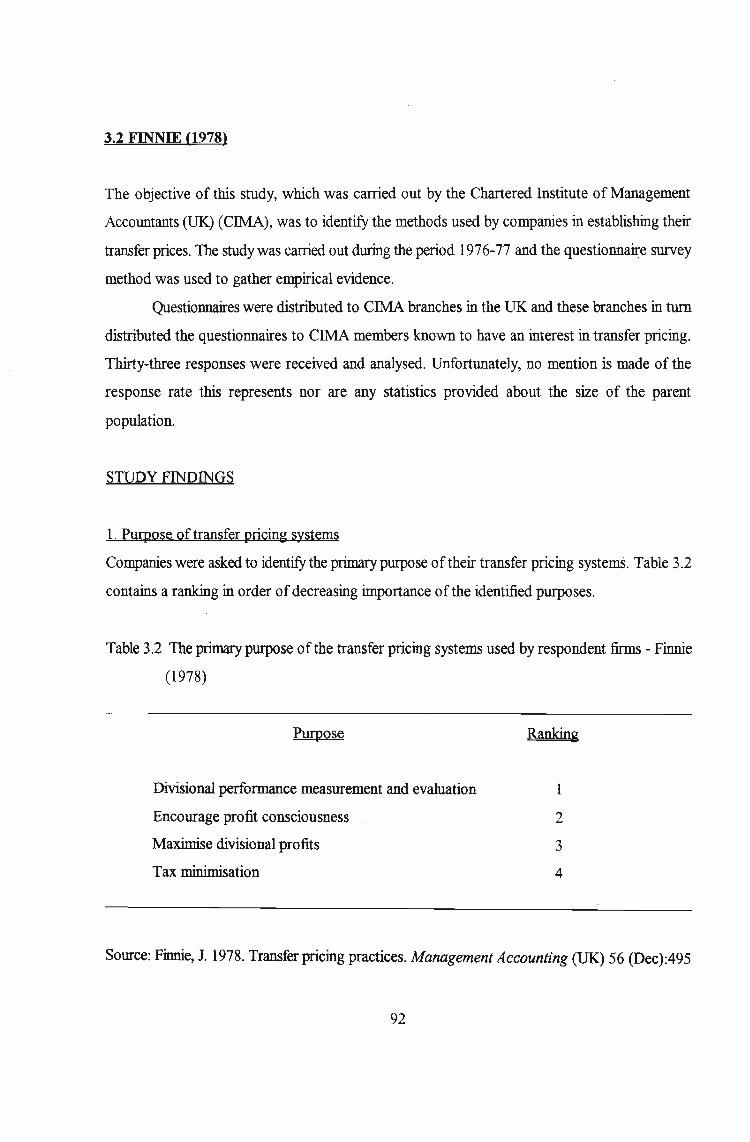
3.2 FINNIE (1978)
The objective of tbis study, wbich was carried out by the Chartered Institute of Management
Accountants (OK) (CIMA), was to identify the methods used by companies in establishing their
transfer prices. The study was carried out during the period 1976-77 and the questionnaiJ:e survey
method was used to gather empirical evidence.
Questionnaires were distributed to CIMA branches in the UK and these branches in turn
distributed the questionnaires to CIMA members known to have an interest in transfer pricing.
Thirty-three responses were received and analysed. Unfortunately, no mention is made of the
response rate tbis represents nor are any statistics provided about the size of the parent
population.
STUDy FINDINGS
1. Purpose of transfer pricing systems
Companies were asked to identify the primary purpose oftheir transfer pricing systems. Table 3.2
contains a ranking in order ofdecreasing importance of the identified purposes.
Table 3.2 The primary purpose of the transfer pricing systems used by respondent firms - Finnie
(1978)
Purpose
Divisional performance measurement and evaluation
Encourage profit consciousness
Maximise divisional profits
Tax minimisation
Ranking
2
3
4
Source: Finnie, 1. 1978. Transfer pricing practices. Management Accounting (OK) 56 (Dec):495
92

As evidenced by the high ranking of divisional performance evaluation, it would appear
that transfer pricing, as a mechanism for establishing control over divisional management, is
considered most important (Finnie 1978 496). The low ranking afforded to tax minimisation is
also noteworthy.
2. Disadvantages of transfer pricing systems
Companies were asked to indicate the disadvantages and problems associated with their transfer
pricing systems. The most frequently cited problem was the difficulty in achieving goal
congruence (divisions emphasising their own profitability at the expense of group profit) followed
by lengthy disputes over transfer prices.
3. Procedures for establishing transfer prices
The study classifies the procedures (methods) used for establishing transfer prices into three
categories: centrally established prices, standard cost plus mark-up and negotiated prices. The
distribution amongst these three categories is summarised in Table 3.3.
Table 3.3 Transfer pricing procedures (methods) used by respondent :firms - Finnie (1978)
Method . ~
Centrally established price 44
Standard cost plus mark-up 28
Negotiated prices ..2..8.
100
Source: Finnie, 1. 1978. Transfer pricing practices. Management Accounting (UK) 56 (Dec):495
Unfortunately the study does not provide details about the nature of the centrally
determined prices. (They could for example be marginal cost prices or some of the suggested
theoretically correct prices discussed in chapter 2). One therefore cannot assess the degree ofnon
compliance with theory except to conclude that the spread between the three categories indicates
93

that companies do not perceive there to be a single correct transfer pricing method. To the extent
that academicians have been prone to suggesting some oftheir methods as being the most correct,
one could conclude that their is a divergence from theory of practice.
A further interesting point revealed by the study is that it would appear there is a strong
association between the use of centrally determined prices and the high level of complaints
relating to the lack of goal congruence of transfer pricing systems (implying the need for central
office intervention). There also appears to be a strong association between the use ofnegotiated
prices and the frequency of complaints relating to the susceptibility of transfer pricing systems
to lengthy price disputes. Thus some of the shortcomings of transfer pricing systems which were
discussed in chapter 2 are manifested in the findings of this study.
3.3 CHOUDHURY (1979)
The objective ofChoudhury's study was to review the findings ofa 1971 study into the transfer
pricing practices ofBritish corporations. The original study was conducted by Rook on behalf of
the British Institute of Management. 293 companies replied to a mail questionnaire survey
conducted by Rook and 193 of the respondents indicated that they employed a transfer pricing
system.
STUDy FINDINGS
1.Transfer pricini methods used by respondent firms
The transfer pricing methods used by the respondents is summarised in Table 3.4. It is evident
from this table that a variety of transfer pricing methods are used in practice, with the balance
tilted in favour ofthe use ofnon-cost oriented methods. Although 54% ofall the companies used
a market based approach more than half of these (60%) found it necessary to make some
adjustment to market price in order to account for idle capacity or selling expenses (Chondhury
1979 106). This would tend to suggest that the Hirshleifer (unadjusted ) market price model is
oflimited practical application.
In an accounting sense, variable cost is the closest approximation to Hirshleifer's concept
ofeconomic marginal cost transfer prices (Tang 1979). Only 2 % ofcompanies however utilised
94

Table 3.4 Transfer pricing methods used by respondent firms - Choudhury (1979)
Pricing methods
Cost-oriented methods:
Actual or standard variable cost
Actual or standard full cost
Full-production cost (actual or
std)+fixed mark-up
Full-production cost (actual or
std)+negotiated mark-up
Non-cost-oriented methods:
Market price
Market price less a fixed %
Market price less a negotiated %
Total all methods
46%
2%
17 %
20%
7%
54%
22%
16 %
16 %
100%
Source: Adapted from Choudhury, N. 1979. Transfer pricing practices: room for debate.
Accountancy (England) 90 (August): 105.
95

variable cost transfer prices. Furthermore 17% of companies utilised full cost transfer prices.
None ofthe suggested theoretically correct transfer pricing methods discussed in chapter 2 come
out in support for the use of full cost transfer pricing for management control purposes (other
than Vendig'stwo-part system which separates fixed and variable costs). Unless these divisions
were classified as cost centres this would represent a divergence of practice from theory.
Unfortunately companies did not provide reasons for the use of full cost so that one cannot draw
a conclusion in this respect.
3.4 TANG (1979)
Tang identified the primary objective ofhis study as being to "identify, measure, and explain the
similarities and differences in transfer pricing practices of selected industrial companies in the
United States and Japan" (Tang 1979 3). In particular his objective was to compare and contrast
the transfer pricing methods, transfer pricing objectives and other transfer pricing policies and
procedures used by companies in these two countries.
Another specific objective ofTang's study was to "discover the extent of application of
the decomposition method and other mathematical programming approaches among the large
corporations in Japan and the United States. These methods have been explored by many writers
since the early 1960s. Large corporations would most likely have the facilities to implement these
sophisticated techniques" (Tang 1979 4).
Tang used 1976 directory lists ofthe 1000 largest U.S. and 1121 largest Japanese mining
and industrial firms (ranked according to sales value) to identify the population to be tested. For
the purposes of the full-scale study, which was carried out during 1977, questionnaires were
mailed to 300 U.S. companies and 369 Japanese companies. He achieved aresponse rate of 51
% among the U.S. firms and 30 % among the Japanese firms.
STUDY FINDINGS
1, The extent gfus gftransfer ~rices
92 % ofU.S. companies and 73% ofJapanese companies indicated that they used transfer pricing.
The main reason Why companies did not use transfer pricing was because they considered the
96

volume of interdivisional transfers to be insignificant.
2. Transfer pricing objectives
Companies were asked to indicate the single most important or dominant objective of their
transfer pricing systems. Table 3.5 reflects the frequency with which particular objectives were
identified as dominant objectives.
Table 3.5 Dominant transfer pricing objectives ofUS. and Japanese companies - Tang (1979)
Objective lLS.,. Japan
Maximise group profit 41 % 42%
Divisional performance evaluation 42% 38 %
Other 17% 20%
100% 100%
Source: Tang, Roger Y W. 1979. Transfer pricing Practices in the United States and Japan.
New York: Praeger.91.
There is' no discernible difference between the popularity of goal congruence and
performance evaluation as dominant transfer pricing objectives. The promotion of divisional
autonomy was not mentioned by any ofthe companies. However this could relate to a problem
in the framing ofthe questionnaire since it was not listed as an objective and it would have been
left up to the respondents to identify this separately.
3 Number of domestic transfer pricing methods used
It is interesting to note that a large proportion of companies (44 % V.S. and 42 % Japanese)
actually used more than one transfer pricing method. This is perhaps indicative of the lack of
universal applicability of a particular transfer pricing method, as was concluded at the end of
chapter two. It could also indicate a divergence of opinion between theoreticians who hold there
is a single correct transfer price and transfer pricing practitioners who find it necessary to apply
more than one transfer pricing method.
97

4, Types of domestic transfer pricing methods used
The transfer pricing methods used by the respondent firms for domestic interdivisional transfers
is summarised in Table 3.6.
This table reflects a fairly even spread between the use of cost and non-cost-oriented
transfer pricing methods, with standard full-production cost and full-production cost plus some
allowance for profit being the more frequent cost-oriented transfer pricing methods used. Market
price (or some variation thereof) is the most frequently used non-cost-oriented transfer pricing
method.
5 Dominant domestic transfer pricing methods used
The statistics in Table 3.6 include companies that used more than one transfer pricing method.
Companies that used more than one transfer pricing method were also asked to indicate the
dominant or most important method used. The results are summarised in Table 3.7.
The exclusion of supplementary transfer pricing methods from the statistics indicates that
U.S. companies consider cost-oriented transfer pricing methods more important than non-cost
oriented methods. No such shift in emphasis is discernible among Japanese firms.
The overall use of marginal cost transfer prices (or their accounting approximations of
actual/standard variable cost) is fairly sparse. Not a single U.S.firm used mathematical
programming prices whilst only one Japanese firm used a mathematical programming price as a
supplementary method (the programming method actually used in this case was far simpler than
the decomposition procedure described in chapter two). These findings are particularly
disconcerting and led Tang to conclude that "there seems to be a gap between the concepts
advocated by many writers and those ofpractitioners with respect to the use of transfer prices.
The concepts of marginal cost and opportunity cost, the decomposition procedure, and other
programming methods have been advocated by many authorities in the past. However, the
acceptance of these concepts or methods among large industrial firms in the United States and
Japan appears to be minima]" (Tang 1979 64).
The high level of usage of full-production cost transfer prices also deserves some
comment. None ofthe classic theories discussed in chapter two support full-cost transfer prices
(other than Vendig's two-part system which separates fixed and variable costs). Thus, unless
divisions are classified as cost centres the high level of usage of full-cost transfer prices among
98

Table 3.6 Domestic transfer pricing methods used by respondent firms - Tang (1979)
Pricin~ methods
Cost-oriented methods:
V.S.
50%
Japan
46%
Actual variable production cost 0% 0%
Actual full-production cost 9% 9%
Standard variable production cost 3% 1%
Standard full-production cost 17% 15 %
Actual variable production cost +
lump-sum subsidy 1% 1%
Full-production cost (actual or
std)+some allowance for profit 19 % 20%
Other cost-oriented methods 1% 0%
Non-cost-oriented methods: 50% 54%
Market price 22% 18 %
Market price less selling expenses 8% 16 %
Negotiated price 18 % 19 %
i Mathematical programming price 0% 1%
Other non-cost-oriented methods 2% 0%
Total all methods 100% 100%
Source: Tang, Roger Y W. 1979. Transfer Pricing Practices in the United States and Japan.
New York:Praeger.61.
99

Table 3.7 Dominant transfer pricing methods used by respondent firms - Tang (1979)
Pricing methods
Cost-oriented methods:
U.S.
56%
Japan
47%
Actual variable production cost 0% 0%
Actual full-production cost 8% 11 %
Standard variable production cost 2% 2%
Standard full-production cost 20% 18 %
Actual variable production cost +
lump-sum subsidy 1% 1%
Full-production cost (actual or
std)+some allowance for profit 24% 15 %
Other cost-oriented methods 1% 0%
Non-cost-oriented methods: 44% 53 %
Market price 21 % 16 %
Market price less selling expenses 8% 23 %
Negotiated price 13% 14%
Mathematical programming price 0% 0%
Other non-cost-oriented methods 2% 0%
Total all methods 100 % 100 %
Source: Tang, Roger Y W. 1979. Transfer Pricing Practices in the United States and Japan.
New York:Praeger.62.
100

both US. and Japanese companies could represent a divergence of practice from theory.
6 The influence ofnationality on the choice of transfer pricing method
Tang conducted statistical tests to establish whether the extent of use of cost-oriented or non
cost-oriented domestic transfer prices among large US. and Japanese industrial companies differs
according to the nationality of these companies. The results of the statistical tests indicated that
there is no significant association between nationality and the choice of transfer pricing method,
ie. "the orientation of the domestic transfer prices of Japanese firms is not significantly different
from that of the US. firms" (Tang 1979 70).
7, The influence of company size on the choice of transfer pricing method
Tang conducted statistical tests to establish whether there is a significant association between
company size and the choice of transfer pricing method. The results of the tests are somewhat
contradictory. In the case ofUS. companies it was found that there is no significant relationship
between size and the type of transfer price used. However in the case ofJapanese companies it
was found that there is a significant relationship between the size of Japanese firms and the
orientation of the transfer price used. The actual conclusion drawn by Tang was that "the larger
the size ofthe Japanese company, the more likely will be the use ofa non-cost-oriented domestic
transfer price" (Tang 197973).
.It would thus appear that in the case of Japanese companies the larger the size of the
company, the more likely it is to use a non-cost-oriented transfer pricing method whereas in the
case ofU.S. companies one cannot estimate the likelihood ofthe transfer pricing orientation on
the basis of size.
8. The authority for detennining transfer pricing policy
24% of D.S. companies and 35% of Japanese companies allowed the divisional executives
complete freedomin determining transfer pricing policies. The balance of the companies had some
head office involvement in the determination oftheir transfer pricing policies. Thus it appears that
overall the transfer pricing policy formulation process appears to be more a centralised rather than
decentralised function. .
101

9, How policy disagreements were settled
The majority (88%) of Japanese companies settled disagreements by means of negotiation
between the divisions themselves without any head office involvement. In the case of US.
companies however most transfer pricing disputes were settled by head office management.
10, Outside purchasing policies
Most Japanese companies were not allowed to purchase externally goods which are available
internally. Most U.S. companies on the other band were permitted to purchase externally, subject
to the approval ofhead office. Thus it would appear that Japanese companies are more restrictive
in their outside purchasing policies.
3.5 WU & SHARP (1979)
The objectives of this study were to ascertain the dominant transfer pricing systems used by
companies, the objectives of companies' transfer pricing systems and the dominant arbitration
methods used to settle transfer pricing disputes. The population surveyed consisted of the 500
largest U.S. firms as listed in the June 1976 edition of Fortune. Sixty-one responses were
received, representing 12 % of the population.
STUDY FINDINGS
1 Transfer pricing objectives
Companies were asked to score the importance ofpossible objectives oftheir domestic transfer
pricing systems. The top seven ranked objectives are summarised in Table 3.8.
The top two ranked objectives comply with the often cited objectives of transfer pricing
systems mentioned in the literature and discussed in chapter two. The promotion of divisional
autonomy however achieved a relatively low ranking (six and seven). This is contradictory to
what would have been expected from a review ofthe transfer pricing literature, which ranks the
promotion ofdivisional autonomy as one ofthe top three objectives of a transfer pricing system.
102

Table 3.8 The rankings of transfer pricing objectives - Wu & Sharp (1979)
Objective
Maximize overall profits (ie. achieve goal congruence)
Facilitate divisional performance evaluation
Comply with governmental restrictions
(eg. Cost Accounting Standard Board cost standards)
Comply with tax regulations
Comply with generally accepted accounting standards
Facilitate divisional profit maximisation
Promote divisional autonomy
Ranking
1
2
3
4
5
6
7
Source: Adapted from Wu F.H& D. Sharp. 1979. An empirical study of transfer pricing practice.
The International Journal ofAccounting Education and Research. Spring: 80-81.
2. Transfer pricing systems
Companies were asked to score the importance of various transfer pricing systems, both when a
market price is available and when a market price is not available. The rankings achieved are
summarised in Table 3.9 in the order ofdecreasing importance.
When a market price is available companies tend to use market prices, as evidenced by the
high ranking ofmarket prices. This also conforms with the importance accorded to market prices
in the accounting literature. This finding is in conflict with the findings of Borkowski (1988)
which will be discussed later. When market prices are not available companies prefer the use of
a full cost plus profit margin system over and above negotiated prices. These findings may indicate
a general desirability to base transfer prices on objective criteria like market prices and full cost.
The low rating accorded to linear programming prices attests to the practical rejection of
mathematically based transfer pricing models.
103

Table 3.9 The rankings of transfer pricing systems - Wu & Sharp (1979)
When a market price is available When a market price is not available
1. Market price 1. Full cost plus profit margin
2. Negotiated price 2. Negotiated price
3. Full cost plus profit margin 3. Full cost
4. Adjusted market price 4. Variable cost plus profit margin
5. Full cost 5. Marginal costs
6. Marginal cost 6. Variable costs
7. Variable costs plus profit margin 7. Linear programming price
8. Variable costs
9. Linear programming price
Source: Adapted from Wu F.H & D. Sharp. 1979. An empirical study of transfer pricing practice.
The International Journal ofAccounting Education and Research. Spring:80-8l.
3. Arbitration methods
Companies were asked to rank the importance of various arbitration methods used to settle
domestic transfer pricing disputes. It was found that the most prevalent method used to settle
disputes was a two-stage arbitration process. In stage one of the process divisional management
is left to arrive at a resolution to the problem. If the problem cannot be resolved at a local level,
then stage two ofthe process is invoked. In stage two ofthe process head office management is
called in to resolve the dispute.
3.6 BENKE & EDWARDS (1980)
The objectives of the study carried out by Benke & Edwards (1980) were twofold. The first
objective was "to examine transfer pricing practices ofU.S. corporations (selling domestically and
internationally) to determine which transfer pricing techniques are used to establish transfer
prices" (Benke & Edwards 1980 1). The second objective was ''to suggest a procedure that
104

organisations can use for determining the transfer pricing technique most appropriate for their
circumstances" (Benke & Edwards 1980 1).
The study sample consisted of 19 D.S. companies representing 10 industries. The
interview process was used to gather empirical evidence. In selecting the companies to be
included in the sample the researchers were directed by the objective ofhaving as many industries
as possible represented in the sample and whenever possible, having at least two companies from
one industry so as to get more than one view from that industry.
All companies that were approached agreed to take part ie. 100 % response rate.
Interviewees were usually corporate controllers and one or two staff members having
responsibility for segments.
STUDY FINDINGS
1. The importance of transfer pricing
In order to gauge the importance of transfer pricing the interviewees were asked whether they
considered transfer pricing important. All interviewees responded in the affirmative. The majority
feh that transfer pricing was very important while the remainder felt that transfer pricing was only
fairly important. The frequently cited reasons for regarding transfer pricing as only fairly
important were that interdivisional transfers constituted a small proportion of total sales or that
there was general acceptance within the firm ofthe current techniques in use.
2 Transfer pricing methods used
The extent to which various transfer pricing methods were used, either as primary or secondary
methods by the companies interviewed is summarised in Table 3.10. It is apparent from this table
that the companies covered in this study favoured the non-cost-oriented methods more as their
primary method, and the cost-oriented methods were favoured as supplementary methods. This
suggests that non-cost-oriented methods were considered more important than cost-oriented
methods. Also, those companies that used standard full production cost as a transfer price tended
to use the method generally at lower levels in the organisation. At the higher levels companies
favoured the use of market based approaches. In fact, the two market based methods were
individually the most popular primary methods in use. Again a lack of support for theoretical
105

Table 3.10 Transfer pricing methods used by participating firms - Benke & Edwards (1980)
Pricing methods
Cost-oriented methods:
Primary
methods
43 %
Secondary
methods
61 %
Actual variable production cost 0% 0%
Actual full-production cost 4% 0%
Standard variable production cost 0% 0%
Standard full-production cost 13% 6%
Actual variable production cost +
lUmp-sum subsidy 0% 0%
Full-production cost (actual or
std) + some allowance for profit 13 % 22%
Opportunity cost 0% 5%
Marginal cost 0% 0%
Variable cost plus markup 13% 28%
Non-cost-oriented methods: 57% 39 %
Market price 18 % 17 %
Market price less selling expenses 26% 0%
Negotiated price 13 % 22%
Mathematical programming price 0% 0%
Total all methods 100% 100%
Source: Adapted from Benke, Ralph L.,Jr and James Don Edwards. 1980. Transfer Pricing:
Techniques and Uses. New York: National Association of Accountants.30.
106

concepts such as marginal cost and opportunity cost is evident. Benke & Edwards (1980)
attribute the lack ofpopularity of these methods to the difficulty ofapplying them in practice.
3. The number oftransfer pricing methods used
A substantial proportion of the companies interviewed used secondary methods in addition to
their primary methods. Again this probably bears testimony to the point raised at the end of
chapter two that there is no single universally applicable transfer price. Indeed "almost all of the
interviewees could point to weaknesses in their transfer pricing techniques, but many were
reluctant to consider a change without good cause. This attitude reflected their awareness that
currently no transfer pricing technique fits all situations, and it is often hard to defend one
technique against another" (Benke & Edwards 1980 10).
Thus it would appear that the tendency for academics to propose their methods as
theoretically correct and able to suit all circumstances is mis-placed.
3.7 BQRKQWSKI (1988)
The objective ofBorkowski's study was to identify the "environmental and organizational
variables which are significant in making transfer pricing decisions in practice" (Borkowski 1988
44). The questioimaire survey method of research was used to obtain the necessary data for the
study. Questionnaires were sent out to 452 U.S. firms considered likely to be using transfer
pricing. 215 usable responses were received representing a response rate of 48%. Of the 215
usable responses, 168 firms indicated that they used transfer pricing and 47 did not use transfer
pncmg.
STUDY FINDINGS
1. Domestic transfer pricing methods used
The domestic transfer pricing methods used by respondent firms are summarised in Table 3.11.
This table indicates that overall, companies tended to prefer the use ofnon-cost oriented transfer
pricing methods. The four most popular transfer pricing methods are market price (or some
variation thereof) (33 %), negotiated prices (23 %), standard/actual full production cost (21 %)
107

Table 3.11 Domestic transfer pricing methods used by respondent firms - Borkowski (1988)
Pricing methods
Cost-oriented methods:
Actual variable production cost
Actual full-production cost
Standard variable production cost
Standard full-production cost
Actual variable production cost +
lump-sum subsidy
Full-production cost (actual or
std)+some allowance for profit
Variable cost plus markup
Other cost-oriented methods
Non-cost-oriented methods:
Market price
Adjusted market price
Negotiated price
Mathematical programming price
Total all methods
44%
1%
7%
2%
14%
0%
17 %
1%
2%
56%
20%
13 %
23%
0%
100 %
Source: Adapted from Borkowski, S C. 1988. An investigation into the divergence oftheory
from practice regarding transfer pricing methods. Ann Arbor: UMI. 96.
108

and full production cost plus some allowance for profit (17 %).
2. The impact of environmental and organisational variables on the choice of transfer pricing
method
Borkowski conducted statistical tests to establish whether there is a relationship between the
existence of certain environmental and organisational variables and a firm's choice oftransfer
pricing method. The environmental and organisational variables tested are summarised in Table
3.12.
3. Results ofthe statistical tests
A. Environmental variables
Borkowski was unable to detect a meaningful relationship between any of the first three
environmental variables listed in Table 3.12 and the transfer pricing method used by a firm. The
fmdings in respect of the existence of a market price are perhaps the most surprising and led
Borkowski to conclude that "the existence of a market price does not lead to the conclusion that
the market price method will be used, as previous research had indicated. The significance of the
variable derives from the fact that 83.3 % ofthe firms reported that it existed, but no relationships
can be determined between its existence and the transfer pricing method chosen. This finding is
in conflict with the recommendation of most researchers to use market price when it exists"
(Borkowski 1988 129-130). In particular, these findings conflict with those of Wu & Sharp
(1979) discussed earlier.
Statistical tests were also conducted to establish whether there is a relationship between
the nature of an industry and the transfer pricing methods used within the industry. The results
are statistically significant and indicate that firms classified as process industries, for ego chemicals
and food are more likely to use market-based transfer prices whilst metal / mining and
manufacturing firms have a tendency to use a full cost based method.
109
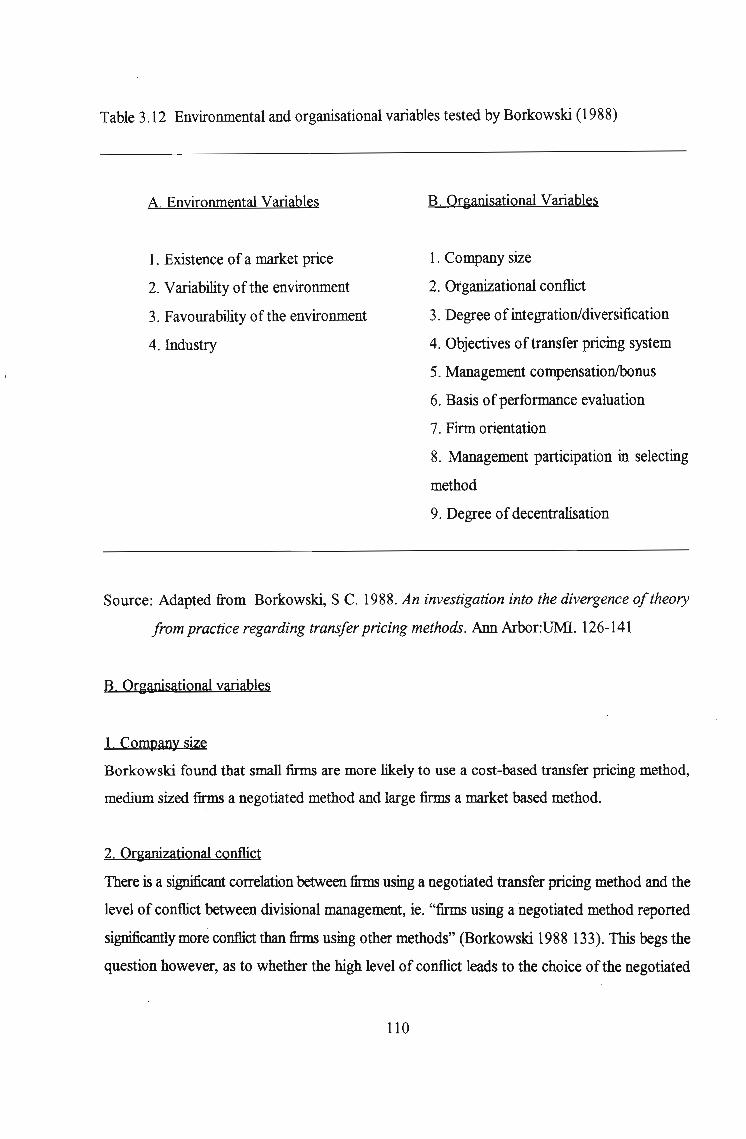
Table 3.12 Environmental and organisational variables tested by Borkowski (1988)
A. Environmental Variables
1. Existence of a market price
2. Variability of the environment
3. Favourability of the environment
4. Industry
B. Organisational Variables
1. Company size
2. Organizational conflict
3. Degree of integration/diversification
4. Objectives of transfer pricing system
5. Management compensationlbonus
6. Basis ofperformance evaluation
7. Firm orientation
8. Management participation in selecting
method
9. Degree ofdecentralisation
Source: Adapted from Borkowski, S C. 1988. An investigation into the divergence oftheory
from practice regarding transfer pricing methods. Ann Arbor:UMI. 126-141
B. Organisational variables
1. Company size
Borkowski found that small firms are more likely to use a cost-based transfer pricing method,
medium sized firms a negotiated method and large firms a market based method.
2, Oq~anizational conflict
There is a significant correlation between firms using a negotiated transfer pricing method and the
level of conflict between divisional management, ie. "firms using a negotiated method reported
significantly more conflict than firms using other methods" (Borkowski 1988 133). This begs the
question however, as to whether the high level of conflict leads to the choice of the negotiated
110

method or whether the use of the negotiated method causes the conflict. In this respect
Borkowski is of the opinion that transfer pricing constitutes a small part of the overall reasons
for management interactions and hence cannot be a significant cause ofmanagerial conflict. It is
therefore more likely that a high level of organisational conflict leads to the selection of the
negotiated price method rather than the other way around.
3. Degree of integration/diversification
No significant relationships between this variable and the choice of a transfer pricing method
could be discerned.
4. Objectives of transfer pricing systems
Borkowski found that companies which emphasise the ease of application of a transfer pricing
method as an important objective of a transfer pricing ~ystem are more likely to use a full cost
based method. Companies which emphasise that a transfer pricing system should facilitate decision
making are more likely to use a negotiated method. Finally companies emphasising managerial
performance measurement are more likely to use market and negotiated prices.
5. Management compensationlbonus
The existence and type ofbonus does not appear to have an impact on a firm's choice of transfer
pricing method.
6. Basis for performance evaluation
No correlation could be found between divisional measures of performance and the choice of
transfer pricing method.
7. Firm orientation
The business objectives of a firm (long-run profit maximisation, short-run profit maximisation,
market share and non-financial interests) does not have any significant impact on a firm's choice
oftransfer pricing method.
III

8 Manaier participation in Selectina the method
The level at which a transfer pricing method is chosen (ie. by divisional management, by upper
management or jointly by divisional and upper management) correlates significantly with the
choice ofmethod. ''The more mechanical types of transfer pricing methods (market and full cost)
are easily dictated at upper levels, while the more complicated negotiated method requires more
decentralized participation by managers in order to be effective" (Borkowski 1988 140).
9, D~ee ofdecentraliz;a!ion
The degree ofdecentralization impacts on a firm's choice oftransfer pricing method. Only three
out of 167 companies reported a highly centralized environment and all three reported usage of
a full cost based transfer pricing method. 39 out of 167 companies reported a highly decentralized
environment and the majority (41 %) of these companies used a negotiated method.
3.8 GEBOEBS, ET AL (1989)
The objective of the Geboers study was to "identify and descnbe transfer pricing systems in use
in selected South African industries and to investigate the management control processes
surrounding those systems." (Geboers et al1989 27).
The researchers identified four sectors on the Johannesburg Stock Exchange which were
considered most likely to have internal transfers of goods and services. Companies within these
sectors which were considered unlikely to have internal transfers of good and services were
eliminated from the population. In total 66 companies were surveyed, 45 ofwhich responded,
representing a response rate of 68 %.
STUDy FINDINGS
1 The extent ofuse oftransfer prices
The extent ofuse oftransfer prices amongst survey respondents is summarised in Table 3.13.
112

Table 3.13 The extent of use of transfer prices among respondent firms - Geboers, et al. (1989)
Use transfer prices 19
Do not use transfer prices 26
Total 45
42%
58%
100%
Source: Adapted from Geboers, AAP.C., et al. 1989. An exploratory survey oftransfer pricing
in selected South African listed companies. South African Journal ofBusiness
Management 20 (March):28.
Since only 19 companies used transfer pricing the authors caution that the findings of the study
should be considered as being of an exploratory nature only.
2 The relationship between size and the use of transfer prices
In order to gauge whether there is a relationship between size and the use of transfer prices the
surveyed companies were stratified on the basis of size, using employee numbers as a surrogate
for size. Two strata were identified - companies with employees up to 1000 (small companies)
and companies with employees in excess of I 000 (large companies).
2.1 Companies that use transfer prices
The spread between small and large of the 19 companies that used transfer prices is summarised
in Table 3.14. It can be concluded from this that it is predominantly large companies that use
transfer pricing. ''This is not surprising since a decentralised form of management control is in
general more appropriate for a larger company (Geboers, et al. 198928).
113

Table 3.14 Analysis according to size of companies using transfer prices - Geboers, et al. (1989)
Small
Large
Total
2
1119
10%
90%
100%
Source: Adapted from Geboers, AA.P.C., et al. 1989. An exploratory survey oftransfer pricing
in selected South African listed companies. South African Journal ofBusiness
Management 20 (March):28
2.2 Companies that do not use transfer prices
The spread between small and large of the companies that do not use transfer prices is
summarised in Table 3.15.
Table 3.15 Analysis according to size of companies not using transfer prices - Geboers, et al.
(1989)
Small
Large
Total
13
II
26
50%
50%
100%
Source: Geboers, AA.P.C., et al. 1989. An exploratory survey of transfer pricing in selected
South African listed companies. South African Journal ofBusiness Management 20
(March):28
Ahigh proportion ofthe companies that do not use transfer pricing are large companies,
"despite the fact that the study was carried out among a selected group of companies which were
114

considered to have a high propensity to decentralize" (Geboers 1989 28). This could possibly
indicate "inefficiencies in the management control systems of South African business" (Geboers
1989 28) and a serious divergence from academic theory which is premised on the
indispensability of formalised transfer pricing systems in decentralised situations. However, the
reasons for the lack ofuse of transfer pricing among these companies need to be established (for
example, there is simply no interdivisional trading) before substantiated conclusions can be drawn
in this respect. The reasons why South Afiican companies do not use transfer pricing are explored
in the present study and reported in chapter 5.
3. The objectives of transfer pricing methods
The respondents were asked to score the applicability of seven possible identified transfer pricing
objectives. These results are summarised in Table 3.16.
Table 3.16 The objectives oftransfer pricing methods used by respondent firms - Geboers, et al.
(1989)
Ranking
Performance evaluation I
Goal congruence 2
Divisional autonomy 3
Motivational 4
Aid in management decisions 5
Minimise tax 6
GAAP compliance 7
Source: Geboers, A.A.P.c., et al. 1989. An exploratory survey of transfer pricing in selected
South African listed companies. South Afn·can Journal ofBusiness Management 20
(March):28.
115

It is interesting to note that no significant divergence between the top three ranked
.objectives and the objectives of a sound transfer pricing system identified in the literature and
discussed in chapter two is evident. However, whereas in chapter two it was pointed out that goal
congruence appears to be the prime objective, the results of this study indicate that performance
evaluation as an objective is more important than goal congruence.
4. Transfer pricing methods
The respondents were asked to indicate the transfer pricing methods they used under the
following two circumstances:
1. A market price is available for the intermediate product
2. A market price is not available for the intermediate product.
4. 1 Market price for intermediate product available
The transfer pricing methods used when the market price for an intermediate product is available
are summarised in Table 3.17.
Although it is pleasing to note that market price is most frequently used when it is
available, one wonders whether the proportion should not be higher as academic theory generally
holds that when market prices are available then these should be used. In fact, these figures reflect
a divergence from academic theory since 62 % ofthe companies do not use market prices even
when these are available. This correlates with Borkowski's findings discussed earlier.
4.2 Market price for intermediate product not available
The transfer pricing methods used when the market price for an intermediate product is not
available are summarised in Table 3.18.
A dominance ofnegotiated prices in this instance is noted. This conflicts with the findings
of Wu & Sharp (1979) who found that/U.S. companies rate full cost plus profit margin more
highly than negotiated price when a market price is not available.
116

Table 3.17 Transfer pricing methods used when a market price is available - Geboers et al. (1989)
Market price 38 %
Negotiated price 24%
Cost related 19 %
Cost plus profit 14%
Other 5%
Total 100%
Source: Geboers, AAP.C., et al. 1989. An exploratory survey of transfer pricing in selected
South African listed companies. South African Journal ofBusiness Management 20
(March):29
Table 3.18 Transfer pricing methods used when a market price is not available - Geboers et al.
(1989)
Negotiated price 64%
Cost related 15 %
Cost plus profit 14%
Other 7%
Total 100%
Source: Geboers, AAP.C., et al. 1989. An exploratory survey of transfer pricing in selected
South African listed companies. South African Journal ofBusiness Management 20
(March):29
117
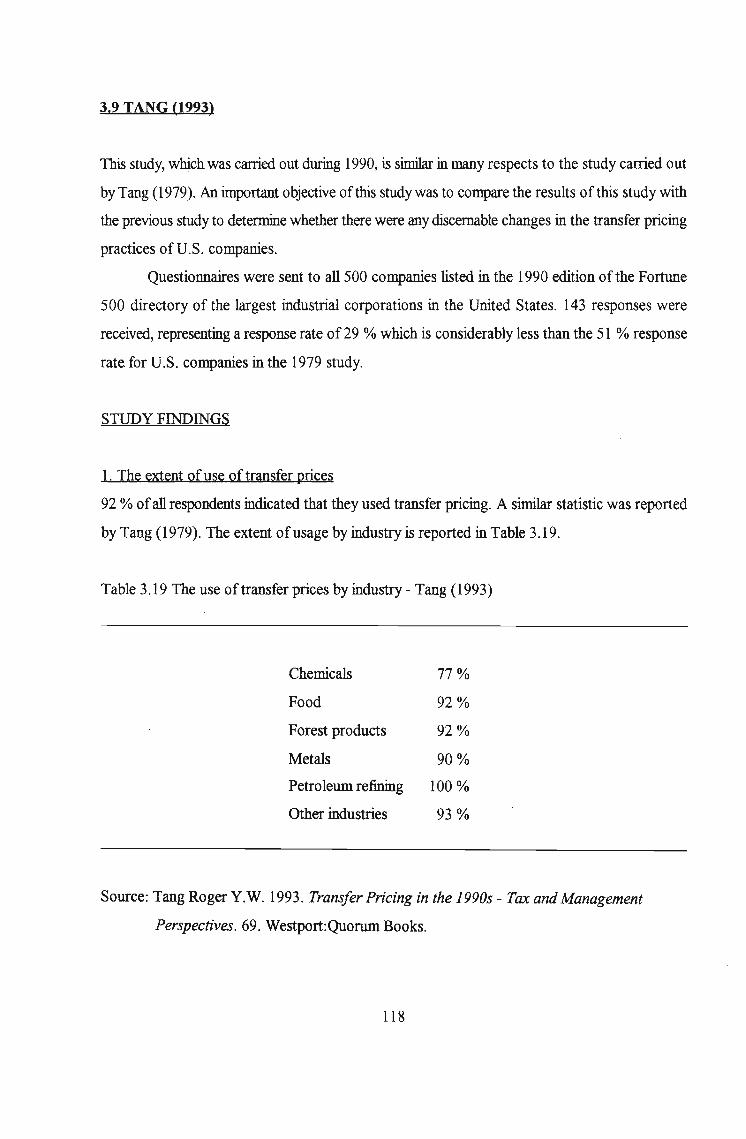
3,9 TANG (1993)
This study, which was carried out during 1990, is similar in many respects to the study carried out
by Tang (1979). An important objective ofthis study was to compare the results of this study with
the previous study to determine whether there were any discernable changes in the transfer pricing
practices ofU.S. companies.
Questionnaires were sent to all 500 companies listed in the 1990 edition of the Fortune
500 directory of the largest industrial corporations in the United States. 143 responses were
received, representing a response rate of 29 % which is considerably less than the 51 % response
rate for U.S. companies in the 1979 study.
STUDY FINDINGS
1. The extent of use of transfer prices
92 % ofall respondents indicated that they used transfer pricing. A similar statistic was reported
by Tang (1979). The extent of usage by industry is reported in Table 3.19.
Table 3.19 The use of transfer prices by industry - Tang (1993)
Chemicals 77%
Food 92%
Forest products 92%
Metals 90%
Petroleum refining 100 %
Other industries 93%
Source: Tang Roger Y.W. 1993. Transfer Pricing in the 1990s - Tax and Management
Perspectives. 69. Westport:Quorum Books.
118

The highest rate of usage of transfer prices appears to be in the petroleum refining
industry.
2. Number of domestic transfer pricing methods used
Table 3.20 reflects the number of domestic transfer pricing methods used by the respondent
firms, together with comparatives for the previous study.
The proportion ofcompanies using more than one transfer pricing method has marginally
increased from 44 % to 48 %. This indicates the lack ofprogress made over time in resolving the
transfer pricing dilemma as far as the development of a single universally applicable transfer
pricing method is concerned.
Table 3.20 Number ofdomestic transfer pricing methods used by companies - Tang (1993)
Number of methods used 1993 1979
One 52% 56%
Two 26% 23 %
Three 15 % 16 %
Four 6% 3%
Five 1% 1%
Six 1%
100% 100 %
Source: Tang Roger Y.W. 1993. Transfer Pricing in the 1990s - Tax and Management
Perspectives. Westport:Quorum Books. 70; and Tang, Roger Y W. 1979. Transfer
Pricing Practices in the United States and Japan.New York:Praeger. 63.
119

3 Domestic transfer pricing methods used
The domestic transfer pricing methods used by the respondent firms (together with comparatives
for the previous study) are summarised in Table 3.21. Overall these statistics indicate a shift away
from cost-oriented to non cost-oriented transfer pricing methods with the greatest gain occurring
in the market based transfer price category.
4. Company size and the orientation of transfer prices
It will be recalled that Tang (1979) discovered that as far as V.S. companies were concerned there
was no significant association between company size and the orientation ofthe transfer pricing
method used whereas in the case of Japanese companies such an association was evident (the
larger the size ofthe Japanese firm the greater the likelihood that it would use non-cost oriented
transfer prices). This test was repeated for U.S. companies in the present study and again it was
found that there is no significant relationship between company size and the orientation of the
transfer pricing method used.
3.10 CONCLUSION
In this chapter some recent empirical studies into transfer pricing practices were reviewed. In
some areas study findings corroborate each other whilst in other areas findings are contradictory.
What is certain however is that the economic theories of Hirshleifer and the
mathematically complex transfer pricing methods find little support by way of practical
application. Full cost based methods on the other hand enjoy considerably more support than
academics would be comfortable with. It was this fact which led Borkowski to conclude that "the
contradiction ofthe theoretical literature by actual practices should lead to a reconsideration of
the current disapproving attitude toward full cost methods and to the inclusion of full cost
methods as a viable transfer pricing method" (Borkowski 1988 151).
120
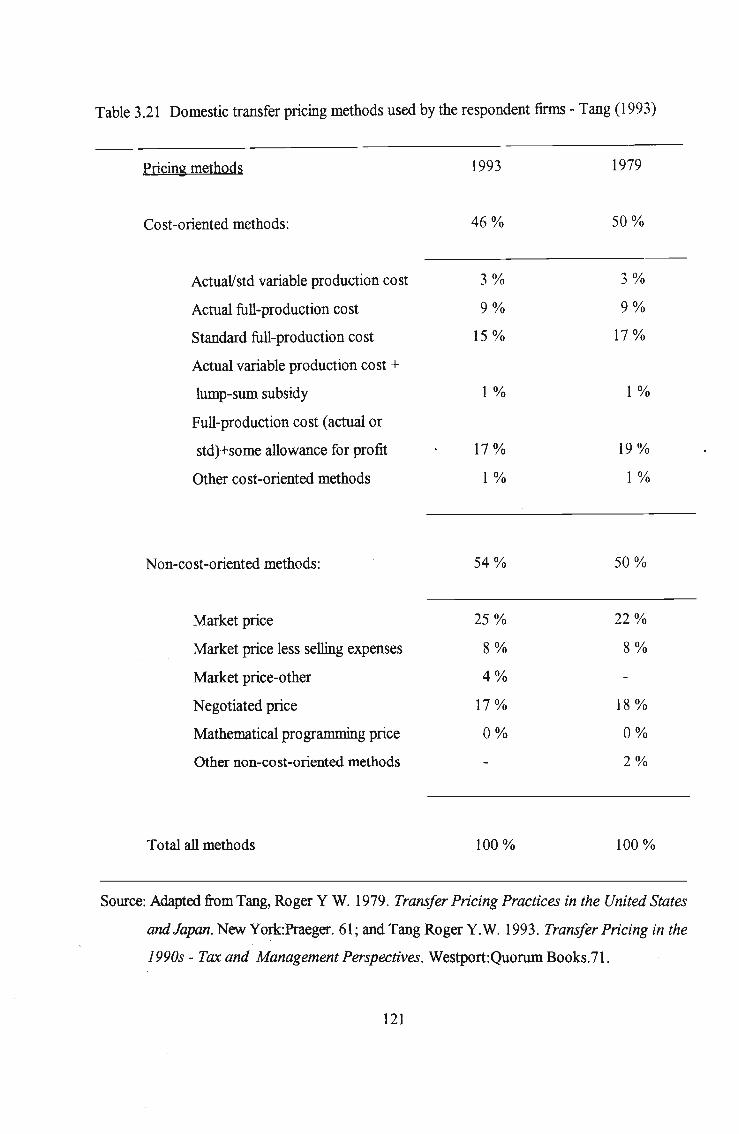
Table 3.21 Domestic transfer pricing methods used by the respondent firms - Tang (1993)
Pricing methods
Cost-oriented methods:
1993
46%
1979
50%
Actual/std variable production cost 3% 3%
Actual full-production cost 9% 9%
Standard full-production cost 15 % 17 %
Actual variable production cost +
lump-sum subsidy 1% 1%
Full-production cost (actual or
std)+some allowance for profit 17 % 19 %
Other cost-oriented methods 1% 1%
Non-cost-oriented methods: 54% 50%
Market price 25% 22%
Market price less selling expenses 8% 8%
Market price-other 4%
Negotiated price 17% 18 %
Mathematical programming price 0% 0%
Other non-cost-oriented methods 2%
Total all methods 100% 100 %
Source: Adapted from Tang, Roger Y W. 1979. Transfer Pricing Practices in the United States
andJapan. New York:Praeger. 61; and Tang Roger Y.W. 1993. Transfer Pricing in the
1990s - Tax and Management Perspectives. Westport:Quorum Books.71.
121

3.11 REFERENCES
Benke, Ralph L.,Jr., and James Don Edwards. 1980. Transfer Pricing: Techniques and Uses. New
York: National Association of Accountants.
Borkowski, Susan C. 1988. An investigation into the divergence oftheory from practice regarding
transfer pricing methods. Ann Arbor:UMI.
Choudhury, N. 1979. Transfer pricing practices: room for debate. Accountancy (England) 90
(August): 105-1 06.
Finnie, J. 1978. Transfer pricing practices. Management Accounting (U.K.) 56 (December):494
497.
Geboers, A.A.P.C., et al. 1989. An exploratory survey of transfer pricing in selected South
African listed companies. South African Journal ofBusiness Management 20 (March): 27-31.
Grabski, S.Y. 1985. Transfer pricing in complex organisations: a review and integration of recent
empirical and analytical research. In Readings in Accounting for Management Control. Emmanuel,
Otley and Merchant (editors). London: Chapman & Hall. 453-495.
Tang, Roger YW; 1979. Transfer Pricing Practices in the United States and Japan. New York:
Praeger.
Tang, Roger Y W. 1993. Transfer Pricing in the 1990s - Tax and Management Perspectives.
Westport : Quorum Books.
Wu F.H. & D. Sharp. 1979. An empirical study of transfer pricing practice. The International
Journal ofAccounting Education and Research. Spring: 71-99.
122

CHAPTER4 .
EMPIRICAL RESEARCH DESIGN AND METHODOLOGY
4,1 OBJECTIVE OF THE EMPIRICAL INVESTIGATION
The objective of the empirical investigation was to collect data on the domestic transfer pricing
practices of large listed South African industrial companies. In particular, data was gathered on
(1) the transfer pricing methods used by these companies, (2) the objectives of these companies'
transfer pricing systems and (3) other policy issues surrounding transfer pricing; such as the
responsibility for choosing the transfer pricing method and the manner ofsettling disputes.
4.2 RESEARCH DESIGN
There are various ways of classifying the design of a research study. One way of classifying
research design is to consider the case versus statistical study (Cooper & Emory 1995 133). In
this regard Cooper & Emory state:
" The statistical study differs from the case study in several ways. Statistical studies
are designed for breadth rather than depth. They attempt to capture a population's
characteristics by making inferences from a sample's characteristics. Hypotheses
are tested quantitatively. Generalizations about findings are presented based on the
representativeness of the sample and the validity of the design.
Case studies place more emphasis on a full contextual analysis of fewer
events or conditions and their interrelations. Although hypotheses are often used,
the reliance on qualitative data makes support or rejection more difficuh" (Cooper
& Emory 1995 116).
Based on the above guidelines the case study method ofresearch is rejected for this study.
The o~ective ofthe study is to obtain comprehensive data from a large number ofcompanies and
to identify potential relationships between variables. A statistical study is therefore most
123

appropriate in the present context.
4,3 DATA COLLECTION TECHNIOUES
"Every study is a search for information about some topic. We classify information sources into
primary and secondary types. Primary data come from the original sources and are collected
especially to answer our research question". (Cooper & Emory 1995 240). Secondary data is
obtained from studies carried out by other persons for their own purposes.
Primary source data can be obtained by means ofobservation or survey. Surveys are more
efficient and economical than observation. Surveying facilitates broad geographic coverage "at
a fraction of the cost and time required by observation" (Cooper & Emory 1995 269).
Infonnation relating to opinions and attitudes can in almost all cases only be gathered by means
ofquestioning. Thus the survey method of gathering data is considered most appropriate for the
present study.
Three modes ofdata collection are available using a survey strategy; personal interviews,
telephone interviews and a mail survey. The first two modes of data collection are considered
impractical for the purposes of the current study for the following reasons:
1. The objective of the study is to obtain widespread data from a large number of
compames.
2. The person that would have to be interviewed should ideally be a person high up in the
organisation structure. These persons are normally quite busy and it is difficult to gain
access to them.
In support of the use of a mail survey for a study of this nature Tang points to the
following advantages:
"(1) it is simple and easy to administer,
(2) it is possible to sample a large population, and
(3) the data can be analyzed using rigorous statistical techniques." (Tang 1993 60).
124

The two major weaknesses of a mail survey are nonresponse and limitations on the type
and amount of information that can be secured (Cooper & Emory 1995 282-283). The problem
ofnonresponse was addressed in the present study using established techniques such as follow
ups, non-lengthy questionnaire, use of a covering letter, inclusion of a reply-paid envelope and
providing an incentive to respond.
The main secondary data source used for the purposes of the empirical investigation was
the June 1996 edition ofthe Financial Mail Special Survey ofTop Companies. The Financial Mail
is a widely circulated and authoritative publication in South Africa and there is no reason to doubt
the accuracy ofthe data.
4.4 POPULATION DEFINITION
The 1996 Financial Mail Special Survey ofTop Companies contains a listing of the 286 largest
listed South African industrial companies ranked by total assets. As large companies are more
likely to use transfer prices than small companies this listing is considered an appropriate basis for
establishing the population to be surveyed. Five companies on this list however were from the
"Cash Companies" sector ofthe Johannesburg Stock Exchange and as this sector represents non
trading cash shells these companies were excluded from the population. Two other companies
were no longer listed. This then left a final population of279 companies representing 16 industrial
sectors and ranging in size from total assets ofR19 148 million for the largest company to R 8
million for the smallest company. The industrial sectors represented in the population are
summarised in Table 4.1.
4.5 OUESTIONNAIRE DESIGN
A copy of the questionnaire together with the covering letter is included in Appendix A. The
covering letter was printed on a University ofNatal letterhead implying approval of the study by
the University. It was felt that the affiliation of a well known university with the study would
encourage companies to respond.
The covering letter was addressed to the financial director ofthe company as he would
be in the best position to respond to a questionnaire of this nature since he has overall
125
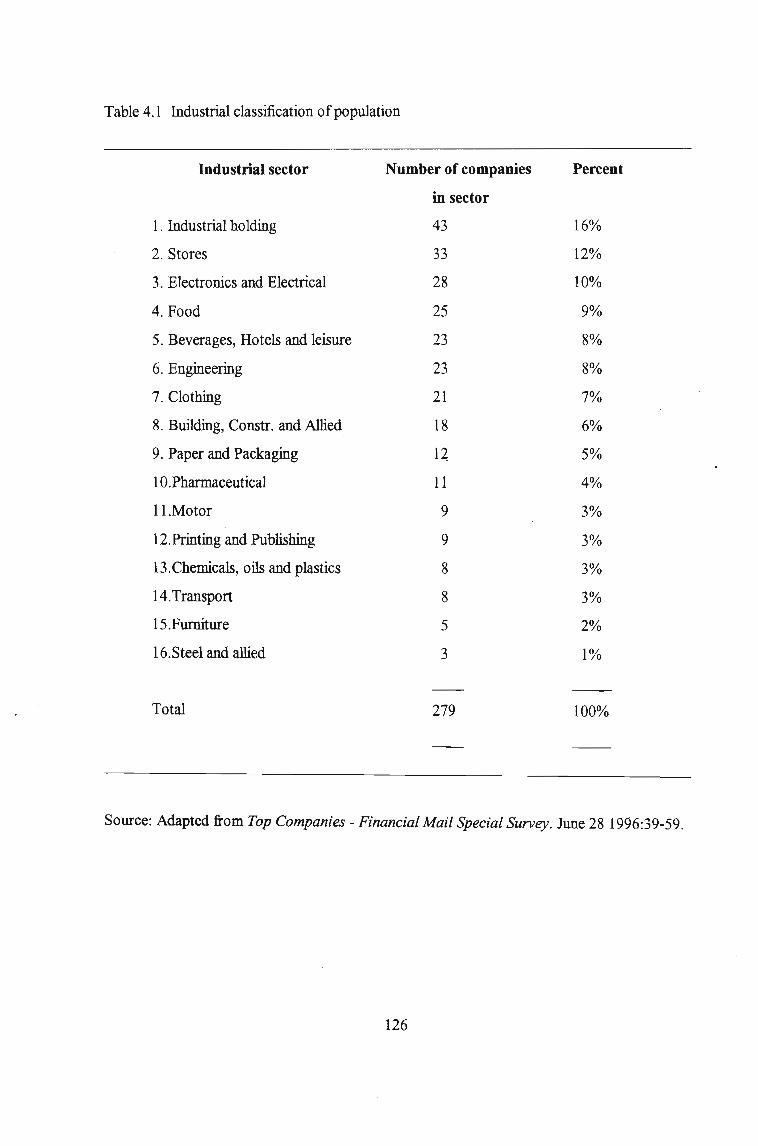
Table 4.1 Industrial classification of population
Industrial sector Number of companies Percent
in sector
1. Industrial holding 43 16%
2. Stores 33 12%
3. Electronics and Electrical 28 10%
4. Food 25 9%
5. Beverages, Hotels and leisure 23 8%
6. Engineering 23 8%
7. Clothing 21 7%
8. Building, Constr. and Allied 18 6%
9. Paper and Packaging 14 5%
10.Pharmaceutical 11 4%
ll.Motor 9 3%
12.Printing and Publishing 9 3%
13.Chemicals, oils and plastics 8 3%
14.Transport 8 3%
15.Furniture 5 2%
l6.Steel and allied 3 1%
Total 279 100%
Source: Adapted from Top Companies - Financial Mail Special Survey. June 28 1996:39-59.
126

responsibility for the group finance function. If the financial director were to delegate the
responsibility for answering the questionnaire to a third person, he is also in the best position to
identify the next most responsible person in the organisation competent to answer the
questionnaire (Koen 1982 246).
Transfer pricing is often considered a sensitive topic. This problem was addressed by
including a statement in the covering letter guaranteeing anonYmity to all respondents.
In order to motivate companies to respond the covering letter immediately drew the
attention of potential respondents to the fact that the questionnaire would not take long to
complete. The inclusion of a reply-paid envelope and the promise of a free copy of a report
summarising the results of the study were also mentioned in the covering letter with a view to
motivating companies to respond.
The questionnaire was designed in such a way that respondents would have to merely
check the appropriate box when answering a question. It was felt that this method of eliciting
responses would simplify the answering process and encourage companies to respond.
Respondents were however informed that should they wish to provide reasons or explanations
with their answers they were most welcome to do so.
A defmitions section was included in the questionnaire to improve the accuracy of the
answers. The definitions section made it clear to companies that the emphasis of the study was
on their domestic transfer pricing practices. The term "goods and services" was also defined for
respondents (exclusion of central administrative overheads) as the objective ofthe study is to
concentrate on the core trading activities of companies.
Question one requires respondents to provide an estimate of the level of interdivisional
trading. This question is asked with a view to gauging the importance of transfer pricing to a
company. Naturally, the greater the level of interdivisional trading the more important transfer
pricing is to a company.
Question two requires respondents to indicate whether transfer pricing is used within their
group or not. Those respondents answering in the affirmative are routed through the rest of the
questionnaire. Companies not using transfer pricing are requested to proceed to the last question,
Question ten, which requires respondents to provide a reason as to why transfer pricing is not
used within their group.
As stated earlier, the objectives of the empirical investigation are threefold. These are to
127
(1) identify the transfer pricing methods used by companies, (2) identify the objectives of the
transfer pricing methods used and (3) to obtain information on certain policy issues relating to
transfer pricing. Qyestions three and four of the questionnaire deal with objective one, questions
five and six with objective two and questions seven. eight and nine with objective three.
Transfer pricing methods
Possible transfer pricing methods used by companies were identified from the literature review.
These methods are listed in questions three and four. Prior research indicates that a large
proportion of companies use more that one transfer pricing method. Thus in question three
companies are asked to indicate all transfer pricing methods in use. Question four requires
companies which use more than one transfer pricing method to indicate the dominant method in
use. In this way the more important transfer pricing methods used in practice were identified.
Transfer pricing objectives
Seven ofthe more important transfer pricing objectives were identified from the literature review.
These objectives are listed in questions five and six. It will be recalled from chapter two that it is
often difficult for a transfer pricing system to simultaneously satisfy various objectives. Thus
questions five and six attempt to identify the more important transfer pricing objectives. In
question five companies are asked to rate the importance of each objective on a five point scale
as follows:
Point value
Extremely important 5
Very important 4
Moderately important 3
Not too important 2
Not at all important 1
In question six companies are asked to identify the single most important or dominant
objective oftheir transfer pricing systems.
128

Other policy issues
Based on the review of the literature three important policy issues were identified; viz. (1) the
responsibility for the selection of the transfer pricing method, (2) permission to purchase
externally goods and services which are available internally and (3) the manner of settling transfer
pricing disputes. These issues are dealt with in questions seven, eight and nine respectively.
Review of the survey instrument
Prior to conducting the pilot test, a draft copy ofthe questionnaire was discussed with two senior
members of the Faculty of Commerce at the University ofNatal, Pietermaritzburg.
4.6 PILOT TESTING
"A pilot test is conducted to detect weaknesses in design and instrumentation" (Cooper & Emory
1995 66). In particular a pilot study was conducted in order to detect any ambiguities in the
wording ofthe questionnaire and to establish objective response rates as an aid to determining the
appropriate sample size for the :full-scale study (Tang 1979 42). Subjects fOf the pilot study were
selected from the population to be tested as it is considered an advantage for the questionnaire
to be tested under circumstances approximating those of the final study (Cooper & Emory 1995
319).
''The size ofthe pilot group may range from 25 to 100 subjects, depending on the method
to be tested, but the respondents do not have to be statistically selected" (Cooper & Emory 1995
66). For the purposes of the present study it was decided to circularise 25 companies using the
following rationale.
At least one company from each of the 16 industries represented in the population was
included in the pilot study. For this purpose the largest company in each industry was identified
and included in the pilot study. The remaining 9 positions were filled by identifying the second
largest company in the 9 industries having the highest level of frequency in the population.
Twenty-five pilot questionnaires together with covering letters were mailed to companies
on 25 November 1996. A strongly worded follow-up reminder together with a second copy of
the questionnaire was mailed on 23 December 1996 to all companies that had not responded to
the first mailing. A copy ofthe reminder letter is included in Appendix B. The results of the pilot
129

survey are summarised in Table 4.2.
Table 4.2 Responses to the pilot survey
Number of companies surveyed 25
Number of early responses 7
Early response rate 28 %
Number ofresponses to second mailing 8
Overall response rate 60 %
The overall response rate of 60 % was considered very good and indicated that a full-scale
survey was feasible. Respondents did not appear to experience any difficulty in completing the
questionnaire. One company however provided a double response to question 9. In order to avoid
this in the final survey, question 9 was revised by inclusion of the word "normally", ie. "How are
transferpricing disputes between divisions normal~v settled?" Other than this change to question
9 no other changes were considered necessary to the final questionnaire.
4.7 FINAL SURVEY
For the purposes ofthe full-scale study it was considered appropriate to survey the remaining 254
companies in the population, ie. a 100 % survey. This was done with a view to obtaining the
greatest quantity of information from a broad spectrum of industries.
On 29 January 1997 copies of the final questionnaire together with covering letters were
mailed to all the companies included in the final survey. A follow-up reminder along with a second
copy of the questionnaire was mailed on 27 February 1997 to all companies that had not
responded by this date.
A total of 131 replies were received to the final survey. Ofthese, 11 questionnaires were
returned unanswered either because it was company policy not to· participate in surveys or
because the respondent considered the questionnaire inapplicable. 3 completed questionnaires
130

were considered to be unusable due to internal inconsistencies in the answering of the
questionnaire. This then left a final tally of 117 usable responses, details ofwhich are summarised
in Table 4.3.
Table 4.3 Responses to the final survey
Number of companies surveyed
Number of early responses (usable)
Early response rate
Number ofresponses to second mailing (usable)
Overall response rate
4.8 OVERALL RESPONSE
254
76
30%
41
46%
Considering the fact that the final survey questionnaire differed only slightly from the pilot survey
questionnaire it was considered appropriate to lump together the responses to both surveys for
the purposes ofdata analysis and presentation. The overall usable response rate for both surveys
is presented in Table 4.4. An overall usable response rate of47% compares favourably with the
two most recent widespread studies reviewed in chapter 3, namely Tang (1993) and Borkowski
(1988), who achieved usable response rates of29% and 48% respectively.
Table 4.4 Responses to both surveys
Pilot Final Total
Number ofcompanies surveyed 25 254 279
Total usable responses 15 117 132
Overall response rate 60% 46% 47%
131

4.9 REFERENCES
Borkowski, Susan C. 1988. An investigation into the divergence oftheoQ' from practice regarding
transfer pricing methods. Ann Arbor:UMI.
Cooper, Dona1d R. and C. William Emory. 1995. Business Research Methods. U.S.A: Irwin.
Koen, M. 1982. Die gebruik van oordragpQ'se by die metini van prestasie in 'n iedesentraliseerde
ondememing. University ofPretoria.
Tang, Roger YW. 1979. Transfer Pricing Practices in the United States and Japan. New York:
Praeger.
Tang, Roger Y W. 1993. Transfer Pricing in the 1990s - Tax and Management Perspectives.
Westport : Quorum Books.
Top Companies - Financial Mail Special Survey. 1996. Financial Mail Supplement June 28 1996.
39-59.
132

CHAPTERS
EMPIRICAL RESEARCH FINDINGS
5.1 INTRODUCTION
In this chapter data obtained by means of the questionnaire survey are analysed and presented.
Based on the analysis certain hypotheses are formulated and tested using a statistical technique.
5.2 CHARACTERISTICS OF THE RESPONDENT FIRMS
Industrial classification
The distribution ofthe respondent firms by industrial sector is presented in Table 5.1. The top five
sectors represented in the responses are industrial holding, stores, electronics & electrical, food
and beverages, hotels & leisure which together comprise 58% of the total responses.
Size classification
The respondent firms were classified into three size categories based on total asset values as
reported in the Financial Mail Survey. The three size categories are: 1. companies with total assets
ofless than R200 million, 2. companies with assets between R200 million and RI 000 million and
3. companies with assets above RI 000 million. The distribution ofthe respondent firms amongst
these three categories is presented in Table 5.2.
Interdivisional transferS as a percentaie oftotal sales
Respondent firms were asked to provide an estimate of the value of domestic interdivisional
transfers as a proportion of total group sales. Table 5.3 shows that 44% of companies had
interdivisional transfers comprising more than 5 % oftotal sales.
The extent ofuse of transfer pricing analysed by industty and in total
Table 5.4 presents the extent ofuse of transfer pricing by industry and in total. OveraIl73 out of
132 companies use transfer pricing, representing an overall usage rate of 55%. This is
133

Table 5.1 Industrial classification of the respondent firms
Industrial sector Number of res.pondents Frequency
1. Industrial holding 21 16%
2. Stores 16 12%
3. Electronics & electrical 15 11%
4. Food 13 10%
5. Beverages, hotels & leisure 12 9%
6. Engineering 11 8%
7. Clothing, footwear & textiles 6 4%
8. Building, construction & allied 10 8%
9. Paper & packaging 5 4%
10. Pharmaceutical & medical 4 3%
11. Motor 5 4%
12. Printing & publishing 5 4%
13. Chemicals, oils & plastics 3 2%
14. Transportation 2 2%
15. Furniture, household & allied 1 1%
16. Steel and allied 3 2%
Total 132
134
100%

Table 5.2 Size classification of respondent firms
Total assets eR million) Number of firms
Less than R 200 50
Between R 200 and R I 000 41
Above RI 000 41
132
Table 5.3 Percentage interdivisional transfers
Frequency
38%
31%
31%
100%
% interdivisional transfers Number of firms Frequency
Less than 5 % 70 56%
Between 5 and 10 % 19 15%
Between 10 and 20 % 19 15%
Between 20 and 40 % 10 8%
Above 40 % 8 6%
126*
* 6 companies did not disclose the level of interdivisional trading
135
100%

Table 5.4 The extent of use of transfer pricing analysed by industry and in total
Industrial sector Number of respondents Number usini
transfer pricini rate
1. Industrial holding 21 11 52%
2. Stores 16 9 56%
3. Electronics & electrical 15 10 67%
4. Food 13 9 69%
5. Beverages, hotels & leisure 12 4 33%
6. Engineering 11 8 73%
7. Clothing, footwear & textiles 6 2 33%
8. Building, construction & allied 10 6 60%
9. Paper & packaging 5 2 40%
10. Pharmaceutical & medical 4 0 0%
11. Motor 5 1 20%
12. Printing & publishing 5 4 80%
13. Chemical, oils & plastics 3 2 67%
14. Transportation 2 1 50%
15. Furniture, household & allied 1 1 100%
16. Steel & allied 3 3 100%
Total 132
136
73 55%

considerably less than the 92% usage rate for U.S. companies reported by Tang (1993). The three
highest rates ofusage by industry are evident in the steel & allied (100%), printing & publishing
(80%) and engineering (73%) industries. Rates of usage in total and by industry are graphically
represented in Diagrams 5.1 and 5.2 respectively.
The extent ofuse of transfer pricini analysed by company size
Table 5.5 and Diagram 5.3 present the extent of use of transfer pricing by size category. The
surprising feature here is the fact that there is a greater frequency of transfer price usage among
companies with total assets between R200 million and RI 000 million than the largest companies
with assets above R 1 000 million.
The extent ofuse oftransfer pricini analysed by the level of interdivisional tradini
The extent ofuse of transfer pricing analysed by the level of interdivisional trading is presented
in Table 5.6 and Diagram 5.4. It is not surprising to note that as the level of interdivisional trading
rises the frequency oftransfer price usage increases.
Reasons for not usini transfer pricing
Table 5.7 and Diagram 5.5 present the reasons why companies did not use transfer pricing. The
most frequently cited reason was a low level of interdivisional transfers. A similar finding was
reported by Tang (1993) in respect ofU.S. companies. 26% ofcompanies indicated that they did
not use transfer pricing because their operations were highly decentralised, divisions were treated
as independent operating units and ifthey traded with each other they would do so at arms length.
These groups probably perceive transfer pricing as a form of control mechanism which does not
fit in with the decentralised ~ulture ofthe group.
137

Transfer price usagein total
Do notusetransfer. .prlcmg
(45.00%)
Diagram 5.1
138
Usetransfer. .prlcmg
(55.00%)
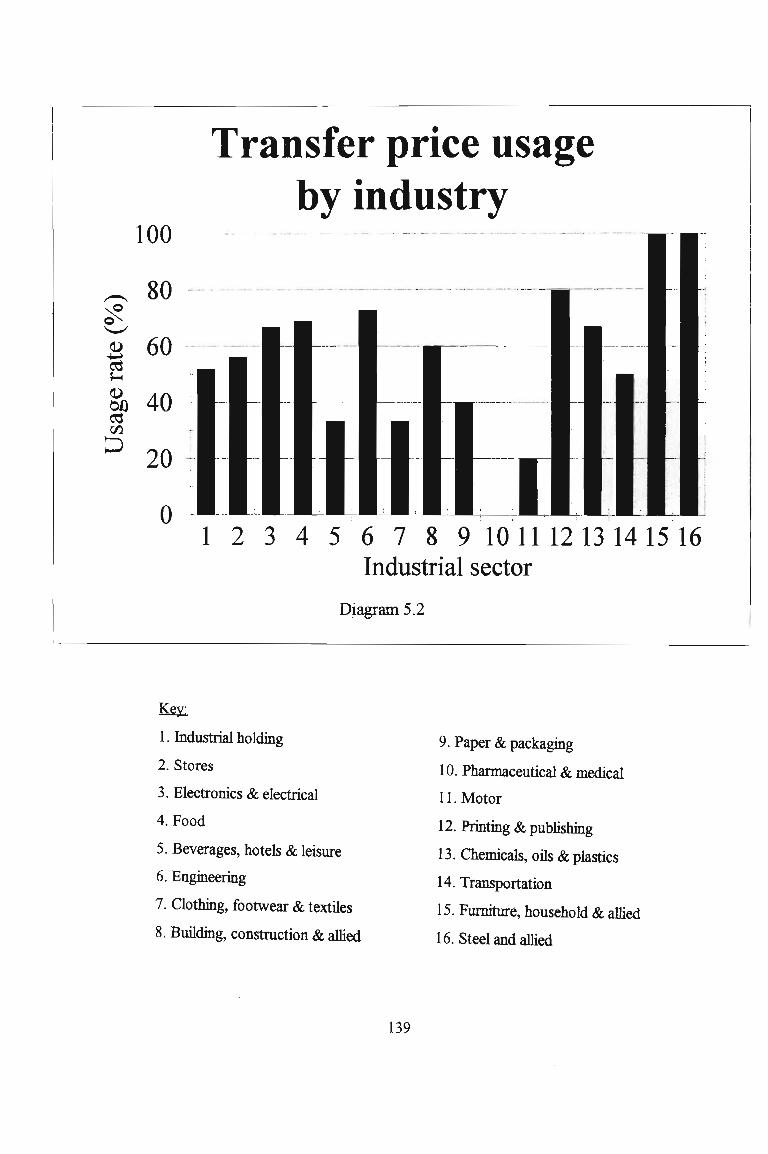
Transfer price usageby industry
100
,,-, 80~'-'"~ 60teM
~ 40OJ)~r.I'l
::J 20
o1 2 3 4 5
Diagram 5.2
~
1. Industrial holding
2. Stores
3. Electronics & electrical
4. Food
5. Beverages, hotels & leisure
6. Engineering
7. Clothing, footwear & textiles
8. Building, construction & allied
139
9. Paper & packaging
10. Pharmaceutical & medical
11. Motor
12. Printing & publishing
13. Chemicals, oils & plastics
14. Transportation
IS. Furniture, household & allied
16. Steel and allied

Table 5.5 The extent of use of transfer pricing analysed by company size
Total assets eR million) Number of firms Number using
transfer pricing rate
Less than R 200
Between R 200 and R 1 000
Above RI 000
50
41
41
132
24
32
17
73
48%
78%
41%
Table 5.6 The extent of use of transfer pricing analysed by the level of interdivisional trading
% interdivisional transfers Number of firms Number using
transfer pricing rate
Less than 5 % 70 26 37%
Between 5 and 10 % 19 15 79%
Between 10 and 20 % 19 16 84%
Between 20 and 40 % 10 9 90%
Above40% 8 7 88%
126* 73
* 6 companies did not disclose the level of interdivisional trading
140

Transfer price usageby company size
80
0- --- -----1 2
Total assetsDiagram 5.3
3
~
1. Total assets less than R 200 million
2. Total assets between R 200 and RI 000 million
3. Total assets above RI 000 million
141
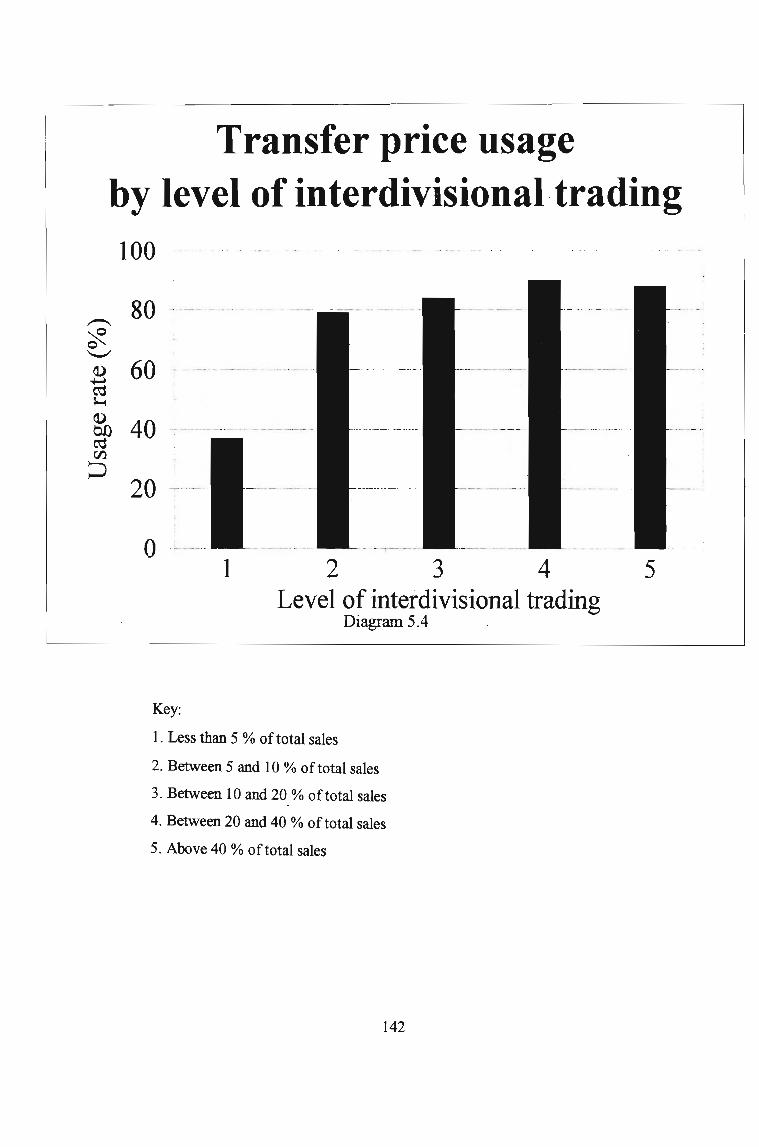
Transfer price usageby level of interdivisional trading100
o -~----
1 234Level of interdivisional trading
Diagram 5.4 .
5
Key:
1. Less than 5 % of total sales
2. Between 5 and 10 % of total sales
3. Between 10 and 20 % oftotal sales
4. Between 20 and 40 % of total sales
5. Above 40 % of total sales
142

Table 5.7 Reasons for not using transfer pricing
Reason
1. Volume ofdomestic interdivisional
sales is insignificant
2. Operations highly decentralised
3. A transfer pricing system is too
complicated to·operate
5. Other
* 2 companies did not provide reasons
143
Number of
comparues
35
15
4
3
57*
FreQJJency
62%
26%
7%
5%
100%

Reasons for not usingtransfer pricing
Other
(62.00%)
Interdivisionalsalesinsignificant
Diagram 5.5
(26.00%)
Operationshighlydecentralised
(5.00%)IComplexity I (7.00%)
144

5.3 TRANSFER PRICING OBJECTIVES
In the questionnaire, companies were asked to rate the importance of seven potential transfer
pricing objectives on a five-point scale as follows:
Point value
Extremely important 5
Very important 4
Moderately important 3
Not too important 2
Not at all important 1
The mean score for a particular objective was calculated by summing the scores for that
objective and dividing by the number ofresponses. Table 5.8 presents a ranking of the objectives
based on their mean scores.
The top two ranked objectives are in general compliance with the academic literature. The
high rating accorded to divisional performance evaluation corroborates the exploratory findings
in respect of S.A. companies reported by Geboers, et al. (1989).
It is surprising to note however, that the objective of goal congruence does not find its
way into the top three rankings. The objective of simplicity and ease of application is rated more
highly than goal congruence, which is ranked number four. One would not have expected this
from a review ofthe transfer pricing literature which generally ignores the issue of simplicity and
ease of application of a particular transfer pricing method and ranks goal congruence as one of
the three main objectives of a transfer pricing system Homgren (1997 6) suggests that ''the
primary criterion for choosing among ahernative accounting systems is how well they help achieve
organisational goals in relation to the costs ofthose systems." It would appear that South African
companies consider this principle as applied in the area of transfer pricing to be of much greater
importance than has hitherto been considered. This finding in respect of goal congruence can also
be contrasted with that of Wu & Sharp (1979) who found that US. companies rate goal
congruence more highly than any other objective.
145

Table 5.8 Ranking of transfer pricing objectives
Ranking
1
2
3
4
5
6
7
Objective Mean-score
To accurately determine the
performance ofdivisions. 4.6
To promote divisional autonomy. 4.0
The method should be simple to
understand and easy to apply. 3.9
To maximise consolidated group profit. 3.2
To comply with the rules and requirements
of external financial reporting. 2.7
To minimise taxation payments. . 2.5
To maximise turnover. 2.2
Companies were also asked to indicate the single most important or dominant objective
oftheir transfer pricing systems. The distribution of the firms by dominant objective is presented
in Table 5.9 and Uiagram 5.6.
The vast majority of companies consider the objective of fair divisional performance
evaluation to be singularly the most important objective to be attained by their transfer pricing
systems, followed by goal congruence and then the promotion of divisional autonomy. Tang
(1993) however found that in the case ofU.S. companies the most frequently cited dominant
objective is goal congruence followed by fair divisional performance evaluation.
146

Table 5.9 Distribution of respondents by dominant transfer pricing objective
Objective Number of
compames
Frequency
1. To accurately determine the performance
ofdivisions. 40 55%
2.To maximise consolidated group profit. 20 27%
3. To promote divisional autonomy. 6 8%
4. To comply with the rules and requirements
of external financial reporting. 3 4%
5. The method should be simple to under-
stand and easy to apply in practice. 4 6%
147
73 100%

Dominant transfer pricing objective
Gaap Simplicitycompliance (6.00%)
(4.00%)(8.00%)
r--------,
Divisionalautonomy
(27.00%)
Maximisegroup profit
Diagram 5.6
148
Divisional:-----+performance
evaluation
(55.00%)

5.4 TRANSFER PRICING METHODS
Number of transfer pricing methods used
Respondents were asked to indicate the number of transfer pricing methods used. The results are
presented in Table 5.10 and Diagram 5.7 and indicate that 32% of companies use more than one
transfer pricing method. While not as high as the 48% for U.S. companies reported by Tang
(1993) this statistic reiterates the point made earlier that there is no single correct transfer pricing
method to suit all circumstances and that even within a single group of companies it is frequently
considered necessary to simultaneously apply more than one transfer pricing method.
Table 5.10 Number ofdomestic transfer pricing methods used
Number ofmethods used Number of companies Frequency
One 50 68%
Two 18 25%
Three 2 3%
Four 2 3%
Five 1 1%
73
149
100%

Number of transfer pricingmethods used
Use 4methods
Use 5(1.00%) methods
Use 3 (3.00%)methods +--- (3.00%
(25.00%)
Use 2methods
Diagram 5.7
150
Use 1method
(68.00%)
Primary transfer pricing methods used by respondent firms
In the questionnaire companies were asked to indicate all the transfer pricing methods used within
the group. Those companies using more than one transfer pricing method were also asked to
identify the main or dominant method used. In the case of companies using one transfer pricing
method only, this method was considered to be the main method. Diagram 5.8 and Table 5.11
provide a summary of the main or primary transfer pricing methods used by the respondents. As
can be seen from Diagram 5.8, overall companies have a slight preference for the use ofnon-cost
oriented methods as their primary transfer pricing methods as opposed to cost-oriented methods.
Table 5.11 indicates that the four most frequently used, and therefore the most important methods
in practice are market price (30%), negotiated price (19%), full produetioncost plus profit (14%)
and full production cost (14%). The use of economic marginal cost or its accounting
approximation ofvariable cost is virtually non-existent with just one company using it. The use
ofother theoretical methods such as cost plus Iumpsum s~bsidy and mathematical programming
prices is totally non-existent. These fmdings are consistent with the findings of the empirical
studies discussed in chapter three.
Secondary transfer pricini methods used by res.pondent firms
Twenty three companies used more than one transfer pricing method. All methods used by these
companies other than the one identified as the main method were classified as secondary methods.
The extent ofuse ofthe various transfer pricing methods as secondary methods is summarised in
Diagram 5.9 and Table 5.12. The most frequently used secondary method is negotiated price.
Comparison ofmethods used with other studies
The findings ofthe current study in respect ofthe transfer pricing methods used by South African
companies are compared with the findings of the two most recent widespread studies into
domestic transfer pricing practices discussed in chapter three, namely Tang (1993) and Borkowski
(1988). Since Tang did not separately identify secondary transfer pricing methods used but
reported on all methods used and Borkowski reported on primary methods only, the comparative
analysis will be split into two separate tables. Table 5.13 shows a comparison between the
primary transfer pricing methods used by South African and U.S. companies while Table 5.14
reflects a comparison based on all transfer pricing methods used, ie. both primary and secondary
151

Primary transfer pricingmethods used
Non-costoriented
(53.00%)
Diagram 5.8
152
Cost-oriented
(47.00%)
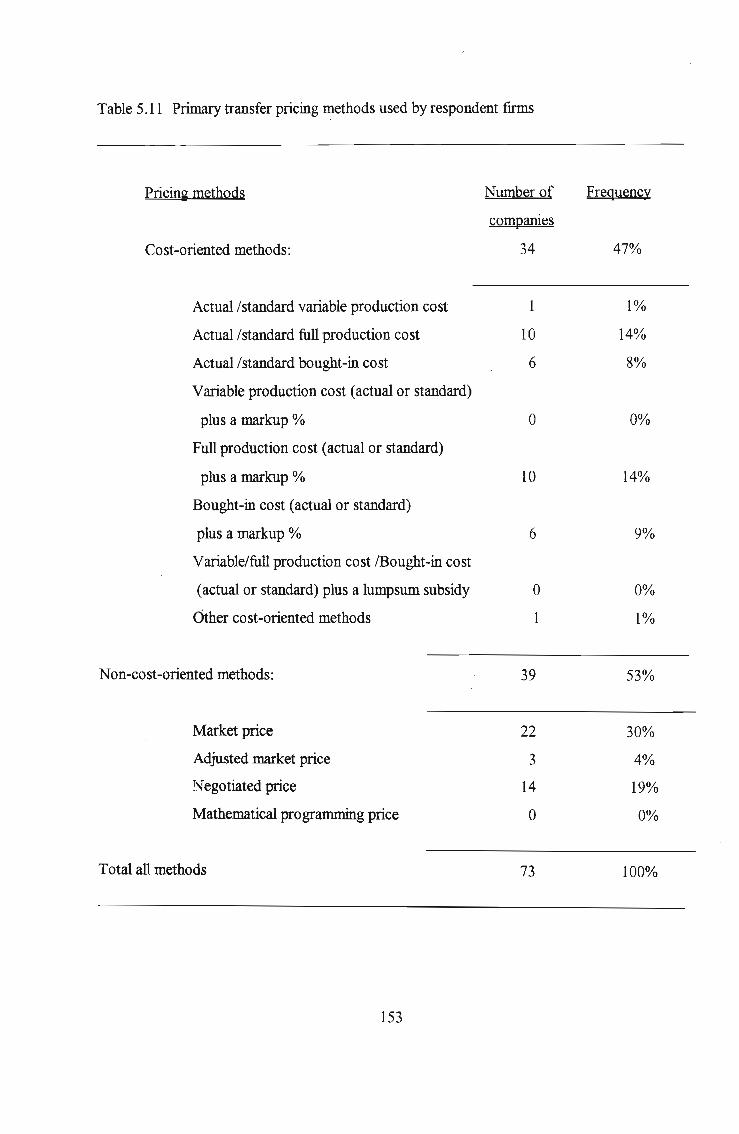
Table 5.11 Primary transfer pricing methods used by respondent firms
Pricing methods
Cost-oriented methods:
Number of
compames
34
Frequency
47%
Actual /standard variable production cost 1 1%
Actual /standard full production cost 10 14%
Actual /standard bought-in cost 6 8%
Variable production cost (actual or standard)
plus a markup % 0 0%
Full production cost (actual or standard)
plus a markup % 10 14%
Bought-in cost (actual or standard)
plus a markup % 6 9%
Variable/full production cost /Bought-in cost
(actual or standard) plus a lumpsum subsidy 0 0%
Other cost-oriented methods 1 1%
Non-cost-oriented methods: 39 53%
Market price 22 30%
Adjusted market price 3 4%
Negotiated price 14 19%
Mathematical programming price 0 0%
Total all methods 73 100%
153

Secondary transfer pricingmethods used
Non-costoriented
(47.00%)
Diagram 5.9
154
Cost-oriented
(53.00%)

Table 5.12 Secondary transfer pricing methods used by respondent firms
Pricing methods Number of times Frequency
method cited
Cost-oriented methods: 17 53%
Actual/standard variable production cost 1 3%
Actual/standard full production cost 1 3%
Actual/standard bought-in cost 4 13%
Variable production cost (actual or standard)
plus a markup % 0 0%
Full production cost (actual or standard)
plus a markup % 6 19%
Bought-in cost (actual or standard)
plus a markup % 5 15%
Variable/full production cost /Bought-in cost
(actual or standard) plus a lumpsum subsidy 0 0%
Non-cost-oriented methods: 15 47%
Market price 2 6%
Adjusted market price 1 3%
Negotiated price 11 35%
Mathematical programming price 0 0%
Other non-cost-oriented methods 1 3%
Total all methods 32 100%
155

Table 5.13 A comparison ofprimary transfer pricing methods used
Pricing methods
Cost-oriented methods:
Cost
Cost plus profit
Other cost-oriented methods
Non-cost-oriented methods:
Market price-based
Negotiated price
Total all methods
South Africa
Present study
47%
23%
23%
1%
53%
34%
19%
100%
United States
*Borkowski (1988)
44%
24%
18%
2%
56%
33%
23%
100%
*Source: Adapted from Borkowski, SC. 1988. An investigation into the divergence of theory
from practice regarding transfer pricing methods. Ann Arbor: UMI. 96.
156
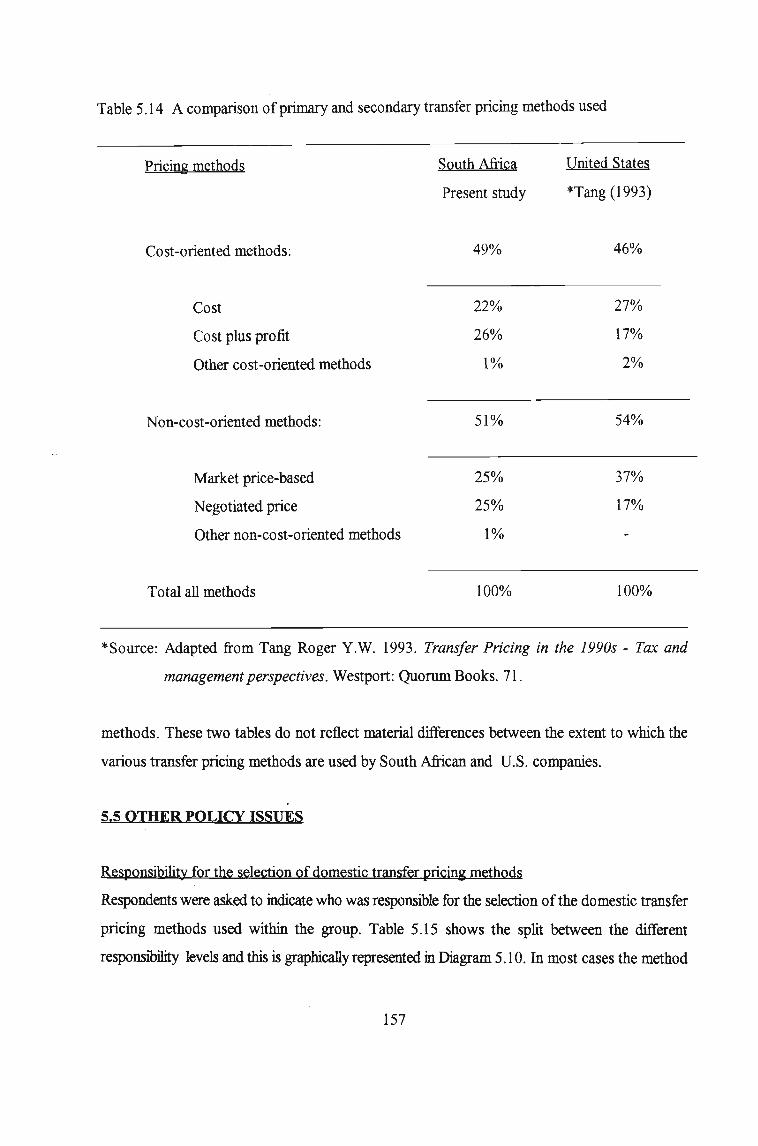
Table 5.14 A comparison of primary and secondary transfer pricing methods used
Pricing methods
Cost-oriented methods:
Cost
Cost plus profit
Other cost-oriented methods
Non-cost-oriented methods:
Market price-based
Negotiated price
Other non-cost-oriented methods
Total all methods
South Africa
Present study
49%
22%
26%
1%
51%
25%
25%
1%
100%
United States
*Tang (1993)
46%
27%
17%
2%
54%
37%
17%
100%
*SoUfce: Adapted from Tang Roger Y.W. 1993. Transfer Pricing in the 1990s - Tax and
management perspectives. Westport: Quorum Books. 71.
methods. These two tables do not reflect material differences between the extent to which the
various transfer pricing methods are used by South African and U.S. companies.
5.5 OTHER POLICY ISSUES
Responsibility for the selection of domestic transfer pricina methods
Respondents were asked to indicate who was responsible for the selection ofthe domestic transfer
pricing methods used within the group. Table 5.15 shows the split between the different
responsibility levels and this is graphically represented in Diagram 5.10. In most cases the method
157

Table 5.15 Responsibility for the selection ofdomestic transfer pricing methods
Level of responsibility
1. Head office management
2. Divisional management
3. Head office management after close
consultation with divisional management
Number of
comparues
21
20
32
73
Frequency
29%
27%
44%
100%
is selected by head office management after close consuhation with the divisions. A similar finding
was reported by Tang (1993) in respect ofU.S. companies
Outside purchase policy
Respondents were asked to indicate whether they were permitted to purchase outside the group
goods and services which are available internally. Their responses are presented in Table 5.16.and
Diagram 5.11. In most cases divisions are only permitted to deal externally after obtaining head
office approval. Again a similar finding was reported by Tang (1993) in respect of U.S.
compames.
Settlement of transfer price disputes
Respondents were asked to indicate how transfer pricing disputes between divisions were
normally settled. Their responses are presented in Table 5.17 and Diagram 5.12. In most cases
transfer price disputes are resolved by head office management after close consultations with the
divisions. In very few cases are disputes unilaterally resolved by head office management. Tang
158

Responsibility for the selection oftransfer pricing methods
Head office &divisionalmanagement
(44.00%)
Diagram 5.10
159
Head officemanagement
(29.00%)
Divisionalmanagement
(27.00%)
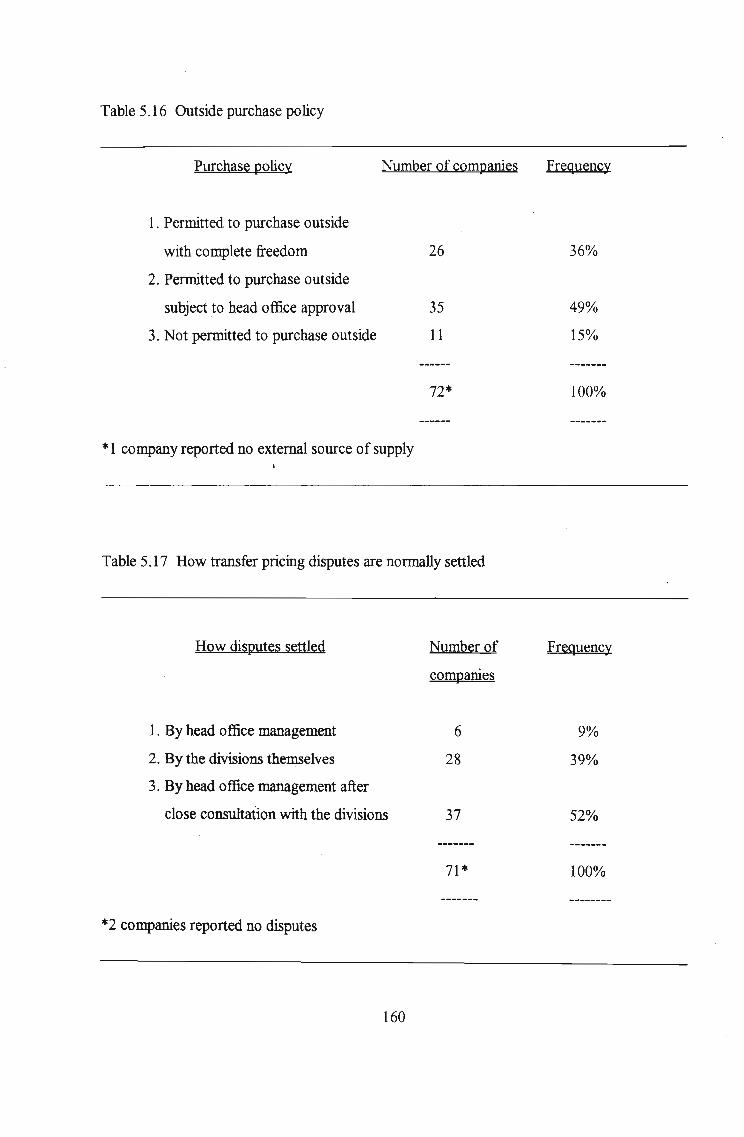
Table 5.16 Outside purchase policy
Purchase policy
1. Permitted to purchase outside
with complete freedom
2. Permitted to purchase outside
subject to head office approval
3. Not permitted to purchase outside
Number of companies
26
35
11
72*
Frequency
36%
49%
15%
100%
*I company reported no external source of supply
Table 5.17 How transfer pricing disputes are normally settled
How disputes settled Number of Freq.uency
compames
1. By head office management 6 9%
2. By the divisions themselves 28 39%
3. By head office management after
close consultation with the divisions 37 52%
71*
*2 companies reported no disputes
160
100%

Outside purchase policy
Outsidepurchasesnotpermitted
(49.00%)
Diagram 5.11
161
Outsidepurchasespermittedfreely
(36.00%)
Outsidepurchasespermitted,subject to headoffice approval

Settlement of transfer price disputes
Head officemanagement
Head office& divisionalmanagement
(52.00%)
Diagram 5.12
162
Divisionalmanagement
(39.00%)
(1993) on the other hand reported that most U.S. companies settled transfer price disputes
through negotiations between the divisions themselves.
5.6 IDENTIFICATION OF HYPOTHESES
Based on the literature review and the preliminary data analysis the following hypotheses are
identified for specific testing:
The extent of application of cost-oriented or non-cost-oriented domestic transfer
prices among large listed South Mrican industrial companies does not vary
according to
1) the size of these companies.
2) the level of interdivisional trading within these companies.
3) the main (ie. dominant) objective of these companies' transfer pricing
systems.
4) the responsibility level within these companies at which the transfer
pricing method is selected.
5) the outside purchase policies of these companies relating to goods and
services available internally.
6) the manner in which transfer pricing disputes between divisions are
normally settled.
5.7 IDENTIFICATION OF THE APPROPRIATE STATISTICAL TEST
In hypotheses 1 to 6 above we wish to establish whether there is an association between the
orientation of the transfer pricing method used by a company and a particular organisational
variable. Letcbford (1982 88) identifies chi-square testing as an appropriate statistical test ''when
determining whether there is an association between two attributes which members of a
population mayor may not possess."
Under chi-square testing the null hypothesis always is that there is no association between
163

two attributes. Ifthe computed chi-square value for a particular data set is greater than the critical
test value then the null hypothesis is rejected, implying a relationship between the two attributes.
On the other hand, if the computed chi-square value is less than the critical test value the
hypothesis is accepted, implying the lack ofa relationship between the two attributes. The critical
test value is obtained from a standard chi-square distribution table.
In order to apply chi-square testing the data need to be arranged into contingency tables
with appropriate row and column headings. Row totals and column totals are calculated by
summing the observed values in each row and column. Expected values for each cell are
computed according to the following formula:
Expected cell value = Row total * Column totalNumber of observations
The computed chi-square value is then calculated according to the following formula:
where, X2 = computed chi-square value
o = observed contingency table cell value
E = expected contingency table cell value
The critical test value to be selected from a chi-square distribution table is a function of
the level of significance (alpha risk or the risk of an incorrect rejection) and the degrees of
freedom associated with the data set. Alpha risk for this study is set at 10%. The relevant degrees
offreedom for a particular contingency table is objectively computed according to the following
formula:
d.f = (R-I) * (C-l)
where, d.f. = degrees of freedom
R = number ofrows
C = number ofcolumns
164

Cooper & Emory (1995452) caution that chi-square testing should not be used ifany of
the expected cell values in a contingency table are less than 1 or ifmore than 20% ofthe cells in
a contingency table have an expected value of less than 5. Should this occur they suggest that
expected cell counts be increased by combining two or more categories, ie. collapsing the data
into fewer categories.
5.8 HYPOTHESES TESTING
Preliminary tests
The statistical software package Minitab was used to generate computed chi-square values.
Preliminary chi-square testing indicated that none of the contingency tables had expected cell
counts ofless than 1. However the contingency tables for hypotheses two, three and six reflected
expected cell values of less than 5 for more than 20% of the cells. This made it necessary to
collapse the data in these tables into fewer categories. This was achieved as follows:
1. In respect ofhypothesis two the last two categories of % interdivisional transfers ie. "between
20 and 40%" and "above 40%" (refer Table 5.6) were combined into one category "greater than
20%."
2. In respect ofhypothesis three, the three least frequently cited dominant objectives of divisional
autonomy, gaap compliance and simplicity (refer Table 5.9) were combined into one category
referred to as "miscellaneous."
3. In respect of hypothesis 6, the number of categories for the manner in which disputes are
normally settled was reduced from three (see Table 5.17) to two by combining the categories of
settlement ''by head office management" and settlement "by head office management after close
consultation with the divisions." This resulted in a contingency table with two categories only, ie.
disputes normally settled with some head office intervention and disputes normally settled by the
divisions themselves.
165

Final tests
The final contingency tables for hypotheses I to 6 are presented in Tables 5.18 to 5.23. The data
contained in these tables was fed into a computer using Minitab, a statistical software package.
Details of the output generated by this program are included in Appendix C. Table 5.24
summarises the results ofthe statistical tests. As can be seen from Table 5.24 hypotheses 1, 3 and
5 cannot be rejected as in all cases the computed chi-square value is less than the critical test
value. Hypotheses 2, 4 & 6 are however rejected because the computed chi-square value is
greater than the critical test value at alpha == 10% in respect ofhypothesis 2 and alpha == 1% in
respect ofhypotheses 4 & 6.
Specific conclusions .
1. The finding in respect of company size (hypothesis 1) coincides with Tang's (1993) findings
in respect ofUS. companies, ie. there is no association between company size and the orientation
of the transfer pricing method used.
2. The finding in respect of hypothesis two suggests that companies with a low level of
interdivisiona1 trading (less than 20%) have a tendency to use non-cost oriented transfer pricing
methods whereas companies with a high level of interdivisional trading (greater than 20%) prefer
to use cost-oriented methods.
3. The finding in respect of transfer pricing objectives (hypothesis 3) conflicts with that of
Borkowski (1988). Borkowski found that in respect ofUS. companies there is an association
between transfer pricing objectives and the type of transfer pricing method used. No such
association is evident in the case of South African companies.
4. The specific conclusion to be drawn by rejecting hypothesis 4 is that there is a significant
asso~tion between the responsibility level within the organisation at which the transfer price is
selected and the type of transfer price used. Borkowski (1988) also reported a similar finding.
Specifically, the findings of the current study are that transfer price methods selected as a result
of some head office plaIlagement involvement tend to be cost-oriented whereas methods selected
by divisional management themselves tend to be non-cost-oriented.
166

Table 5.18 Hypothesis 1: Company size and the orientation of domestic transfer pricing methods
Total assets eR million)
Transfer pricing
method
Cost-oriented
Non-cost-oriented
Less than
R200
14
10
24
Between R 200
and RI 000
15
17
32
Above
RI000
5
12
17
34
39
73
Table 5.19 Hypothesis 2: Level of interdivisional trading and the orientation ofdomestic transfer
pricing methods
Level of interdiyisional trading
Transfer pricing less than lli 10 to greater Total
method lli 10% 20% than 20%
Cost-oriented 13 6 4 11 34
Non-cost-oriented 13 9 12 5 39
26 15
167
16 16 73

Table 5.20 Hypothesis 3: The main transfer pricing objective and the orientation of domestic
transfer pricing methods
Main transfer pricing objective
Performance Miscell-Transfer pricing method Goal
congruence evaluation aneous
Cost-oriented
Non-cost-oriented
6
14
20
21
19
40
7
6
13
34
39
73
Table 5.21 Hypothesis 4: Responsibility for transfer price selection and the orientation ofdomestic
transfer pricing methods
Method selected by
Transfer pricing method Head office Divisional Head office Th1al
management manaiement & division
Cost-oriented 14 2 18 34
Non-cost-oriented 7 18 14 39
21
168
20 32 73

Table 5.22 Hypothesis 5: Outside purchase policy and the orientation ofdomestic transfer pricing
methods
Transfer pricing method
Outside purchase policy
*Policy 1 **Policy 2 ***Policy 3 Total
Cost-oriented
Non-cost-oriented
9
17
26
16
19
35
8
3
11
33
39
72****
*Policy 1- Permitted to purchase outside with complete freedom
**Policy 2 - Permitted to purchase outside subject to head office approval
***Policy 3 - Not permitted to purchase outside
**** 1 company reported no external source of supply
Table 5.23 Hypothesis 6: Manner of settling transfer price disputes and the orientation of
domestic transfer pricing methods
Transfer pricing method
Disputes settled by
Some head office Divisional
Cost-oriented
Non-cost-oriented
*2 companies reported no disputes
involvement
25
18
43
169
management
7
21
28
32
39
71*

Table 5.24 Summary of statistical tests
chi-square freedom
Hypothesis Computed Degrees of Critical test value
5% 1%
significance significance significance
1 3.347 2 4.60*
2 6.538 3 6.25**
3 3.049 2 4.60*
4 15.363 2 4.60** 5.99** 9.21 **
5 4.523 2 4.60*
6 7.523 1 2.71 ** 3.84** 6.64**
* Relationship is not significant - hypothesis cannot be rejected
** Relationship is significant - hypothesis may be rejected
5. The failure to reject hypothesis 5 suggests that the outside purchase policies of a company in
respect ofintermediate products appear to have no association with the choice of transfer pricing
method.
6. The conclusion to be drawn from rejecting hypothesis 6 is that there is a significant association
between the manner in which divisional transfer price disputes are normally settled and the
orientation ofthe transfer pricing method used. Specifically, in those companies in which disputes
are normally settled by some form ofhead office management involvement cost-oriented transfer
pricing methods tend to be used, whereas in the case ofcompanies in which disputes are settled
by the divisions themselves without any head office intervention, non-cost-oriented methods are
more likely to be used.
170

5.9 CONCLUSION
In this chapter the characteristics ofthe respondent firms were analysed and the research findings
presented. Where appropriate comparisons were made with the findings of previous studies. The
research findings may be summarised as follows:
Transfer pricing objective
South African companies identify the facilitation offair divisional performance evaluation as the
most important objective to be achieved by their domestic transfer pricing systems.
Transfer pricing method
Singularly, the most popular primary transfer pricing method used by South African companies
is market price.
The responsibility for the selection of the transfer pricing method
In most South African companies, the transfer pricing method to be used is selected by head office
management after close consultation with divisional management.
Outside purchase policy
In most South African companies, divisions are permitted to purchase from outside the group
goods and services which are available internally, provided approval to do so is obtained from
head office.
Settlement of transfer price disputes
In most cases, transfer price disputes between divisions are normally settled by head office
management after close consultation with the divisions.
Organisational variables and the choice of transfer pricing methods
No significant association was found between the organisational variables listed below and a
firm's choice of transfer price:
171

I.Size.
2. Main transfer pricing objective.
3. Outside purchase policy.
There is however a significant association between the following three organisational
variables and the choice of transfer price:
1. The level of interdivisional trading
2. The levelofresponsibility at which the transfer pricing method is selected.
3. The manner in which divisional transfer price disputes are normally settled.
Specifically it was found that firstly, companies with a low level of interdivisional trading
use non-cost-oriented transfer pricing methods whereas companies with a high level of
interdivisional trading use cost-oriented methods.
Secondly, it was found that transfer pricing methods selected as a result of some head
office management involvement tend to be cost-oriented methods whereas those methods selected
by the divisions themselves tend to be non-cost-oriented methods.
Thirdly, the manner in which disputes between divisions are normally settled also
correlates with a firm's choice oftransfer price. In companies where disputes are normally settled
by some form ofhead office intervention, cost-oriented methods tend to be used. Where disputes
are normally settled by the divisions themselves non-cost-oriented methods tend to be used.
The latter two findings would tend to suggest that the more centralised the decision
making process within a group is, the more likely is it to use a cost-oriented method. On the other
hand less centralised groups are more likely to use non-cost-oriented transfer pricing methods.
172

5.10 REFERENCES
Borkowski, Susan C. 1988. An investigation into the divergence oftheory from practice regarding
transfer pricing methods. Ann Arbor: lJMI.
Cooper, Donald R. and C. William Emory. 1995. Business Research Methods. U.S.A: Irwin.
Geboers, A.A.P.e., et al. 1989. An exploratory survey of transfer pricing in selected South
Afiican listed companies. South Afiican Journal ofBusiness Management 20 (March):27-31.
Homgren, et al. 1997. Cost Accounting - A Managerial Emphasis, 9 th edition. New Jersey:
Prentice Hall.
Letchford, S. 1982. Statistics Workbook For accountancy and business students. London: Gee
&Co.
Tang, Roger Y W. 1993. Transfer Pricing in the 1990s - Tax and Management Perspectives.
Westport : Quorum Books.
Wu F.H. & D. Sharp. 1979. An empirical study of transfer pricing practice. The International
Journal ofAccounting Education and Research. Spring: 71-99.
173

CHAPTER 6
CONCLUSION
6.1 SUMMARY OF FINDINGS
An analysis of transfer pricing theory suggests that there is no single correct transfer pricing
method to suit all circumstances. Each method has its advantages and disadvantages, depending
on the circumstances. The most appropriate method to suit a particular set of circumstances is
dependant on those circumstances.
A review of past empirical studies into transfer pricing practices suggests that the
economic theories of Hirshleifer and complex mathematical programming methods find little
support by way ofpractical application. Despite academic criticism of full cost based methods,
such methods enjoy considerable support in practice, perhaps because of their ease of application.
The fmdings of the empirical investigation may be summarised as follows. The main
objective of the transfer pricing systems employed by large listed South African industrial
companies is the facilitation offair divisional performance evaluation. Overall, the transfer pricing
methods used by South African companies are fairly evenly spread between cost and non-cost
oriented methods. Singularly, the most frequently used primary method is market price. Policies
relating to the selection of the transfer pricing method, the purchase of intermediate goods and
services and the settlement of transfer pricing disputes reflect some head office management
involvement in the transfer price decision process in most cases.
A significant association was found between the following three organisational variables
and a firm's choice oftransfer pricing method:
1. The level of interdivisional trading.
2. The level ofresponsibility within the organisation at which the transfer pricing
method is selected.
3. The manner in which divisional transfer price disputes are normally settled.
174
6.2 LIMITATIONS OF THE RESEARCH
1.The population surveyed consisted of large listed South African industrial companies. The
results of the research may therefore not be extended to non-industrial, unlisted or small
compames.
2. Certain organisational variables were tested for association with the orientation of the transfer
pricing methods used. Perhaps other more significant variables impacting on a firm's choice of
transfer pricing method exist and have been ignored for testing (Borkowski 1988 52).
3. Whilst the survey responses were reviewed for internal inconsistencies (and three
questionnaires were in fact excluded from the count of usable responses because of internal
inconsistencies) the validity of the responses is difficult to assess. Not all responses were
completed by the group financial director. Thus the persons completing the questionnaires may
not in all cases be ideally suited to do so.
6.3 AREAS FOR FUTURE RESEARCH
1. There is a greater frequency of transfer price usage amongst companies with total assets
between R200 million and RI 000 million than the largest companies with assets above RI 000
million. This is an unexpected finding and the reasons therefore need to be investigated more
thoroughly.
2. The reason for the significant relationship between the three organisational variables (l.1evel
of interdivisional trading, 2. responsibility for the selection ofthe transfer pricing method and 3.
the manner of settling disputes) and the orientation of the transfer pricing method needs to be
investigated further. Is there a special reason for this or are the relationships merely coincidental?
3. No significant association was found between the main transfer pricing objective and the
orientation ofthe transfer pricing system On what basis then do firms select a particular transfer
pricing method? Perhaps a case study research focussing on a small group of companies could be
175

undertaken to study this more in depth.
4. The scope of the study was limited to domestic transfer pricing. A future study could
investigate the international dimensions oftransfer pricing from a South African perspective. This
is likely to become increasingly important for South African companies as exchange control
regulations on outward investment are dismantled and South African companies engage in more
international trade.
5. The survey covered listed companies only. The transfer pricing practices ofunlisted entities
could be investigated.
6. Only industrial companies were investigated in this study. A future study could focus on
transfer pricing practices in the mining and financial seryices industries. Perhaps a comparative
analysis could be undertaken ofthe practices in these industries.
176

6.4 REFERENCE
Borkowski, Susan C. 1988. An investigation into the divergence oftheory from practice regarding
transfer pricing methods. Ann Arbor:UMI.
177

BmLIOGRAPHY
• Benke, Ralph L.,lr., and lames Don Edwards. 1980. Transfer Pricing: Techniques and Uses.
New York: National Association ofAccountants.
• Borkowski, Susan C. 1988. An investigation into the divergence of theory from practice
regarding transfer pricing methods. Ann Arbor:UMI.
• Cooper, Donald Rand C. WtlliamEmory. 1995. Business Research Methods. U.S.A: Irwin.
• EmmanueL C.R & Kenneth P. Gee. 1982. Transfer pricing: a fair and neutral procedure. In
Readings in Accounting for Manaiement Control. Emmanuel, OtIey and Merchant (editors).
London: Chapman & Hall.415-424.
• EngIer, Calvin.1987. Managerial Accounting.705. Homewood, m. :Irwin.
• Grabski, S.V. 1985. Transfer pricing in complex organisations: a review and integration of
recent empirical and analytical research. In Readings in Accounting for Management Control.
EmmanueL Otleyand Merchant (editors). London: Chapman & Hall. 453-495.
• Hirshleifer, Jack. 1964. Internal Pricing and Decentralized Decisions. In Manaaement
Controls: New Directions in Basic Research. Bonini, Jaedicke, and Wagner (editors). New
York: Mc Graw Hill, Inc.27-37.
• Homgren, et al. 1997. Cost Accounting - A Ma.na,aerial Emphasis, 9 th edition. New Jersey:
Prentice Hall.
178

• Johnson, HT. and Kaplan, R.S. 1987. Relevance Lost: the Rise and Fall of Management
Accounting. Boston: Harvard Business School Press.
• Koen, M. 1982. Die gebruik van oordragpryse by die meting van prestasie 10 'n
gedesentraliseerde onderneming. University of Pretoria.
• Stock Exchange Handbook. The. 1996. (July-Dec). Johannesburg: Profile Media.
• Letchford, S. 1982. Statistics Workbook For accountancy and business students. London:
Gee &Co.
• Solomons, David. 1965. Divisional Performance: Measurement and Control. Homewood,
Ill. :Irwin.
• Spicer, RH. 1988. Towards an organizational theory of the transfer pricing process. In
Readings in Accounting for Management Control. Ernmanuel, Otley and Merchant (editors).
London: Chapman & Hall.425-452
• Tang, Roger Y.W. 1979. Transfer Pricing Practices in the United States and Japan. New
York: Praeger.
• Tang, Roger Y W. 1993. Transfer Pricing in the 1990s - Tax and Management Perspectives.
Westport : Quorum Books.
• Thomas, Arthur L. 1980. A Behavioural Analysis of Joint-Cost Allocation and Transfer
Pricing. Charnpaign, III : Stipes Publishing Company.
• Watson, D.J.H. and John V. Baumler. 1975. Transfer pricing: a behavioural context. In
Readings in Accounting for ManSliernent Control. Ernmanuel, Otley and Merchant (editors).
179

London: Chapman & Hall. 403-414.
• Young, Alexander. 1979. Pricing Decisions. London: Business Books Limited.
Journals
• Abde1-Khalik, A. Rashad and Edward 1. Lusk. 1974. Transfer Pricing-A Synthesis. The
Accounting Review 49 (January): 8-23.
• Baumo~ Wtlliam 1., and Tiber Fabian. 1964. Decomposition, Pricing for Decentralization and
External Economies. Management Science 11 (September): 1-32.
• Bierman, Harold, Jr. 1959. Pricing Intracompany Transfers. The Accounting Review 34
(July): 429-432.
• Choudhury, N. 1979. Transfer pricing practices: room for debate. Accountancy (England) 90
(August): 105-106.
• Cook, Paul W. 1955. Decentralization and the Transfer-Price Problem. Journal ofBusiness
28 (April): 87-94.
• Edwards,1. Don, and Roger A. Roemmich. 1976. Transfer Pricing: The Wrong Tool for
Performance Evaluation. Cost and Management 50 (January - February): 35-37.
• Ezzamel, M.A. and K. Hilton. 1980. Divisionalisation in British Industry: a Preliminary
Study. Accounting and Business Research 10 (Spring): 197-214.
• Finnie, 1. 1978. Transfer pncmg practices. Management Accounting (U.K.) 56
(December):494-497.
180
• Fremgen, lames M. 1970. Transfer Pricing and Management Goals. Management Accounting
(D.S.A) 52 (December): 25-31.
• Geboers, AAP.C., et a!. 1989. An exploratory survey of transfer pricing in selected South
African listed companies. South African Journal ofBusiness Management 20 (March):27-31.
• Goetz, Billy E. 1967. Transfer Prices: An Exercise in Relevancy and Goal Congruence. The
Accounting Review 42 (July):435-440.
• Gordon, Myron 1. 1970. A Method of Pricing for a Socialist Economy. The Accounting
Review 45 (July):427-443.
• Hirshleifer, Jack. 1956. On the Economics of Transfer Pricing. Journal of Business 29
(July): 172-184.
• HoIstrum, Gary L., and E. H. Sauls. 1973. The Opportunity Cost Transfer Price. Management
Accounting (U.S.A) 54 (May):29-33.
• Onsi, Mohamed. 1970. A Transfer Pricing System Based on Opportunity Cost. ~
Accounting Review 45 (July):535-543.
• Schwab, Richard 1. 1975. A Contribution Approach to Transfer Pricing. Management
Accounting (U.S.A.) 56 (February):46-48.
• Vendig, Richard E. 1973. A Three-Part Transfer Price. Manaiement Accountini (D.S.A)
55 (September):33-36.
• Wu F.H. & D. Sharp. 1979. An empirical study oftransfer pricing practice. The International
181

Journal of Accounting Education and Research. Spring: 71-99.
Magazines
• Income Tax: Transfer Price Trap. 1995. Financial Mail. 26 May 1995.42-43.
• Top Companies - Financial Mail Special Survey. 1996. Financial Mail Supplement June 28
1996.39-59.
182

APPENDIX A: Pilot Survey Questionnaire
25 November 1996
The Financial DirectorX LimitedPO Box 123Durban4000
Dear Sir
An investigation into the domestic transfer pricing practices of large listed South Africanindustrial companies
Enclosed please find a questionnaire relating to the above topic. Completion of the questionnairerequires approximately 10-12 minutes of your valuable time and a maximum ofonly 9 questionswill have to be answered by you. These questions are easily answerable by placing an "X" in theappropriate box.
Respondents are assured that no company will be identified by name in any report emanating fromthis study nor will the questionnaires be made available to any other person.
By responding to this questionnaire you are assisting me greatly in the successfulcompletion of my Masters dissertation and I thank you for your co-operation.
All respondents to the questionnaire will be provided with a free copy of a reportsummarising the results of the study.
A stamped return envelope is enclosed for your convenience.
Yours sincerely
Imtiaz VallySenior lecturer
183

SURVEY QUESTIONNAIRE
Company:
AN INVESTIGATION INTO THE DOMESTIC TRANSFER PRICING PRACTICES OFLARGE LISTED SOUTH AFRICAN INDUSTRIAL COMPANIES
INTRODUCTIONThis questionnaire is designed to obtain information relating to the domestic transfer pricingpractices oflarge listed South African industrial companies. Whilst all questions may be answeredby simply placing an "X" in the appropriate box you may provide additional comments whereveryou wish.
For the purposes of this questionnaire the following terms are used as defined:
TRANSFER PRICE: The price that is attached to goods and services that are transferredbetween the parent company and divisions or between divisions/branches of the same group.
GOODS AND SERVICES: Allocations of central administrative overhead expenses areexcluded from the definition of goods and services.
DOMESTIC TRANSFERS: Transfers that take place within the borders of the Republiconly. International interdivisional transfers fall beyond the scope ofthis questionnaire and are tobe ignored.
OUESTION 1
Please provide an estimate of the value of domestic interdivisional transfers as a proportion oftotal group sales.
Less than 5 % DBetween 5 % and 10 % DBetween 10 % and 20 % DBetween 20 % and 40 % DAbove40% D
QUESTION 2
Does your group use transfer pricing to account for the domestic interdivisional transfers ofgoods and services?
Yes D If yes please continue with the rest of the questionnaire.
No D Ifno, please skip to question 10.
184
IQUESTION3

OUESTION3
Please indicate below the transfer pricing methods that are used within your group to account forthe domestic interdivisional transfers of goods and services. (You may check more than onemethod ifmore than one method is used.)
Market price
Market price less selling expenses
Negotiated price
Mathematical programming price
Actual variable production cost
Standard variable production cost
Actual full production cost
Standard full production cost
Actual bought-in cost
Standard bought-in cost
Variable production cost (actual or standard) plus a markup %
Full production cost (actual or standard) plus a markup %
Bought-in cost (actual or standard) plus a markup %
Variable production cost (actual or standard) plus a lumpsum subsidy
Full production cost (actual or standard) plus a lumpsum subsidy
Bought-in cost (actual or standard) plus a lumpsum subsidy
Other (please specifY) .........................................................................................................
185
oooooooooooooooo
IQUESTION 4
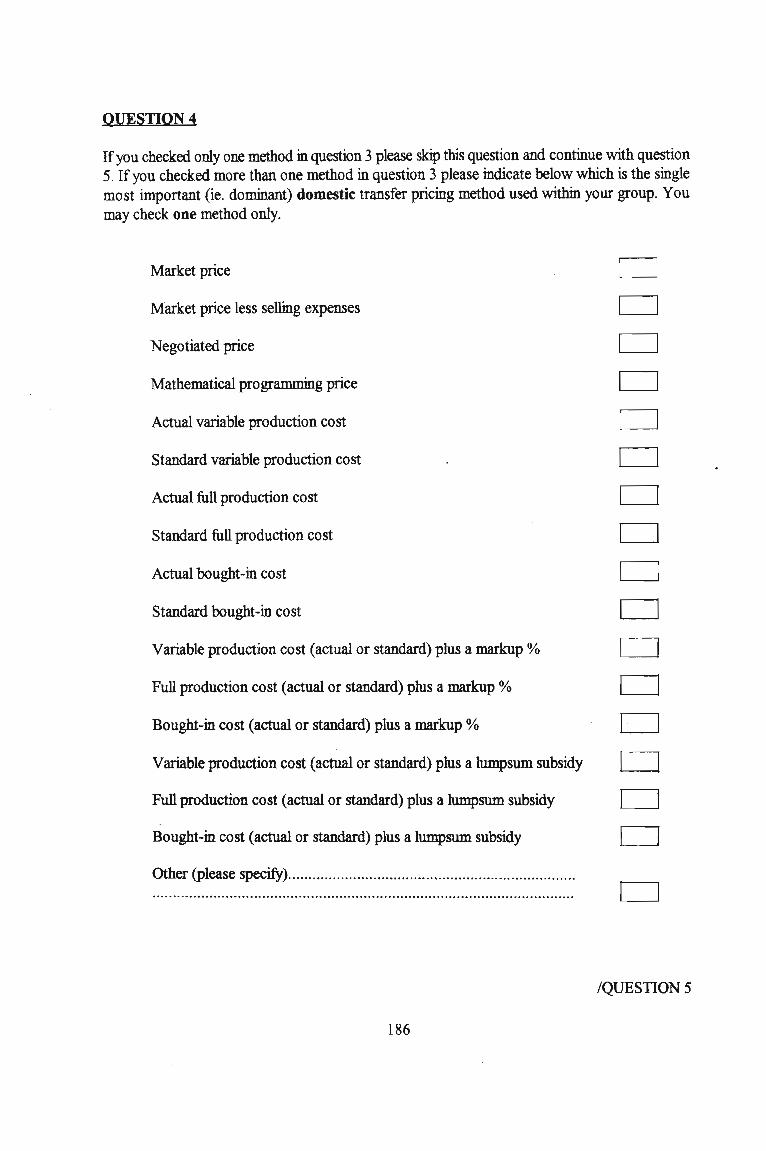
OUESTION4
Ifyou checked only one method in question 3 please skip this question and continue with question5. Ifyou checked more than one method in question 3 please indicate below which is the singlemost important (ie. dominant) domestic transfer pricing method used within your group. Youmay check one method only.
Market price
Market price less selling expenses
Negotiated price
Mathematical programming price
Actual variable production cost
Standard variable production cost
Actual full production cost
Standard full production cost
Actual bought-in cost
Standard bought-in cost
Variable production cost (actual or standard) plus a markup %
Full production cost (actual or standard) plus a markup %
Bought-in cost (actual or standard) plus a markup %
Variable production cost (actual or standard) plus a lumpsum subsidy
Full production cost (actual or standard) plus a lumpsum subsidy
Bought-in cost (actual or standard) plus a lumpsum subsidy
Other (please specifY) ...........................................................................................................
186
ooooooooooooooooo
IQUESTION5

OUESTION5
Listed below are various objectives that a domestic transfer pricing system may be designed toachieve. Please indicate the degree of importance that your group places upon each of theobjectives when formulating its domestic transfer pricing policies.
To comply with the rules and requirements ofexternal financial reporting (ie. Gaap compliance)
To maximise consolidated group profit(ie. promote goal congruence)
The method should be simple to understandand easy to apply in practice
To minimise taxation payments(Income tax, Vat, RSC levies etc)
To accurately determine the performance ofdivisions
To promote divisional autonomy(ie. independence)
To maximise turnover (sales)
1. El = Extremely Important2. VI =Very Important3. MI= Moderately Important4. NtI= Not too Important5. NaaI= Not at all Important
187
DDDDDDnDDDDDDDD00000DDDDDDDDDDDDDDD
IQUESTION6

OUESTION6
Which transfer pricing objective does your group consider to be the single most important (ie.dominant) objective to be achieved by its domestic transfer pricing system? You may check onebox only.
To comply with the rules and requirements of 0external financial reporting (ie. Gaap compliance)
To maximise consolidated group profit 0(ie. promote goal congruence)
The method should be simple to understand 0and easy to apply in practice
To minimise taxation payments 0(Income tax, Vat, RSC levies etc)
To accurately determine the performance ofdivisions DTo promote divisional autonomy (ie. independence) DTo maximise turnover (sales) D
QUESTION 7
Who is responsible for the selection of the domestic transfer pricing methods used within yourgroup?
Head office management
Divisional management·
Head office management after closeconsultation with divisional management
Other (please specify) .
188
DDDD
IQUESTION 8

OUESTIONS
Are domestic divisions permitted to purchase from outside the group goods and services whichare available internally?
Yes, with complete freedom
Yes, subject to head office approval
No
No external source of supply
QUESTION 9
DDoo
How are transfer pricing disputes between divisions settled?
By head office management
By the divisions themselves
By head office management afterclose consultation with the divisions
Other (please specify) .
QVESTIONIO
DD
DD
This question should be answered only ifyour answer to question 2 was no. Ifyour group doesnot use transfer pricing domestically please indicate the reason for not doing so.
The volume of domestic interdivisional sales is insignificant
A transfer pricing system is too complicated to operate
Other (please specify) .
Completed; by:
DD
D
Name
Title
Signature .
Date
THANK yOU. yOUR CO-OPERATION IS MOST APPRECIATED
189

Appendix B: Follow-up Letter
23 December 1996
The Financial DirectorX LimitedPO Box 123Durban4000
Dear Sir
An investigation into the domestic transfer pricing practices of large listed South Africanindustrial companies
Aquestionnaire relating to the above topic was mailed to you on 25 November 1996. If you havealready completed and returned the questionnaire, I thank: you for your co-operation.
If you have not returned the questionnaire this is a reminder that your company's input is veryimportant to the interpretation of the final survey results. Your company was included in thissurvey because it features in the 1996 Financial Mail Survey ofTop Companies. In view oftheimportance of your company to the South African economy therefore, it is important that datarelating to your company are included in the survey.
Respondents are assured that no company will be identified by name in any report emanating fromthis study nor will the questionnaires be made available to any other persons.
Please assist with the success of this project as other companies already have. A copy of thequestionnaire is attached and a reply-paid envelope is enclosed for your convenience.
Yours sincerely
Imtiaz VallySenior lecturer
190

Appendix C: Detailed Cbi-square Tests
MTB > ChiSquare c1-c3.
Chi-5quare Test
Expected counts are printed below observed counts
Cl C2 C3 Total1 14 15 5 34
11.18 14.90 7.92
2 10 17 12 3912.82 17.10 9.08
Total 24 32 17 73
ChiSq 0.712 + 0.001 + 1. 075 +0.621 + 0.001 + 0.937 3.347
df = 2, P = 0.188
MTB > ChiSquare c1-c4.
Chi-5quare Test
Expected counts are printed below observed counts
Cl C2 C3 C4 Total1 13 6 4 11 34
12.11 6.99 7.45 7.45
2 13 9 12 5 3913.89 8.01 8.55 8.55
Total 26 15 16 16 73
ChiSq 0.065 + 0.139 + 1.599 + 1. 689 +0.057 + 0.121 + 1. 394 + 1. 473 6.538
df = 3, P = 0.089
MTB > ChiSquare cl-c3.
Chi-5quare Test
Expected counts are printed below observed counts
Cl C2 C3 Total1 6 21 7 34
9.32 18.63 6.05
2 14 19 6 3910.68 21. 37 6.95
Total 20 40 13 73
ChiSq 1.180 + 0.301 + 0.148 +1. 029 + 0.263 + 0.129 3.049
df = 2, P = 0.218
191

MTB > chiSquare c1-c3.
Chi-5quare Test
Expected counts are printed below observed counts
Cl C2 C3 Total1 14 2 18 34
9.78 9.32 14.90
2 7 18 14 3911. 22 10.68 17.10
Total 21 20 32 73
ChiSq 1.820 + 5.744 + 0.643 +1.587 + 5.008 + 0.561 15.363
dt = 2, P = 0.000
MTB > Chisquare c1-c3.
Chi-5quare Test
Expected counts are printed below observed counts
Cl C2 C3 Total1 9 16 8 33
11. 92 16.04 5.04
2 17 19 3 3914.08 18.96 5.96
Total 26 35 11 72
ChiSq 0.714 + 0.000 + 1. 736 +0.604 + 0.000 + 1. 469 4.523
dt = 2, P = 0.105
MTB > ChiSquare c1-c2.
Chi-5quare Test
Expected counts are printed below observed counts
Cl C2 Total1 25 7 32
19.38 12.62
2 18 21 3923.62 15.38
Total 43 28 71
ChiSq 1. 630 + 2.503 +1. 337 + 2.053 7.523
df = 1, P = 0.006
MTB>
192