critical illness insurance: an introduction to pricing -...
TRANSCRIPT

To change photo:
1. Delete the current
image. This will leave
a blank placeholder
with a picture icon.
2. Click the icon to add a
new image. The photo
will be automatically
be cropped to fit the
placeholder.
NOTE: If you use the
“Change Picture”
function,
the image will be
imported in its original
proportions and won’t fill
the placeholder
completely and will need
to be cropped. Critical Illness Insurance: An Introduction to Pricing
Chris Jewson
22 October 2015
Head of Protection Pricing, UK & Ireland

2
See Appendix for
instructions on how to
change sidebar photo
Agenda
The Evolution of Critical Illness Pricing
Setting The Long-Term Trend Assumption
Product Innovation
• Adding New CI Conditions
• Severity-based Payments
• Multi-pay Critical Illness
Lessons Learned
Recent Research
Risk Management Controls

3
To change photo:
1. Delete the current
image. This will leave
a blank placeholder
with a picture icon.
2. Click the icon to add a
new image. The photo
will be automatically
be cropped to fit the
placeholder.
NOTE: If you use the
“Change Picture”
function,
the image will be
imported in its original
proportions and won’t fill
the placeholder
completely and will need
to be cropped. The Evolution of Critical Illness Pricing

4
See Appendix for
instructions on how to
change sidebar photo
The Evolution of Critical Illness Pricing
Variety of product designs, influenced by pricing uncertainty and with support of reinsurers
Accelerated term assurance
• Typically 6 or 7 CI conditions
Flexible Whole of Life (Universal Life)
• Unit-linked with investment underpin
Mortgage endowment assurance
• Pays full sum assured on expiry, if not already claimed
• With-profits allows for retrospective pricing via bonuses
1980’s: The Early Pioneers

5
See Appendix for
instructions on how to
change sidebar photo
The Evolution of Critical Illness Pricing
Research paper presented in January 1990, more commonly known as “Dash & Grimshaw” after its authors
Recognised the lack of reliable data on post-CI mortality from non-CI causes, which is needed to price an accelerated term assurance
Proposed the “heroic assumption” that post-CI mortality from non-CI causes is the same as the mortality of healthy lives
Accelerated incidence rate = ix + (1 - kx) qx
• ix = critical illness incidence rate
• qx = mortality rate
• kx = proportion of deaths that are due to a critical illness
1990: “Dread Disease Cover, An Actuarial Perspective”
6
See Appendix for
instructions on how to
change sidebar photo
The Evolution of Critical Illness Pricing
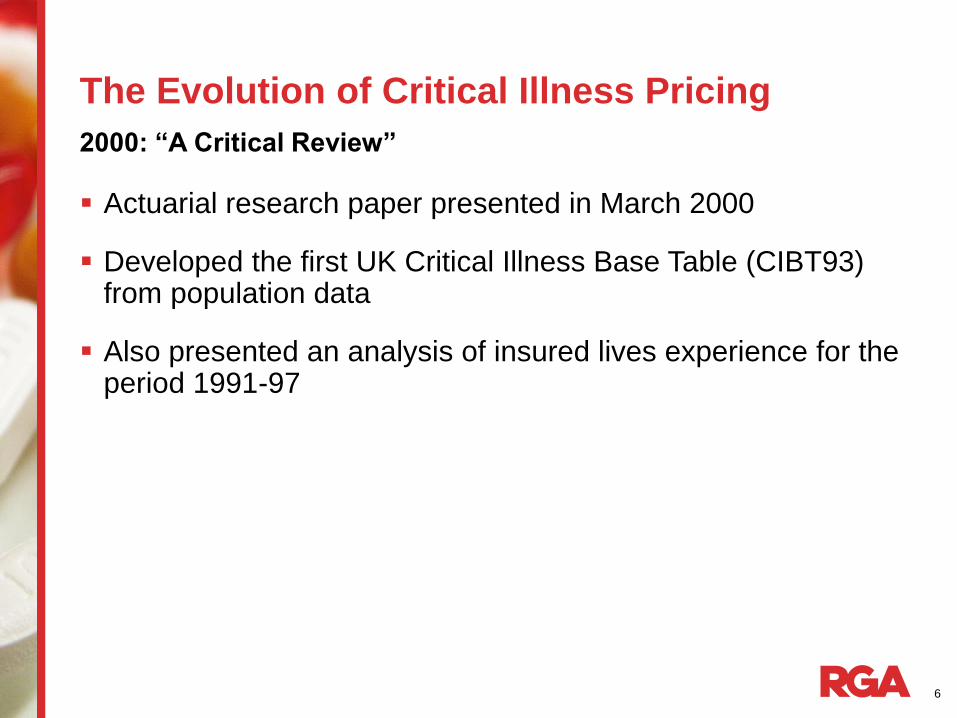
Actuarial research paper presented in March 2000
Developed the first UK Critical Illness Base Table (CIBT93) from population data
Also presented an analysis of insured lives experience for the period 1991-97
2000: “A Critical Review”

7
See Appendix for
instructions on how to
change sidebar photo
The Evolution of Critical Illness Pricing
Reinsurers started to worry about future trend and reduced or withdrew capacity at guaranteed rates
Guaranteed capacity reserved for key clients & distribution channels
Reviewable rates for everyone else
GE continued to offer guaranteed CI in volume
• Prudent margins: priced for >3% p.a. deterioration in experience
• Guaranteed rates ~40% higher than reviewable
• Significant profits
2003: Reinsurers get Cold Feet

8
See Appendix for
instructions on how to
change sidebar photo
The Evolution of Critical Illness Pricing
Actuarial research paper presented in December 2006
A major report (over 200 pages) with substantial commentary on individual conditions, trends etc.
Developed the second UK Critical Illness Base Table (CIBT02) from population data
Presented as a work-in-progress and never fully completed
2006: “Exploring the Critical Path”

9
See Appendix for
instructions on how to
change sidebar photo
The Evolution of Critical Illness Pricing
The first full UK industry tables using insured lives data
Graduated from the industry experience submitted by CMI members
Covers experience during 2003-2006
More stable mix of contributing offices than previous industry data
Still immature by age and duration
2011: AC04 Standard Tables
10
See Appendix for
instructions on how to
change sidebar photo
The Evolution of Critical Illness Pricing
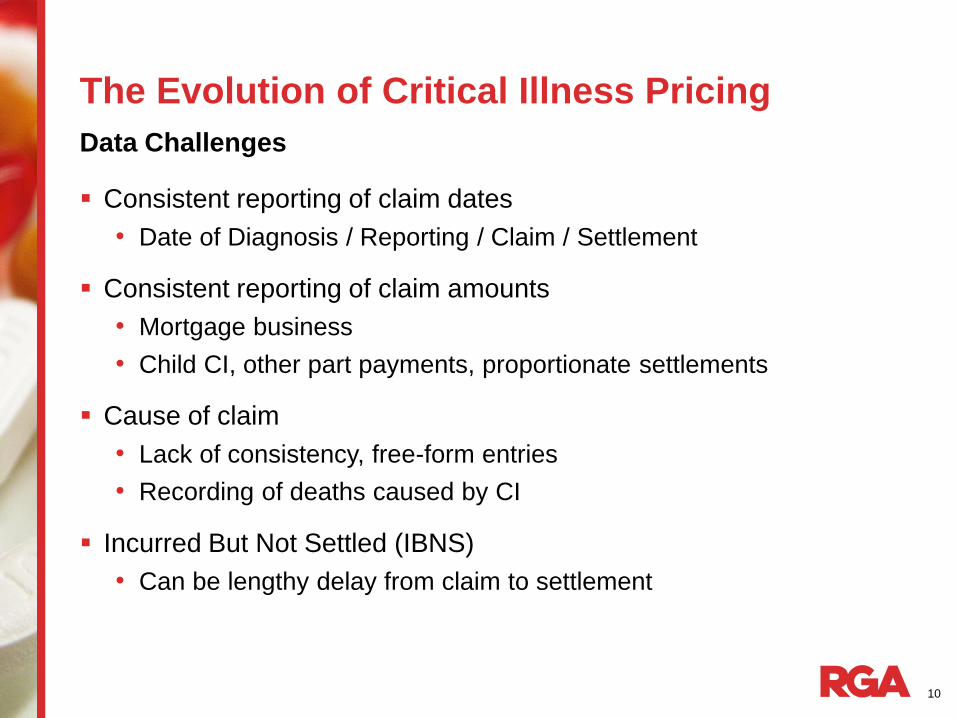
Consistent reporting of claim dates
• Date of Diagnosis / Reporting / Claim / Settlement
Consistent reporting of claim amounts
• Mortgage business
• Child CI, other part payments, proportionate settlements
Cause of claim
• Lack of consistency, free-form entries
• Recording of deaths caused by CI
Incurred But Not Settled (IBNS)
• Can be lengthy delay from claim to settlement
Data Challenges

11
See Appendix for
instructions on how to
change sidebar photo
The Evolution of Critical Illness Pricing
Mix of products has changed
• Old: Endowments, light underwriting
• New: Pure protection (term assurances), stringent underwriting
Mix of contributing offices has changed
• Different underwriting standards
• Different distribution models
• Inconsistent from one industry study to the next
Industry Study Challenges

12
See Appendix for
instructions on how to
change sidebar photo
The Evolution of Critical Illness Pricing
Industry Study Challenges
13
See Appendix for
instructions on how to
change sidebar photo
The Evolution of Critical Illness Pricing
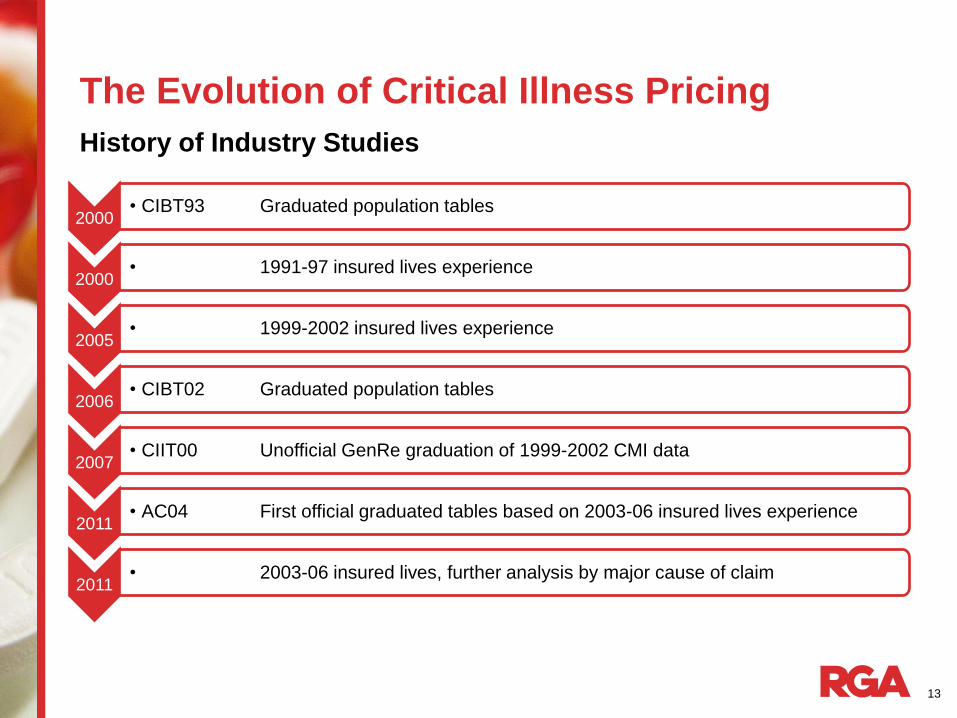
History of Industry Studies
2000 • CIBT93 Graduated population tables
2000 • 1991-97 insured lives experience
2005 • 1999-2002 insured lives experience
2006 • CIBT02 Graduated population tables
2007 • CIIT00 Unofficial GenRe graduation of 1999-2002 CMI data
2011 • AC04 First official graduated tables based on 2003-06 insured lives experience
2011 • 2003-06 insured lives, further analysis by major cause of claim
14
See Appendix for
instructions on how to
change sidebar photo
The Evolution of Critical Illness Pricing
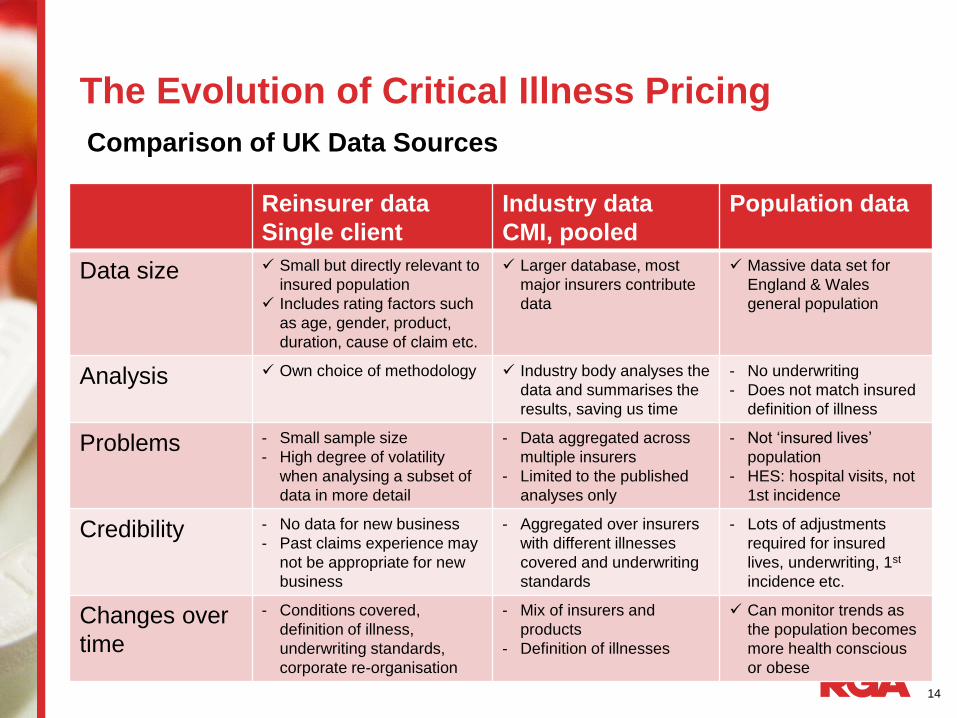
Comparison of UK Data Sources
Reinsurer data
Single client
Industry data
CMI, pooled
Population data
Data size Small but directly relevant to
insured population
Includes rating factors such
as age, gender, product,
duration, cause of claim etc.
Larger database, most
major insurers contribute
data
Massive data set for
England & Wales
general population
Analysis Own choice of methodology Industry body analyses the
data and summarises the
results, saving us time
- No underwriting
- Does not match insured
definition of illness
Problems - Small sample size
- High degree of volatility
when analysing a subset of
data in more detail
- Data aggregated across
multiple insurers
- Limited to the published
analyses only
- Not ‘insured lives’
population
- HES: hospital visits, not
1st incidence
Credibility - No data for new business
- Past claims experience may
not be appropriate for new
business
- Aggregated over insurers
with different illnesses
covered and underwriting
standards
- Lots of adjustments
required for insured
lives, underwriting, 1st
incidence etc.
Changes over
time
- Conditions covered,
definition of illness,
underwriting standards,
corporate re-organisation
- Mix of insurers and
products
- Definition of illnesses
Can monitor trends as
the population becomes
more health conscious
or obese

15
See Appendix for
instructions on how to
change sidebar photo
The Evolution of Critical Illness Pricing
Source: Continuous Mortality Investigation (CMI)
UK Selection Pattern by Duration and Risk Class

16
See Appendix for
instructions on how to
change sidebar photo
The Evolution of Critical Illness Pricing
Source: Continuous Mortality Investigation (CMI)
Cause of Claim, UK: Males

17
See Appendix for
instructions on how to
change sidebar photo
The Evolution of Critical Illness Pricing
Source: Continuous Mortality Investigation (CMI)
Cause of Claim, UK: Females

18
See Appendix for
instructions on how to
change sidebar photo
The Evolution of Critical Illness Pricing
History of RGA Pricing
2000 • Derived from population data with adjustments to estimate
an insured population
2004 • Insured lives experience starting to emerge at early
durations
2008 • Basket of major conditions calibrated to CMI industry data
and own experience
2012 • GLM analysis of insured data for established CI conditions
with traditional methods for more recent conditions

19
To change photo:
1. Delete the current
image. This will leave
a blank placeholder
with a picture icon.
2. Click the icon to add a
new image. The photo
will be automatically
be cropped to fit the
placeholder.
NOTE: If you use the
“Change Picture”
function,
the image will be
imported in its original
proportions and won’t fill
the placeholder
completely and will need
to be cropped. The Long-Term Trend Assumption

20
See Appendix for
instructions on how to
change sidebar photo
The Long-Term Trend Assumption
Influences on Trends
• Real changes in population morbidity
• Earlier detection of disease
• Medical definition drift Population
• Real changes in assured population morbidity
• Weakness in insured definition
• Insured definition drift
• Anti-selective lapsation
Insured Lives

21
See Appendix for
instructions on how to
change sidebar photo
The Long-Term Trend Assumption
To estimate future incidence-rate trends for a standard acceleration critical illness product
Particular emphasis on adverse scenarios appropriate to pricing of guaranteed business
Not a ‘tail scenario’ investigation
Objective

22
See Appendix for
instructions on how to
change sidebar photo
The Long-Term Trend Assumption
Heart Attack
Stroke
MS
CABG
Angioplasty
Colorectal Cancer
Pancreatic Cancer
Stomach Cancer
Prostate Cancer
Bladder Cancer
Lung Cancer
Breast Cancer
Ovarian Cancer
Uterus Cancer
Melanoma
Non-CI deaths
Conditions Covered

23
See Appendix for
instructions on how to
change sidebar photo
The Long-Term Trend Assumption
Who should we call for the ‘crystal ball’ gazing?
Options Pros Cons
Academics Ahead of the
game
Narrow, unworldly
Consultants,
Practitioners
Broader view Stuck in the
present, don’t
understand
insurance
CMO’s Understand
insurance
Stuck in the present
Underwriters Understand
insurance
Not enough
expertise
Dr. Google Available 24/7 None

24
See Appendix for
instructions on how to
change sidebar photo
The Long-Term Trend Assumption
CMO’s with relevant specialism
Briefing packs provided
• Insured definition
• Chart of past trends (from HES, Cancer Registration Statistics)
• Suggested rationale for past trends
Telephone discussions, strictly moderated, 1 hour per condition
Discussions must reach consensus on future trends, which is documented as the ‘Expert Opinion Statement’
Expert Sessions

25
See Appendix for
instructions on how to
change sidebar photo
The Long-Term Trend Assumption
Level and direction of recent population trends, with rationale
Projected trend for next 10yrs and subsequent 10yrs, with rationale:
• No change
• Slightly up/down
• Sharply up/down
Potential ‘shocks’ in next 10yrs and subsequent 10yrs, with rationale
Expert Opinion Statement

26
See Appendix for
instructions on how to
change sidebar photo
The Long-Term Trend Assumption
A ‘shock’ is an event which the experts expect to occur in the future with some level of likelihood
A ‘shock’ gives rise to a one-off increase in incidence rates above the current trend, to a sustained higher level
A ‘shock’ is described by three parameters:
• The assumed date of occurrence
• The assumed likelihood of occurrence
• The assumed impact on incidence rates
A ‘shock’ is NOT an unpredicted or random event!
Expert Opinion: ‘Shocks’

27
See Appendix for
instructions on how to
change sidebar photo
The Long-Term Trend Assumption
Actuaries interpreted the choices into numbers, by age band, starting with the trend over most recent 5 year period
Expert opinion statements ‘slightly up’ etc. converted into numeric trend assumptions for 20 years, in blocks of 5 years
Further adjustment for expected differences between general population and insured population, using insured v. population incidence trends as a clue
For non-CI deaths, used trends in available ‘death by cause’ data
Converting Expert Opinion Statements into Numbers

28
See Appendix for
instructions on how to
change sidebar photo
The Long-Term Trend Assumption
Converting ‘Shocks’ into Numbers
Starting point is Expert Opinion for time, likelihood and impact
Adjust for deemed differences between population and insured lives
• Socio-economic
• Effect of underwriting
Grade impact variation in 10-year age groups
Further discussion and refinements following discussions with claims team
29
See Appendix for
instructions on how to
change sidebar photo
The Long-Term Trend Assumption
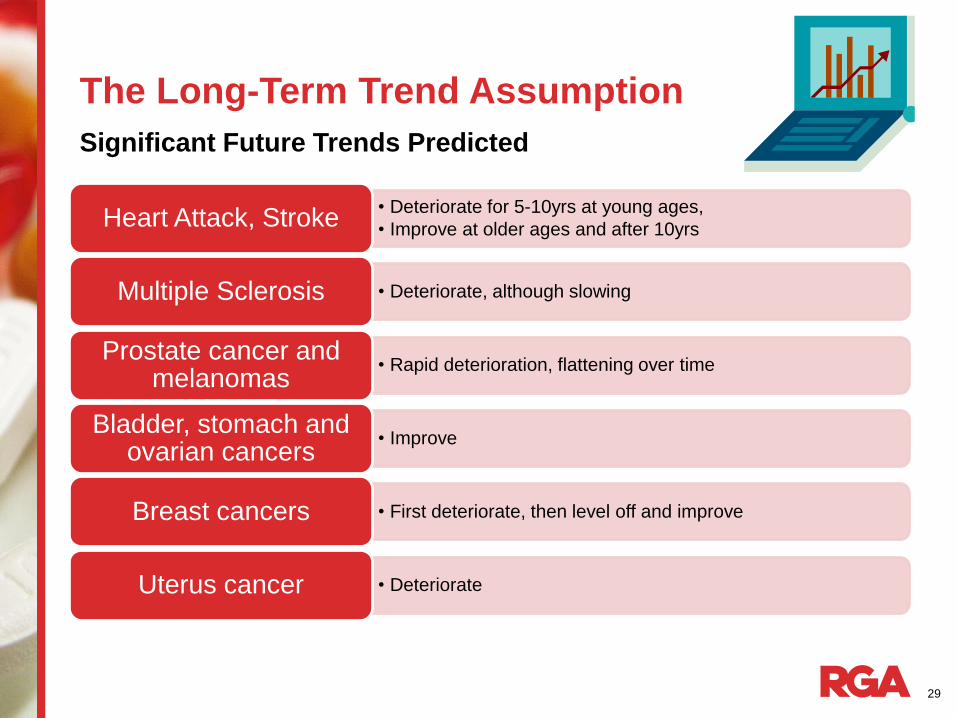
Significant Future Trends Predicted
• Deteriorate for 5-10yrs at young ages,
• Improve at older ages and after 10yrs Heart Attack, Stroke
• Deteriorate, although slowing Multiple Sclerosis
• Rapid deterioration, flattening over time Prostate cancer and
melanomas
• Improve Bladder, stomach and
ovarian cancers
• First deteriorate, then level off and improve Breast cancers
• Deteriorate Uterus cancer
30
See Appendix for
instructions on how to
change sidebar photo
The Long-Term Trend Assumption
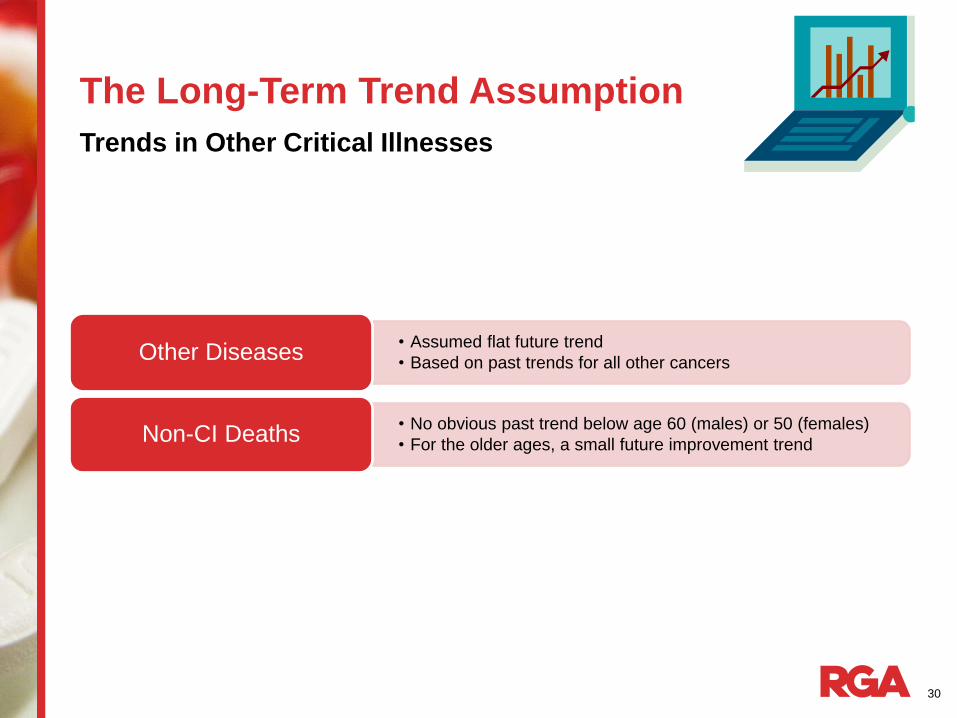
Trends in Other Critical Illnesses
• Assumed flat future trend
• Based on past trends for all other cancers Other Diseases
• No obvious past trend below age 60 (males) or 50 (females)
• For the older ages, a small future improvement trend Non-CI Deaths

31
See Appendix for
instructions on how to
change sidebar photo
The Long-Term Trend Assumption
Significant Future ‘Shocks’ Predicted
• Exploitation of weak insured definition for symptoms (and for MS)
• Inclusion of some transient ischaemic attacks (TIAs)
• 20% likelihood, up to 20% impact at youngest ages for weak definition
• 10% likelihood, up to 20% impact at youngest ages for TIAs
Stroke
• Risk of having to accept lower clinical Troponin threshold 0.1 instead of 1.0 in the insured definition Heart Attack
• Earlier detection of malignancies; but earlier detection of pre-malignant cancers would be beneficial and work in our favour Various Cancers

32
See Appendix for
instructions on how to
change sidebar photo
The Long-Term Trend Assumption
Best Estimate (Reviewable Premium Business)
• Include <100% of the ‘shock’ impacts
• Allow for improvements where expected for some conditions
Trend Scenarios: Principles for Best Estimate

33
See Appendix for
instructions on how to
change sidebar photo
The Long-Term Trend Assumption
Guaranteed Premium Business
• Aim to be P% (?) certain of claims costs within pricing
• Various scenarios from optimistic to pessimistic
• Cautious interpretation of past trends
• Reduced allowance for long-term improvements in some for conditions
• Include >100% of the ‘shock’ impacts
• Keep a sense of balance: there are beneficial environmental and technological drivers, as well as adverse ones
• ‘Shocks’ limited to small set of predicted causes, not a 1 in 200 event or ‘wildcard’ unknown
Trend Scenarios: Principles for Guaranteed Business

34
See Appendix for
instructions on how to
change sidebar photo
The Long-Term Trend Assumption
Trends and ‘Shocks’ weighted appropriately to produce a two-way table by age and duration for each risk class
Further variations by age, smoker status, policy term
Combining Trends and ‘Shocks’ for All Conditions

35
To change photo:
1. Delete the current
image. This will leave
a blank placeholder
with a picture icon.
2. Click the icon to add a
new image. The photo
will be automatically
be cropped to fit the
placeholder.
NOTE: If you use the
“Change Picture”
function,
the image will be
imported in its original
proportions and won’t fill
the placeholder
completely and will need
to be cropped. Product Innovation

36
See Appendix for
instructions on how to
change sidebar photo
Product Innovation
Process and Stakeholders
Insurer’s proposed definition
Definition Review
Pricing
Refine Definition
Refine Price
Refine definition and
price
Insurer
challenge
CM
O
Mark
eti
ng
Insurer

37
See Appendix for
instructions on how to
change sidebar photo
Product Innovation
Identify what data sources are available
• Often no insured data
• Population data (eg. HES) – use CMO’s, Dr. Google etc.
• Identify the most relevant ICD codes
Subjective adjustments
• Under-reporting or multiple treatments for the same patient
• Severity of insurance definition v. medical definition
• Insured population v. general population
• Overlaps with existing cover
Pricing New Conditions

38
See Appendix for
instructions on how to
change sidebar photo
Product Innovation
Began selling CI in 1985
Sophisticated market
Complex CI products and little standardisation
Highly competitive between providers
• Driven by definitions – numbers of conditions covered, and the scope of each definition
• Insurers are pushing the boundaries to differentiate
Sold by broker as a rider to death or standalone cover
CI in South Africa

39
See Appendix for
instructions on how to
change sidebar photo
Product Innovation
CI in South Africa: Plain Vanilla to ‘The Works’…
CI in 1985 CI in 2015

40
See Appendix for
instructions on how to
change sidebar photo
Product Innovation
CI in South Africa
1985
Heart Attack, Stroke, CABG, Cancer
Accelerated (part of Life policy)
2015
> 50 impairments covered
Stand Alone and Accelerated
Scaled – severity levels, paying
out more for more severe
disease

41
See Appendix for
instructions on how to
change sidebar photo
Product Innovation: Severity-based Payments
Key Features of CI Products
South Africa Australia Singapore
Accelerated rider or Standalone
Limited Premium
guarantees (10years)
Fully reviewable rates Premium guarantees
50+ conditions 50+ conditions 37 conditions
Reinstatement / buy-
back
Reinstatement / buy-
back
Reinstatement / buy-
back
Staged / multi-pay Staged /multi-pay
(developing)
Staged / multi-pay
Early Stage Early Stage
Whole of Life No WOL No WOL

42
See Appendix for
instructions on how to
change sidebar photo
Product Innovation: Severity-based Payments
Better meets client needs
Matches payment to disease severity
Improved public image….
• fewer ‘declined’ claims
More resilient to medical advances
• as long as definitions well controlled
Insurable interest
Affordable insurance
Multiple events
Arguments for Scaled CI
Windfall payments on
non-Scaled products:
Is it fair to pay someone who
has had a mild heart attack and
back at work next week the
same as a paraplegic?

43
See Appendix for
instructions on how to
change sidebar photo
Product Innovation: Severity-based Payments
Product complexity
Consumer understanding
Agent sells the “100% level”
Marketed as being not as comprehensive
Pricing statistics
• Country variations in stage distribution?
• Stage progression?
• Multiple claims?
• Impact of future screening?
• Lacking credible experience or population data
Challenges with Scaled CI

44
See Appendix for
instructions on how to
change sidebar photo
Product Innovation: Severity-based Payments
Example: Cancer Definition
“Cancer” is a malignant tumour positively diagnosed with histological confirmation and characterised by the
uncontrolled growth of malignant cells and invasion of tissue. The term malignant tumour includes leukaemia,
lymphoma and sarcoma.
The following conditions are excluded from this definition:
-All cancers in situ and all pre-malignant conditions
-All tumours of the prostate unless histologically classified as having a Gleason score greater than 6 or having
progressed to at least clinical TNM classification T2N0M0
-All skin cancers, other than, malignant melanoma that has been histologically classified as having caused invasion
beyond the epidermis (outer layer of skin)
Non-Tiered Tiered (except Prostate, leukemia and lymphoma)
100% The cancer must require
treatment by surgery,
radiotherapy, or chemotherapy.
25% TNM Stage I malignant tumour
50% TNM Stage II malignant tumour
75% TNM Stage III malignant tumour
100% TNM Stage IV malignant tumour

45
See Appendix for
instructions on how to
change sidebar photo
Product Innovation: Severity-based Payments
Scaled Cancer Pricing
Progression
Cancer
Stage IV
Stage III
Stage II
Stage I
46
See Appendix for
instructions on how to
change sidebar photo
Product Innovation: Severity-based Payments
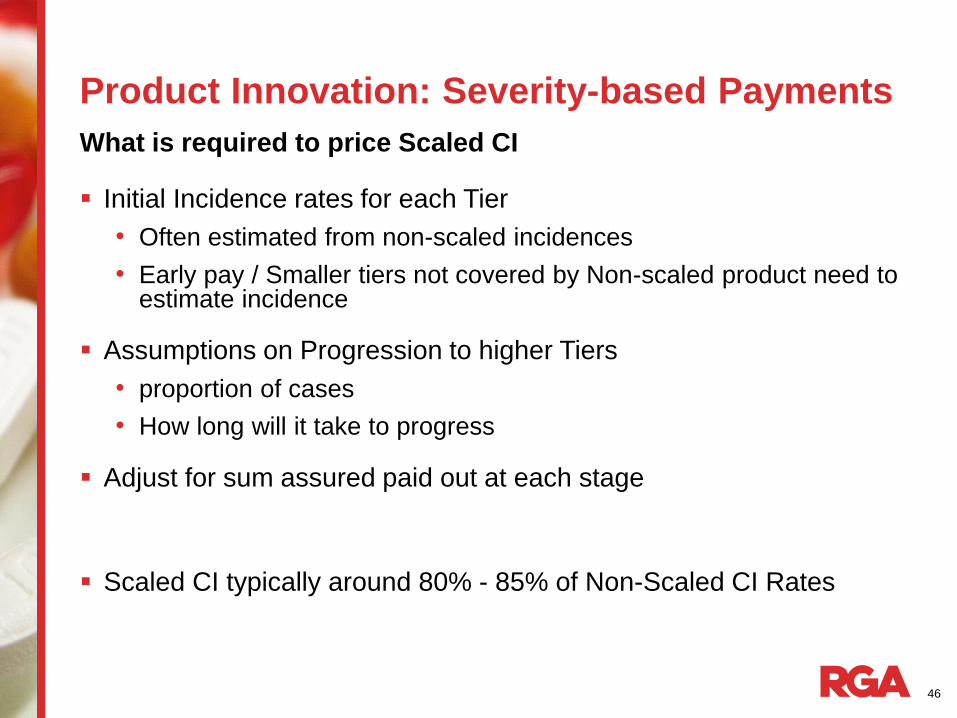
Initial Incidence rates for each Tier
• Often estimated from non-scaled incidences
• Early pay / Smaller tiers not covered by Non-scaled product need to estimate incidence
Assumptions on Progression to higher Tiers
• proportion of cases
• How long will it take to progress
Adjust for sum assured paid out at each stage
Scaled CI typically around 80% - 85% of Non-Scaled CI Rates
What is required to price Scaled CI

47
See Appendix for
instructions on how to
change sidebar photo
Product Innovation: Multi-pay Critical Illness
On standalone CI can claim more than once for unrelated conditions
Product paying up to 5 times the sum assured or more on multiple CI events
Usually CI events are grouped by related conditions and only 1 payment per group is allowed
Require waiting period between claims to be considered unrelated

48
See Appendix for
instructions on how to
change sidebar photo
Product Innovation: Multi-pay Critical Illness
Incidence Rates
• Base single event incident rates by condition, age , gender, smoking habit
• Discount rates
• Lapses (pre and post first claim)
• Issue Age and Policy Term
Risk Relativities
• Probability of Second/Subsequent Event given First Event has occurred
• Product Groupings to allow for implicit price adjustment
Survival Probabilities
• Initial Extra Mortality over one year waiting period following the first event
• Extra mortality by duration for further four years following the first event
Expenses, capital, profits etc.
What is required to price Multi-pay CI

49
To change photo:
1. Delete the current
image. This will leave
a blank placeholder
with a picture icon.
2. Click the icon to add a
new image. The photo
will be automatically
be cropped to fit the
placeholder.
NOTE: If you use the
“Change Picture”
function,
the image will be
imported in its original
proportions and won’t fill
the placeholder
completely and will need
to be cropped. Lessons Learned
50
See Appendix for
instructions on how to
change sidebar photo
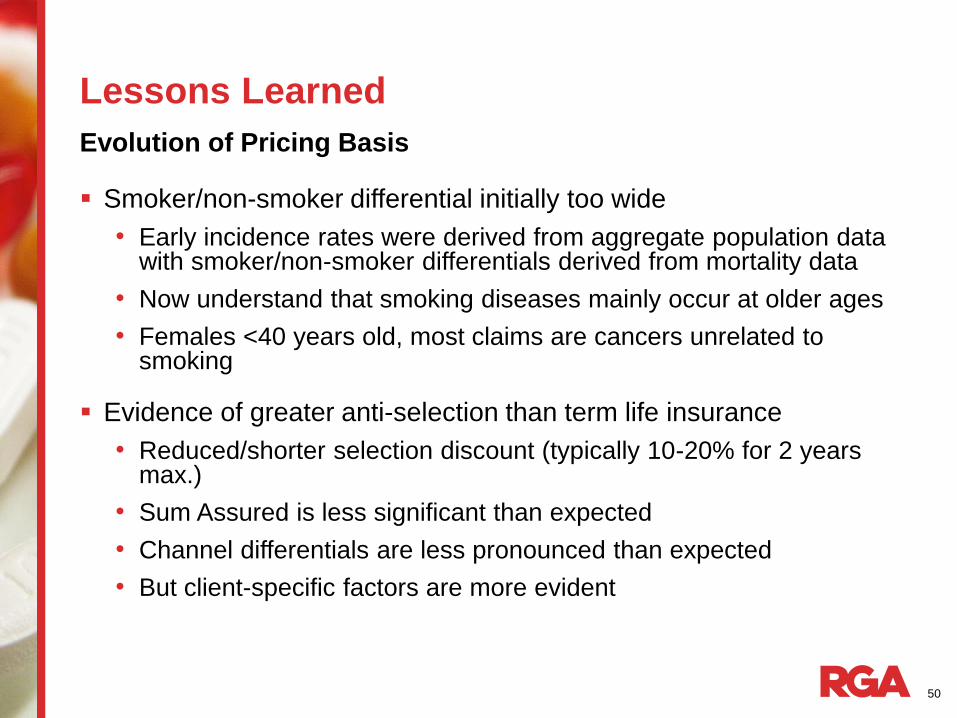
Lessons Learned
Smoker/non-smoker differential initially too wide
• Early incidence rates were derived from aggregate population data with smoker/non-smoker differentials derived from mortality data
• Now understand that smoking diseases mainly occur at older ages
• Females <40 years old, most claims are cancers unrelated to smoking
Evidence of greater anti-selection than term life insurance
• Reduced/shorter selection discount (typically 10-20% for 2 years max.)
• Sum Assured is less significant than expected
• Channel differentials are less pronounced than expected
• But client-specific factors are more evident
Evolution of Pricing Basis

51
See Appendix for
instructions on how to
change sidebar photo
Lessons Learned
Variation in Duration 0 Selection Discount by Insurer

52
See Appendix for
instructions on how to
change sidebar photo
Lessons Learned
Population Trend (Male aged 40-60, 1980-2000, England & Wales)

53
See Appendix for
instructions on how to
change sidebar photo
Lessons Learned
Insurer and reinsurer agree timelines at outset
Requires careful management of all stakeholders
• Marketing
• Underwriting
• Claims
• Pricing
May require multiple iterations before settling on the final product specification
‘Package price’ easier to determine than individual conditions
Product Developments and New Conditions

54
To change photo:
1. Delete the current
image. This will leave
a blank placeholder
with a picture icon.
2. Click the icon to add a
new image. The photo
will be automatically
be cropped to fit the
placeholder.
NOTE: If you use the
“Change Picture”
function,
the image will be
imported in its original
proportions and won’t fill
the placeholder
completely and will need
to be cropped. Recent Research

55
See Appendix for
instructions on how to
change sidebar photo
Recent Research
The full HES dataset covers 1989/90 to 2009/10
Unique patient identifier from 1997/98 to 2009/10 and ICD10 codes
Potential uses include:
• Pricing new CI conditions where insured data is not available
• More accurate adjustments for repeat visits
• Understanding correlations and overlaps between conditions
• Socio-economic studies to assist in predictive modelling?
No longer available due to privacy concerns
The Hospital Episodes Statistics (HES) Dataset

56
See Appendix for
instructions on how to
change sidebar photo
Recent Research
The Hospital Episodes Statistics (HES) Dataset
• 47m unique patient identifiers Patient Identifier
• Age, gender Basic Patient Information
• Date started, date finished, admission method, current status etc.
Basic Episode Information
• Up to 20 different diagnoses per patient Diagnosis Information
• Up to 20 different operations, with date of operation Procedure Information
• Postal district, local super output area, deprivation index ranking Geographic Information

57
To change photo:
1. Delete the current
image. This will leave
a blank placeholder
with a picture icon.
2. Click the icon to add a
new image. The photo
will be automatically
be cropped to fit the
placeholder.
NOTE: If you use the
“Change Picture”
function,
the image will be
imported in its original
proportions and won’t fill
the placeholder
completely and will need
to be cropped. Risk Management Controls

58
See Appendix for
instructions on how to
change sidebar photo
Risk Management Controls
Product Design
• Limit volumes of single-condition cover
• Maximum term (for guaranteed rates)
Alignment of Interest
• Insurer retention, if using reinsurance
Pricing Mis-estimation
• Increased availability of insured data
• Regular experience studies eg. when quoting for new business
Trend risk
• Future-proof definitions, regular review
• CMO approval
‘We are all risk managers’

59
To change photo:
1. Delete the current
image. This will leave
a blank placeholder
with a picture icon.
2. Click the icon to add a
new image. The photo
will be automatically
be cropped to fit the
placeholder.
NOTE: If you use the
“Change Picture”
function,
the image will be
imported in its original
proportions and won’t fill
the placeholder
completely and will need
to be cropped. Thank You
Any Questions?

©2015 RGA. All rights reserved.
No part of this publication may be reproduced in any form without the prior permission of RGA.
The information in this publication is for the exclusive, internal use of the recipient and may not be relied upon by any other party
other than the recipient and its affiliates, or published, quoted or disseminated to any party other than the recipient without the prior
written consent of RGA.