an analysis of the text complexity of leveled passages in
TRANSCRIPT

Full Terms & Conditions of access and use can be found athttp://www.tandfonline.com/action/journalInformation?journalCode=heda20
Download by: [The UC Santa Cruz University Library] Date: 16 October 2017, At: 13:17
Educational Assessment
ISSN: 1062-7197 (Print) 1532-6977 (Online) Journal homepage: http://www.tandfonline.com/loi/heda20
An Analysis of the Text Complexity of LeveledPassages in Four Popular Classroom ReadingAssessments
Yukie Toyama, Elfrieda H. Hiebert & P. David Pearson
To cite this article: Yukie Toyama, Elfrieda H. Hiebert & P. David Pearson (2017) An Analysisof the Text Complexity of Leveled Passages in Four Popular Classroom Reading Assessments,Educational Assessment, 22:3, 139-170, DOI: 10.1080/10627197.2017.1344091
To link to this article: http://dx.doi.org/10.1080/10627197.2017.1344091
View supplementary material
Accepted author version posted online: 28Jun 2017.Published online: 28 Jun 2017.
Submit your article to this journal
Article views: 202
View related articles
View Crossmark data
Toyama, Y., Hiebert, E. H., & Pearson, P. D. (2017). An analysis of the text complexity of leveled passages in four popular classroom reading assessments. Educational Assessment, 22(3), 139-170.
An Analysis of the Text Complexity of Leveled Passages in FourPopular Classroom Reading AssessmentsYukie Toyamaa, Elfrieda H. Hiebertb,c, and P. David Pearsona
aUniversity of California, Berkeley; bTextProject, Santa Cruz, CA; cUniversity of California, Santa Cruz
ABSTRACTThis study investigated the complexity of leveled passages used in fourclassroom reading assessments. A total of 167 passages leveled for Grades1–6 from these assessments were analyzed using four analytical tools oftext complexity. More traditional, two-factor measures of text complexityfound a general trend of fairly consistent across-grade progression ofaverage complexity among the four assessments. However, considerablecross-assessment variability was observed in terms of the size of increase incomplexity from grade to grade, the overall range of complexity, and thewithin-grade text complexity. These cross-assessment differences were lesspronounced with newer, multi-factor analytical tools. The four assessmentsalso differed in the extent to which their passages met the text complexityguidelines of the Common Core State Standards. The authors discussimplications of the differences found among and within the classroomassessment systems, on one hand, and among the measures of text com-plexity, on the other.
Most educators and even the general public are aware of the expansion in the influence of group-administered standardized tests as tools to shape policy in American education. Less well known isthe steady expansion in the use of classroom assessment tools in teachers’ everyday decisions.Indeed, there are many more tools available for making student- or classroom-level decisions thanthere are for aggregate decisions about schools and districts (see, e.g., Anderson, Schlueter, Carlson,& Geisinger, 2016). Even so, while the media is filled with stories about the consequential impact offormal tests (Au, 2007; O’Neill, 2006), we seldom find stories in the popular press or archivalliterature about the consequences of classroom assessments for practice (although seldom is notnever; see, e.g., Crooks, 1988; Goodman, 2006). The mundane purposes for which classroomassessments are used—placing students at the right level within a curriculum, determining whichstudents have mastered certain skills and knowledge, and tracking student progress toward a targetgoal—do not appear to have earned the notoriety that standardized tests used for high stakespurposes, such as targeting schools for state takeover, do.
Perhaps classroom assessment tools should receive greater scrutiny. After all, even though theyare not generally used to make large-scale aggregate decisions, they are used to make important dailydecisions about individual students within the curricula enacted in classrooms. For students (andtheir parents) who are placed in or denied access to particular programs, who have to repeat tasksthey can already accomplish, or who are asked to read material that is either far below or above theircurrent level of competence, these decisions are consequential in influencing students’ school lives(Brookhart, 2003; Kontovourki, 2012). The quality of students’ everyday activity and the appropri-ateness of the instruction and scaffolding they receive depend on the validity of these seeminglyordinary decisions.
CONTACT Yukie Toyama [email protected] 1660 Plymouth Ave, San Francisco, CA 94127.© 2017 Taylor & Francis
EDUCATIONAL ASSESSMENT2017, VOL. 22, NO. 3, 139–170https://doi.org/10.1080/10627197.2017.1344091
Dow
nloa
ded
by [
The
UC
San
ta C
ruz
Uni
vers
ity L
ibra
ry]
at 1
3:17
16
Oct
ober
201
7

In the current study, we examine two types of the most widely used classroom reading assess-ments—informal reading inventories (IRIs; Nilsson, 2008, 2013; Paris & Carpenter, 2003) andcurriculum-based measurements (CBMs; Deno, 1985; Jenkins & Fuchs, 2012). IRIs are commonlyused to determine the level of difficulty of texts that individual children can read on their own (i.e.,independent level) or with teacher support (i.e., instructional level). CBMs serve a different purpose;they measure progress toward a specific learning target within a specific grade, such as reading end-of-year fourth-grade passages. Despite these differences in purpose, they share a common character-istic: both tools require reading passages that become progressively and predictably more difficultfrom one level to the next. Underlying this characteristic is an assumption that the passages arescaled on some underlying dimension of text complexity (inherent features of text) that predicts textdifficulty, as traditionally indexed by student performance on a reading comprehension task or,increasingly often, by human judgment about text (Mesmer, Cunningham, & Hiebert, 2012).1
Rationale for the study
The logic of text complexity in classroom assessments
The primary purpose in giving an IRI is to find a student’s instructional level. An underlyingassumption of the IRI is that each passage level has a single reference point on a complexitycontinuum, or perhaps a relatively narrow range, forming a staircase of text complexity. Granted,along with the numeric index of reading levels, teachers can obtain diagnostic information if theytake the time to analyze the specific patterns of errors or miscues made by students as they readaloud (Clay, 1993; Goodman & Burke, 1972). However, the essential points, when it comes to findingan instructional level, are the following: (a) texts at higher levels should consistently pose morechallenge to readers than texts at lower levels, and (b) if there are alternative forms of the IRI (thatone might use, for example, at different points in the year or to corroborate that a placement at agiven level is accurate), the passages designated to be at a given level are of comparable, if notidentical, complexity and difficulty across forms. The operational test of comparability would be thatthird-grade texts across different forms would be more similar to one another and pose morechallenge to readers than second-grade texts but less challenge than fourth-grade texts.
In contrast, CBMs are easy-to-administer assessments of targeted processes or practices thatrepresent a desired outcome of instruction. These assessments are administered regularly throughoutthe school year (in some cases even weekly) to monitor student progress towards a specificperformance target, with the expectation that instructional adjustments will be made for studentswhose progress is below par (Jenkins & Fuchs, 2012). In reading, the most common targetperformance is reading grade-level passages with fluency and, sometimes, comprehension. Thus, ifthe goal is to read end-of-the-year fourth grade passages with fluency and comprehension, then thepopulation of items/tasks would consist of end-of-fourth-grade passages, even for students who arejust beginning fourth grade. Guiding this approach is a classic principle of change measurement: Ifyou want to measure change, don’t change the measure. Of course, to prevent learning and memoryeffects from compromising the measure of change, one must use equivalent but not identicalpassages across time points. Unless that assumption is met, it is impossible to monitor progresstoward the target because performance variations along the way might otherwise represent littlemore than students’ responses to variations in text challenge.
1We follow Mesmer, Cunningham, and Hiebert’s (2012) distinction between text complexity and text difficulty. Text complexity isindexed by inherent properties of text, which are largely linguistic and discourse features of text; most important, they can bemanipulated by researchers and text designers. Text complexity indices typically serve as independent variables that predict textdifficulty. Text difficulty, in contrast, is indexed directly by student reading comprehension performance or indirectly by expertjudgments of the likely difficulty students will encounter. Thus difficulty is an actual or predicted performance of multiplereaders on a specific reading comprehension passage/task (or in the case of expert judgment, the actual levels at which thejudges placed the various texts).
140 Y. TOYAMA ET AL.
Dow
nloa
ded
by [
The
UC
San
ta C
ruz
Uni
vers
ity L
ibra
ry]
at 1
3:17
16
Oct
ober
201
7

An emerging role for classroom assessments
In recent years, classroom assessments such as IRIs appear to have assumed a role in policy decisions(Arthaud, Vasa, & Steckelberg, 2000; Ford & Opitz, 2008; Goodman, 2006; Paris, 2002). Thesepurposes include universal screening and placement decisions (Albee, Arnold, Dennis, Schafer, &Olson, 2013; Parker et al., 2015), documenting student growth for accountability purposes (Paris,2002), and evaluating the effectiveness of different forms of instruction (Nilsson, 2013; Stahl &Heubach, 2005). The latter two purposes typically require the assumption of equal intervals for IRIpassage levels, particularly when users are interested in the magnitude of change or difference inreading performance between different time points or between students.
Indeed, we found two specific instances of such assumption being made (or at least implied) to supporteveryday decisions as well as research-based claims about instructional effectiveness. The first instance isfound in the user manuals from the developers of IRIs; they typically represent passage levels in a grid intheir forms that document student progress within and across grades. This representation gives an equallysized square to each passage level (for specific examples, see DRA’s Student Book Graph in PearsonEducation, Inc., 2011; and Guided Reading’s Record of Reading Progress in Fountas & Pinnell, 2012). Inreading from these representations, teachers and other stakeholders who use these tools are transparentlyauthorized to assume equal intervals of student growth from one passage level to next. Another con-sequential example of the equal interval assumption is found in efficacy studies (e.g., Ransford-Kaldonet al., 2010; Stahl & Heubach, 2005). In these studies, researchers express average student reading gain interms of book/passage reading levels, and compare the treatment and control groups on this outcomevariable using statistical procedures such as a t-test or linear regression. Such analysis is only possible if theresearchers assume the levels assigned to passages are a continuous variable with equal intervals.
While critics have questioned the psychometric properties of IRIs (Klesius & Homan, 1985;Pikulski & Shanahan, 1982; Spector, 2005), the most important observation is that little is knownabout the validity of text progression, either their complexity or their difficulty, in IRIs. What we doknow is that empirical decisions are being made with an assumption of equal intervals, both inresearch studies and in everyday classroom decision-making.
The most prominent CBMs are measures of oral reading fluency (ORF). The ORF component ofthe Dynamic Indicators of Basic Early Literacy Skills (DIBELS; Good et al., 2013) was used widelyduring the No Child Left Behind (NCLB) implementation (Shelton, Altwerger, & Jordan, 2009) andhas been further extended in the implementation of the Response to Intervention (RTI) frameworkfor identifying students with learning disabilities (Mellard, McKnight, & Woods, 2009). Currently,DIBELS is used in over 28,000 schools worldwide, including approximately 20% of elementaryschools in the U.S. (DIBELS Data System, 2015).
The ORF component of DIBELS has been criticized for its narrow conceptualization of thereading process and the potential consequences of its use for instruction and learning (Goodman,2006; Samuels, 2007; Valencia et al., 2010). For example, critics have suggested that when teachersuse DIBELS subtest scores to plan and deliver instruction, speed and accuracy in oral reading areemphasized at the expense of other important aspects of reading such as prosody, vocabulary, andcomprehension (Goodman, 2006; Kuhn, Schwanenflugel, & Meisinger, 2010; Samuels, 2007).
These critiques aside, the ORF component of DIBELS is recognized as an empirically-validatedstandardized measure (Goffreda & DiPerna, 2010; Kame’enui et al., 2006). Passage equivalency in agiven grade level has been identified to be an important property of ORFs, especially for capturinggrowth (Ardoin, Suldo, Witt, Aldrich, & Mcdonald, 2005; Christ & Ardoin, 2009; Francis et al., 2008;Jenkins, Zumeta, Dupree, & Johnson, 2005). Since ORF measures are used primarily for monitoringwithin grade-level progress, one might argue that unlike IRIs, ORFs do not need to meet theassumption of equal (or at least comparable) steps between any adjacent pair of grade levels.However, more careful consideration leads to the rejection of that possibility. It would be odd atbest and misleading at worst if a school or district were not able to claim that the fourth-gradepassages in their assessment system were more difficult than the third-grade passages by an amount
EDUCATIONAL ASSESSMENT 141
Dow
nloa
ded
by [
The
UC
San
ta C
ruz
Uni
vers
ity L
ibra
ry]
at 1
3:17
16
Oct
ober
201
7

that was similar to the difference between third-and second-grade passages. To assume otherwisewould be tantamount to saying that students at different grade levels are required to meet differentamounts of challenge to meet a common standard such as a year-worth of growth in school.
Another important point about CBMs is that evidence points to their increasing use for diag-nostic purposes (Albee et al., 2013; Kaminski et al., 2007) and as indices of growth (Christ,Monaghen, Zopluoglu, & Van Norman, 2013), thereby moving them into definite curricular-shapingroles (e.g., Shelton et al., 2009). Further, the DIBELS developer’s position paper on the use ofDIBELS for accountability suggests that DIBELS can be used for system accountability:
Aggregation of DIBELS data at the systems level provides information that may be used to examine theeffectiveness of the instructional supports within a classroom, school, or district to help determine whenchanges should be made. (Kaminski et al., 2007, p. 1)
Scaling text complexity
For the task of scaling text complexity in an accurate, valid manner, literally hundreds of textcomplexity quantitative tools have been developed since the early 1920s (Klare, 1984). Mesmer(2007) has described two generations of text complexity systems.
First-generation toolsFirst-generation tools typically rely on word and sentence difficulty in determining a text’s read-ability, with the calculation done by hand or mechanically and with reference to conversion tables.Examples include the Flesch-Kincaid Grade Level (Kincaid, Fishburne, Rogers, & Chissom, 1975)and the Fry Readability Graph (Fry, 1977). Of the first-generation formulas, the Flesch-Kincaid is themost prominent in use today (as part of most word-processing programs).
The Flesch-Kincaid formula essentially is a multiple regression equation as shown below:
Grade Level of Text ¼ 0:39 � ASLþ 11:8 � ASW� 15:59 (1)
where ASL represents average sentence length and ASW represents average number of syllables per word.In Equation 1, 11.8 is the weight given to average word difficulty (i.e., average number of syllables perword), while 0.39 is the weight given to sentence difficulty (i.e., average words per sentence). Resultingreadability scores correspond to grade levels (e.g., a score of 10 corresponds to Grade-10 readability).
Second-generation toolsSecond-generation tools analyze texts digitally, allowing developers to use large corpora of text invalidating formulas. Even with greater digital capability, however, word and sentence factors— thesame foci of the first-generation tools—have dominated the digital systems. The Lexile Frameworkfor Reading (Lexiles; Stenner, Burdick, Sanford, & Burdick, 2006) and Degrees of Reading Power(DRP; Koslin, Zeno, & Koslin, 1987) illustrate second-generation tools. The Lexile Framework is themost widely used with its influence expanding as evidenced by its use in defining text levels for gradebands in Appendix A of the Common Core State Standards (CCSS; National Governors Association[NGA], Center for Best Practices [CBP], & Council of Chief State School Officers [CCSSO], 2010).
The developers of the Lexile Framework claim that it is not a readability formula (Smith, Stenner,Horabin, & Smith, 1989). Even so, Lexile’s equation for scaling text complexity is based on the sametwo-factor model of text complexity as the first-generation readability formulas, as shown below(Stenner & Fisher, 2013):
Text Difficulty (in logit2
) = (9.82247 � LMSL)−(2.14634 � MLWF)− constant (2)
where LMSL is the log of mean sentence length and MLWF is the mean of the log of the frequenciesof each word in a text. Frequency is determined by the ranking of a word in a proprietorial multi-
2Logit is a unit of measurement that represents an exponential distance between the reader’s ability and the text’s difficulty, andone logit equals to 180L. See Stenner (1996) for details about rescaling text’s difficulty on the logit scale to the Lexile scale.
142 Y. TOYAMA ET AL.
Dow
nloa
ded
by [
The
UC
San
ta C
ruz
Uni
vers
ity L
ibra
ry]
at 1
3:17
16
Oct
ober
201
7

billion word corpus of text (Stenner & Fisher, 2013). A Lexile score typically ranges from below 0 to2000L, with 200L anchored at the difficulty of first-grade basal texts and 1000L at that of a typicalencyclopedia passage (Stenner et al., 2006). Its developers describe the Lexile scale as an intervalscale, with one unit having the same meaning across the scale’s range (Stenner et al., 2006) butseveral psychometricians have recently challenged this claim (Briggs, 2013; Domingue, 2014; Markus& Borsboom, 2013).
Third-generation toolsRecent years have seen the rise of quantitative analysis tools that use sophisticated statistical methodsand multiple measures to determine text complexity. Coh-Metrix (Graesser, McNamara, &Kulikowich, 2011), TextEvaluator (TE, formerly known as Source-Rater; Sheehan, Kostin,Napolitano, & Flor, 2014), and Reading Maturity Metric (RMM; Landauer, Kireyev, & Panaccione,2011) illustrate what might be called third-generation tools.
The RMM measures a range of text structure features and vocabulary (Landauer et al., 2011).Vocabulary, identified as Word Maturity, is an application of Latent Semantic Analysis, a mathe-matical model of human language that simulates the development of word meanings as learners’exposure to language increases. RMM provides an overall text complexity score in grade-level unitsand, additionally identifies the 10 most difficult words in a given text.
The TE system bases a text’s complexity on eight dimensions: (a) academic vocabulary, (b)syntactic complexity, (c) word concreteness, (d) word unfamiliarity, (e) interactive/ conversationalstyle, (f) degree of narrativity, (g) lexical cohesion, and (h) argumentation (Sheehan et al., 2014).These are principal components—moderately or highly correlated text features based on patterns ofco-occurrence among 43 text features—derived from Principal Component Analysis. These eightcomponents, in concert, accounted for over 60% of variation in text difficulty across a wide range ofpassages as judged by human experts. Another unique feature of TE is that it provides threeprediction models, each specific to a text type (narrative, informational, or mixed). According toSheehan et al. (2014), these separate models overcome the genre bias in predicting text difficulty (i.e.,overestimation of informational text caused by the repetition of rare content words and under-estimation of narrative text due to short sentences in dialogue).
Comparisons across quantitative toolsThe four analytical tools of text complexity that are used in this study are listed in Table 1. Nelson,Perfetti, Liben, and Liben (2012) compared the strength of these four tools and three additionalones3—ATOS (Milone, 2008), DRP (Koslin et al., 1987), and Reader-Specific Practice (REAP;Heilman, Collins-Thompson, Callan, & Eskenazi, 2006) in predicting (a) grade-level placements oftext exemplars from Appendix B of the CCSS made by human judges and (b) student comprehen-sion performance on passages from the Stanford Achievement Test (SAT-9) and the Gates-MacGinite Reading Test, Form S.
Nelson et al. (2012) reported that rank-order correlations were reasonably high for all analyticsystems except for REAP. Correlations with grade-band placements of CCSS exemplars ranged froma low of .50 (Lexiles) to a high of .76 (SourceRater—the earlier version of TE). Correlations werehigher with reference measures that were based on student performance on standardized tests,ranging from .70 (Lexiles) to .80 (SourceRater) for the SAT-9. Nelson et al. (2012) concluded thatthe multiple-factor text analytic systems—RMM and SourceRater—tended to have higher correla-tions, especially of text levels as determined by human judges, than two-factor tools, such as Lexileand ATOS. This finding lends support for the inclusion of the RMM and TE, along with the twowidely used systems—Lexile and Flesch Kincaid— in the current study, given the fact the
3Coh-Metrix (Graesser et al., 2011) was originally part the study but not part of comparative correlational analysis because thissystem provided only multidimensional indices. Subsequent to the study, Graesser et al. (2014) have developed a single index.
EDUCATIONAL ASSESSMENT 143
Dow
nloa
ded
by [
The
UC
San
ta C
ruz
Uni
vers
ity L
ibra
ry]
at 1
3:17
16
Oct
ober
201
7
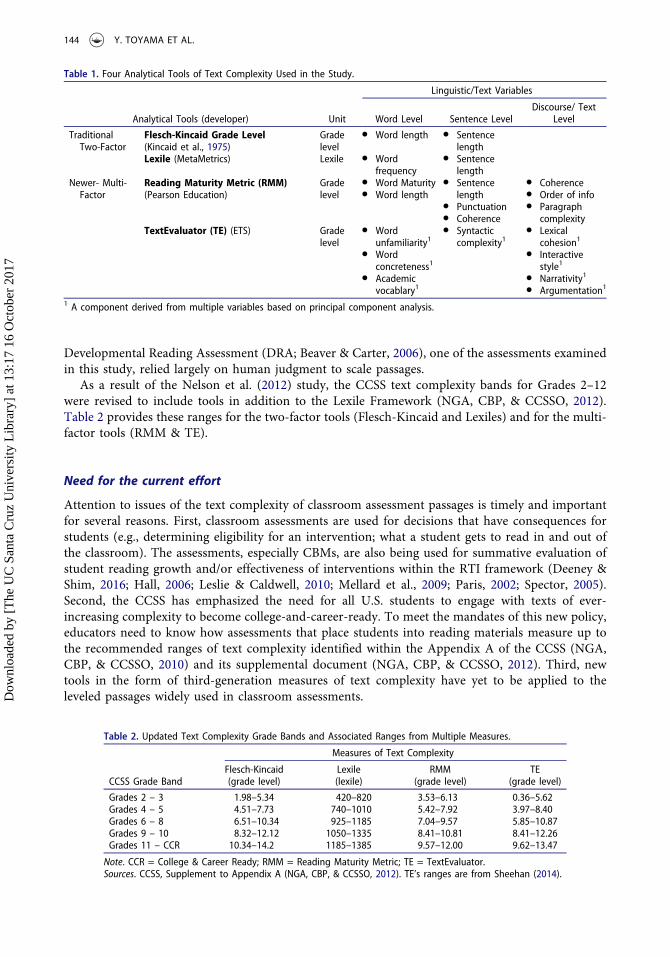
Developmental Reading Assessment (DRA; Beaver & Carter, 2006), one of the assessments examinedin this study, relied largely on human judgment to scale passages.
As a result of the Nelson et al. (2012) study, the CCSS text complexity bands for Grades 2–12were revised to include tools in addition to the Lexile Framework (NGA, CBP, & CCSSO, 2012).Table 2 provides these ranges for the two-factor tools (Flesch-Kincaid and Lexiles) and for the multi-factor tools (RMM & TE).
Need for the current effort
Attention to issues of the text complexity of classroom assessment passages is timely and importantfor several reasons. First, classroom assessments are used for decisions that have consequences forstudents (e.g., determining eligibility for an intervention; what a student gets to read in and out ofthe classroom). The assessments, especially CBMs, are also being used for summative evaluation ofstudent reading growth and/or effectiveness of interventions within the RTI framework (Deeney &Shim, 2016; Hall, 2006; Leslie & Caldwell, 2010; Mellard et al., 2009; Paris, 2002; Spector, 2005).Second, the CCSS has emphasized the need for all U.S. students to engage with texts of ever-increasing complexity to become college-and-career-ready. To meet the mandates of this new policy,educators need to know how assessments that place students into reading materials measure up tothe recommended ranges of text complexity identified within the Appendix A of the CCSS (NGA,CBP, & CCSSO, 2010) and its supplemental document (NGA, CBP, & CCSSO, 2012). Third, newtools in the form of third-generation measures of text complexity have yet to be applied to theleveled passages widely used in classroom assessments.
Table 1. Four Analytical Tools of Text Complexity Used in the Study.
Analytical Tools (developer) Unit
Linguistic/Text Variables
Word Level Sentence LevelDiscourse/ Text
Level
TraditionalTwo-Factor
Flesch-Kincaid Grade Level(Kincaid et al., 1975)
Gradelevel
● Word length ● Sentencelength
Lexile (MetaMetrics) Lexile ● Wordfrequency
● Sentencelength
Newer- Multi-Factor
Reading Maturity Metric (RMM)(Pearson Education)
Gradelevel
● Word Maturity● Word length
● Sentencelength
● Punctuation● Coherence
● Coherence● Order of info● Paragraph
complexityTextEvaluator (TE) (ETS) Grade
level● Word
unfamiliarity1
● Wordconcreteness1
● Academicvocablary1
● Syntacticcomplexity1
● Lexicalcohesion1
● Interactivestyle1
● Narrativity1
● Argumentation1
1 A component derived from multiple variables based on principal component analysis.
Table 2. Updated Text Complexity Grade Bands and Associated Ranges from Multiple Measures.
CCSS Grade Band
Measures of Text Complexity
Flesch-Kincaid(grade level)
Lexile(lexile)
RMM(grade level)
TE(grade level)
Grades 2 – 3 1.98–5.34 420–820 3.53–6.13 0.36–5.62Grades 4 – 5 4.51–7.73 740–1010 5.42–7.92 3.97–8.40Grades 6 – 8 6.51–10.34 925–1185 7.04–9.57 5.85–10.87Grades 9 – 10 8.32–12.12 1050–1335 8.41–10.81 8.41–12.26Grades 11 – CCR 10.34–14.2 1185–1385 9.57–12.00 9.62–13.47
Note. CCR = College & Career Ready; RMM = Reading Maturity Metric; TE = TextEvaluator.Sources. CCSS, Supplement to Appendix A (NGA, CBP, & CCSSO, 2012). TE’s ranges are from Sheehan (2014).
144 Y. TOYAMA ET AL.
Dow
nloa
ded
by [
The
UC
San
ta C
ruz
Uni
vers
ity L
ibra
ry]
at 1
3:17
16
Oct
ober
201
7

Given the situation that currently confronts the field—(a) a set of widely used consequentialclassroom assessments that have either questionable or unknown properties when it comes toleveling of their assessment passages, along with (b) the presence of new tools to scale text complex-ity—we undertook an investigation of the complexity of leveled passages used in popular classroomassessments. In attempting to achieve that goal, we addressed four related questions:
(1) How do the trajectories of text complexity compare across widely used classroomassessments?
(2) How do these assessments compare in terms of the within-grade equivalency in textcomplexity?
(3) In comparison to more traditional tools, do newer analytic tools of text complexity revealdifferent or additional information about the across-grade progression and the within-gradeequivalency?
(4) How well is the text complexity progression of these assessments aligned with the expecta-tions of the staircase of complexity in the CCSS?
Method
Selection of classroom assessments
The passages used in the current study came from four commonly used assessment systems—three IRIsand one CBM (see Table 3). Each of these assessments is administered individually, requiring a studentread a passage and respond to comprehension and/or retelling prompts, to determine student readingperformance on graded passages. At the same time, each assessment has unique properties, as outlinedin the descriptions below, which are adapted from the manuals provided by the publishers.
Informal reading inventories (IRIs)The Basic Reading Inventory (BRI; 11th edition, Johns, 2012) and the Qualitative Reading Inventory(QRI; 5th edition, Leslie & Caldwell, 2010) are commercially available IRIs that involve a teacherrecording a student’s reading miscues when orally reading a passage, rate of reading, and responsesto comprehension or retelling questions. Additionally, both IRIs provide graded word lists for theteacher to determine a starting passage for assessment, as well as questions to elicit student priorknowledge. Student’s instructional level placement is derived from traditionally agreed criteria fororal reading accuracy and comprehension. Also can be collected are diagnostic information aboutstudent sources of errors, and patterns of comprehension and retelling.
The length of BRI passages are standardized to around 100 words across Grade 1 though Grade12 except for very short pre-primer and primer passages (25–50 words) and longer passages (250words) available at Grade 3 and above. In contrast, QRI’s passage length is much more variableacross grades from 44 words for a pre-primer passage through 1,224 words for a high school passage.The manuals of BRI and QRI report the use of multiple readability formulas, such as Fry, Flesch-Kincaid, and Lexile, as part of their passage leveling process. However, neither system used the third-generation text complexity analytic tools. For the within-level equivalency, both IRIs report alter-native form reliability (for details, see Table 3).
The Developmental Reading Assessment (DRA; 2nd edition, Beaver & Carter, 2006) is based onthe assessment traditions of Reading Recovery—an individualized reading intervention program forstruggling readers in first grade (Clay, 1994). However, DRA extended the logic of the ReadingRecovery assessment in three ways: (a) regular teachers, not specialists, administer the assessment,(b) all students, initially in K-3 and now in K-8, are the target of the assessment, rather than the “atrisk” first graders, and (c) comprehension, in addition to oral reading, is assessed (Pearson LearningGroup, 2003). In the administration of the DRA, teachers record reading accuracy, oral reading rates,
EDUCATIONAL ASSESSMENT 145
Dow
nloa
ded
by [
The
UC
San
ta C
ruz
Uni
vers
ity L
ibra
ry]
at 1
3:17
16
Oct
ober
201
7
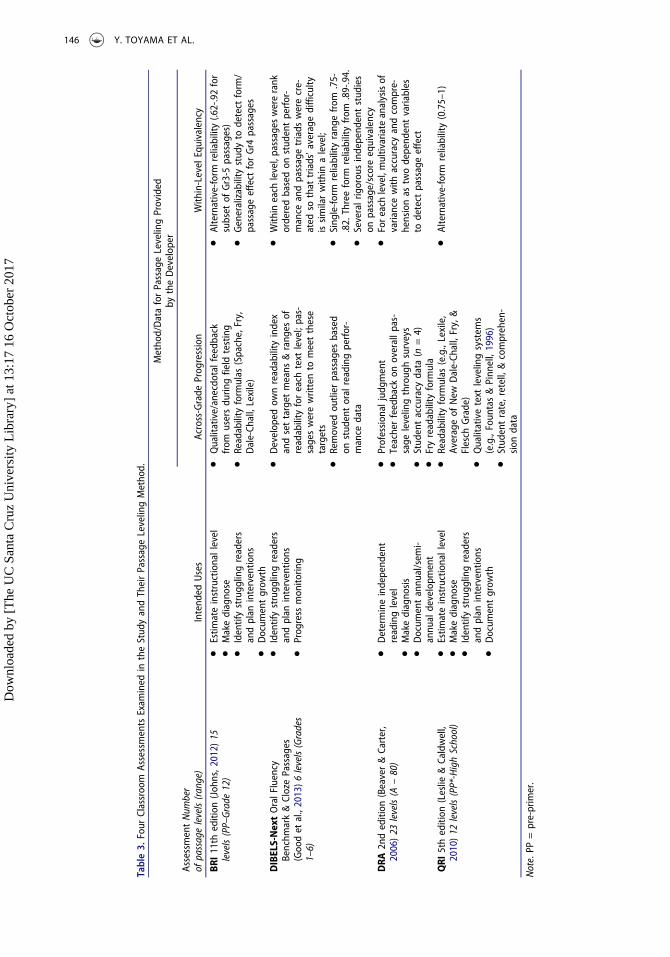
Table3.
Four
Classroom
Assessments
Exam
ined
intheStud
yandTheirPassageLevelingMetho
d.
Metho
d/DataforPassageLevelingProvided
bytheDevelop
er
AssessmentNum
ber
ofpassagelevels(range)
Intend
edUses
Across-Grade
Prog
ression
With
in-Level
Equivalency
BRI11th
edition
(Joh
ns,2
012)
15levels(PP–Grade
12)
●Estim
ateinstructionallevel
●Makediagno
se●
Identifystrugg
lingreaders
andplan
interventio
ns●
Docum
entgrow
th
●Qualitative/anecdo
talfeedb
ack
from
usersdu
ringfield
testing
●Readability
form
ulas
(Spache,Fry,
Dale-Ch
all,Lexile)
●Alternative-form
reliability(.62-.92for
subset
ofGr3-5
passages)
●Generalizability
stud
yto
detect
form
/passageeffect
forGr4
passages
DIBELS-NextOralFluency
Benchm
ark&ClozePassages
(Goodet
al.,2013)6levels(Grades
1–6)
●Identifystrugg
lingreaders
andplan
interventio
ns●
Prog
ress
mon
itorin
g
●Develop
edow
nreadability
index
andsettarget
means
&rang
esof
readability
foreach
text
level;pas-
sageswerewrittento
meetthese
targets
●Removed
outlier
passages
based
onstud
entoralreadingperfor-
mance
data
●With
ineach
level,passages
wererank
orderedbasedon
stud
entperfor-
mance
andpassagetriads
werecre-
ated
sothat
triads’average
difficulty
issimilarwith
inalevel;
●Sing
le-form
reliabilityrang
efrom
.75-
.82.
Threeform
reliabilityfrom
.89-.94.
●Severalrigorou
sindepend
entstud
ies
onpassage/scoreequivalency
DRA
2ndedition
(Beaver&Carter,
2006)23
levels(A
–80)
●Determineindepend
ent
readinglevel
●Makediagno
sis
●Docum
entannu
al/sem
i-annu
aldevelopm
ent
●Profession
aljudg
ment
●Teacherfeedback
onoverallp
as-
sage
levelingthroug
hsurveys
●Stud
entaccuracy
data
(n=4)
●Fryreadability
form
ula
●Fore
achlevel,multivariate
analysisof
variancewith
accuracy
andcompre-
hensionas
twodepend
entvariables
todetect
passageeffect
QRI
5thedition
(Leslie
&Caldwell,
2010)12
levels(PP*-HighSchool)
●Estim
ateinstructionallevel
●Makediagno
se●
Identifystrugg
lingreaders
andplan
interventio
ns●
Docum
entgrow
th
●Readability
form
ulas
(e.g.,Lexile,
Averageof
New
Dale-Ch
all,Fry,&
Flesch
Grade)
●Qualitativetext
levelingsystem
s(e.g.,Foun
tas&Pinn
ell,1996)
●Stud
entrate,retell,&comprehen-
sion
data
●Alternative-form
reliability(0.75–1)
Note.PP
=pre-primer.
146 Y. TOYAMA ET AL.
Dow
nloa
ded
by [
The
UC
San
ta C
ruz
Uni
vers
ity L
ibra
ry]
at 1
3:17
16
Oct
ober
201
7

retelling quality, and comprehension performance as students progress through a set of gradedpassages.
The DRA is distinguished from the QRI and the BRI in three important aspects. First, the DRAhas more levels than either of the IRIs, covering many more levels from Kindergarten through Grade8. These levels are set as benchmarks at different points in an academic year (for example, levels 3through 6 are benchmarks at the beginning of first grade while levels 16 and 18 are the benchmarksat the end of first grade). Second, the DRA differs from the other IRIs in text type and length; DRA’spassages are authentic texts that come in the form of booklets that have the look and feel of tradebooks, with full color artwork. The DRA passages vary from 20 words in length for Level A to 1,914words for Level 80.
Finally, the DRAdiffers fromBRI andQRI in themainmethod used to scale passages, privilegingwhatthe CCSS (National Governors Association [NGA], Center for Best Practices [CBP], & Council of ChiefState School Officers [CCSSO], 2010) identify as qualitative rather than quantitative indicators (seePearson & Hiebert, 2014). The majority of original K-3 assessment texts were chosen by a committee ofteachers from reading materials typically used in classrooms (e.g., Scotts Foreman Reading Systems) andsome passages were authored by teachers who were involved in the development of DRA. Further,following the logic of Reading Recovery, it was these teachers’ professional judgments that guided theleveling of theDRAbooks; both linguistic (e.g., use of repetitive language) and nonlinguistic features (e.g.,picture support) were taken into consideration in the leveling process (Pearson Learning Group, 2003).Although the manual mentions the use of the Fry readability formula, no details are provided about howit might have influenced the leveling outcomes for DRA. The leveling of the DRA assessment books wereverified by larger groups of field trial teachers with a few survey questions on a Likert-scale (e.g., “Thebooks were leveled appropriately”).
For the within-level equivalency, the manual reports that no passage effect was found at eachDRA level from Levels 6 –80 based on the multivariate analysis of variance (MANOVA) withaccuracy and comprehension as two dependent variables, with an exception of Level 34 (PearsonEducation, Inc., 2011). However, it is difficult to judge the validity of these results due to the lack ofdetails about how passages were distributed among students at different grade levels and aboutsample size for each MANOVA analysis (Rathvon, 2006).
Curriculum-based measureThe Dynamic Indicators of Basic Early Literacy Skills (DIBELS; Good et al., 2013) served as thecurriculum-based measure. DIBELS is composed of sequenced subtests that assess literacy skills ofstudents from Grades K to 6. The present investigation focused on DIBELS oral reading fluency(DORF), which is administered in winter and spring of Grade 1 and subsequently, administeredthree times per year (fall, winter, spring) from Grades 2 to 6. For the DORF, students read aloudthree passages at a particular level for 1 minute each. The teacher records the median number ofwords read correctly.
DORF passages were written and selected to meet grade-specific ranges of readability as determinedby the Dynamic Measurement Group Passage Difficulty Index (Cummings, Wallin, Good, & Kaminski,2007; Good et al., 2013). This index analyzes decoding difficulty (e.g., number of characters in word),word difficulty (e.g., proportion of rare word), and syntactic difficulty (e.g., number of syllables persentence). To ensure within-level equivalency, triads of passages were carefully created based on studentoral reading data so that the average difficulties of the triads of passages would be comparable for aparticular benchmarking period. For the within-grade passage equivalency, the manual reports single-form reliability ranges from .75 to .82 while three-form reliability varies from .89 to .94 (Good et al.,2013).
Table 3 summarizes the passage levels and the methods described by the four publishers of theassessments as the basis for their leveling. All four publishers claim to have used some quantitativemeasurement of text complexity in determining levels but none used the new, multi-factor measuresof text complexity.
EDUCATIONAL ASSESSMENT 147
Dow
nloa
ded
by [
The
UC
San
ta C
ruz
Uni
vers
ity L
ibra
ry]
at 1
3:17
16
Oct
ober
201
7

Selection of passages
The four assessment systems provided a sample of 167 passages for Grades 1 through 6. Threepassages with fewer than 100 words were dropped from the sample as they were judged too short tobe reliably analyzed. To maintain consistency across the four assessments, texts leveled below firstgrade (e.g., primer or kindergarten) and texts above sixth grade (the grade-level designation wasdone by the assessment developers) were eliminated. Additionally, to make the cross-assessmentcomparisons possible, DRA’s passages were regrouped into coarser grade levels based on theinformation provided in DRA’s technical manuals and assessment materials (Beaver & Carter,2006; Pearson Education, Inc., 2011; Pearson Learning Group, 2003). A text file was created foreach passage with title and headings removed. Table 4 provides the breakdown of the number ofpassages by grade levels and assessments.
Analyses of texts
Each of the four quantitative measures of text complexity (see Table 1) were used to analyze thepassages: Lexile, Flesch-Kincaid, RMM and TE. The first two—Lexile and Flesch-Kincaid—werechosen to represent two-factor, more traditional tools that have been and continue to be widely usedin education. The latter two—RMM and TE—are referred as newer, multi-factor measures and wereselected because they (a) employ a multi-dimensional approach to scaling text complexity, (b)provide an overall complexity score and (c) effectively predicted text complexity in the Nelsonet al. (2012) study. Pairwise correlations among the four analytical tools, obtained in this study,ranged from 0.75 and 0.88 (Table 5).
Even though all the four analytic tools are available publicly online, developers of Lexile and TEoffered batch analyses of the sample. For RMM analysis, we used its online beta version (http://www.readingmaturity.com). Flesch-Kincaid’s overall complexity scores were obtained as part of the RMManalysis.
All four analytical tools provided scores of text complexity for a passage, three in grade-levelmetrics and the fourth in Lexiles (represented with L). We should note that, while a passage was thebasic unit in these analyses, we treated passages belonging to a given grade level as a set, which formsa step in the text complexity staircase, and examined summary statistics (e.g., mean, range) atpassages’ grade levels. This enabled the examination of across-grade progression as well as thewithin-grade variability in complexity of the assessment passages.
Table 5. Correlations between the Four Analytical Tools of Text Complexity Used in the Study.
Measures 1. 2. 3. 4.
1. Lexile −2. Flesch Kincaid 0.88 −3. RMM 0.84 0.79 −4. TextEvaluator 0.76 0.76 0.81 −
Table 4. Distribution of the Passages by Grade Levels and Assessments.
Assessment Grade 1 Grade 2 Grade 3 Grade 4 Grade 5 Grade 6 Total
BRI 5 5 7 7 5 6 35DIBELS 6 9 9 9 9 9 51DRA 10 14 12 4 4 4 48QRI 4 5 5 6 6 7 33Total 25 34 38 26 24 26 167
148 Y. TOYAMA ET AL.
Dow
nloa
ded
by [
The
UC
San
ta C
ruz
Uni
vers
ity L
ibra
ry]
at 1
3:17
16
Oct
ober
201
7
Results
The four research questions of this study pertain to: (a) across-grade patterns of text complexity ofthe four assessments, (d) within-grade equivalency in text complexity, (c) the nature of informationprovided by new, multi-factor text complexity tools relative to two-factor text complexity tools, and(d) the alignment of the text complexity progression of the four assessments with the CCSSexpectations. Results from the analysis of the assessment passages with the two-factor text analysistools are used to answer the first two questions. Results from all four analytical tools are used toaddress the third question. The last question is addressed with results from a two-factor and a multi-factor analysis tool—Lexile and RMM. Results from Flesch-Kincaid and TE are provided in the on-line supplementary materials.
Across-grade progression (Question 1)
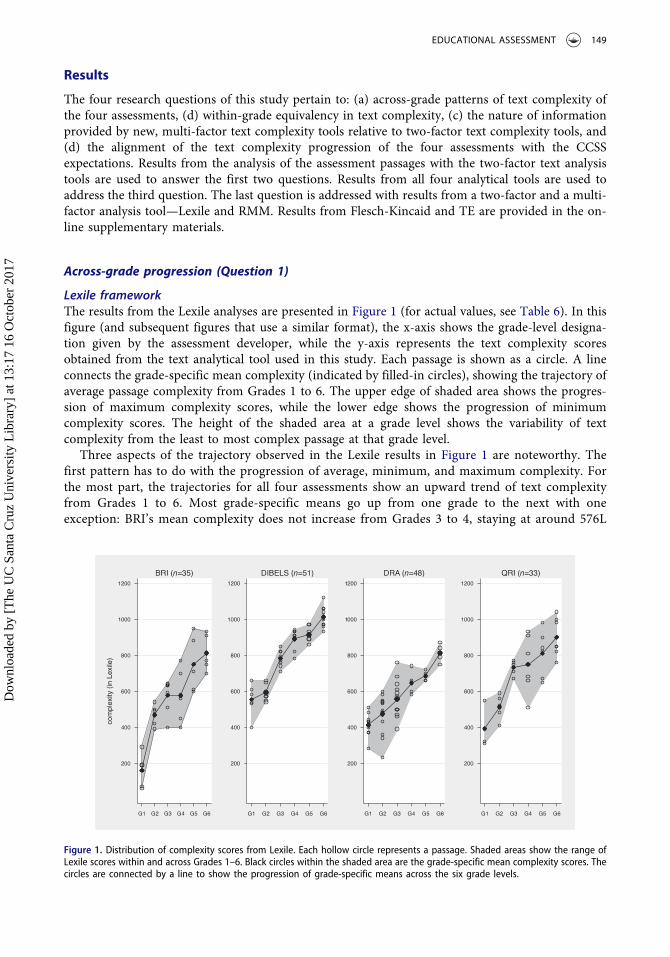
Lexile frameworkThe results from the Lexile analyses are presented in Figure 1 (for actual values, see Table 6). In thisfigure (and subsequent figures that use a similar format), the x-axis shows the grade-level designa-tion given by the assessment developer, while the y-axis represents the text complexity scoresobtained from the text analytical tool used in this study. Each passage is shown as a circle. A lineconnects the grade-specific mean complexity (indicated by filled-in circles), showing the trajectory ofaverage passage complexity from Grades 1 to 6. The upper edge of shaded area shows the progres-sion of maximum complexity scores, while the lower edge shows the progression of minimumcomplexity scores. The height of the shaded area at a grade level shows the variability of textcomplexity from the least to most complex passage at that grade level.
Three aspects of the trajectory observed in the Lexile results in Figure 1 are noteworthy. Thefirst pattern has to do with the progression of average, minimum, and maximum complexity. Forthe most part, the trajectories for all four assessments show an upward trend of text complexityfrom Grades 1 to 6. Most grade-specific means go up from one grade to the next with oneexception: BRI’s mean complexity does not increase from Grades 3 to 4, staying at around 576L
n n n n
Figure 1. Distribution of complexity scores from Lexile. Each hollow circle represents a passage. Shaded areas show the range ofLexile scores within and across Grades 1–6. Black circles within the shaded area are the grade-specific mean complexity scores. Thecircles are connected by a line to show the progression of grade-specific means across the six grade levels.
EDUCATIONAL ASSESSMENT 149
Dow
nloa
ded
by [
The
UC
San
ta C
ruz
Uni
vers
ity L
ibra
ry]
at 1
3:17
16
Oct
ober
201
7

Table6.
Grade-Specific
SummaryStatisticsforLexile
Scores
byAssessment.
BRI
DIBELS
DRA
QRI
Grade
M(SD)
min
max
NM
(SD)
min
max
NM
(SD)
min
max
NM
(SD)
min
max
N
G1
160.0
(95.9)
60290
5553.3
(88.9)
400
660
6412.0
(63.9)
280
510
10392.5
(110.9)
310
550
4G2
468.0
(61.4)
390
540
5592.2
(41.2)
540
660
9473.6
(102.9)
230
600
14512.0
(70.5)
410
590
5G3
577.1
(90.9)
400
640
7782.2
(43.5)
710
850
9555.8
(105.3)
390
760
12732.0
(41.5)
670
770
5G4
575.7
(129.2)
400
770
7890.0
(54.3)
780
940
9645.0
(71.9)
580
740
4750.0
(162.6)
510
930
6G5
750.0
(158.6)
600
950
5915.6
(36.4)
860
970
9685.0
(30.0)
660
720
4810.0
(129.0)
650
980
6G6
811.7
(91.3)
700
930
61012.2
(61.4)
930
1120
9812.5
(53.2)
750
870
4900.0
(105.7)
760
1040
7Overall
566.6
(226.8)
60950
35804.9
(172.4)
400
1120
51541.5
(144.1)
230
870
48710.6
(199.2)
310
1040
33With
in-grade
rang
eM
(SD)
With
in-grade
rang
eM
(SD)
With
in-grade
rang
eM
(SD)
With
in-grade
rang
eM
(SD)
261.67
(83.05)
163.33
(55.38)
218.33
(129.83)
258.33
(112.50)
Note.Rang
ewas
calculated
bysubtractingtheminimum
complexity
scorefrom
themaximum
complexity
scorewith
ingrade.Itwas
then
averaged
across
thesixgrades.N
umbersin
parenthesis
arestandard
deviations.
150 Y. TOYAMA ET AL.
Dow
nloa
ded
by [
The
UC
San
ta C
ruz
Uni
vers
ity L
ibra
ry]
at 1
3:17
16
Oct
ober
201
7

(see the flat line in the left most panel in Figure 1). Overall, the maximum and the minimumcomplexity scores also rise as the grade level of passages increases (see the edges of the shadedarea climbing up in Figure 1). However, DRA’s maximum and minimum and QRI’s minimumvalues show some instances of decline in complexity as the grade level increases (e.g., QRI’sminimum value show a sharp decline from Grades 3 to 4 and DRA’s maximum value decreasesover Grades 3 to 5).
Second, differences in grade-to-grade changes in text complexity among the four assessmentsmerit attention. Mean complexity generally increases with grade level across all four assessments, butdifferences are evident in the size of the increase from grade to grade on particular assessments.DRA’s mean text complexity shows small increments of increase from Grades 1 to 5 and a largejump at the end of the progression from Grades 5 to 6 (685L to 813L). In contrast, the other threeassessments tend to show larger increases at the beginning of the trajectory with the size of theincreases tapering off in the later grades.
The third pattern has to do with start and end points of the progressions of text complexity.Assessments differ in the start and end points of the progression with the BRI assessment at one extremewith a low starting range in Grade 1 (from 60L to 290L) and a low end range in Grade 6 (from 700L to930L; recall that a range is represented as a height of the shaded area at a given grade level in Figure 1). Atthe other extreme is DIBELS with a high start range in Grade 1 (from 400L to 660L) and the highest endrange of all assessments in Grade 6 (from 930L to 1120L). This may reflect little more than the fact thatDIBELS is designed with the logic of a CBM— it attempts tomeasure reading performance with passageswhose difficulty is set at the end-of-grade level. Consequently, DIBELS’ passages are skewed toward theupper end of the difficulty band for each grade. In terms of an overall range across all grade levels fromthe least to the most complex passage within an assessment, BRI covers the widest span (60L to 950L),while DRA covers the narrowest (230L to 870L).
A regression analysis using Lexile scores treated as a response variable and grade level, theassessments, and their interactions as predictor variables was conducted to determine whethergrade-specific means were statistically different from one another. The regression model usedWhite’s robust estimator for standard error to adjust for heteroscedasticity (White, 1980). Detailsof this analysis are provided in Appendix (Table A1).
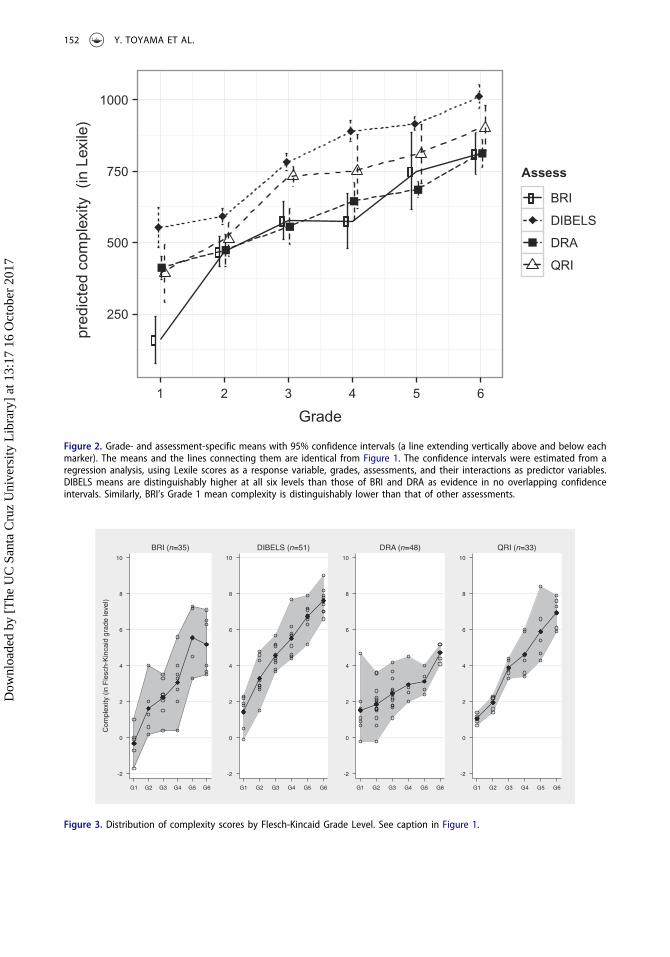
Figure 2 shows the grade- and assessment-specific mean complexity scores estimated by theregression models. A vertical line extending above and below each estimated mean represents the95% confidence interval for the mean. As can be seen in the non-overlapping confidence intervals inFigure 2, BRI’s estimated mean complexity for Grade 1 is significantly lower compared to the otherassessments. DIBELS’ estimated means are significantly higher than those of BRI and DRA at all sixgrade levels. Post-hoc multiple comparisons with Šidák corrections (Šidák, 1967) confirmed theseobservations (see Figure 9 and Table A2 in Appendix).
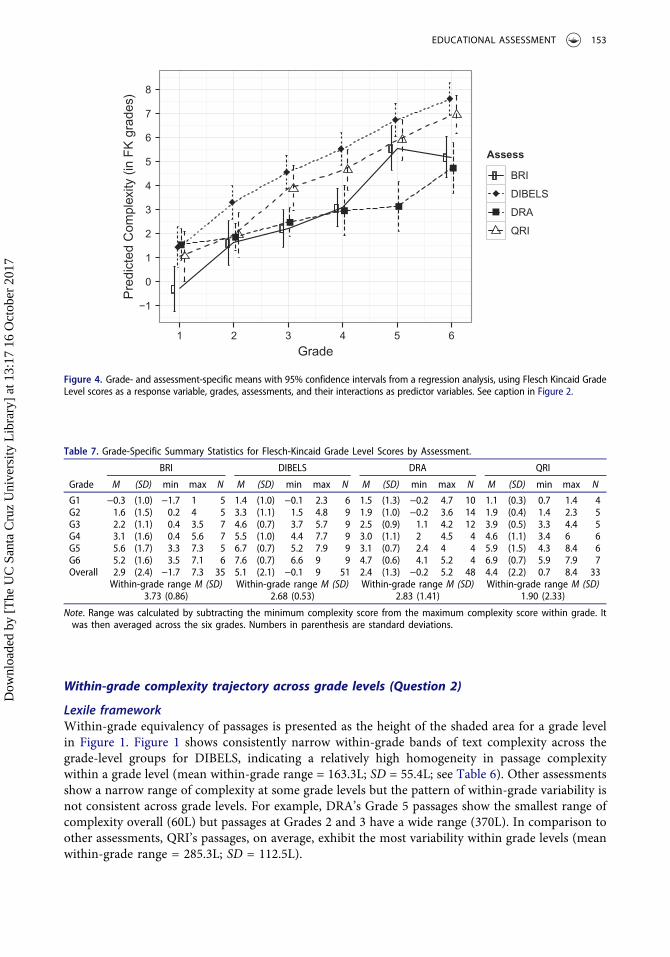
Flesch-KincaidThe results from the Flesch-Kincaid analyses, provided in Figures 3 and 4, reveal similar trends tothose observed with Lexile (Table 7 provides values corresponding to the figures). A general trend ofupward trajectory for between-grade progression was observed across the four assessments.Differences across assessments are evident at the starting point of the progression. The first-gradepassages of BRI show a lower range of complexity (from −1.7 to 1 in Flesch-Kincaid grade-level unit)than the other assessments. In contrast, DIBELS’ first-grade passages start out at a higher range(from −0.1 to 2.3) and its six-grade passages achieve the highest range of any assessments (from 6.6to 9).
One distinct difference from the Lexile results is that the regression analysis with Flesch-Kincaidresults indicates that DRA’s mean complexity at Grade 5 is distinctively lower than that of otherthree assessments (see Figure 4). The post-hoc multiple comparisons confirmed its statisticalsignificance (see Figure 9 under Flesch-Kincaid results) of this finding.
EDUCATIONAL ASSESSMENT 151
Dow
nloa
ded
by [
The
UC
San
ta C
ruz
Uni
vers
ity L
ibra
ry]
at 1
3:17
16
Oct
ober
201
7
250
500
750
1000
1 2 3 4 5 6
Grade
pred
icte
d co
mpl
exity
(in
Lex
ile)
Assess
BRI
DIBELS
DRA
QRI
Figure 2. Grade- and assessment-specific means with 95% confidence intervals (a line extending vertically above and below eachmarker). The means and the lines connecting them are identical from Figure 1. The confidence intervals were estimated from aregression analysis, using Lexile scores as a response variable, grades, assessments, and their interactions as predictor variables.DIBELS means are distinguishably higher at all six levels than those of BRI and DRA as evidence in no overlapping confidenceintervals. Similarly, BRI’s Grade 1 mean complexity is distinguishably lower than that of other assessments.
n n n n
Figure 3. Distribution of complexity scores by Flesch-Kincaid Grade Level. See caption in Figure 1.
152 Y. TOYAMA ET AL.
Dow
nloa
ded
by [
The
UC
San
ta C
ruz
Uni
vers
ity L
ibra
ry]
at 1
3:17
16
Oct
ober
201
7
Within-grade complexity trajectory across grade levels (Question 2)
Lexile frameworkWithin-grade equivalency of passages is presented as the height of the shaded area for a grade levelin Figure 1. Figure 1 shows consistently narrow within-grade bands of text complexity across thegrade-level groups for DIBELS, indicating a relatively high homogeneity in passage complexitywithin a grade level (mean within-grade range = 163.3L; SD = 55.4L; see Table 6). Other assessmentsshow a narrow range of complexity at some grade levels but the pattern of within-grade variability isnot consistent across grade levels. For example, DRA’s Grade 5 passages show the smallest range ofcomplexity overall (60L) but passages at Grades 2 and 3 have a wide range (370L). In comparison toother assessments, QRI’s passages, on average, exhibit the most variability within grade levels (meanwithin-grade range = 285.3L; SD = 112.5L).
−1
0
1
2
3
4
5
6
7
8
1 2 3 4 5 6
Grade
Pre
dict
ed C
ompl
exity
(in
FK
gra
des)
Assess
BRI
DIBELS
DRA
QRI
Figure 4. Grade- and assessment-specific means with 95% confidence intervals from a regression analysis, using Flesch Kincaid GradeLevel scores as a response variable, grades, assessments, and their interactions as predictor variables. See caption in Figure 2.
Table 7. Grade-Specific Summary Statistics for Flesch-Kincaid Grade Level Scores by Assessment.
BRI DIBELS DRA QRI
Grade M (SD) min max N M (SD) min max N M (SD) min max N M (SD) min max N
G1 −0.3 (1.0) −1.7 1 5 1.4 (1.0) −0.1 2.3 6 1.5 (1.3) −0.2 4.7 10 1.1 (0.3) 0.7 1.4 4G2 1.6 (1.5) 0.2 4 5 3.3 (1.1) 1.5 4.8 9 1.9 (1.0) −0.2 3.6 14 1.9 (0.4) 1.4 2.3 5G3 2.2 (1.1) 0.4 3.5 7 4.6 (0.7) 3.7 5.7 9 2.5 (0.9) 1.1 4.2 12 3.9 (0.5) 3.3 4.4 5G4 3.1 (1.6) 0.4 5.6 7 5.5 (1.0) 4.4 7.7 9 3.0 (1.1) 2 4.5 4 4.6 (1.1) 3.4 6 6G5 5.6 (1.7) 3.3 7.3 5 6.7 (0.7) 5.2 7.9 9 3.1 (0.7) 2.4 4 4 5.9 (1.5) 4.3 8.4 6G6 5.2 (1.6) 3.5 7.1 6 7.6 (0.7) 6.6 9 9 4.7 (0.6) 4.1 5.2 4 6.9 (0.7) 5.9 7.9 7Overall 2.9 (2.4) −1.7 7.3 35 5.1 (2.1) −0.1 9 51 2.4 (1.3) −0.2 5.2 48 4.4 (2.2) 0.7 8.4 33
Within-grade range M (SD) Within-grade range M (SD) Within-grade range M (SD) Within-grade range M (SD)3.73 (0.86) 2.68 (0.53) 2.83 (1.41) 1.90 (2.33)
Note. Range was calculated by subtracting the minimum complexity score from the maximum complexity score within grade. Itwas then averaged across the six grades. Numbers in parenthesis are standard deviations.
EDUCATIONAL ASSESSMENT 153
Dow
nloa
ded
by [
The
UC
San
ta C
ruz
Uni
vers
ity L
ibra
ry]
at 1
3:17
16
Oct
ober
201
7

Flesch-KincaidConsistent with the results from Lexile, the Flesch-Kincaid results for within-grade passage equiv-alency indicate that DIBELS passages consistently reveal a narrow within-grade range of complexityacross the six grade levels (mean within-grade range = 2.7; SD = 0.5; see Figure 3 and Table 7). BRIpassages are most variable in terms of the average within-grade-level range (M = 3.7; SD = 0.9).Unlike the Lexile results, the Flesh-Kincaid analysis revealed that QRI has the smallest averagewithin-grade range of complexity (M = 1.90; SD = 2.3) but its relatively large standard deviationshows that QRI’s complexity score ranges are not consistent across grade levels.
To summarize both the Lexile and Flesch-Kincaid results indicate a general pattern of acrossgrade progression of mean text complexity as passages’ designated grade levels increase. However,there is considerable variability among the four assessments in the size of change from grade tograde, the start and end point of the across-grade progression, and the within-grade equivalency ofpassage complexity.
Patterns revealed with multi-component tools of text complexity (Question 3)
Results from the newer analytic tools of text complexity (RMM and TE) are shown in Figures 5–6 forRMM, while the TE results are presented in Figures 7–8 (Tables 8 and 9 provide the data for thesefigures respectively).
Patterns in Figures 5, 6, 7 and 8 suggest that the multi-component tools produce less pronounceddifferences in across-grade trajectories and within-grade equivalency in the four assessments than dothe two-factor tools. Direct comparison of Lexile results with RMM and TE results is not possibledue to the difference in the units that text complexity is scaled. However, when compared to theresults from Flesch-Kincaid, the distribution of complexity scores (i.e., the shape of the shaded areas)is more similar across the four assessments in Figure 5 (for RMM) and, to a lesser degree, in Figure 7(for TE). For example, the RMM results show the mean Grade 6 complexity scores to be similaracross the four assessments (mean complexity ranges from 5.9 for QRI to 6.9 for DIBELS, all in theRMM grade-level unit) while the means are more variable in the Flesch-Kincaid results (meancomplexity ranges from 4.7 for DRA to 7.6 for DIBELS, all in the Flesch-Kincaid Grade-Level unit).
n n n n
Figure 5. Distribution of complexity scores by RMM. Please see caption in Figure 1.
154 Y. TOYAMA ET AL.
Dow
nloa
ded
by [
The
UC
San
ta C
ruz
Uni
vers
ity L
ibra
ry]
at 1
3:17
16
Oct
ober
201
7

In examining within-grade equivalency of complexity, the RMM results in Figure 5 and Table 8reveal greater similarity across the four assessments than is the case for two-factor complexity tools.Consistent with the Lexile and Flesch-Kincaid results, the RMM results show that DIBELS’ averageheight of the shaded area across the six grades is smallest (M = 2.03; SD = 0.97) of the fourassessments. However, the average within-grade variability for the other assessments is not substan-tially different (for example, M = 2.62; SD = 0.38 for BRI and M = 2.15; SD = 0.86 for DRA). Thisconsistency of the within-grade equivalency can also be inferred from the smaller standard
1
2
3
4
5
6
7
8
1 2 3 4 5 6
Grade
Pre
dict
ed C
ompl
exity
(in
RM
M g
rade
s)
Assess
BRI
DIBELS
DRA
QRI
Figure 6. Grade- and assessment-specific means with 95% confidence intervals from a regression analysis, using RMM Grade Levelscores as a response variable, grades, assessments, and their interactions as predictor variables. Please see caption in Figure 2.
n n n n
Figure 7. Distribution of complexity scores by TextEvaluator. Please see caption in Figure 1.
EDUCATIONAL ASSESSMENT 155
Dow
nloa
ded
by [
The
UC
San
ta C
ruz
Uni
vers
ity L
ibra
ry]
at 1
3:17
16
Oct
ober
201
7
0
1
2
3
4
5
6
7
1 2 3 4 5 6
Grade
Pre
dict
ed C
ompl
exity
(in
TE
gra
des)
Assess
BRI
DIBELS
DRA
QRI
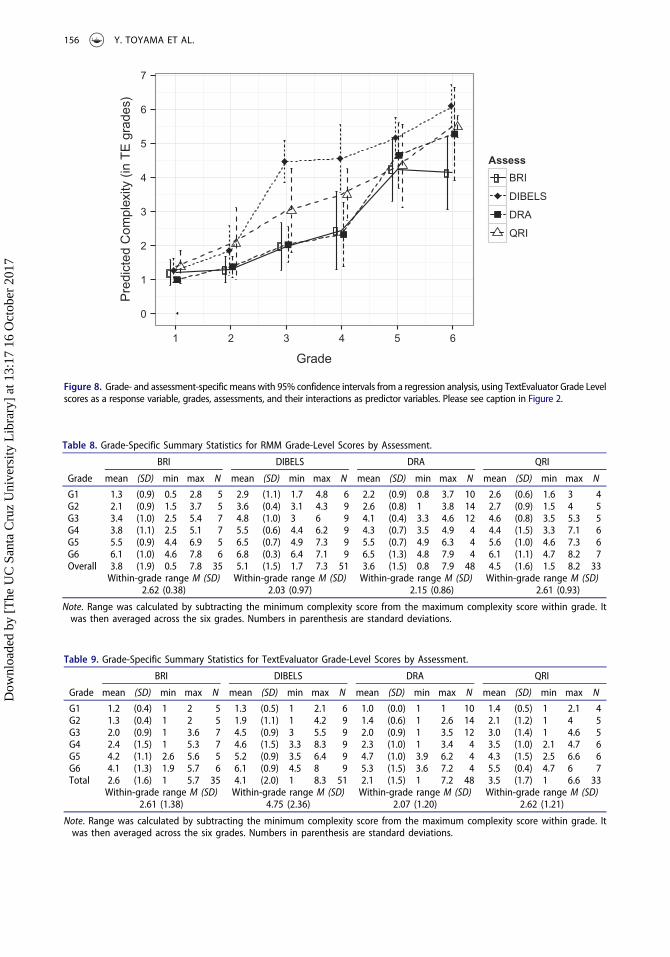
Figure 8. Grade- and assessment-specific means with 95% confidence intervals from a regression analysis, using TextEvaluator Grade Levelscores as a response variable, grades, assessments, and their interactions as predictor variables. Please see caption in Figure 2.
Table 8. Grade-Specific Summary Statistics for RMM Grade-Level Scores by Assessment.
BRI DIBELS DRA QRI
Grade mean (SD) min max N mean (SD) min max N mean (SD) min max N mean (SD) min max N
G1 1.3 (0.9) 0.5 2.8 5 2.9 (1.1) 1.7 4.8 6 2.2 (0.9) 0.8 3.7 10 2.6 (0.6) 1.6 3 4G2 2.1 (0.9) 1.5 3.7 5 3.6 (0.4) 3.1 4.3 9 2.6 (0.8) 1 3.8 14 2.7 (0.9) 1.5 4 5G3 3.4 (1.0) 2.5 5.4 7 4.8 (1.0) 3 6 9 4.1 (0.4) 3.3 4.6 12 4.6 (0.8) 3.5 5.3 5G4 3.8 (1.1) 2.5 5.1 7 5.5 (0.6) 4.4 6.2 9 4.3 (0.7) 3.5 4.9 4 4.4 (1.5) 3.3 7.1 6G5 5.5 (0.9) 4.4 6.9 5 6.5 (0.7) 4.9 7.3 9 5.5 (0.7) 4.9 6.3 4 5.6 (1.0) 4.6 7.3 6G6 6.1 (1.0) 4.6 7.8 6 6.8 (0.3) 6.4 7.1 9 6.5 (1.3) 4.8 7.9 4 6.1 (1.1) 4.7 8.2 7Overall 3.8 (1.9) 0.5 7.8 35 5.1 (1.5) 1.7 7.3 51 3.6 (1.5) 0.8 7.9 48 4.5 (1.6) 1.5 8.2 33
Within-grade range M (SD) Within-grade range M (SD) Within-grade range M (SD) Within-grade range M (SD)2.62 (0.38) 2.03 (0.97) 2.15 (0.86) 2.61 (0.93)
Note. Range was calculated by subtracting the minimum complexity score from the maximum complexity score within grade. Itwas then averaged across the six grades. Numbers in parenthesis are standard deviations.
Table 9. Grade-Specific Summary Statistics for TextEvaluator Grade-Level Scores by Assessment.
BRI DIBELS DRA QRI
Grade mean (SD) min max N mean (SD) min max N mean (SD) min max N mean (SD) min max N
G1 1.2 (0.4) 1 2 5 1.3 (0.5) 1 2.1 6 1.0 (0.0) 1 1 10 1.4 (0.5) 1 2.1 4G2 1.3 (0.4) 1 2 5 1.9 (1.1) 1 4.2 9 1.4 (0.6) 1 2.6 14 2.1 (1.2) 1 4 5G3 2.0 (0.9) 1 3.6 7 4.5 (0.9) 3 5.5 9 2.0 (0.9) 1 3.5 12 3.0 (1.4) 1 4.6 5G4 2.4 (1.5) 1 5.3 7 4.6 (1.5) 3.3 8.3 9 2.3 (1.0) 1 3.4 4 3.5 (1.0) 2.1 4.7 6G5 4.2 (1.1) 2.6 5.6 5 5.2 (0.9) 3.5 6.4 9 4.7 (1.0) 3.9 6.2 4 4.3 (1.5) 2.5 6.6 6G6 4.1 (1.3) 1.9 5.7 6 6.1 (0.9) 4.5 8 9 5.3 (1.5) 3.6 7.2 4 5.5 (0.4) 4.7 6 7Total 2.6 (1.6) 1 5.7 35 4.1 (2.0) 1 8.3 51 2.1 (1.5) 1 7.2 48 3.5 (1.7) 1 6.6 33
Within-grade range M (SD) Within-grade range M (SD) Within-grade range M (SD) Within-grade range M (SD)2.61 (1.38) 4.75 (2.36) 2.07 (1.20) 2.62 (1.21)
Note. Range was calculated by subtracting the minimum complexity score from the maximum complexity score within grade. Itwas then averaged across the six grades. Numbers in parenthesis are standard deviations.
156 Y. TOYAMA ET AL.
Dow
nloa
ded
by [
The
UC
San
ta C
ruz
Uni
vers
ity L
ibra
ry]
at 1
3:17
16
Oct
ober
201
7

deviations for the within-grade range of complexity scores (less than 1 for all the four assessments, asevident in the bottom row in Table 8; compare this with the Flesch-Kincaid results in the bottomrow in Table 7).
Like RMM, TE’s results produced fairly similar complexity score distributions across the fourassessments (Figure 7). Unlike the other analytic tools, the TE analyses show limited distinctionsacross lower-grade texts. For example, TE gave a score of 1 (grade level) to all first-grade passagesfrom DRA. In contrast, other analytic tools showed variability in DRA’s first-grade passages, as largeas 4.9 grade levels according to Flesch-Kincaid. Of the four analytical tools, TE showed little increasein mean complexity from Grades 1 to 2 (Figures 7–8). Further, the minimum complexity consis-tently stayed at 1 for the first several grade levels (see the flat lower edge of the shaded areas forGrades 1–3 and Grades 1–4 in Figure 7)— a pattern that was not observed by other analytical tools(See Figures 1, 3, and 5 for Lexile, Flesch-Kincaid, and RMM). These results seem to suggest that TEdoes not differentiate lower-level passages well.
To examine whether the four text complexity tools consistently reveal statistically significantdifferences in average passage complexity at a given grade level among the four classroom assess-ments, we ran four separate regression models with text complexity scores from one of the fourquantitative tools as the response variable in each model (see Appendix for details). The same set ofpredictor variables was used across the four models: grades, the assessments, and their interactions.For a given grade level, one can conduct six pairwise comparisons of mean complexity scores (e.g.,BRI vs. DRA, QRI vs. DIBELS). We chose to limit our analyses to three planned comparisons usingDIBELS as a reference group against which each of the remaining three assessments was compared(i.e., BRI vs. DIBELS, DRA vs. DIBELS, and QRI vs. DIBELS). We made this decision because ourdescriptive analyses revealed that DIBELS’ complexity score distributions were distinct; that is,DIBELS passages consistently covered higher ranges of complexity across grades and revealed theleast within-grade variability in complexity of the four assessments.
Each circle in Figure 9 represents an estimated difference in mean complexity between DIBELS and oneof the other assessments (i.e., BRI, DRA, or QRI) at a particular grade level. Values are typically negative,indicating that DIBELS’ estimated mean complexity is higher than that of the comparison assessment. Aline extending up and down from a circle is the 95% confidence interval for the mean difference estimate.When this line crosses the dashed zero line, there is no statistically significant difference in the meancomplexity between DIBELS and the comparison assessment. Of the 18 comparisons conducted, Lexilerevealed 11 statistically significant differences between pairs of grade-specific means (see the top panel ofFigure 9&Table A2), and Flesch-Kincaid elicited nine such cases (the second panel in Figure 9&Table A3).In contrast, RMMand TE each revealed only four significant differences (the bottom two panels in Figure 9& Tables A4 and A5). These results suggest that, when compared to two-factor complexity tools, the recentmultidimensional tools, RMM and TE, tend to homogenize distinctions among grade-specific averages ofpassage complexity across the assessment systems. This finding echoes the patterns found in the descriptiveanalyses reported above.
To summarize, the multi-factor complexity tools, RMM and TE, showed less pronounced cross-assessment differences than the two-factor model tools, Lexile and Flesh-Kincaid. Further, TE resultssuggest that the tool does not differentiate lower-level passages as well as the other three analytical tools.
Comparison against the CCSS expectations (Question 4)
Figures 10 and 11 compare the complexity staircases of the leveled passages from the four assess-ments with the CCSS expectations in Lexile and in RMM grade level respectively.4 For each gradeband, the top bar (in darker shade) represents the CCSS expectation, while the second bar (in lightershade) represents the complexity of assessment passages obtained in this study. Note that the secondlighter shade bar for the Grades 6–8 band in each sub-graph represents the complexity range for only
4As noted before, results from Flesch-Kincaid and TE are provided in the on-line supplementary materials.
EDUCATIONAL ASSESSMENT 157
Dow
nloa
ded
by [
The
UC
San
ta C
ruz
Uni
vers
ity L
ibra
ry]
at 1
3:17
16
Oct
ober
201
7

Grade 6 passages from each assessment (recall that the current study examined assessment passagesonly through Grade 6). In contrast, the first darker shade bar represents the CCSS expectation rangefor Grades 6 through 8. This explains why the lighter shade bar covers only the beginning part of thedarker bar or does not cover the darker bar at all.
Figures 10 and 11 show that DIBELS passages are most consistently aligned with the CCSSexpectations in comparison to the other assessments. QRI passages cover the CCSS expectationsfairly well, although its Grade 4–5 band covers substantially lower level than the expectation. BRIand DRA passages are less aligned with the CCSS expectations. According to the Lexile, BRI’s Grade
Figure 9. Estimated differences in mean complexity between DIBELS and a comparison assessment with 95% confidence intervals(constructed with Sidak corrections). The significant differences are those for which the intervals do not intersect with the dashedzero line. Lexile and Flesch-Kincaid results have more instances of significant difference (11 and 9 out of 18 comparisonsrespectively) than results from RMM and TextEvaluator (each shows four instances).
158 Y. TOYAMA ET AL.
Dow
nloa
ded
by [
The
UC
San
ta C
ruz
Uni
vers
ity L
ibra
ry]
at 1
3:17
16
Oct
ober
201
7
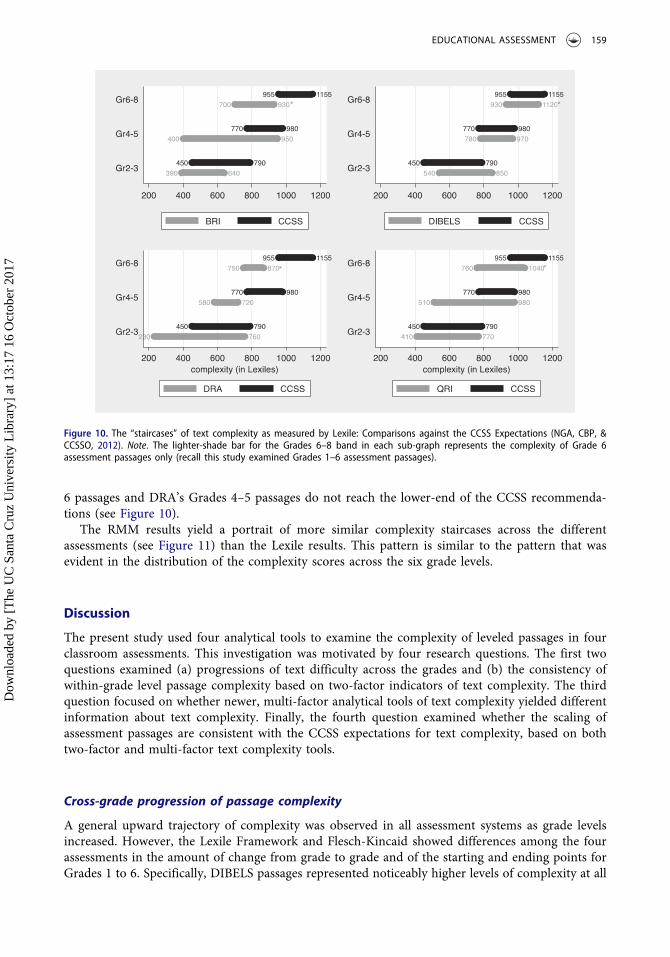
6 passages and DRA’s Grades 4–5 passages do not reach the lower-end of the CCSS recommenda-tions (see Figure 10).
The RMM results yield a portrait of more similar complexity staircases across the differentassessments (see Figure 11) than the Lexile results. This pattern is similar to the pattern that wasevident in the distribution of the complexity scores across the six grade levels.
Discussion
The present study used four analytical tools to examine the complexity of leveled passages in fourclassroom assessments. This investigation was motivated by four research questions. The first twoquestions examined (a) progressions of text difficulty across the grades and (b) the consistency ofwithin-grade level passage complexity based on two-factor indicators of text complexity. The thirdquestion focused on whether newer, multi-factor analytical tools of text complexity yielded differentinformation about text complexity. Finally, the fourth question examined whether the scaling ofassessment passages are consistent with the CCSS expectations for text complexity, based on bothtwo-factor and multi-factor text complexity tools.
Cross-grade progression of passage complexity
A general upward trajectory of complexity was observed in all assessment systems as grade levelsincreased. However, the Lexile Framework and Flesch-Kincaid showed differences among the fourassessments in the amount of change from grade to grade and of the starting and ending points forGrades 1 to 6. Specifically, DIBELS passages represented noticeably higher levels of complexity at all
Figure 10. The “staircases” of text complexity as measured by Lexile: Comparisons against the CCSS Expectations (NGA, CBP, &CCSSO, 2012). Note. The lighter-shade bar for the Grades 6–8 band in each sub-graph represents the complexity of Grade 6assessment passages only (recall this study examined Grades 1–6 assessment passages).
EDUCATIONAL ASSESSMENT 159
Dow
nloa
ded
by [
The
UC
San
ta C
ruz
Uni
vers
ity L
ibra
ry]
at 1
3:17
16
Oct
ober
201
7

six grade levels, especially compared with BRI and DRA, due mostly to its CBM logic to use the end-of-grade level passages to evaluate and monitor reading performance.
This finding suggests that the definition of “grade-levelness” of texts differs across assessments, asmeasured by two widely used text analysis systems. The two excerpts of first-grade texts, one fromBRI and the other from DIBELS in Table 10, differ by 350 Lexiles. In a school using the BRI (wherethe first-grade text is at the lower end of the range), students with borderline reading ability mightdo well in an oral reading task. If students moved to schools using DIBELS, whose passages are allscaled toward the end-of-grade level complexity, their oral fluency performance could be expected tofall short of the standard. Teachers and specialists who use classroom assessments for high-stakes
Figure 11. The “Staircases” of Text Complexity as Measured by RMM: Comparisons against the CCSS Expectations (NGA, CBP, &CCSSO, 2012). See caption in Figure 10.
Table 10. Excerpts from Two Grade 1 Passages with 470L Difference.
At the Zoo (BRI Grade 1) Go Fish (DIBELS Grade 1)
Dan wanted to go to the zoo. He asked his mother. She said,“Yes.” Dan had fun at the zoo. There were many animals heliked. One animal looked like it had two tails. It was anelephant. One had a nice back to ride on.
It was a cold, snowy day. Abby had invited two friends over toplay the card game Go Fish. Abby’s little brother, Tim, hadnever played and wanted to learn.“I’ll explain during this game,” said Abby.Abby showed Tim the cards in her hand, which had differentnumbers on them.
Number of words in the actual text: 100 Number of words in the actual text: 255Lexile: 70L Lexile: 540LMLWF: 3.89 MLWF: 3.71MSL: 5.26 MSL: 9.14RMM: 0.8 (grade level) RMM: 4.8 (grade level)Flesch-Kincaid: −0.1 (grade level) Flesch-Kincaid: 0.5 (grade level)TextEvaluator: 1 (grade level) TextEvaluator: 1 (grade level)
Note. MLWF = Mean Log Word Frequency, MSL = Mean Sentence Length.
160 Y. TOYAMA ET AL.
Dow
nloa
ded
by [
The
UC
San
ta C
ruz
Uni
vers
ity L
ibra
ry]
at 1
3:17
16
Oct
ober
201
7
decisions such as placement into special education services, need to be aware that different assess-ments employ different standards of complexity to gauge their passages even when they may belabeled as representing the same grade level.
Within-grade variability
Findings of within-grade variability in passage complexity can contribute to uncertainty aboutstudents’ instructional reading levels when different passages are used to compare performancesacross readers or the same reader over time. Even in the RMM analyses that reduced cross-assessment differences, average variability from the least to most complex passage within a gradelevel was around 2 grade level units for DIBELS and DRA and 2.6 for BRI and DIBELS. Suchpatterns leave educators uncertain as to whether differences in reading performances across timeindicate valid changes in student reading levels or simply variations in text complexity.
The findings of this study also show considerable overlap in complexity between adjacent passagelevels or even across three or more levels for all of the assessments with a few exceptions (e.g., BRI’sGrade 1 passages are distinctively lower than its Grade 2 passages, according to Lexile). To under-stand the overlaps, consider DRA’s passages for Grades 3 and 4. According to TE, the third- andfourth-grade passages cover almost the same range of complexity from 1 to 3.5 grade units (seeFigure 7 and Table 9). If we take out the most complex passage from each grade set, the range ofcomplexity covered becomes from 1 to 2.6 grade units, which is exactly the range covered by DRA’sGrade 2 passages. Thus, most DRA passages leveled for Grades 2 to 4 are indistinguishable in thecomplexity range covered, according to TE.
A range of complexity in texts may be appropriate for instruction. After all, students within aclass can vary considerably in their reading proficiencies and teachers need to accommodatestudents’ varying needs. In assessments where passage levels serve as a reference point, suchvariation in text complexity at any given grade can be problematic. Considerable overlap in textcomplexity at neighboring levels makes it difficult to form discernable steps, each progressively morechallenging, in the staircase of text complexity. Further, overlap between levels suggests that apassage might possibly be just as well assigned to two or even three adjacent levels. One possibilityis that the passages in a certain grade-level group have been established to be equivalent according tosome other non-quantitative criterion (e.g., presence of figurative language). If that is the case,assessment developers need to provide evidence of equivalency based on criteria other than thesebroad quantitative indicators (e.g., comparable conceptual difficulty or depth of linguisticprocessing).
Differences among text complexity tools
To this point in our analyses and discussion, we have evaluated the validity of the scaling of theassessments. The implicit assumption has been that the text complexity tools are valid. But theanalytic frame can be reversed. That is, the leveling of the passages could be assumed to be valid andthe validity of the analytic tools to produce valid, reliable indices of complexity could be questioned.From that angle, this study also uncovered similarities and differences across the text complexitytools. Differences across the four assessments according to the two-factor models of Flesch-Kincaidand Lexiles were more substantial than the differences resulting from the multi-factor tools of textcomplexity. For example, Lexile and Flesch-Kincaid analyses suggested that BRI’s text complexityprogression starts out at a substantively low level at Grade 1 relative to other assessments. Theconclusion of cross-assessment differences would be modified when viewed from the perspective ofthe findings from the multi-factor tools, particularly RMM. Based on the RMM analyses, the BRImean text complexity was estimated to be closer to the intended levels, although typically at thelower-end of the grade bands.
EDUCATIONAL ASSESSMENT 161
Dow
nloa
ded
by [
The
UC
San
ta C
ruz
Uni
vers
ity L
ibra
ry]
at 1
3:17
16
Oct
ober
201
7
One possible explanation for these differences may lie in how different analytical tools estimatetext complexity, and particularly how they handle vocabulary or semantic difficulty. In the two-factor Lexile model, semantic difficulty is measured by the frequency of words in text. More frequentwords are assumed to be easier than rare words. Similarly, the Flesch-Kincaid assumes that thenumber of syllables has an inverse relationship with difficulty in pronouncing and assigning mean-ing to words. The limitations of these two approaches to measuring vocabulary/word difficulty havebeen recognized (Adams, 2001; Stahl, 2003). Word frequency introduces limitations that stem fromthe skewed distribution of words in the English language where a small portion of words accountsfor the majority of the total words in written language and the vast majority of words occurinfrequently (Adams, 2001). The many words in the latter group receive a similar low-frequencyscore. When a predictor variable, in this case word frequency, takes a limited range of values, itspredictability is also limited (Adams, 2001). Syllable count, as used in Flesch-Kincaid, is alsoproblematic as it ignores the fact that some monosyllablic words (e.g., hue) are more difficult thansome multi-syllabic words (e.g., together).
The newer measures of text complexity provide more sophisticated measures of word difficulty.In particular, the Word Maturity variable of RMM tracks the degree to which the meaning of a wordis known to typical learners at different levels of language exposure. The claim is that RMM describesa word’s difficulty in relation to how its meaning changes across contexts and over time, not simplysurface features such as word frequency or syllable count (Landauer et al., 2011). This method mayhave aided in evening out the distributions of text complexity across the assessment products, at leastcompared to two-dimensional tools.
To establish word difficulty, TE uses over 20 word-related variables that are reduced to threeprincipal components: Academic Vocabulary, Word Concreteness and Word Unfamiliarity. In alllikelihood, the use of the multiple word-related variables and their use of human judges in estimatingtext complexity have contributed to the difference found in this study between TE and the moretraditional measures of readability. However, our comments about RMM and TE are more in thespirit of plausible conjectures that need to be verified with empirical research. Even so, the reductionin between and within-grade variability from these multi-factor measures suggests that differences,especially for word level analyses, in estimation methods for text complexity may well be contribut-ing to the differences observed across the analytical tools.
Comparison of CCSS expectations and grade-appropriateness of analytical tools
This study also uncovered differences in the degree to which the passages from different assessmentswere aligned with the CCSS text complexity expectations. DIBELS passages were most consistentlyaligned with the CCSS guidelines relative to passages from the other assessment products. When theRMM was used to scale complexity, however, the degrees of alignment with the CCSS guidelineslook more alike across the four assessments.
Our use of the CCSS staircase of text complexity for gauging the text complexity of assessmentproducts should not be viewed as an implicit endorsement of the validity of the CCSS expectations.A debate over the appropriateness of the CCSS staircase expectations is ongoing (e.g., Gamson, Lu, &Eckert, 2013; Hiebert & Mesmer, 2013). The problems of estimating text complexity are particularlyevident with texts for beginning readers, where word features such as decodability and high-frequency words are often manipulated by text designers and where repetitive syntactic structuresare used to promote linguistic predictability (Hoffman, Roser, Salas, Patterson, & Pennington, 2001).Adding to the dilemma with K–2 texts is the fact that the analytical tools used in this study wereprimarily validated with Grades 3–12 texts. As shown in this study, particular analytic tools, mostspecifically TE, do not differentiate beginning reading texts very well. One in-progress projectfocuses on measuring the text complexity of early-grade texts may reverse this trend (Fitzgeraldet al., 2014). However we note that this new measure is available for research purposes only and itsefficacy has yet to be tested in the marketplace.
162 Y. TOYAMA ET AL.
Dow
nloa
ded
by [
The
UC
San
ta C
ruz
Uni
vers
ity L
ibra
ry]
at 1
3:17
16
Oct
ober
201
7

An alternative perspective on role of text
Our fundamental critique of the two types of classroom assessment tools is that they fail to provide areasonable staircase of complexity for fulfilling their purposes—determining instructional and inde-pendent reading levels, in the case of IRIs, or measuring progress toward an ultimate performancetarget, in the case of CBM tasks. Each tool, as currently used, is predicated on the assumption that itpossesses, at least in an ideal state, two key attributes: (a) consistent and discernable steps (risers if youwill) in the staircase of complexity, progressively increasing across levels, and (b) a high degree ofconsistency in complexity among passages at any given level (i.e., the surface of each tread is smooth onthe complexity staircase). Further, as discussed earlier, these tools are used to make decisions thatassume equal intervals even though a theory- and practice-based argument may be made that suchassumption is not important in the classroom assessment context. Indeed, proponents of both IRIs adCMBs have reported that they strive to achieve both goals (expected between-grade and minimalwithin-grade variability) to the degree possible (Jenkins & Fuchs, 2012; Nilsson, 2013). Howeversome proponents acknowledge the difficulty and even the low likelihood of achieving the equal intervalsnecessary for progression across text levels to serve as a genuine metric of growth (see Carpenter &Paris, 2005; Leslie & Caldwell, 2009). If these classroom assessments cannot meet these standards, thentest users cannot easily attribute the differential performance of students on various passages tostudents’ capacity to handle various levels of complex text. That is the essence of our argument.
But there is another perspective on text complexity, as derived from the models of readingcomprehension, developed by Kintsch (1998) and championed, in elaborated form, by the RANDReading Study Group (RAND Reading Study Group, 2002). This perspective holds that a text at anylevel can be rendered more or less difficult because of factors in the reading process in addition totext—those related to reader, task, and context. Valencia and her colleagues (Valencia, Pearson, &Wixson, 2011; Valencia, Wixson, & Pearson, 2014) have been proponents of this perspective,proposing a model called the Text-Task-Scenario (TTS). With respect to tasks, an average sixth-grade student might have more trouble unearthing the subtext of an Aesop fable judged to be atsecond-grade level than selecting the main idea for a tenth-grade science passage about black holes inspace. Context also matters. For example, if two passages of equivalent linguistic complexity receivedifferent instructional support in a classroom—one read independently and the second decon-structed in a small group of peers—comprehension results might vary for students across the twocontexts. The picture becomes even more complex when reader factors, such as topical knowledge,linguistic sophistication, or interest are added to the mix; deep knowledge or interest in a topic mightwell overcome, or at least compensate for, a great deal of linguistically complex language in a text(Alexander, Kulikowich, & Jetton, 1994).
As appealing as such a nuanced model is, it carries with it a substantial empirical burden: todocument such a multivariate model in which all four of the key variables (reader, text, task, andsociocultural context) can vary in any number of ways would require statistical models and validationstudies of massive complexity. Even so, such an undertaking would answer vexing and consequentialquestions about the situations in which text complexity does (and does not) wield its influence.
Conclusion
The current study focused on quantitative indices of text complexity, one of the three legs ofcomplexity detailed in the CCSS definition of text complexity (National Governors Association[NGA], Center for Best Practices [CBP], & Council of Chief State School Officers [CCSSO], 2010,Appendix A); neither the qualitative dimension nor reader-task dimension was addressed at all.Nevertheless, the study revealed that neither assessment products nor the analytical tools of textcomplexity are equal when it comes to estimating quantitative aspects of text difficulty. A practicalimplication of this study is clear: both teachers and researchers need to be aware of the immensevariability among both assessments on one hand, and analytical tools of text complexity on the other,
EDUCATIONAL ASSESSMENT 163
Dow
nloa
ded
by [
The
UC
San
ta C
ruz
Uni
vers
ity L
ibra
ry]
at 1
3:17
16
Oct
ober
201
7

in their effort to match students to appropriate texts and support their reading development.Caution is certainly called for until and unless we have more definitive analyses of this complexarray of interactions among measures of complexity and student difficulty in processing text.
Acknowledgments
We thank Jeff Elmore at MetaMetrics and Kathleen Sheehan at ETS, for providing the batch analysis service for thestudy corpus, and Angela Dancev for preparing text files for analyses.
References
Adams, N. J. (2001). On the lexile framework. In National Center for Education Statistics (Ed.),Assessing the lexile framework.Results on a panel meeting NCES 2001-08 (pp. 15–21). Washington, DC: National Center for Education Statistics.
Albee, J. J., Arnold, J. M., Dennis, L., Schafer, B. J., & Olson, S. (2013). Reading assessments for screening/placement,diagnosis, and summative/outcomes: What are schools using? The Reading Professor, 35(1), 25–34.
Alexander, P. A., Kulikowich, J. M., & Jetton, T. L. (1994). The role of subject-matter knowledge and interest in theprocessing of linear and nonlinear texts. Review of Educational Research, 64(2), 201–252. doi:10.3102/00346543064002201
Anderson, A., Schlueter, J. E., Carlson, J. F., & Geisinger, K. F. (2016). Tests in print IX: An index to tests, test reviews,and the literature on specific tests. Lincoln, NE: University of Nebraska Press.
Ardoin, S. P., Suldo, S. M., Witt, J., Aldrich, S., & Mcdonald, E. (2005). Accuracy of readability estimates’ predictionsof CBM p erformance. School Psychology Quarterly, 20(1), 1–22. doi:10.1521/scpq.20.1.1.64193
Arthaud, J., Vasa, S. F., & Steckelberg, A. L. (2000). Reading assessment and instructional practices in specialeducation. Assessment for Effective Intervention, 25(3), 205–227. doi:10.1177/073724770002500302
Au, W. (2007). High-stakes testing and curricular control: A qualitative metasynthesis. Educational Researcher, 36(5),258–267. doi:10.3102/0013189X07306523
Beaver, J. M., & Carter, M. A. (2006). The developmental reading assessment–second edition (DRA2). Upper SaddleRiver, NJ: Pearson.
Briggs, D. C. (2013). Measuring growth with vertical scales. Journal of Educational Measurement, 50(2), 204–226.doi:10.1111/jedm.2013.50.issue-2
Brookhart, S. M. (2003). Developing measurement theory for classroom assessment purposes and uses. EducationalMeasurement, Issues and Practices, 22, 5–12. doi:10.1111/j.1745-3992.2003.tb00139.x
Carpenter, R. D., & Paris, S. G. (2005). Issues of validity and reliability in early reading assessments. In S. G. Paris & A.Stahl (Eds.), Children’s reading comprehension and assessment (pp. 279–304). Mahwah, NJ: Lawrence Erlbaum.
Christ, T. J., & Ardoin, S. P. (2009). Curriculum-based measurement of oral reading: Passage equivalence and probe-set development. Journal of School Psychology, 47(1), 55–75. doi:10.1016/j.jsp.2008.09.004
Christ, T. J., Monaghen, B. D., Zopluoglu, C., & Van Norman, E. R. (2013). Curriculum-based measurement of oralreading evaluation of growth estimates derived with pre–post assessment methods. Assessment for EffectiveIntervention, 38(3), 139–153. doi:10.1177/1534508412456417
Clay, M. M. (1993). An observation survey of early literacy achievement. Portsmouth, NH: Heinemann.Clay, M. M. (1994). Reading Recovery: A guidebook for teachers in training. Portsmouth, NH: Heinemann.Crooks, T. J. (1988). The impact of classroom evaluation practices on students. Review of Educational Research, 58(4),
438–481. doi:10.3102/00346543058004438Cummings, K., Wallin, J., Good, R., & Kaminski, R. (2007). The DMG passage difficulty index. [Formula and computer
software]. Eugene, OR: Dynamic Measurement Group.Deeney, T. A., & Shim, M. K. (2016). Teachers’ and students’ views of reading fluency: Issues of consequential validity
in adopting one-minute reading fluency assessments. Assessment for Effective Intervention, 41(2), 1–18.Deno, S. L. (1985). Curriculum-based measurement: The emerging alternative. Exceptional Children, 52(3), 219–232.DIBELS Data System. (2015). UO DIBELS data system. Retrieved from https://dibels.uoregon.edu/Domingue, B. (2014). Evaluating the equal-interval hypothesis with test score scales. Psychometrika, 79(1), 1–19.
doi:10.1007/s11336-013-9342-4Fitzgerald, J., Elmore, J., Koons, H., Hiebert, E. H., Bowen, K., & Stenner, A. J. (2014). Important text characteristics
for early-grades text complexity. Journal of Educational Psychology, 106(3), 4–29.Ford, M. P., & Opitz, M. F. (2008). A national survey of guided reading practices: What we can learn from primary
teachers. Literacy Research and Instruction, 47, 309–331. doi:10.1080/19388070802332895Fountas, I. C., & Pinnell, G. S. (1996). Guided reading: Good first teaching for all children. Portsmouth, NH: Heinemann.Fountas, I. C., & Pinnell, G. S. (2012). Guided reading: The romance and the reality. The Reading Teacher, 66(4), 268–
284. doi:10.1002/trtr.2012.66.issue-4
164 Y. TOYAMA ET AL.
Dow
nloa
ded
by [
The
UC
San
ta C
ruz
Uni
vers
ity L
ibra
ry]
at 1
3:17
16
Oct
ober
201
7

Francis, D. J., Santi, K. L., Barr, C., Fletcher, J. M., Varisco, A., & Foorman, B. R. (2008). Form effects on theestimation of students’ oral reading fluency using DIBELS. Journal of School Psychology, 46(3), 315–342.doi:10.1016/j.jsp.2007.06.003
Fry, E. (1977). Fry’s readability graph: Clarification, validity, and extension to level 17. Journal of Reading, 21, 242–252.Gamson, D., Lu, X., & Eckert, S. (2013). Challenging the research base of the common core state standards A historical
reanalysis of text complexity. Educational Researcher, 42(7), 381–391. doi:10.3102/0013189X13505684Goffreda, C. T., & DiPerna, J. C. (2010). An empirical review of psychometric evidence for the dynamic indicators of
basic early literacy skills. School Psychology Review, 39(3), 463–483.Good, R. H. I., Kaminski, R. A., Dewey, E. N., Wallin, J., Powell-Smith, K. A., & Latimer, R. J. (2013). Dynamic
indicators of basic early literacy skills: DIBELS Next technical manual. Retrieved from https://dibels.org/Goodman, K. (Ed.). (2006). The truth about DIBELS. Portsmouth, NH: Heinemann.Goodman, Y. M., & Burke, C. L. (1972). Reading miscue inventory. New York, NY: Robert C. Owen.Graesser, A. C., McNamara, D. S., Cai, Z., Conley, M., Li, H., & Pennebaker, J. (2014). Coh-Metrix measures text
characteristics oat multiple levels of language and discourse. The Elementary School Journal, 115(2), 210–229.doi:10.1086/678293
Graesser, A. C., McNamara, D. S., & Kulikowich, J. M. (2011). Coh-metrix: Providing multilevel analyses of textcharacteristics. Educational Researcher, 40(5), 223–234. doi:10.3102/0013189X11413260
Hall, S. L. (2006). I’ve DIBEL’d, now what? Designing interventions with DIBELS Data. Longmont, CO: Sopris WestEducational Services.
Heilman, M., Collins-Thompson, K., Callan, J., & Eskenazi, M. (2006). Classroom success of an intelligent tutoringsystem for lexical practice and reading comprehension. Proceedings of the Ninth International Conference on SpokenLanguage Processing, Pittsburgh, PA.
Hiebert, E. H., & Mesmer, H. A. E. (2013). Upping the ante of text complexity in the Common Core State Standards:Examining its potential impact on young readers. Educational Researcher, 42(1), 44–51. doi:10.3102/0013189X12459802
Hoffman, J., Roser, N., Salas, R., Patterson, E., & Pennington, J. (2001). Text leveling and “little books” in first-gradereading. Journal of Literacy Research, 33(3), 507–528. doi:10.1080/10862960109548121
Jenkins, J. R., & Fuchs, L. S. (2012). Curriculum-based measurement: The paradigm, history, and legacy. In C. A.Epsin, K. L. McMaster, S. Rose, & M. M. Wayman (Eds.), A measure of success: The influence of curriculum-basedmeasurement on education (pp. 7–23). Minneapolis, MN: University of Minnesota Press.
Jenkins, J. R., Zumeta, R., Dupree, O., & Johnson, K. (2005). Measuring gains in reading ability with passage readingfluency. Learning Disabilities Research & Practice, 20(4), 245–253. doi:10.1111/j.1540-5826.2005.00140.x
Johns, J. L. (2012). Basic reading inventory: Pre-primer through grade twelve and early literacy assessments. Dubuque,IA: Kendall Hunt.
Kame’enui, E. J., Fuchs, L., Francis, D. J., Good III, R., O’Connor, R. E., Simmons, D. C., . . . Torgensen, J. K. (2006).The adequacy of tools for assessing reading competence: A framework and review. Educational Researcher, 35(4), 3–11. doi:10.3102/0013189X035004003
Kaminski, R. A., Good, R. H., Baker, D., Cummings, K., Dufour-Martel, C., Fleming, K., . . . Wallin, J. (2007). Positionpaper on use of DIBELS for system-wide accountability decisions. Eugene, OR: Dynamic Measurement Group.Retrieved from https://dibels.org/papers/Appropriateness_0207.pdf
Kincaid, J. P., Fishburne, L. R. P., Rogers, R. L., & Chissom, B. S. (1975). Derivation of new readability formulas(automated readability index, fog count and flesch reading ease formula) for navy enlisted personnel. Researchbranch report (pp. 8–75). Memphis, TN: Chief of Naval Technical Training: Naval Air Station.
Kintsch, W. (1998). Comprehension: A paradigm for cognition. New York, NY: Cambridge University Press.Klare, G. R. (1984). Readability. In P. D. Pearson, R. Barr, & M. L. Kamil (Eds.), Handbook of Reading Research (pp.
681–744). New York, NY: Longman.Klesius, J. P., & Homan, S. P. (1985). A validity and reliability update on the informal reading inventory with
suggestions for improvement. Journal of Learning Disabilities, 18, 71–76. doi:10.1177/002221948501800202Kontovourki, S. (2012). Reading leveled books in assessment-saturated classrooms : A close examination of unmarked
processes. Reading Research Quarterly, 47(2), 153–171. doi:10.1002/RRQ.014Koslin, B. L., Zeno, S., & Koslin, S. (1987). The DRP: An effective measure in reading. New York, NY: College Entrance
Examination Board.Kuhn, M. R., Schwanenflugel, P. J., & Meisinger, E. B. (2010). Aligning theory and assessment of reading fluency:
Automaticity. Prosody, and Definitions of Fluency. Reading Research Quarterly, 45(2), 230–251. doi:10.1598/RRQ.45.2.4Landauer, T. K., Kireyev, K., & Panaccione, C. (2011). Word maturity: A new metric for word knowledge. Scientific
Studies of Reading, 15(1), 92–108. doi:10.1080/10888438.2011.536130Leslie, L., & Caldwell, J. (2009). Formal and informal measures of reading comprehensiontion. In S. E. Israel & G. G.
Duffy (Eds.), Handbook of research on reading comprehension (pp. 403–427). New York, NY: Routledge.Leslie, L., & Caldwell, J. S. (2010). Qualitative reading inventory (5th ed.). Upper Saddle River, NJ: Pearson.Markus, K., & Borsboom, D. (2013). Frontiers of test validity theory: Measurement, causation, and meaning. New York,
NY: Routledge.
EDUCATIONAL ASSESSMENT 165
Dow
nloa
ded
by [
The
UC
San
ta C
ruz
Uni
vers
ity L
ibra
ry]
at 1
3:17
16
Oct
ober
201
7
Mellard, D. F., McKnight, M., & Woods, K. (2009). Learning disabilities practice response to intervention screeningand progress-monitoring practices in 41 local schools. Learning Disabilities Research & Practice, 24(4), 186–195.doi:10.1111/j.1540-5826.2009.00292.x
Mesmer, H. A. (2007). Tools for matching readers to texts. New York, NY: The Guilford Press.Mesmer, H. A., Cunningham, J. W., & Hiebert, E. H. (2012). Toward a theoretical model of text complexity for the
early grades: Learning from the past, anticipating the future. Reading Research Quarterly, 47(3), 235–258.doi:10.1002/RRQ.019
Milone, M. (2008). The development of ATOS: The Renaissance readability formula. Wisconsin Rapids, WI:Renaissance Learning, Inc.
National Governors Association [NGA], Center for Best Practices [CBP], & Council of Chief State School Officers[CCSSO]. (2010). Common core state standards for English language arts & literacy in history/social studies, science,and technical subjects with appendices A–C. Retrieved from http://www.corestandards.org/
Nelson, J., Perfetti, C., Liben, D., & Liben, M. (2012). Measures of text difficulty: Testing their predictive value of gradelevels and student performance. Report to the Gates Foundation. Retrieved from http://www.ccsso.org/Documents/2012/Measures ofText
NGA, CBP, & CCSSO. (2012). Supplemental information for Appendix A of the common core state standards for Englishlanguage arts and literacy: New research on text complexity. Washington, DC: Author. Retrieved from CommonCore State Standards Initiative website http://www.corestandards.org/resources
Nilsson, N. L. (2008). A critical analysis of eight informal reading inventories. The Reading Teacher, 61(7), 526–536.doi:10.1598/RT.61.7.2
Nilsson, N. L. (2013). Introduction to using informal reading inventories in research and practice. Reading & WritingQuarterly, 29(3), 203–207. doi:10.1080/10573569.2013.789778
O’Neill, J. (2006, March 12). Leaving creativity behind: Drilling for tests kills curiosity and imagination. San FranciscoChronicle. Retrieved from http://www.sfgate.com
Paris, S. G. (2002). Measuring children’s reading development using leveled texts. The Reading Teacher, 56(2), 168–170.Paris, S. G., & Carpenter, R. D. (2003). FAQs about IRIs. The Reading Teacher, 56(6), 578–580.Parker, D. C., Zaslofsky, A. F., Burns, M. K., Kanive, R., Hodgson, J., Scholin, S. E., & Klingbeil, D. A. (2015). A brief
report of the diagnostic accuracy of oral reading fluency and reading inventory levels for reading failure risk amongsecond- and third- grade students. Reading & Writing Quarterly, 31, 56–67. doi:10.1080/10573569.2013.857970
Pearson Education, Inc. (2011). DRA K – 8 technical manual: Developmental reading assessment (2nd ed.). Retrievedfrom http://goodrichschools.org/view/2244.pdf
Pearson Learning Group. (2003). Developmental reading AssessmentTM (DRA) technical manual. Parsippany, NJ:Pearson Education, Inc.
Pearson, P. D., & Hiebert, E. H. (2014). The state of the field: Qualitative analyses of text complexity. The ElementarySchool Journal, 115(2), 161–183. doi:10.1086/678297
Pikulski, J. J., & Shanahan, T. (1982). Informal reading inventories: A critical analysis. In J. J. Pikulski & T. Shanahan (Eds.),Approaches to the informal evaluation of reading (pp. 94–116). Newark, DE: International Reading Association.
RAND Reading Study Group. (2002). Reading for understanding: Toward an R&D program in reading comprehension.Santa Monica, CA: RAND Corporation.
Ransford-Kaldon, C. R., Flynt, E. S., Ross, C. L., Franceschini, L., Zoblostsky, T., & Gallagher, B. (2010).Implementation of effective intervention: An empirical study to evaluate the efficacy of Fountas & Pinnell’s leveledliteracy intervention system (LLI) 2009-2010. Memphis, TN: Center for Research in Educational Policy, TheUniversity of Memphis.
Rathvon, N. (2006). Developmental reading assessment: DRA review. Retrieved from http://www.natalierathvon.com/images/DRA_Review-08-25-2006.pdf
Samuels, S. J. (2007). The DIBELS tests: Is speed of barking at print what we mean by reading fluency? ReadingResearch Quarterly, 42(4), 563–566.
Sheehan, K. M. (2014). Development of a TextEvaluator/common core concordance table. Princeton, NJ: ETS.Sheehan, K. M., Kostin, I., Napolitano, D., & Flor, M. (2014). The TextEvaluator tool: Helping teachers and test
developers select texts for use in instruction and assessment. Elementary School Journal, 115(2), 184–209.doi:10.1086/678294
Shelton, N. R., Altwerger, B., & Jordan, N. (2009). Does DIBELS put reading first? Literacy Research and Instruction, 48(2), 137–148. doi:10.1080/19388070802226311
Šidák, Z. K. (1967). Rectangular confidence regions for the means of multivariate normal distributions. Journal of theAmerican Statistical Association, 62(318), 626–633.
Smith, D. R., Stenner, A. J., Horabin, I., & Smith, M. (1989). The Lexile scale in theory and practice. Final report.Washington, DC: MetaMetrics. Retrieved from ERIC Database (ED307577).
Spector, J. E. (2005). How reliable are informal reading inventories? Psychology in the Schools, 42(6), 593–603.doi:10.1002/(ISSN)1520-6807
Stahl, S. (2003). Vocabulary and readability: How knowing word meanings affects comprehension. Topics in LanguageDisorders, 23(3), 241–247. doi:10.1097/00011363-200307000-00009
166 Y. TOYAMA ET AL.
Dow
nloa
ded
by [
The
UC
San
ta C
ruz
Uni
vers
ity L
ibra
ry]
at 1
3:17
16
Oct
ober
201
7

Stahl, S. A., & Heubach, K. M. (2005). Fluency-oriented reading instruction. Journal of Literacy Research, 37(1), 25–60.doi:10.1207/s15548430jlr3701_2
Stenner, A. J. (1996). Measuring reading comprehension with the lexile framework. Paper presented at the CaliforniaComparability Symposium. Retrieved March 26, 2017, from https://lexile.com/research/12/
Stenner, A. J., Burdick, H., Sanford, E. E., & Burdick, D. S. (2006). How accurate are lexile text measures? Journal ofApplied Measurement, 7(3), 307–322.
Stenner, A. J., & Fisher, W. P. (2013). Metrological traceability in the social sciences: A model from readingmeasurement. Journal of Physics: Conference Series, 459, 1–6.
Valencia, S., Smith, A., Reece, A., Li, M., Wixson, K., & Newman, H. (2010). Oral reading fluency assessment: Issues ofconstruct, criterion, and consequential validity. Reading Research Quarterly, 45, 270–291. doi:10.1598/RRQ.45.3.1
Valencia, S. W., Pearson, P. D., & Wixson, K. K. (2011). Assessing and tracking progress in reading comprehension: Thesearch for keystone elements in college and career readiness. Princeton: Center for K-12 Assessment & PerformanceManagement at ETS. Retrieved from http://www.k12center.org/publications/through_course.html
Valencia, S. W., Wixson, K. K., & Pearson, P. D. (2014). Putting text complexity in context: Refocusing oncomprehension of complex text. Elementary School Journal, 115(2), 270–289. doi:10.1086/678296
White, H. (1980). A heteroskedasticity-consistent covariance matrix estimator and a direct test for heteroskedasticity.Econometrica: Journal of the Econometric Society, 48(4), 817–838. doi:10.2307/1912934
Appendix
Details of regression analysis and post-hoc multiple comparisons
Regression analyses were conducted to examine whether there are statistically significant differences in grade-specifictext complexity averages across the four classroom assessments. Four models were run, treating complexity scoresfrom each of the four text analysis tools as a response variable, and five dummy variables representing the six gradelevels, and three dummy variables representing the four assessments, and grade ×assessment interactions as explana-tory variables. Specifically, text complexity for a passage was modeled as a function of grade level, assessment, andtheir interactions, as shown in Equation (1).
TextComplexityi ¼ αþ β1 G2ið Þ þ β2 G3ið Þ þ β3 G4ið Þ þ β4 G5ið Þ þ β5 G6ið Þþ β6 BRIið Þ þ β7 DRAið Þ þ β8 QRIið Þþ β9 G2� BRIið Þ þ β10 G2�DRAð Þ þ β11ðG2�QRIiÞþ β12 G3� BRIið Þ þ β13 G3� DRAð Þ þ β14 G3� QRIið Þþ β15 G4� BRIið Þ þ β16 G4� DRAð Þ þ β17 G4� QRIið Þþ β18 G5� BRIið Þ þ β19 G5� DRAð Þ þ β20 G5� QRIið Þþ β21 G6� BRIið Þ þ β22 G6� DRAð Þ þ β23 G6� QRIið Þ þ �i
(1)
In the above equation, G2i ~ G5i are dummy variables representing Grade 1 through G6 designation for a passage i madeby the assessment developer. Similarly, BRIi, DRAi, and QRIi are dummy variables representing the four assessmentproducts analyzed in this study; DIBELS was set as a reference category because the descriptive analysis revealed that itspassages tended to have distinctively higher text complexity than passages from other assessments. A multiplicationbetween a grade level and an assessment indicates an interaction between the grade level designation and the assessment.
A coefficient for intercept (α) is the estimated average text complexity for DIBELS’ Grade 1 passages. Regressioncoefficients β1 - β5 are the estimated average text complexity for DIBELS’ passages at the remaining grade levels fromGrade 2 through Grade 6 respectively. β6 - β8 are the estimated average text complexity for Grade 1 passages for BRI,DRA, and QRI respectively. The remaining coefficients (β6 - β8) for the interaction terms indicate grade- andassessment-specific mean text complexity. As can be seen, this is a saturated model.
In Model 1, Lexile scores were used for the response variable. In Model 2, Model 3 and Model 4, grade leveldesignations by Flesch Kincaid, RMM, and TextEvaluator (TE) were used as the response variable respectively.Table A1 shows results from the four regression models.
Based on the regression results, the following question was investigated: For a given grade level, do we seestatistically significant cross-assessment differences in average text complexity?
Three regression coefficients under “Assessment” in Table A1 partially answer this question, as the coefficientsindicate the difference in average Grade 1 text complexity from DIBELS’ Grade 1 average text complexity. As can beseen, Model 1 for Lexile results indicate that BRI, DRA, and QRI’s average Grade 1 text complexity is significantlylower than DIBELS Grade 1 average complexity. When Flesch Kincaid and RMM were used as measures of text
EDUCATIONAL ASSESSMENT 167
Dow
nloa
ded
by [
The
UC
San
ta C
ruz
Uni
vers
ity L
ibra
ry]
at 1
3:17
16
Oct
ober
201
7

complexity (Models 2 and 3), it is only BRI that has significantly lower average text complexity at Grade 1 thanDIBELS. TE (Model 4) did not detect any statistically significant difference in Grade 1 average text complexity againstDIBELS.
Table A2 shows results of a planned set of 18 (out of possible 276) pairwise comparisons of grade-specific means,using DIBELS as a reference group against which one of the three remaining products (BRI, QRI, and DRA) wascompared. These multiple comparisons used Šidák corrections for Type I error (Šidák, 1967). Tables A3, B4, and B5report results from the same analysis applied to the results from Model 2 (Flesch-Kincaid), Model 3 (RMM), andModel 4 (TE) respectively.
As can be seen in Table A2, Lexile detected 11 statistically significant differences in grade-specific means betweenBRI and DIBELS at all six grades except for Grade 5 as well as between DRA and DIBELS. These are indicated in therows with statistically significant F-statistics by an asterisk(s).
Table A3 shows Flesch-Kincaid detected nine statistically signify differences in grade-specific means, of which threeare between BRI and DIBELS at Grades 3, 4, and 6; five are between DRA and DIBELS at all six grades except forGrade 1, and one between QRI and DIBELS at Grade 2.
Table A4 shows that RMM detected four statistically signify differences in grade-specific means, of which two werebetween BRI and DIBELS at Grades 2 and Grade 4; and the remaining two were between DRA and DIBELS, again atGrade 2 and Grade 4.
Lastly, Table A5 shows that TextEvaluator detected four statistically significant differences in specific means, two ofwhich are between BRI and DIBELS at Grade 3 and Grade 6; and the remaining two are between DRA and DIBELS atGrade 3 and Grade 4.
These multiple comparisons of grade-specific means against those of DIBELS indicate that older, two-factor modelmeasures of text complexity—Lexile and Flesch-Kincaid—detected a greater number of statistically significant differ-ences in grade-specific means, mostly between BRI and DIBELS as well as DRA and DIBELS (Lexile detected 11 suchdifferences and Flesch-Kincaid found 9). In contrast, RMM and TextEvaluator, newer, multi-dimensional measures oftext complexity, fewer instances of such differences (both measures found four instances of statistically signifydifferences each). These findings are visualized in Figure 9.
Table A1. Regression Results.
Model 1 Model 2 Model 3 Model 4
Predictors [Lexile] [FKrade] [RMM] [TE]
Assessment Coefficient (SE) Coefficient (SE) Coefficient (SE) Coefficient (SE)
BRI −393.33*** (54.79) −1.73** (0.59) −1.67** (0.60) −0.07 (0.27)DRA −141.33*** (41.37 0.10 (0.57) −0.78 (0.53) −0.27 (0.18)QRI −160.83* (63.04) −0.38 (0.42) −0.38 (0.55) 0.11 (0.30)Grade2 38.889 (38.44) 1.87*** (0.54) 0.64 (0.47) 0.59 (0.41)3 228.89*** (38.74) 3.12*** (0.46) 1.86** (0.56) 3.20*** (0.37)4 336.67*** (40.28) 4.09*** (0.53) 2.59*** (0.50) 3.29*** (0.54)5 362.22*** (37.89) 5.30*** (0.47) 3.52*** (0.52) 3.90*** (0.36)6 458.89*** (41.44) 6.18*** (0.47) 3.88*** (0.46) 4.83*** (0.37)
Assessment x GradeBRI x 2 269.11*** (62.46) 0.05 (0.95) 0.24 (0.72) −0.49 (0.49)BRI x 3 188.25** (66.34) −0.60 (0.74) 0.33 (0.77) −2.41*** (0.55)BRI x 4 79.05 (75.69) −0.72 (0.92) −0.01 (0.77) −2.05* (0.81)BRI x 5 227.78* (88.62) 0.56 (0.98) 0.76 (0.76) −0.86 (0.63)BRI x 6 192.78** (69.20) −0.69 (0.91) 0.95 (0.74) −1.90** (0.68)DRA2 x 2 22.68 (52.22) −1.55* (0.73) −0.16 (0.59) −0.21 (0.44)DRA2 x 3 −85.06 (54.03) −2.19** (0.67) 0.04 (0.64) −2.18*** (0.45)DRA2 x 4 −103.66 (56.42) −2.67** (0.84) −0.49 (0.65) −1.96** (0.72)DRA2 x 5 −89.22 (45.41) −3.71*** (0.71) −0.22 (0.67) −0.25 (0.61)DRA2 x 6 −58.39 (52.58) −2.98*** (0.68) 0.50 (0.82) −0.56 (0.78)QRI x 2 80.61 (71.40) −0.98 (0.59) −0.47 (0.69) 0.10 (0.72)QRI x 3 110.61 (67.19) −0.29 (0.52) 0.15 (0.72) −1.56* (0.76)QRI x 4 20.83 (92.75) −0.51 (0.71) −0.74 (0.82) −1.16 (0.71)QRI x 5 55.28 (82.62) −0.47 (0.77) −0.47 (0.72) −0.94 (0.76)QRI x 6 48.61 (77.50) −0.29 (0.57) −0.30 (0.70) −0.71 (0.47)
Constant 553.33*** (35.81) 1.43*** (0.40) 2.93*** (0.46) 1.27*** (0.18)R2 0.85 0.82 0.79 0.76
*p < 0.05. **p < 0.01. ***p < 0.001.Note. A bracket [] indicates the measurement for the response variable for each model. DIBELS and grade 1 were set as referencegroups for the categorical predictors respectively.
168 Y. TOYAMA ET AL.
Dow
nloa
ded
by [
The
UC
San
ta C
ruz
Uni
vers
ity L
ibra
ry]
at 1
3:17
16
Oct
ober
201
7

Table A2. Comparisons of Average Complexity (in Lexile) Against DIBELS.
Comparisons
F-stat Difference in Mean Complexity (95% CI)Grade DIBELS vs.
1 BRI 51.54*** −393.3 (−559.7 –227.0)2 BRI 17.15** −124.2 (−215.3 –33.1)3 BRI 30.06*** −205.1 (−318.7 –91.5)4 BRI 36.21*** −314.3 (−472.9 –155.7)5 BRI 5.65 −165.6 (−377.1 46.0)6 BRI 22.51*** −200.6 (−328.9 –72.2)1 DRA 11.67* −141.3 (−267.0 –15.7)2 DRA 13.87** −118.7 (−215.4 –21.9)3 DRA 42.46*** −226.4 (−331.9 –120.9)4 DRA 40.79*** −245.0 (−361.5 –128.5)5 DRA 151.78*** −230.6 (−287.4 –173.7)6 DRA 371.87*** −199.7 (−298.3 –101.2)1 QRI 6.51 −160.8 (−352.2 30.6)2 QRI 5.73 −80.2 (−182.0 21.6)3 QRI 4.67 −50.2 (−120.8 20.3)4 QRI 4.23 −140.0 (−346.6 66.6)5 QRI 3.91 −105.6 (−267.7 56.6)6 QRI 6.20 −112.2 (−249.1 24.6)
*p < .05. **p < .01. ***p < .001.Note. Sidak multiple comparison corrections are used for the calculations of p-values.
Table A3. Comparisons of Average Complexity (in FK Grade Level) against DIBELS.
Comparisons
F-stat Difference in Mean Complexity (95% CI)Grade DIBELS vs.
1 BRI 8.75 −1.73 (−3.52 0.05)2 BRI 5.13 −1.68 (−3.94 0.58)3 BRI 25.65*** −2.33 (−3.73 −0.93)4 BRI 11.91* −2.45 (−4.61 −0.29)5 BRI 2.22 −1.17 (−3.57 1.22)6 BRI 12.15* −2.43 (−4.55 −0.31)1 DRA 0.03 0.10 (−1.65 1.84)2 DRA 9.98* −1.45 (−2.85 −0.05)3 DRA 35.53*** −2.09 (−3.16 −1.02)4 DRA 17.29*** −2.57 (−4.46 −0.69)5 DRA 74.55*** −3.61 (−4.88 −2.34)6 DRA 64.15*** −2.89 (−3.98 −1.79)1 QRI 0.81 −0.38 (−1.68 0.91)2 QRI 11.36* −1.36 (−2.59 −0.13)3 QRI 4.98 −0.68 (−1.60 0.25)4 QRI 2.43 −0.89 (−2.63 0.85)5 QRI 1.73 −0.85 (−2.82 1.12)6 QRI 3.22 −0.67 (−1.80 0.47)
*p < .05. **p < .01. ***p < .001.Note. Sidak multiple comparison corrections are used for the calculations of p-values.
EDUCATIONAL ASSESSMENT 169
Dow
nloa
ded
by [
The
UC
San
ta C
ruz
Uni
vers
ity L
ibra
ry]
at 1
3:17
16
Oct
ober
201
7

Table A4. Comparisons of Average Complexity (in RMM Grade Level) Against DIBELS.
Comparisons
F-stat Difference in Mean Complexity (95% CI)Grade DIBELS vs.
1 BRI 7.81 −1.67 (−3.50 0.15)2 BRI 12.54** −1.44 (−2.67 −0.20)3 BRI 7.59 −1.35 (−2.83 0.14)4 BRI 12.39* −1.68 (−3.13 −0.23)5 BRI 3.82 −0.92 (−2.34 0.51)6 BRI 2.87 −0.73 (−2.04 0.58)1 DRA 2.16 −0.78 (−2.41 0.84)2 DRA 13.15** −0.94 (−1.73 −0.15)3 DRA 4.5 −0.74 (−1.80 0.32)4 DRA 11.91* −1.27 (−2.40 −0.15)5 DRA 6.34 −1.01 (−2.22 0.21)6 DRA 0.21 −0.29 (−2.19 1.62)1 QRI 0.49 −0.38 (−2.05 1.28)2 QRI 4.08 −0.86 (−2.15 0.44)3 QRI 0.24 −0.23 (−1.65 1.19)4 QRI 3.3 −1.12 (−3.00 0.76)5 QRI 3.37 −0.86 (−2.27 0.56)6 QRI 2.46 −0.68 (−2.01 0.64)
*p < .05. **p < .01. ***p < .001.Note. Sidak multiple comparison corrections are used for the calculations of p-values.
Table A5. Comparisons of Average Complexity (in Text Evaluator Grade Level) Against DIBELS.
Comparisons
F-stat Difference in Mean Complexity (95% CI)Grade DIBELS vs.
1 BRI 0.06 −0.07 (−0.88 0.74)2 BRI 1.78 −0.56 (−1.82 0.71)3 BRI 27.07*** −2.48 (−3.93 −1.03)4 BRI 7.58 −2.11 (−4.45 0.22)5 BRI 2.65 −0.93 (−2.66 0.81)6 BRI 9.81* −1.97 (−3.88 −0.06)1 DRA 2.12 −0.27 (−0.82 0.29)2 DRA 1.41 −0.48 (−1.70 0.74)3 DRA 34.95*** −2.44 (−3.70 −1.18)4 DRA 10.3* −2.23 (−4.35 −0.12)5 DRA 0.8 −0.52 (−2.28 1.24)6 DRA 1.17 −0.83 (−3.14 1.49)1 QRI 0.13 0.11 (−0.82 1.03)2 QRI 0.1 0.20 (−1.78 2.19)3 QRI 4.26 −1.45 (−3.58 0.69)4 QRI 2.74 −1.06 (−3.00 0.88)5 QRI 1.45 −0.83 (−2.94 1.28)6 QRI 2.81 −0.60 (−1.70 0.49)
*p < .05. **p < .01. ***p < .001.Note. Sidak multiple comparison corrections are used for the calculations of p-values.
170 Y. TOYAMA ET AL.
Dow
nloa
ded
by [
The
UC
San
ta C
ruz
Uni
vers
ity L
ibra
ry]
at 1
3:17
16
Oct
ober
201
7