an analysis of daylighting and solar heat for cooling-dominated office buildings
TRANSCRIPT

Solar Energy Vol. 65, No. 4, pp. 251–262, 19991999 Elsevier Science Ltd
Pergamon PII: S0038 – 092X( 98 )00136 – 4 All rights reserved. Printed in Great Britain0038-092X/99/$ - see front matter
AN ANALYSIS OF DAYLIGHTING AND SOLAR HEAT FOR COOLING-DOMINATED OFFICE BUILDINGS
†JOSEPH C. LAM and DANNY H. W. LIBuilding Energy Research Group, Department of Building and Construction, City University of Hong
Kong, Tat Chee Avenue, Kowloon, Hong Kong
Received 15 December 1997; revised version accepted 26 October 1998
Communicated by VOLKER WITTWER
Abstract—Computer simulation techniques were used to assess the energy performance of a genericcommercial office building in Hong Kong. The simulation tool was DOE-2.1E. The thermal and energyperformance of daylighting schemes were analysed in terms of the reduction in electric lighting requirementand the cooling penalty due to solar heat. Regression analysis was conducted to correlate the peak electricitydemand and annual incremental electricity use with two fenestration variables, namely the solar aperture andthe daylighting aperture. Contours of equal annual incremental electricity use were shown to be a function ofthe solar and daylighting apertures. It is envisaged that these simple charts can be a useful design tool forarchitects and engineers to assess the relative energy performance of different fenestration designs, particularlyduring the initial design stage when different building design schemes and concepts are being considered anddeveloped. 1999 Elsevier Science Ltd. All rights reserved.
1. INTRODUCTION hourly horizontal global radiation has been mea-sured since December 1978 by the local
Buildings, energy and the environment havemeteorological station. There was no information
become some of the key issues facing the buildingon the direct and diffuse components. In 1991, a
professions. In Hong Kong, there is a growingmeasuring station was set up at the City Universi-
concern about energy consumption, especiallyty of Hong Kong to measure the hourly global
electricity use in buildings, and its implicationsand diffuse solar radiation and outdoor illumi-
for the environment. With rapid economic growthnance for both the horizontal and vertical surfaces
and improvement in living standards, there has(Lam and Li, 1996a,b). Subsequent analysis of the
been a marked increase in energy use. Electricitydaylight availability has indicated that, for about
use in the commercial sector rose from 167350% of a typical working day, natural daylight
GWh in 1970 to 17,907 GWh in 1996, represent-alone can provide an average indoor illuminance
ing an average annual growth of 9.5% during theof 500 lux for offices with a 2% daylight factor
27-year period (Census and Statistics Department,design without the need for supplementary artifi-
1970–1996). A significant amount of the electrici-cial lighting. It has also been found that, for 80%
ty consumption is for air-conditioning and artifi-of the year, luminous efficacy ranges from 100 to
cial lighting. Recent energy audits and surveys of130 lm/W, which is much higher than the mean
fully air-conditioned commercial buildings haveluminous efficacy of lamps used in commercial
revealed that lighting and air-conditioning accountbuildings. Daylighting is, therefore, a potential
for 20–30 and 40–60%, respectively, of the totalenergy-efficient feature in two ways. Firstly,
electricity use in typical commercial buildings innatural daylight helps reduce the electricity use
subtropical Hong Kong, where the summer isfor artificial lighting. Secondly, because of the
long, hot and humid (Chan, 1994).high luminous efficacy, less heat will be dissi-
Passive solar design and daylighting have longpated for the same lighting requirement and,
been recognised as potential energy-efficient de-hence, there will be less demand for cooling.
sign strategies for buildings. However, there wasFor typical cooling-dominated commercial of-
a lack of local solar radiation and outdoor illumi-fice buildings in subtropical Hong Kong, solar
nance data for building design and analysis. Onlyheat gain accounts for just over 50% of thecooling loads due to building envelope heat gains
† (Lam and Hui, 1993). It is, therefore, important toAuthor to whom correspondence should be addressed. Fax:1852-2788-7612; e-mail: [email protected] be able to assess the trade-off between beneficial
251

252 J. C. Lam and D. H. W. Li
natural daylight and the unwanted solar heat gain. design parameters concerning the building en-There are computer simulation programs [e.g. velope, the indoor design condition and theADELINE (Erhorn and Szerman, 1994), DOE-2 building services system (Mahdavi et al., 1996;(1993) and SERI-RES (Haves and Littlefair, Lam et al., 1997).1988)] that can be used to conduct hour-by-hour Computer simulation techniques were used incomputation of the thermal and energy perform- this study to predict the thermal and energyance of buildings with daylighting schemes, and performance of fully air-conditioned office build-assess the relative benefits and penalties of natural ings in Hong Kong. The computer simulation tooldaylight and the corresponding solar heat gain. used was the DOE-2.1E (1993). A generic officeHowever, to general architectural and engineering building with design features commonly found inpractices, a full scale computer simulation of a existing office buildings was developed. Keyfully air-conditioned commercial building can be design parameters concerning fenestration designcostly and time-consuming. A recent survey of the and a daylighting scheme were identified. We thenprevailing architectural designs and practices in carried out a series of computer simulations by83 commercial buildings completed between 1982 systematically changing the values of these keyand 1992 in Hong Kong has revealed that none of design parameters. The computed results formed athe buildings in the survey has incorporated any database, from which simple charts and nomog-daylighting design features (Goodsall, 1994; Lam rams were developed. These simple charts andand Goodsall, 1994). There is no simple on/off or nomograms can be used by designers as simpleautomatic dimming controls to make use of the design tools to assess the energy performance ofnatural daylight. Interviews with local architects air-conditioned office buildings with differentand building engineers have suggested that the fenestration designs and lighting schemes.lack of some simple design methods or guidelines
2.1. Generic office buildingis one of the reasons for the unenthusiasticresponse to daylighting. Such simple methods are One of the important factors in developingparticularly useful during the initial design stage energy models for buildings is an intimate knowl-when different design schemes and concepts are edge and a good understanding of the physicalbeing considered. Thus, the primary aim of this and operational characteristics of the building tostudy is to develop a simple design method in be modelled. A generic office building was de-terms of design charts or nomograms with which veloped to serve as a baseline reference forarchitects and engineers can assess the relative comparative energy studies. A survey of thebenefits and penalties of incorporating daylighting existing commercial buildings in Hong Kong wasschemes for cooling-dominated commercial office conducted to find out the design characteristicsbuildings in subtropical Hong Kong. common to most commercial buildings in Hong
Kong (Goodsall and Lam, 1991). Descriptions ofa generic base-case model building were then
2. METHODOLOGYestablished for use in the building energy simula-
There have been many empirical and theoret- tions. The base-case reference building developedical studies dealing with the complex interactions was a 40-storey office building (35 3 35 m) withinvolved in the analysis of the thermal and energy curtain-wall design and a centralised heating,performance of air-conditioned commercial office ventilating and air-conditioning (HVAC) system.buildings. Computer simulation techniques have It has four 4.5 m-deep perimeter zones. The floor-proved useful in identifying key design variables to-floor and window heights are 3.4 and 1.5 m,that are energy-sensitive (Lam and Hui, 1996). respectively. This represents a window-to-wallBased on a series of systematic computer simula- ratio (WWR) of 44%. Glazing is single reflectivetion studies, regression models and simple design glass with a shading coefficient of 0.4. The air-tools can then be developed to correlate thermal conditioning plant is a variable-air-volume systemand energy performance indicators (e.g. peak with a cooling setpoint of 25.58C, and the chillerscooling load and annual building energy con- are of a packaged air-cooled hermetic reciprocat-sumption) with these key design variables. It has ing type with a coefficient of performance of threebeen found that these correlation relationships and (at full load). Artificial lighting is recessed
2simple design tools can give designers certain fluorescent with a lighting density of 20 W/mbasic and concise insights into the interdepen- and the indoor designed illuminance is 500 lux.dency between building energy use and the major The building and the HVAC plant operate on a

An analysis of daylighting and solar heat for cooling-dominated office buildings 253
1]10-h day (08:00 to 18:00) and a 5 -day week 3.1. Peak cooling load2
basis. Details can be found in Lam and Hui In subtropical Hong Kong, cooling energy is(1993). the most important element, and the peak cooling
load determines the maximum demands and is2.2. Hourly weather databaseuseful for plant and equipment sizing. Initial costs
Most computer simulation tools for building and operating strategies are affected by the maxi-energy analysis (including DOE-2) perform hour- mum demands, even though building energyby-hour computations of the heating and cooling consumption is not significantly affected. Analy-loads and the corresponding energy requirements. sis was therefore carried out for the peak coolingTherefore, 8760 measured hourly weather data are load, which was classified into two groups, name-required. A weather database was compiled for ly the internal cooling load and the buildingHong Kong using the 1989 measured hourly data envelope cooling load. Internal cooling load in-for air temperature, solar radiation, humidity, cludes occupancy loads (sensible and latent),wind speed, etc. The year 1989 is considered the artificial lighting and office equipment, and thetest reference year (TRY), in that the measured other items, such as window solar heat, glassmeteorological data represent the prevailing local conduction, wall conduction, etc., are groupedclimatic conditions with respect to building together as building envelope cooling load. Fig. 1energy performance analysis (ASHRAE, 1989; shows the breakdown of the peak cooling load.Hui and Lam, 1992). For the base-case design, the peak cooling load is
23295 kW (67.2 W/m ), of which, the internalcooling load accounts for 64%. The largest com-
3. BASE-CASE SIMULATION STUDIESponent of the internal load is the 645 kW from
Analysis of the simulation results of the base- electric lighting. Peak conditions occurred at 3 pmcase model is important to understand the com- on 7 August, with a peak electricity demand ofponents and building parameters of the model. 4542 kW. The outdoor temperature and relativeThe thermal and energy performance of the base- humidity are 338C and 70%, respectively. It iscase generic office building is investigated in interesting to note that occupancy latent heat isterms of the peak cooling load and the total larger than sensible heat, indicating the extremelyannual building electricity consumption. humid outdoor conditions in subtropical Hong
Fig. 1. Breakdown of peak cooling load for a base-case generic office building.

254 J. C. Lam and D. H. W. Li
Kong. Solar heat gain through the windows is 556 of the total building use, respectively. The annualkW and is the largest component of the building building electricity expenditure is found to be
2envelope cooling load. Artificial lighting and solar 8831 MWh, or 180 kWh/m on a per unit grossheat are the two components directly affected by floor area basis. The computed results for thefenestration design. Together, they account for base-case indicate that air-conditioning and light-36.4% of the peak cooling load for the base-case ing account for over 80% of the total buildingbuilding design. It is therefore important to assess electricity consumption. Again, the simulationthe energy-saving potential of the daylighting result for building electricity use indicates thescheme in terms of the fenestration design and its importance of lighting and solar heat gain inability to maximise the use of beneficial natural cooling-dominated commercial office buildings.daylight while limiting excessive solar heat gain.
3.3. Base-case design with the daylighting3.2. Annual electricity consumption scheme
The annual building electricity consumption The thermal and energy performance of thewas broken-down into seven components, namely, base-case building design were further analysed inelectric lighting, office equipment, space heating, terms of the lighting and cooling requirements.space cooling, heat rejection, pumps and fans. The base-case design was altered to include theFig. 2 shows the breakdown of these components daylighting scheme. The required working planefor the base-case model. It can be seen that energy illuminance was assumed to be 500 lux with an
2uses related to the HVAC system are the most installed lighting power density of 20 W/m . Toimportant components. Cooling energy require- avoid the likely problems of glare, excessivements (space cooling, heat rejection, pumps and brightness ratio and thermal discomfort, internalfans) dominate the total energy consumption, shading devices were installed in the perimeteraccounting for over 55% of total energy expendi- zones. These devices will only allow indirectture. As expected for the subtropical climate in diffuse daylight and will operate when the trans-
2Hong Kong, relatively insignificant building mitted solar intensity exceeds 95 W/m , theenergy is consumed by space heating, at only threshold beyond which direct sunlight may cause2.2%. The internal electric loads, namely artificial glare and other undesirable visual effects (Sul-lighting and office equipment (which are not livan et al., 1992a). The internal shading devicesweather-dependent), account for 27.6 and 15.5% reduce the shading coefficient, the light transmitt-
Fig. 2. Breakdown of annual electricity consumption for a base-case generic office building.

An analysis of daylighting and solar heat for cooling-dominated office buildings 255
ance and the U-value of the glazing system by 75, computer simulations, and regression techniques65 and 15%, respectively. For daylighting simula- are then used to study the effect of varioustion, top-up controls were used for regulating the parameters on building energy performance. Theelectric lighting in response to the variable day- basic objective is to build up a regression modellight source. Daylighting levels were determined relating a dependent variable to independentat one reference point in each perimeter office at variables. This technique was used to correlate thethe working plane 0.75 m above the finished floor peak electricity demand and annual buildingand at a depth of 2.5 m, centred with respect to energy consumption with the glazing variables,the window. through regression analysis.
With daylighting, the peak cooling load is 2930 For a given glazing type, the critical variablekW, an 11% reduction. With the exception of determining the solar heat gains and the amountelectric lighting, all internal components remain of daylight entering a building is the glazing area.unchanged. Using daylighting controls, cooling A large window area will, on the one hand, resultload from lighting is reduced from 645 to 331 kW, in more cooling requirements due to an increasewhich accounts for about a 50% reduction in heat in solar radiation. This, however, will also admitdissipation from electric lighting installation. The more natural daylight and may reduce electricbuilding envelope cooling load is slightly reduced, lighting consumption. To better understand theseby about 4%. The reduction is mainly due to the interactions, two parameters, namely solar aper-instant at which building peak cooling demand ture (SA) and daylighting aperture (DA), wereoccurs. The inclusion of a daylighting scheme used for the analysis. Solar aperture is defined aswith top-up controls lowers the total building the WWR times SC and daylighting aperture iselectricity use from 8831 to 7705 MWh, a reduc- the product of WWR and LT of the window glasstion of about 13%. Major savings occur in space (Johnson et al., 1984; Huang et al., 1989). Solarcooling and electric lighting requirements. Annual aperture indicates the proportion of incident solarelectricity use for space cooling decreases by 8% that enters the zone as heat gain and it would beand electric lighting by 30%. Fans, pumps and better understood to correlate the energy use of aheat rejection have about a 10% reduction, and building without daylighting. Daylighting aperturespace heating and office equipment remain un- determines the amount of daylight entering achanged. building and it directly affects the performance of
a daylighting design.
4. PARAMETRIC ANALYSIS OF4.1. Solar aperture
FENESTRATION DESIGNThe base-case office building was used to carry
From the comparisons of cooling and energy out a series of simulations with the fenestrationperformance between designs with and without being changed systematically. Three single glaz-daylighting schemes, it has been shown that ing types, namely clear glass (SC50.9, LT50.85,
2daylight admitted through the building envelope U-value56.0 W/m 8K), tinted glass (SC50.7,2offers an opportunity to significantly reduce light- LT50.5, U-value56.2 W/m 8K) and reflective
2ing requirements and cooling loads. The building glass (SC50.4, LT50.3, U-value55.6 W/m 8K)envelope, primarily the glazing, is a major vari- were simulated. In addition to the base-case (i.e.,able in determining the peak demands and energy 44% WWR), glazing area was varied using eightconsumption. The shading coefficient (SC) domi- WWRs ranging from 0 to 70% at 10% intervals.nates solar gains and thus affects the peak cooling We carried out a total of 25 simulation runs fordemand and energy consumption of a building. the non-daylighting scheme (i.e. three simulationThe light transmittance (LT) of the fenestration runs for every WWR, except 0%). There are,controls the indoor daylight availability, and therefore, 25 sets of simulation results for theoffsets the electric lighting energy and cooling subsequent regression analysis. Fig. 3 shows therequirements due to sensible heat gain from the variations of peak electricity demand (PED) withartificial lighting system. Therefore, an assess- respect to the solar aperture. A linear relationshipment of the benefits of lighting energy savings can be observed (similar observations have beenand the detrimental effects from solar heat gain is reported by Sullivan et al., 1992b for California).essential for proper daylighting designs. To facili- Through regression analysis, the PED can betate an understanding of the factors affecting expressed in terms of SA as follows:fenestration system performance, key windowvariables are often changed parametrically in PED 5 2562.9 SA 1 4101.3 (kW) (1)

256 J. C. Lam and D. H. W. Li
Fig. 3. Correlation between peak electricity demand and solar aperture.
2The coefficient of determination, R , is 0.999, the four perimeters zones, but the magnitude ofindicating that 99.9% of the variations in PED can electric energy use and the rate of increase varybe explained by the variations in SA. This is not and the effects of orientation can be observed.surprising, since solar heat gain is directly propor- The coefficients for the north, east, south and westtional to both SC and window area, which is a are 643, 1025, 1096 and 1163, respectively. Amajor component of the cooling load. Apart from relatively low coefficient was found for the northPED, the annual electricity consumption can also perimeter zone, which basically only receivesbe affected by the SA. To better understand the diffuse radiation. East, south and west perimeterelectricity consumption due to solar heat gain, the zones admit direct sunlight and thus have similarincremental electricity use was correlated with coefficient values, which are about 70% greatersolar aperture. Incremental electricity use is de- than that for the north perimeter zone. With all of
2fined as the difference between the consumption the R values being greater than 0.98, the correla-with windows and the consumption without win- tions between the incremental electricity use anddows (i.e. 0% WWR). Fig. 4 shows the correla- solar aperture are considered to be good.tion. It can be seen that the incremental electricity
4.2. Daylighting apertureuse (IEU) correlates almost linearly with solaraperture. The slight non-linearity may be due to Similar to the analysis for solar aperture, a totalthe change of U-value for different glazing types. of 25 computer simulation runs with daylightingThrough regression analysis, IEU is expressed in schemes were conducted, and there are 25 sets ofterms of SA as follows: computed results for the regression analysis. Fig.
5 shows the correlation between the peak elec-IEU 5 4713 SA (MWh) (2) tricity demand and the daylighting aperture. With
the use of daylighting controls, increasing DA by2The R is 0.977, indicating that 97.7% of the increasing WWR means more daylight is admitted
changes in IEU can be accounted for by the and utilised. However, changes in WWR alsovariations in SA. The electricity consumption for increase SA. Initially, at small DA, artificialeach perimeter zone was also determined separ- lighting is significantly displaced by daylight. Asately. Similar linear correlations were found for DA increases, the capacity of daylight to replace

An analysis of daylighting and solar heat for cooling-dominated office buildings 257
Fig. 4. Correlation between incremental electricity use and solar aperture.
Fig. 5. Correlation between peak electricity demand and daylighting aperture.

258 J. C. Lam and D. H. W. Li
artificial lighting is reduced gradually. When the degrades progressively. It can be seen that thereilluminance level from daylight exceeds the re- are very small additional energy savings beyondquired level, no further lighting energy will be 0.4 DA. Through regression analysis, it has beenreduced. Fig. 5 shows a diminishing return for the found that the incremental electricity use can bepeak electricity demand at a daylighting aperture correlated with the daylighting aperture as fol-of about 0.1, and the peak electricity demand lows:starts increasing when the daylight aperture is
27.3DAIEU 5 1676(e 2 1) (4)0.15. Regression analysis has suggested that PEDcan be expressed as a cubic function of DA as 2The R value is 0.954, indicating that just overfollows:
95% of the variations in IEU can be explained by3 2 the variations in the DA. Similarly, the electricityPED 5 2 15,023DA 1 17,488DA 2 3889DA
savings for the four perimeter zones were also1 4162 (kW) (3)
computed. Similar correlation relationships be-tween the incremental electricity consumption and2The R is 0.872, which is much smaller thanthe daylighting aperture were found. The mag-
the correlation for the solar aperture. To study thenitude of the energy reduction is smaller com-
electricity savings, the incremental electricity 2pared with the whole building. All of the Rconsumption (i.e., difference in the electricity
values for the four perimeter zones exceed 0.93,expenditure between buildings with and without
indicating a strong correlation between the in-daylighting controls for the same SA and DA) due
cremental electricity consumption and the day-to daylighting were calculated and correlated with
lighting aperture.the daylighting aperture, and are shown in Fig. 6.As the DA increases initially from zero, there isan abrupt reduction in lighting energy, indicating
5. ENERGY PERFORMANCE OPTIMISATIONthat the capacity of daylight to replace artificial
Optimum energy performance requires the de-lighting is high. However, as DA continues totermination of the solar and daylighting apertureincrease, daylighting does not significantly con-values that minimise the energy consumption intribute to additional lighting energy savings but
Fig. 6. Correlation between incremental electricity use and daylighting aperture.

An analysis of daylighting and solar heat for cooling-dominated office buildings 259
the building. The correlation relationships be- than 0.4, indicating that useful natural daylighttween incremental energy use and solar aperture saturation is reached. Prior to this saturation, bothand daylighting aperture shown in Figs. 4 and 6 the solar radiation-induced electricity use and thewere combined to form a composite set of data electricity savings due to daylighting vary withexpressing energy use as a function of these two the SA and DA. Beyond saturation, a significantvariables. Fig. 7 shows the contours of incremen- reduction in energy use can only be achieved bytal electricity use as a function of solar and reducing the solar aperture.daylighting apertures. These contours reflect the Daylighting efficacy (K ), i.e. the ratio of lighte
overall energy performance of different fenestra- transmittance to shading coefficient, is a measuretion designs in terms of different combinations of of the energy efficiency of a particular glass typewindow areas and glazing types. The reference in terms of the daylighting potential and likelypoint at the lower left-hand corner (i.e. zero SA impact on cooling load (Arasteh et al., 1985). Theand zero DA) refers to a building envelope design same K can be obtained with different combina-e
with opaque external walls only (i.e. no window). tions of light transmittance and shading coeffi-Fig. 7 shows that, for a particular glazing type, as cient. For a fixed K value, the energy perform-e
the WWR increases, various combinations of SA ance can vary a great deal. For K 51, incrementale
and DA will result in different electricity con- electricity use varies from about 2400 MWhsumptions with top-up lighting controls. A posi- (energy savings) to over 11500 MWh (moretive value means that more energy use is con- energy consumed), depending on the differentsumed compared with the opaque wall design, and combinations of SA and DA values. This indi-vice versa. Different combinations of SA and DA cates that K in itself is not a sufficient parametere
along the zero incremental electricity use line to determine energy performance. Window arearepresent the different fenestration designs, which plays an important part. Nevertheless, K cane
will have the same energy performance as the provide an indication of the likely energy ef-building design with opaque walls. Large SAs ficiency and the optimum solar and daylightingadmit more solar heat and are more likely to apertures. For instance, for glazing types withresult in an excessive cooling load. For SA values K 52, the optimum apertures can be determinede
greater than 0.3, very little to no energy savings by moving away from the origin (i.e. zero SA andcan be obtained for any DA values. A large DA zero DA) along the ‘K 52 line’. Initially, thee
admits more natural daylight. However, a dimin- reduction in lighting energy outweighs the in-ishing return is observed for DA values greater crease in the cooling requirement up to SA50.12
Fig. 7. Contours of equal incremental electricity use for a whole building (s, clear glass; h, tinted glass; n, reflective glass).

260 J. C. Lam and D. H. W. Li
and DA50.24. Beyond these optimum apertures, MWh more than tinted glass, which, in turn, isa reduction in electric lighting becomes pro- about 400 MWh more in energy expenditure thangressively smaller and the cooling energy penalty reflective glass.begins to outweigh the natural daylight benefit. Similarly, the same approach can be extended
It can also be seen from Fig. 7 that for K #0.5 to develop contours of incremental electricity usee
(i.e. the light transmittance is equal to or less than as a function of the solar and daylight apertureshalf of the shading coefficient), more energy is for the individual perimeter zones. Figs. 8 and 9required regardless of the fenestration designs, show the contours for the north and south perime-indicating that the cooling penalty due to solar ter zones, respectively. The effect of orientationheat always exceeds natural daylight benefits. The on the magnitude and pattern of electricity uselarger the WWR value, the higher the energy can be observed. The pattern of contours for thepenalty. For K $2, there will always be energy south perimeter zone is very similar to that for thee
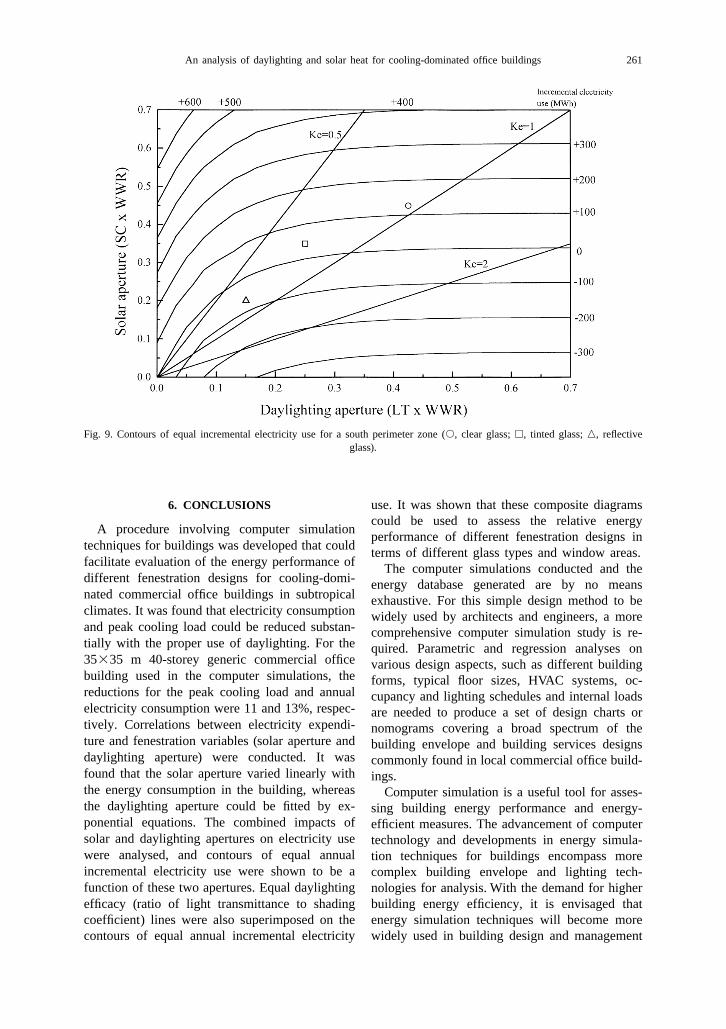
savings. In other words, if the percentage of whole building shown in Fig. 7. For the north-natural daylight admitted through a particular facing office, negative incremental energy useglazing type is twice that for solar radiation, (i.e. overall daylighting energy savings) occurs fordaylighting benefits always outweigh unwanted major combinations of solar and daylightingsolar heat for any window area. The glazing apertures. This is not surprising because the north-performance of a particular fenestration design facing windows have relatively smaller solar heatwith varying WWR can be determined by moving as they mainly admit diffuse solar radiation. It isprogressively along a straight line away from or interesting to note that, for the north perimetertowards the origin. Thus, the expected incremen- zone, the clear, tinted and reflected glass men-tal electricity use for different window types and tioned earlier will all result in negative incremen-areas can be estimated. A comparative energy tal electricity use, whereas only reflective glassperformance study can also be conducted for can out-perform the opaque walls design for thedifferent glass types based on Fig. 7. To illustrate south-facing office. This suggests a possibility ofthis, the three types of glass commonly used in using different glass types for different orienta-Hong Kong buildings are shown in Fig. 7. With a tions to achieve optimum energy performance asWWR of 0.5, clear glass consumes about 250 well as cost-effective designs.
Fig. 8. Contours of equal incremental electricity use for a north perimeter zone (s, clear glass; h, tinted glass; n, reflectiveglass).
An analysis of daylighting and solar heat for cooling-dominated office buildings 261
Fig. 9. Contours of equal incremental electricity use for a south perimeter zone (s, clear glass; h, tinted glass; n, reflectiveglass).
6. CONCLUSIONS use. It was shown that these composite diagramscould be used to assess the relative energy
A procedure involving computer simulationperformance of different fenestration designs in
techniques for buildings was developed that could terms of different glass types and window areas.facilitate evaluation of the energy performance of The computer simulations conducted and thedifferent fenestration designs for cooling-domi- energy database generated are by no meansnated commercial office buildings in subtropical exhaustive. For this simple design method to beclimates. It was found that electricity consumption widely used by architects and engineers, a moreand peak cooling load could be reduced substan- comprehensive computer simulation study is re-tially with the proper use of daylighting. For the quired. Parametric and regression analyses on35335 m 40-storey generic commercial office various design aspects, such as different buildingbuilding used in the computer simulations, the forms, typical floor sizes, HVAC systems, oc-reductions for the peak cooling load and annual cupancy and lighting schedules and internal loadselectricity consumption were 11 and 13%, respec- are needed to produce a set of design charts ortively. Correlations between electricity expendi- nomograms covering a broad spectrum of theture and fenestration variables (solar aperture and building envelope and building services designsdaylighting aperture) were conducted. It was commonly found in local commercial office build-found that the solar aperture varied linearly with ings.the energy consumption in the building, whereas Computer simulation is a useful tool for asses-the daylighting aperture could be fitted by ex- sing building energy performance and energy-ponential equations. The combined impacts of efficient measures. The advancement of computersolar and daylighting apertures on electricity use technology and developments in energy simula-were analysed, and contours of equal annual tion techniques for buildings encompass moreincremental electricity use were shown to be a complex building envelope and lighting tech-function of these two apertures. Equal daylighting nologies for analysis. With the demand for higherefficacy (ratio of light transmittance to shading building energy efficiency, it is envisaged thatcoefficient) lines were also superimposed on the energy simulation techniques will become morecontours of equal annual incremental electricity widely used in building design and management

262 J. C. Lam and D. H. W. Li
Arasteh D. R., Johnson S., Selkowitz S. and Connell D. (1985)processes by building professionals. However, aCooling Energy and Cost Savings with Daylighting in a Hot
detailed energy study using computer simulation and Humid Climate, LBL-19734, Lawrence Berkeley Lab-techniques can be time-consuming and costly for oratory, University of California, CA.
Census and Statistics Department (1970–1996) Hong Kongmany architectural and engineering practices,Monthly Digest of Statistics, Hong Kong.
particularly during the initial design stage when Chan A. L. S. (1994) Development of Guidelines for Energy-different building schemes and concepts are being Efficient Operation of Fully Air-Conditioned Buildings in
Hong Kong, MPhil Thesis, City University of Hong Kong,considered and developed. Furthermore, becauseHong Kong.
of the black-box characteristics, practitioners may DOE-2 (1993) DOE-2 Supplement Version 2.1E, Lawrencesometimes find it hard to correlate the relative Berkeley Laboratory, University of California, CA.
Erhorn H. and Szerman M. (1994) Documentation of theenergy performance with the different fenestrationSoftware Package ADELINE (9 volumes), Stuttgart.
designs. Simple design methods using charts and Goodsall C. J. (1994) Identifying Appropriate Energy Con-nomograms can give designers some basic and servation Strategies for Buildings in Hong Kong, MPhil
Thesis, City University of Hong Kong, Hong Kong.concise insight into the design and energy interre-Goodsall C. J. and Lam J. C. (1991) Energy Efficiency in
lationship. We believe that simple design methods Buildings in Hong Kong: A Survey of Existing Construc-and a detailed energy study using computer tion, Research Report BC/91/02, Department of Building
and Construction, City University of Hong Kong, Hongsimulation techniques can complement each other.Kong.
The former can be used to select glass types and Haves P. and Littlefair P. J. (1988) Daylight in dynamicdecide window areas during the initial design thermal modelling programs: case study. Building Services
Engineering Research and Technology 9, 183–188.stage, and a detailed computer simulation studyHuang Y. J., Thom B. and Ramadan B. (1989) A daylighting
can be conducted when sufficient information on design tool for Singapore based on DOE-2.1C simulations.the various design aspects (e.g. occupancy and In Proceedings of the ASHRAE Far East Conference on
Air-conditioning in Hot Climates, pp. 200–227, Kualaequipment loads and their schedules) are availableLumpur.
at a later stage in the design process. Hui S. C. M. and Lam J. C. (1992) Test reference year (TRY)Very little work on solar energy and daylighting for comparative energy study. Hong Kong Engineer 20,
13–16.analysis for Hong Kong exists in the internationalJohnson R., Sullivan R., Selkowitz S., Nozaki S. and Conner
literature on solar energy. It is hoped that the data C. (1984) Glazing Energy Performance and Design Optimi-and information presented in this paper would be zation with Daylighting, LBL-15625, Lawrence Berkeley
Laboratory, University of California, CA.of interest to researchers and designers of theLam J. C. and Goodsall C. J. (1994) A survey of building
international solar energy community, and help envelope designs for commercial buildings in Hong Kong.promote the use of natural daylight and passive Building Research and Information 22, 79–86.
Lam J. C. and Hui S. C. M. (1993) Computer simulation ofsolar design in the subtropics. Although the workenergy performance of commercial buildings in Hong Kong.
presented is based on the Hong Kong design and In Proceedings of the Building ’93 Simulation Conference,climatic environment, we believe that the tech- pp. 129–135, Adelaide.
Lam J. C. and Hui S. C. M. (1996) Sensitivity analysis ofniques and procedures are applicable to locationsenergy performance of office buildings. Building and En-
with similar climates and commercial building vironment 31, 27–39.development. Considering the rapid building de- Lam J. C., Hui S. C. M. and Chan A. L. S. (1997) Regression
analysis of high-rise fully air-conditioned office buildings.velopment in the commercial sector in neighour-Energy and Buildings 26, 189–197.
ing cities in southern China, this could have Lam J. C. and Li D. H. W. (1996) Study of solar radiation datasignificant energy and environmental implications for Hong Kong. Energy Conversion and Management 37,
343–351.in the region.Lam J. C. and Li D. H. W. (1996) Luminous efficacy of
daylight under different sky conditions. Energy Conversionand Management 37, 1703–1711.
Mahdavi A., Brahme R. and Mathew P. (1996) The ‘LEK’-Acknowledgements—Work was funded by an RGC Competi- concept and its applicability for the energy analysis oftive Earmarked Research Grant. D.H.W. Li was supported by a commercial buildings. Building and Environment 31, 409–City University of Hong Kong studentship. 415.
Sullivan R., Lee E. S. and Selkowitz S. (1992a) A Method ofOptimizing Solar Control and Daylighting Performance inCommercial Buildings, LBL-32931, Lawrence BerkeleyLaboratory, University of California, CA.REFERENCES
Sullivan R., Lee E. S. and Selkowitz S. (1992b) ImpactASHRAE (1989) ASHRAE Handbook — Fundamental, Assessment and Performance Targets for Lighting and
American Society of Heating, Refrigerating and Air Con- Envelope System, LBL-33075, Lawrence Berkeley Labora-ditioning Engineers, Inc., Atlanta, GA. tory, University of California, CA.