an analysis of a modified social force model in crowd
TRANSCRIPT
http://arqiipubl.com/ams
APPLICATIONS OF
MODELLING AND SIMULATION
eISSN 2600-8084 VOL 3, NO. 3, 2019, 135-144
Copyright © 2019 The Authors. 135
An Analysis of a Modified Social Force Model in
Crowd Emergency Evacuation Simulation
Hamizan Sharbini1,2*, Roselina Sallehuddin2 and Habibollah Haron2
1Faculty of Computer Science and Information Technology, UNIMAS, 94300 Kota Samarahan, Sarawak, Malaysia 2School of Computing, Faculty of Engineering, Universiti Teknologi Malaysia, 81310 UTM Skudai, Johor, Malaysia
*Corresponding author: [email protected], [email protected]
Received 14 May 2019, Revised 23 June 2019, Accepted 25 June 2019.
Abstract: In crowd evacuation simulation, a number of exit point and obstacles play an important role that can influence the
result in the evacuation simulation. This paper focuses on the movement of the crowd’s emergency evacuation based on a
modified social force model (SFM) via optimising the obstacles interaction parameter in one the SFM component. The
simulation also compared original SFM (without obstacles) and modified SFM (with obstacles). The results show the impact
can minimize the concept of arching phenomenon (faster-is-slower). For an obstacles issue, it is proven that obstacles can help
to reduce evacuation time in regards to its proper position and exit width.
Keywords: Crowd evacuation; Crowd simulation; Emergency evacuation; Faster-is-slower; Social force model.
1. INTRODUCTION
Crowd and group simulations are becoming increasingly important in the entertainment industry and in emergency simulation.
Such technology can be used in situations where it is dangerous for real people to perform the actions. Recent research into
crowd simulation has to large extent been inspired by the flocking work of Reynolds [1]. As crowd may become panic in an
emergency situation, thus it is crucial for the future research to investigate on the psychology, social relationship and obstacles
for better crowd evacuation results [2]. Computer models for emergency and evacuation situations have been developed and
most research into panics has been of empirical nature and carried out by social psychologists and others [3].
The SFM is applied in order to analyse the crowd movement in a panic crowd situation. The SFM is used in this simulation
as it is important in describing the velocity and trajectory of the motion in movement that human used to do in panic situations.
The acceleration of velocity in crowd movement will show different evacuation time when emergency situation occurred.
Ideally, in normal situation, the movement of the crowd is slower compared to movement in panic situation as pedestrian try
to move faster than normal in panic situation as mentioned by [4]. Nonetheless, the SFM is ultimately crucial in simulating the
evacuation process in order to show the crowd movement towards the goal whereby in this case the goal is going towards the
exit. The impact may show the results of clogging and issues of bottleneck (crowd’s behavior) in the exit area. This simulation
is needed so as to ascertain the process of “faster-is-slower” effect [5].
Other issues that also still in view is during the process of finding the nearest exit(s) in order to shorten the evacuation
time [6]. The criteria of having obstacles is needed as part of searching for exit way during evacuation simulation. As mentioned
by Ibrahim et al. [7], their work has proved that finding for a solid exit or nearest exit may lead to vague shortest evacuation
time. The parameters such as the obstacles exist surrounding the evacuation area might also give an impact towards the
evacuation time. As such, there is a need to have a simulation that include modifying the parameters in different perspective
of panic crowd evacuation situation.
2. LITERATURE REVIEW
This section discusses further on crucial problems as stated in literature pertaining to using SFM in regards with modeling the
crowd behavior in panic situation with obstacle’s configuration. Apart from SFM, other existing techniques will be compared
in order to find the gaps or problems in crowd modelling behavior simulation.
2.1 Crowd Behaviour and Simulation
Numerous studies on understanding pedestrian flow at bottlenecks such as exit have been conducted in the past [8][9]. Self-
organisation from crowd behavior can occur in normal situation. Self-organization is a various self-organised spatio-temporal
pattern that are not externally planned, prescribed or organized such as by traffic signs, laws or behavioral conventions. Instead,
the pattern emerges due to the non-linear interactions of pedestrian [10]. These interactions are more reactive and subconscious
than based on strategical considerations or communication. Early investigations of self-organisation phenomena in pedestrian
H. SHARBINI ET AL., APPLICATIONS OF MODELLING AND SIMULATION, 3(3), 2019, 135-144
136
crowds have been based on qualitative empirical observations and simulation studies [11]. The following subsections discuss
on the existing techniques and its characteristic in simulating crowd behavior model.
2.1.1 Agent-based Model
Agent-based simulation also being widely used for crowd simulation and the reason is to help explore the evacuation process
for example, under fire situation. Usually, this simulation includes a large number of agents. In the panic situations of escape,
individuals are getting nervous and they tend to develop blind actions. They may try to move considerably faster than normal.
The individuals start pushing and interactions among people will become more physical in nature. Based on Patrix [12], they
have been using the approach of multi-agent in order to simulate movement in different scenarios. The disadvantage of agent-
based model is that it can contribute to a more varied method and it is said to be a computationally expensive in order to run
the simulation [13].
2.1.2 Lattice Gas Model
Lattice gas models have been used to model and verify a classroom evacuation done by [14]. The model can establish the
connection between the macroscopic physics and the microscopic discrete dynamics of the automaton as mentioned by [15].
The only problem in using this model is that need to address the statistical description of a system of many interacting particles.
2.1.3 Cellular Automata
Cellular automata is another model to simulate crowd and it has been constituted by the structure of the rules, change the state
based on the result of pedestrian behaviors. The model has fast computation speed, has collision detection handling and particle
systems for their unconstrained movement and it adhere to simplicity and its adequation to computer architectures and parallel
machines [16], [17], [18]. Although the model shows improvement in a lot of aspects mentioned, the model depicts unnatural
crowd movement, it only considers for flow of people in general. The model is also not suitable for dense crowd, as agents on
the grids cannot get closer to each other than its cell size.
2.1.3 Leader-follower Model
This model is used for having leader that lead people to evacuate after all the followers gathering around the leader. The leader-
follower model has been used in the simulation to help leads people to evacuate to safer place [19]. The drawback would be
in regards of the leader position as the leader must be positioned at an important area as any particles or agent that situated far
away and might not be able to follow or even find the leader.
2.1.4 Social Force Model
It has been suggested that the mention of pedestrian can be described as if they would be subject to “Social force” [20]. The
concept of social force is more to human behavior that is called “chaotic” and unpredictable. These “forces” are not directly
exerted by the pedestrian’s personal environment, but they are a measured for internal motivations of the individuals to perform
certain action or movement.
An example of the basic of social force that simulates the real situation is where the crowd of people with an experience
of running to catch a bus during a peak hour in city of Beijing. People who is trying to get on the bus will show the action of
pushing from the middle [21]. This action comparatively is less successful compared to people pushing from the sides in order
to get on the bus. This phenomenon leads to a future study of the simulation element which can benefits people who push from
the sides. In other words, it can be said that the people pushing from the middle are ‘blocked’ by the force coming from aside
and as such it will be the obstacles in the scenarios. Their assumption stated that the property that reduces the escape speed in
a panic situation is the tangential momentum. If this assumption is true, to increase the escape speed is to find a better layout
design of a room that can reduce the tangential momentum.
Another experiments without an obstacle has also been done and it is found that a clogging effect may reduce the efficiency
of escape and produced high pressures in the crowd [22]. Panic occurs when their start running and pushing to each other to
reach their destination especially in fire or emergency situation, their try to reach the exit as fast as possible without thinking
people next to them. The situation that make them waiting for their turn to exit the room is known as arching.
Another observation that can be made from panic situation is the arching become an anti-arching. Anti-arching is when
the activities increase with speed increasing for overall speed of the particle. At the same time, a few people that are not
impatient to keep waiting may move to other direction to find another exit to out from the space. A case of two people meets
at the exit and out in the same time is called as a clogging.
Another habit in panic situations is the physical interactions in jammed crowds add up and can cause dangerous pressures
up to 4500 N/m which can bend steel barriers or tear down brick walls [23]. The strength and direction of the forces acting in
large crowds can suddenly change by pushing people around in an uncontrollable way. This may cause people to fall and this
might bring injured and can be a fatal if the crowd in panic situation.
The advantage of using SFM is its simplicity and the model also suggests innovative measures to improve particles flows
in normal and panic situation. By adjusting the size and direction of the individual’s motivational forces, it is likely to describe
the individual’s changing target exits, individual’s pushing and following others behaviours. The only features that SFM
lacking is the element of representing individual’s realistic movement when dealing with multi-room environment [24].
Many studies have been done on the effect of ‘faster-is-slower’ effect. The effect of ‘faster-is-slower’ that has improved

H. SHARBINI ET AL., APPLICATIONS OF MODELLING AND SIMULATION, 3(3), 2019, 135-144
137
the evacuation times are consistently become longer if people push harder towards the exit. The experiment has been carried
out with simulation without obstacles [25]. Their analysis also important as part of how the evacuation time in competitive
egress especially during the beginning of the evacuation. The time analysis beyond the ‘faster-is-slower’ effect which studied
on a high pressure from the pedestrians can alter the dynamics of the prior blocking clusters and thus impacting the delay time
during the evacuation process [26]. Another experiment was conducted to analyse the crowd evacuation passing through a
narrow exit connected with guide-walls to show the faster-is-slower effect by using rodent [27]. A similar experiment using
mice has also been carried out to show the pedestrian dynamic in order to analyse the ‘faster-is-slower’ effect and crowd
panicking behavior specifically in corner exit [28]. From the observation, the necessity to relocate the exits at the room corner
can reduce the effect of ‘faster-is-slower’. The study on exit width variation has also been done as to observe the effect of
‘faster-is-slower’ which already known to have cause the forming of bottleneck and deadlock situation during escape flow
[29].
A few studies have been reviewed on various evacuation simulation. There is a need in regards of the modification been
made in terms of how the placement of obstacles can affect the crowd behavior and evacuation time during evacuation situation.
From here, the modification is required in order to analyse the interaction between the pedestrians and existence of obstacles
inside a room and how it can impact on evacuation time and the effect of ‘faster is slower’.
3. METHODOLOGY
It is necessary to demonstrate a situation that apply the SFM for simulating the evacuation agents such that the impact of
manipulating the parameters can be studied further. Figure 1 shows the general crowd simulation framework. The modification
which took place of a single exit is in order to see the different or emergent behavior by the particles (agents) while searching
for the exit to escape from the panic situation which will be highlighted in next section.
The evacuation procedure for this simulation is depicted in the evacuation flowchart in Figure 2. The individual in a crowd
in the simulation will be referred to as an agent in this simulation. When panic situation occurs, the agent will go through the
evacuation process such as choosing for path selection. The agent will find the available exit and the exit way maybe
surrounded by obstacles. In the case of no obstacles, the agent can successfully exit during the evacuation process. Else, if the
agent facing obstacles, they will need to avoid the obstacles (obstacles avoidance) before heading towards the exit.
Figure 1. The simulation of crowd evacuation framework
Figure 2. The evacuation simulation procedure
Stage 1:
Review from existing techniques and crowd simulation model
Stage 2:
Design the layout and modified the parameters involved in original SFM
Stage 3:
Comparison with and without obstacles

H. SHARBINI ET AL., APPLICATIONS OF MODELLING AND SIMULATION, 3(3), 2019, 135-144
138
3.1 The Modification in Interaction Module
Originally, the social force model was introduced for the normal situation only, where there is no jam or contact occurring
amongst pedestrians as shown in Equation (1). Subsequently, this force was extended by including the physical force which is
considered to incorporate the panic situation into the model [30]. The modification takes place in Equation (2) which describe
the movement of individual in a crowd pertaining to individual interaction with obstacles and is part of submodule named as
Interactions component in Equation (1).
(1)
(2)
where 𝑥𝑖⃗⃗⃗ = place or location, t = time; 𝑣𝑖⃗⃗⃗ = speed, mi = mass of particle, 𝑡𝑖 = acceleration on time, 𝑣𝑖0 = desired velocity, 𝑒𝑖⃗⃗
= desired direction.
3.2 The Setting of the Simulation Environment
The design and the simulation are performed using MATLAB software. The environment of the simulation is in 2D perspective
with the assumption having to simulate a tutorial room with only one exit. The size of the exit width is 1.0 m. The room size
is 15 m x 17 m range from 20 until 100 particles to denote the agent’s total number. The number of total particles chosen and
desired velocity of 4 m/s are based on the work of Haghani and Sarvi [31], in which the gradient of the plotted curves was
observed to be decreasing as the velocity increased, indicating that at more reasonable values of velocity, the exit throughput
becomes heavily sensitive to the velocity, but the degree of sensitivity dramatically reduces for velocity values greater than 3–
4 m/s. The higher value of velocity mimicking the pressure value which is the same as increasing the panic level. The
explanation of range of total number of pedestrian (agents) also stated in their work. An increase of desired velocity, up to
approximately 4 m/s, is the rate at which people could exit and outflow remained steady [32]. Other work [33] also highlighted
the same desired velocity with an example and images of real situation.
The experiment will be run in two conditions: The first is the simulation that use the original SFM without obstacles (in
Section 3.2.1). Secondly, is the simulation using the modified version which include obstacles during the simulation (in Section
3.2.2). The default minimum and maximum value for the panic level is measured based on pressure level in the range between
0 to 3000 N/m. Table 1 explains the details of the agent pressure level. The pressure levels of one agent is affected by the
physical pressure of other agent in the simulation. Increasing waiting time towards exit may trigger the pressure level in agent.
Figure 3 shows the agent colour code to show the pressure level during simulation stage.
Table 1. The agent’s colour indication
Agent colour code Pressure Level/Range (N/m) Indication
Green 0 No pressure
Yellow 1500 Acceptable pressure
Orange 1500 - 3000 Uncomfortable pressure
Red 3000 Critical pressure
Figure 3. Agent’s colour code showing the pressure level during simulation experiment

H. SHARBINI ET AL., APPLICATIONS OF MODELLING AND SIMULATION, 3(3), 2019, 135-144
139
3.2.1 Simulation with Original Social Force Model (without Obstacles)
Figures 4 - 8 shows the simulation with 100, 80, 60, 40 and 20 agents in their initial and middle running time. The simulation
shows how the agent (depicted as the particles) try to leave the room space with the fast movement as a result of emergency
situation occurs. Later, the panic behaviour can be obviously seen as the movement of the agents becomes slow due to the
emergent of clogging behavior. The velocity is taken as the parameter describing panic situation, as what has been done in the
work by Helbing et al. [34]. It is stated in the work that the panic act as a force on individuals in order to alter their velocity.
The description of panic level based on pressure level has been highlighted in [35]. If physical pressure is sustained at high
value for some time, the panic level of the agent starts increasing rapidly.
Figure 4. Simulation with 100 agents: The starting of the
simulation shows the random movement of the agent.
There are many agents in red colour in this simulation and
they can hardly get out via the exit as the results of
clogging and arching situation
Figure 5. Simulation with 80 agents: The agent can be
clearly seen as red and orange as they move towards the
exit. The orange colour shows the uncomfortable pressure
during the clogging period and slowly turn to yellow colour
to denote acceptable pressure level
Figure 6. Simulation with 60 agents: The red colour agent
becoming less and during exit shows less arching and
clogging behaviour
Figure 7. Simulation with 40 agents: There is less agent in
orange colour during the exit as a results of less arching
and clogging behavior in this simulation
Figure 8. Simulation with 20 agents: The agent now mostly in green colour showing no pressure and easily flows towards
the exit due to a smaller number of agents in the crowd

H. SHARBINI ET AL., APPLICATIONS OF MODELLING AND SIMULATION, 3(3), 2019, 135-144
140
3.2.2 Social Force Model with Obstacles (Modified SFM)
Second simulation involved the modification elements where four obstacles has been put randomly but near to exit according
to the position which indicate by blue colored object shown. Figures 9 - 13 shows the simulation with 100, 80, 60, 40 and 20
agents in their initial and middle runnng time with obstacles (in blue colour code) to simulate the evacuation situation. At the
beginning of the simulation, most of the agent’s movement with less agent in red or orange colour. The agents in red colour
shows it is still in high pressure level but shows reduction in total number. The agent mostly in green colour showing no
pressure and it avoids the obstacles and flows towards the exit. The obstacle is expected to give a space for the agents going
toward the exit point. This will lead to a less extreme pressure in some agents in the simulation due to spaces available near
exit and also from the obstacle’s position. When each agent wants to avoid the obstacles, the other agent may take the chance
to move towards the exit.
Figure 9. Simulation with 100 agents with obstacles: The
agent in red shows the high-pressure level after avoiding
the obstacles and move towards the exit
Figure 10. Simulation with 80 agents: The agents are some
in red and orange colour as they collide with obstacles, but
not long after it turns into yellow and green as they manage
to pass the obstacles
Figure 11. Simulation with 60 agents: Less number of agent
in yellow colour. The flow become faster as the
agents avoiding the obstacles and get towards the
exit
Figure 12. Simulation with 40 agents: The agent mostly in
green colour and move faster towards the exit while
avoiding the obstacles
Figure 13. Simulation with 20 agents: Some of the agent seems to show the clogging behavior at the beginning of the
evacuation. The flow become less clog when few agents managed to escape while avoiding obstacles
H. SHARBINI ET AL., APPLICATIONS OF MODELLING AND SIMULATION, 3(3), 2019, 135-144
141
4. RESULTS AND DISCUSSION
The results from the two simulations are discussed in terms of the agent movement during evacuation with different sets of
agent’s total number with and without obstacles.
4.1 The Analysis of Agent (Particle) Exit Time Based on 5th Time of Running the Simulation Original SFM (Without
Obstacles)
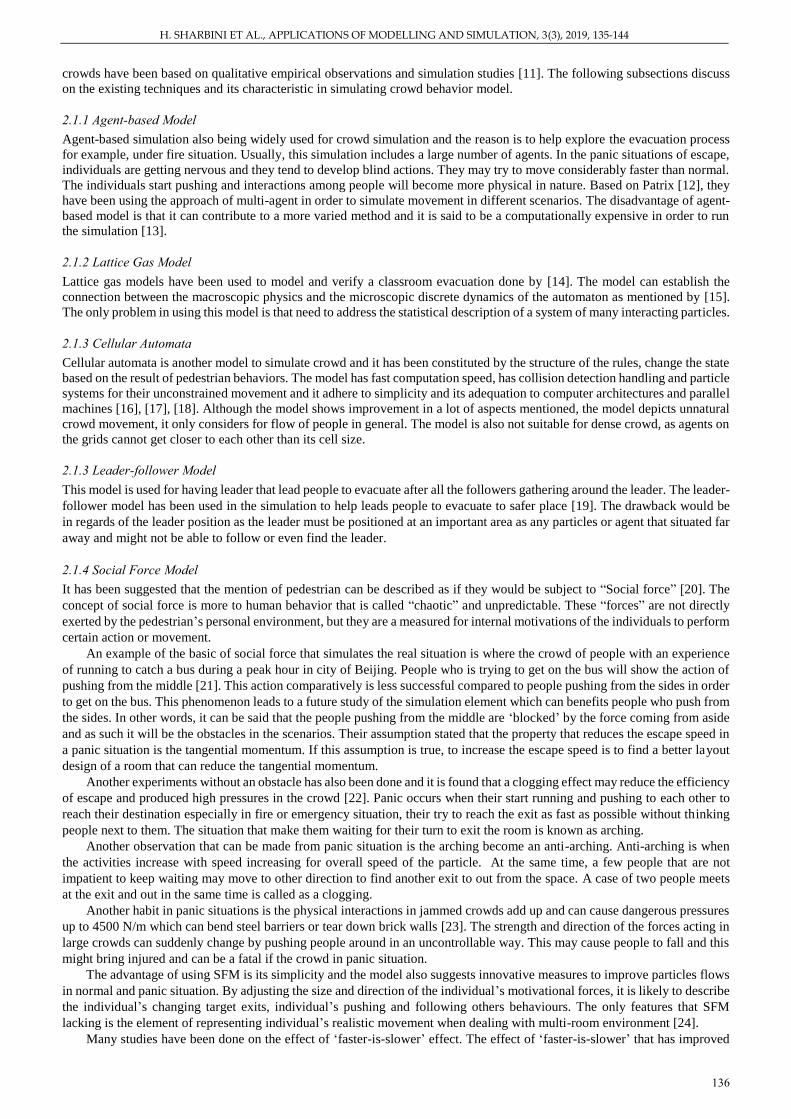
Table 2 shows the time taken for each simulation with the average time calculated for original SFM (without obstacles) during
the evacuation. With five simulations, the average times taken with 20, 40, 60, 80 and 100 agents are 11.1, 18.9, 27.3, 36.8
and 48.7 seconds respectively. Figure 14 gives the visualisation comparison to show the relation between evacuation time
versus the number agents during five running simulation in original SFM (without obstacles).
Table 2. Simulation of original SFM (without obstacles) time analysis
Total no
of agents
Time (s) for each number of simulations Average
time for
evacuation Simulation
1
Simulation
2
Simulation
3
Simulation
4
Simulation
5
100 50 47 49 47 50.7 48.7
80 37 35.4 42.2 34.29 34.97 36.8
60 26 29 24 29.65 27.7 27.3
40 20 18.2 18.25 19.27 18.6 18.9
20 10.5 11.51 11.48 11.08 10.96 11.1
Figure 14. The graph for evacuation time vs number of agents in simulation of original social force model (without
obstacle)
10
.5
20
26
37
50
11
.51 1
8.2
29
35
.4
47
11
.48 1
8.2
5 24
42
.2
49
11
.08
19
.27
29
.65 34
.29
47
10
.96 1
8.6
27
.7
34
.97
50
.7
0
10
20
30
40
50
60
2 0 4 0 6 0 8 0 1 0 0
Evac
uat
ion T
ime
(s)
Number of agents
Simulation 1 Simulation 2 Simulation 3 Simulation 4 Simulation 5
H. SHARBINI ET AL., APPLICATIONS OF MODELLING AND SIMULATION, 3(3), 2019, 135-144
142
4.2 The Analysis of Agent (Particle) Exit Time Based on 5th Time of Running the Simulation with Modified SFM (with
Obstacles)
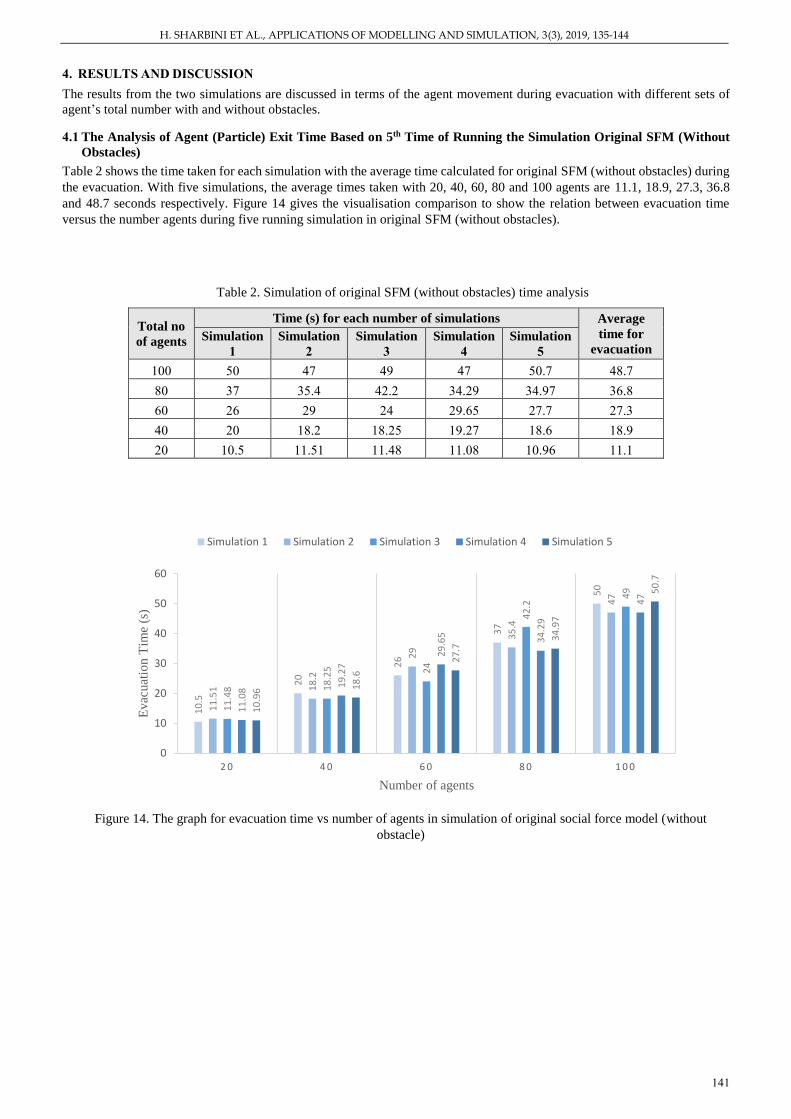
Table 3 shows the time taken for each simulation with the average time calculated of modified social force model (with
obstacles) during the evacuation. The average times taken with 20, 40, 60, 80 and 100 agents are 10.9, 18.5, 26.6, 36.0 and
48.5 seconds respectively. Figure 15 gives the visualisation comparison to show the relation between evacuation time versus
the number agents during five running simulation for modified social force model (with obstacles).
4.3 Average Time and Time Comparison Analysis for Both Scenarios
Figure 16 shows the average time based on the running five-time simulations from both original and modified SFM. In
simulation 1 with 20 agents, it yields simulation of modified SFM with obstacles is 1.8% faster than the original SFM without
obstacles. In simulation with 40, 60 and 80 agents, the results of evacuation time are 1.75%, 2.38% and 2.04% faster
respectively under the modified SFM (with obstacles). For the simulation with 100 agents, it denotes 0.49% time faster during
evacuation in modified SFM with obstacles as compared to the original SFM without obstacles.
The modified SFM which has the obstacles positioned near the exit way resulting in a slightly less evacuation time
compared to the original SFM without obstacles. This result can also be related with the work of Jiang et al. [21] whereby their
simulation corresponds well with the experiment of up to 80 agents in the trend that two obstacles are better than one obstacle
and still better than zero obstacle for the average escape time versus different number of obstacles.
Table 3. Simulation of modified SFM (with obstacles) time analysis
Total no
of agents
Time (s) for each number of simulations Average
time for
evacuation Simulation
1
Simulation
2
Simulation
3
Simulation
4
Simulation
5
100 45.5 45 54 49 49 48.5
80 38 36.75 37.5 35.85 32 36.0
60 29.2 24.75 28 25.95 25.2 26.6
40 20 18.5 17.5 18.5 18.15 18.5
20 11.4 9.71 11.48 11.03 10.92 10.9
Figure 15. The graph for evacuation time vs number of agents in modified social force model (with obstacles)
11
.4
20
29
.2
38
45
.5
9.7
1
18
.5
24
.75
36
.75
45
11
.48 1
7.5
28
37
.5
54
11
.03
18
.5
25
.95
35
.85
49
10
.92 1
8.1
5 25
.2
32
49
0
10
20
30
40
50
60
2 0 4 0 6 0 8 0 1 0 0
Evac
uat
ion T
Imes
(s)
Number of agents
Simulation 1 Simulation 2 Simulation 3 Simulation 4 Simulation 5

H. SHARBINI ET AL., APPLICATIONS OF MODELLING AND SIMULATION, 3(3), 2019, 135-144
143
Figure 16. Time analysis with comparison of original SFM and modified SFM
5. CONCLUSION
Referring to the simulation timing with an obstacle, it can be concluded that the obstacle makes the agents move better than
without obstacles in different settings of total number of agents per simulation. From the observation, when an agent (particle)
hit the obstacle while searching the space to go through to the exit, in the same time it gives a space to the other particle to
move faster to the exit. This concept ‘faster-is-slower’ introduced by Helbing [23] is indeed a significant instant of self-
organised phenomenon in crowd dynamics. To alleviate this phenomenon, there is a need to do a modification and adjustment
such that to assess and observe whether the placement of obstacles can lead to faster evacuation the impact in timely manner
for evacuation process.
In the future, the scenarios of evacuation can be adjusted with other set of parameters i.e. more exit width placing the
obstacles in the optimized position in the room, increase in agent’s total number, and different room layout, adjustment in
number of obstacles, and adjustment to desired velocity in order to have a safer evacuation process [36].
REFERENCES
[1] C. W. Reynolds, Flocks, herds, and schools: A distributed behavioral model, Proceedings of 14th Annual Conference on
Computer Graphics and Interactive Techniques (SIGGRAPH'87), Anaheim, CA, 1987, pp. 25-34.
[2] L. Can, Z. Kejun, G. Haixiang and T. Jian, Simulation research on safe flow rate of bidirectional crowds using Bayesian-
Nash equilibrium, Complexity, 1-15, 2019.
[3] D. Helbing, I. J. Farkas, P. Molnar and T. Vicsek, Simulation of pedestrian crowds in normal and evacuation situations,
Pedestrian and Evacuation Dynamics, 21(2), 21-58, 2002.
[4] W. M. Predtetschenski and A. I. Milinski, Personenstr¨ome in Geb¨auden Berechnungsmethoden fur¨ die Projektierung.
Rudolf Muller, ¨ K¨oln-Braunsfeld, 1971.
[5] X. Song, L. Ma, Y. Ma, C. Yang and H. Ji, Selfishness and selflessness-based models of pedestrian room evacuation,
Physica A: Statistical Mechanics and its Applications, 447, 455-466, 2016.
[6] Y. Han, H. Liu and P. Moore, Extended route choice model based on available evacuation route set and its application
in crowd evacuation simulation, Simulation Modelling Practice and Theory, 75, 1-6, 2017.
[7] A. M. Ibrahim, I. Wenkat and P. D. Wilde, The impact of potential crowd behaviours on emergency evacuation: an
evolutionary game-theoretic approach, Journal of Artificial Societies and Social Simulation, 22(1), 1-3, 2019.
[8] G. Frank and C. Dorso, Room evacuation in the presence of an obstacle, Physica A: Statistical Mechcanics and its
Applications, 390, 2135-2145, 2011.
[9] N. Shiwakoti, M. Sarvi, G. Rose and M. Burd, Animal dynamics-based approach for modeling pedestrian crowd egress
under panic conditions, Transporation Research Part B: Methodological, 45, 438-461, 2011.
[10] D. Helbing, L Buzna, A. Johansson and T. Werner, Self-organized pedestrian crowd dynamics: Experiments, simulations,
and design solutions, Transportation Science, 39(1), 1-24, 2005.
[11] X. Shi, Z. Ye, N. Shiwakoti and O. Grembek, A state-of-the art review on empirical data collection for external governed
pedestrians complex movement, Journal of Advanced Transportation, 1-43, 2018.
[12] J. Patrix, A. I. Mouaddib and S. Gatepaille, Detection of primitive collective behaviours in a crowd panic simulation
based on multi-agent approach, International Journal of Swarm Intelligence Research (IJSIR), 3(3), 50-65, 2012.
20 40 60 80 100
SFM(without obstacles) 11.11 18.86 27.27 36.77 48.74
MSFM (with obstacles) 10.91 18.53 26.62 36.02 48.50
11.11
18.86
27.27
36.77
48.74
10.91
18.53
26.62
36.02
48.50
0.00
5.00
10.00
15.00
20.00
25.00
30.00
35.00
40.00
45.00
50.00
Ave
rage
Eva
cuat
ion
Tim
e (s
)
Number of agents
SFM(without obstacles)
MSFM (with obstacles)
H. SHARBINI ET AL., APPLICATIONS OF MODELLING AND SIMULATION, 3(3), 2019, 135-144
144
[13] M. C. Toyama, A. L. C. Bazzan, and R. da Silva, An agent-based simulation of pedestrian dynamics: from lane formation
to auditorium evacuation, Proceedings of 5th International Joint Conference on Autonomous Agents and Multiagent
Systems (AAMAS 2006), Honolulu, 2006, pp. 108-110.
[14] T. Werner and D. Helbing, The social force pedestrian model applied to real life scenarios, Proceedings of 2nd
International Conference on Pedestrians and Evacuation Dynamics, Greenwich, 2003, pp. 17–26.
[15] B. Chopard, Cellular automata and lattice Boltzmann modeling of physical systems, in: Handbook of Natural Computing,
G. Rozenberg, T. Bäck and J. N. Kok, Eds. Berlin: Springer, 2012, pp. 287-331.
[16] D. Zhao, Y. Lizhong and J. Li, Exit dynamics of occupant evacuation in an emergency, Physica A: Statistical Mechanics
and its Applications, 363(2), 501-511, 2006.
[17] S. Liu, L. Yang, T. Fang and J. Li, Evacuation from a classroom considering the occupant density around exits, Physica
A: Statistical Mechanics and its Applications, 388(9), 1921-1928, 2009.
[18] A. Ferscha and K. Zia, Lifebelt: Silent directional guidance for crowd evacuation, International Symposium on Wearable
Computers (ISWC’09), Linz, Austria, 2009, pp.19-26.
[19] H. Dong, X. Gao, T. Gao, X. Sun and Q. Wang, Crowd evacuation optimization by leader-follower model, IFAC
Proceedings Volumes, 47(3), 12116-12121, 2014.
[20] D. Helbing and P. Molnar, Social force model for pedestrian dynamics, Physical Review E, 51(5), 4282-4286, 1995.
[21] L. Jiang, J. Li, C. Shen, S. Yang and Z. Han, Obstacle optimization for panic flow–reducing the tangential momentum
increases the escape speed, PloS One, 9(12), e115463, 2014.
[22] I. Zuriguel, et. al., Clogging transition of many-particle systems flowing through bottlenecks, Scientific Reports, 4(1),
2014, doi:10.1038/srep07324.
[23] D. Helbing, Social Self-Organization: Agent-Based Simulations and Experiments to Study Emergent Social Behavior,
Berlin: Springer-Verlag, 2012.
[24] N. Khamis, H. Selamat, R, Yusof and F. S. Ismail, Magnetic force model approach with path finding feature for an
improved crowd movement simulation, Proceedings of 2017 Asian Simulation Conference (AsiaSim 2017), Melaka,
2017, pp. 157–168.
[25] A. Garcimartín, I. Zuriguel, J. M. Pastor, C. Martín-Gómez and D. R. Parisi, Experimental evidence of the “faster is
slower” effect, Transportation Research Procedia, 2, 760-767, 2014.
[26] I. M. Sticco, F. E. Cornes, G. A. Frank and C. O. Dorso, Beyond the faster-is-slower effect, Physical Review E, 96(5),
052303, 2017.
[27] H. Oh and J. Park, Main factor causing “faster-is-slower” phenomenon during evacuation: rodent experiment and
simulation, Scientific Reports, 7(1), 13724, 2017.
[28] J. M. Chen, P. Lin, F. Y. Wu, D. L. Gao and G. Y. Wang, Revisit the faster-is-slower effect for an exit at a corner, Journal
of Statistical Mechanics: Theory and Experiment, 2018(2), 023404, 2018.
[29] Y. C. Zhang, J. Ma, Y. L. Si, T. Ran, F. Y. Wu, G.Y. Wang and P. Lin, Required width of exit to avoid the faster-is-
slower effect in highly competitive evacuation, Chinese Physics B, 26, 084504, 2017.
[30] I. Hassan, Effective heuristics for ant colony optimization to handle large-scale problems, Swarm and Evolutionary
Computation, 32, 2140-149, 2017.
[31] M. Haghani and M. Sarvi, Simulating pedestrian flow through narrow exits, Physics Letters A, 383(2-3), 110-120, 2019.
[32] B. D. Dubois and B. M. Wiley, Modeling of Crowd Behavior: The Creation of a Program to Predict the Movements of
Individuals within a Crowd(rep), Worcester Polytechnic Institute, Retrieved from https://web.wpi.edu/Pubs/E-
project/Available/E-project-042308-141558/unrestricted/ModelingofCrowdBehavior.doc., 2008.
[33] F. E. Cornes, G. A. Frank and C. O. Dorso, Panic contagion and the evacuation dynamics, ArXiv.org,
arxiv.org/abs/1805.06573, 2018.
[34] D. Helbing, I. J. Farkas and T. Vicsek, Simulating dynamical features of escape panic, Nature, 407, 487-490, 2000.
[35] A. Trivedi and S. Rao, Agent-based modeling of emergency evacuations considering human panic behavior, IEEE
Transactions on Computational Social Systems, 5(1), 277–288, 2018.
[36] Y. Zhao, M. Li, X. Lu, L. Tian, Z. Yu, K. Huang, Y. Wang and T. Li, Optimal layout design of obstacles for panic
evacuation using differential evolution, Physica A: Statistical Mechanics and its Applications, 465, 175–194, 2017.