an alternate middle mile fiber feasibility study · firstmile.us an alternate middle mile fiber...
TRANSCRIPT

An Alternate Middle Mile Fiber Feasibility Study
Prepared for
County of Humboldt in partnership with the
Redwood Coast Rural Action Committee Redwood Region Economic Development
Commission Redwood Technology Consortium
Prepared by FirstMile.US
www.FirstMile.US
June 20, 2006

FirstMile.US An Alternate Middle Mile Fiber Feasibility Study
Page 2
Copyright 2006, FirstMile.US, All Rights Reserved

FirstMile.US An Alternate Middle Mile Fiber Feasibility Study
Page 3
Table of Contents
1. EXECUTIVE SUMMARY 5
2. INTRODUCTION 7
2.1 PROCESS OVERVIEW 7
3. THE MIDDLE MILE 8
3.1 PROPOSED ROUTE 9 3.1.1 CHOICE OF ROUTE 9 3.1.2 CHOICE OF INSTALLATION METHODOLOGY 9 3.1.3 CHOICE OF TERMINATION POINTS 10 3.2 POTENTIAL OBSTACLES 12 3.2.1 FEES 12 3.2.2 PUBLIC UTILITY AND PERMITTING PROCESS 12
4. POTENTIAL ANCHOR TENANTS AND HIGH VOLUME USERS 14
4.1 ANCHOR TENANTS 14 4.2 HIGH VOLUME USERS 15 4.2.1 VERTICAL MARKETS IN HUMBOLDT 15 4.2.2 HOW BUYERS BUY 16
5. OWNERSHIP MODEL 18
5.1 RECOMMENDED MODEL 18 5.2 PROCESS 19
6. FINANCIAL MODEL 20
6.1 EXPENSES 20 6.1.1 AERIAL BUILD 21 6.1.2 BURIED BUILD 23 6.3 REVENUE 25 6.4 FINANCING 26
7. SERVICE PROVISIONING MODELS 28
7.1 RECOMMENDED MODEL 28 7.2 PROCESS 28

FirstMile.US An Alternate Middle Mile Fiber Feasibility Study
Page 4
8. IMPLEMENTATION PROJECT PLAN 29
9. ACKNOWLEDGEMENTS 30
APPENDICES 31
APPENDIX A. STUDY PARTICIPANTS 32 APPENDIX B. INTRODUCTION TO MUNI PEERING POINTS 34 APPENDIX C. SAMPLE BUSINESS PLAN TABLE OF CONTENTS 36 APPENDIX D. IMPLEMENTATION RESOURCES 37 D. 1 ENVIRONMENTAL CONSULTANTS 37 D.2 CONTRACTORS 37 APPENDIX E. CALTRANS TELECOMMUNICATIONS INFORMATION 38 APPENDIX F. PACIFIC GAS AND ELECTRIC FEE SCHEDULE 40 APPENDIX G. HUMBOLDT COUNTY STATISTICS 44 APPENDIX H. CPUC AND CEQA INFORMATION AND LINKS 47 APPENDIX I. RFP RESOURCES FROM COMPUMENTOR 49 APPENDIX J. BREAKEVEN FINANCIAL CHARTS 50 APPENDIX K. LEVEL 3 SERVICES BROCHURES 52

FirstMile.US An Alternate Middle Mile Fiber Feasibility Study
Page 5
An Alternate Middle Mile Fiber for Humboldt County
1. Executive Summary Broadband connectivity is being called the single most important infrastructure that enables economic and community growth in the new millennium. Yet rural communities such as ours often have meager or no high speed connections, resulting in fewer jobs, poor government services, lack of access to quality medical care, poorer educational opportunities and lackluster quality of life.
Chris Crawford, Times-Standard, April 4, 2006 The Redwood Coast Rural Action (RCRA) Working Group requested the development of a study for building a redundant fiber route into Humboldt County and for obtaining services via the installed infrastructure. This request included researching, analyzing, and recommending ownership, financing, and operational models. The study will be a tool for the Working Group on Universal Regional Connectivity which is utilizing an iterative process to investigate communications options for the region. This study is a result of that request. The middle mile fiber route proposed follows Highway 299, beginning in Eureka and ending in Redding. Section 3 of the report has more detail. We have provided two different build options – one for an aerial route using PG&E existing right-of-way and the other using a direct burial technique on Highway 299. Each option has its pros and cons. Further investigation into funding availability and user desires will help determine which option is optimal for construction, although financially the aerial route appears more attractive. In the proposed middle mile structure, the anchor tenants are comprised of communication companies and companies that need large amounts of network resources for customer service and internal management purposes. Communications companies are also commonly called carriers in the industry. Carriers in the area who are likely users include: AT&T, CENIC, Frontier Communications, Level 3, PG&E, Sudden Link and Verizon. They buy conditioned circuits or dark fiber or something in between, depending on their requirements. They will generally interconnect via the AT&T or Level 3 intersecting fibers to traverse additional networks to their chosen point of termination. To make it simple to understand, we have entitled the ownership structure “Neworg” short for new organization. We are recommending that the ownership of Neworg be a privately-held, for-profit C corporation with a focus on selling fiber services to communications companies (carriers) in the region including telephone companies, cable companies, wireless companies, Internet companies and cellular companies. In general, the aerial build option appears to be the most cost effective over time and, as such, creates a good opportunity to provide a realistic return on investment (ROI) for investors. Over ten years, the aerial cost of building and operating the fiber is approximately $11M. The same route for the buried fiber build and operations is approximately $24M. In order to determine the minimum revenue streams needed for the project to provide either a 5 year or 10 year ROI, we looked at expected expenses balanced against annual sales. The most interesting outcome of this revenue model is that it seems reasonable to assume a 5 year ROI for

FirstMile.US An Alternate Middle Mile Fiber Feasibility Study
Page 6
the aerial fiber build. We found that an affordable annual lease fee per fiber can be charged. Utilizing the 10 year ROI model, the annual lease fee could be even less, giving Neworg market flexibility for sales pricing and profit potential. Because we are recommending a privately-held, for-profit company, we recommend that investment capital should be raised to cover the initial build of the fiber. This will build confidence with carrier companies who will be purchasing fiber services. In the startup period, the monthly income generated by selling access to the fiber should be set such that ongoing expenses are covered and a repair and replacement reserve is funded.

FirstMile.US An Alternate Middle Mile Fiber Feasibility Study
Page 7
2. Introduction Place is peace and quiet, clean air, and fishable streams. It’s the kind of town in which you want to raise your kids. It’s a lower cost of living and three times the house for the same dollars. It’s a sane pace of life, a walkable community, lower taxes, and a better business climate. It’s what you and I treasure about the rural way of life. Now by this point, someone may be wondering what Place has to do with broadband and the information economy. The answer is, everything. The computer and broadband are producing nothing less than the greatest decentralization of information since the invention of the printing press. In a knowledge-based economy, that levels the playing field. It opens the door to everything else. To put it bluntly, the moment small towns and rural areas once again become economically competitive, people will vote with their feet.
Thomas Dorr, USDA Under Secretary for Rural Development
The Redwood Coast Rural Action (RCRA) Working Group requested the development of a study for building a redundant fiber route into Humboldt County and for obtaining services via the installed infrastructure. This includes researching, analyzing, and recommending ownership, financing, and operational models. The study will be a tool for the Working Group on Universal Regional Connectivity which is utilizing an iterative process to investigate communications options for the region. The new middle mile infrastructure will not only ultimately significantly improve the quality of communications into and out of the region, but it will cement the foundation for sustainable economic development and growth. All communities in the region will directly benefit from the program -- from schools, hospitals, businesses, and residences to municipal organizations and agencies.
2.1 Process Overview The work plan focused on a two-pronged approach. The first task engaged the community through a series of group and individual meetings, both in person and on the phone. These sessions focused on the key stakeholders and anchor tenants in order to assure that the models and recommendations “fit” the community. The participants are listed in the meetings are listed in Appendix A. The second task utilized computer models, research abilities and market-knowledge of the team to provide a complete, sensible set of models and recommendations. The report is organized by topic beginning with a general overview of the recommended routes and structures needed. A discussion of who comprises anchor tenants and high volume users follows, with an emphasis on typical buying patterns in the region. The ownership model is covered in detail followed by a discussion of the expected financial model. We conclude with a discussion about service provisioning and a high-level implementation project plan.

FirstMile.US An Alternate Middle Mile Fiber Feasibility Study
Page 8
3. The Middle Mile As its name suggests, middle mile facilities provide relatively fast, large-capacity connections between backbone and last mile. Middle mile facilities can range from a few miles to a few hundred miles. They are often constructed of fiber optic lines, but microwave and satellite links can be used as well.
Federal Communications Commission definition of the middle mile Humboldt County is isolated. Located in the beautiful North Coast region of California and named by the USDA as America’s Most Scenic Rural County, Humboldt County is a place of grandeur. But its isolated location also creates infrastructure problems particularly for communications into and out of the county. Business continuity and disaster recovery should mean something to Humboldt County residents. As residents experienced this year, Mother Nature can be unforgiving. With its heavy rain and snow damage, mudslides, earthquakes and as a known target for tidal waves, Humboldt County must find a way to accommodate its residents and visitors with resources for both everyday and emergency communications. As business and government become increasingly dependent on the Internet and other data connectivity for day-to-day business, it becomes essential to have a solid, reliable, scalable communications infrastructure into the county. Redundancy is the one important way to gain reliability and solidity. A region’s public and private technology infrastructure attracts the high-tech companies that create jobs. In turn, these companies contribute still more communications, health, education, transportation and research infrastructure.1 The alternate middle mile fiber provides an essential piece of the “hard’ infrastructure that companies require when considering location. Consider the impact of fiber infrastructure on Grant County, WA, where Microsoft is building a large data center and The Dalles, Oregon, where Google is building a large data center expected to employ 50-100 people. The availability and reliability of the communications infrastructure was one of the key decision factors for choosing these locations. Half of all adult Americans who live in non-rural areas can get online with a fast connection at home or work. By contrast, just more than one-third of rural Americans can do this.2 A recent Pew report concluded that three demographic factors are behind this difference: 1) rural America has a greater share of older Americans, 2) more rural Americans fall in the lower end of the nation’s income distribution and 3) rural Americans are, on average, less educated. That brings us to the alternate middle mile that was studied for this report. Providing an alternate route benefits the County and region by locating interconnection points in underserved areas such as Blue Lake, Willow Creek and Weaverville making it easier for industry and individuals to access the wealth of resources available online. The middle mile fiber can be the catalyst for new educational and economic opportunities in the region. In the RFP, it stated “All telecom vendors in Humboldt County, including Frontier, Cox, Almega, Starstream, and Verizon, are dependent upon SBC’s single fiber route in/out of the 1 From “What is Technology-Based Development” 2 Pew Internet & American Life Project, Rural Broadband Internet Use
FirstMile.US An Alternate Middle Mile Fiber Feasibility Study
Page 9
county. Where available, access costs are high for many residential customers and some commercial customers due to lack of competition.” AT&T (SBC’s new name) stated at the 2006 Broadband Forum that their fiber has had numerous close calls or near misses. It is time for the community to grasp the importance of data connectivity as an essential infrastructure that keeps organizations open be they government, schools, hospitals or small businesses. It is also time to provide a catalyst for affordable broadband access in Humboldt and the region. It is time for an alternate middle mile path.
3.1 Proposed Route The route proposed follows Highway 299, beginning in Eureka and ending in Redding. We have provided two different build options – one for an aerial route using PG&E existing right-of-way and the other using a direct burial technique on Highway 299. Each option has its pros and cons. Further investigation into funding availability and user desires will help determine which option is optimal for construction.
3.1.1 Choice of Route The route chosen, Highway 299 from Eureka to Redding, is the same route that CENIC3 chose as ‘most desirable’ in 2004. The major advantages are that the route:
Travels a completely redundant path from the current AT&T fiber which runs south from Eureka to Santa Rosa
Provides an opportunity to connect other cities on path including Blue Lake, Willow Creek and Weaverville
Intersects with multiple commercial fiber carriers to maximize opportunities for customer interconnect points and redundancy through the creation of fiber rings
Provides the most desirable alternative redundant route to communications companies Other routes were investigated and discarded because they had less revenue potential and greater distances. In most cases, the geology along those routes made construction costs completely unpredictable. Another option that was considered but ruled out involves laying fiber in the PG&E natural gas pipe which runs between Eureka and Red Bluff. Large feeder pipes like this one are cleaned by a plug technique called a PIG. The PIG plug is forced through the pipe. As a result, fiber cannot be installed since it would be “eaten” by the PIG.
3.1.2 Choice of Installation Methodology Two different methods of installing the fiber were studied – one involves aerial fiber and the other involves buried fiber. Both routes travel east/west along the 299 corridor between Eureka and Redding. We priced both options so to provide a clear understanding of the tradeoffs
3 CENIC is the Corporation for Education Network Initiatives in California and operates education networking in the state.
FirstMile.US An Alternate Middle Mile Fiber Feasibility Study
Page 10
between the two types of builds and to give the community a choice of how to proceed based on these tradeoffs. Tradeoffs that should be considered include:
Potential customer preferences Cost to install Cost to operate Ease of adding connection points in small cities on the route Building time Permitting time and costs Cost of right of way Time to repair and cost of repair Probability of failure due to Acts of God or other natural phenomenon (fire, flood, slide,
etc.) The first installation choice utilizes aerial fiber via PG&E power poles that run power transmission lines between Arcata and Redding. Each of the ends of the fiber build will likely be buried fiber, utilizing existing conduits in Humboldt County and Redding, so this build is essentially a dual aerial and buried build. The second installation choice buries the fiber on Route 299. Because of the geology of Route 299, the financial information included in this study is an approximation. Detailed engineering studies need to be conducted on the highway to refine the burial requirements, especially in the areas where there is rock and where there are known slides.
3.1.3 Choice of Termination Points When installing a middle mile fiber like the one studied, one of the most important criterions to consider is the location of the termination points of the fiber – that is where does the fiber begin and end? The fiber must begin and end in places where it is easy, safe and secure for the proposed customers to interconnect. Interconnection points need to be in a communications facility where nominal features like backup power, fire suppression and secure, possibly guarded access are available. In addition, the interconnection points need to be close to where others have terminated their fiber or other communication connections to make it easy for them to get from their locations to the interconnection point. Based on these considerations, we are recommending that Eureka be chosen as the western terminating point of the fiber since most of the carriers that we believe might be customers have easy access into this area. In addition, we are recommending that a collocation facility be built in Eureka for encouraging this access. Colocation facilities, as described below, are data centers where carriers can install equipment and make direct connections to simplify interconnection. At the collocation point, the community should contemplate the implementation of a local peering point, a place where local data can be exchanged without leaving the area. There are many advantages to a local peering point, the strongest is that in the event of a disaster, the community would still be able to communicate with each other, even if all outside paths were

FirstMile.US An Alternate Middle Mile Fiber Feasibility Study
Page 11
down. More information about local peering points and their advantages is included in Appendix B. We are recommending that the Redding termination be placed in the Level 3 colocation facility that currently exists. This will make it easy for fiber customers to interconnect to the rest of the country. Section 4 of this report discusses customer interconnect points in more detail.
What is a Colocation Point? From Wikipedia at http://en.wikipedia.org/wiki/Colocation A colocation centre ("colo") or carrier hotel is a type of data center where multiple telecommunications network or service providers, such as telcos or internet service providers, site their connections to one another's networks (points of presence) and where users of these services can interconnect to the service provider(s) with a minimum of cost and complexity. Increasingly organizations are recognizing the benefits of colocating their mission-critical equipment -- including networking gear, servers and storage devices -- within a data centre. Colocation is becoming popular because of the time and cost savings a company can realize as result of using shared data centre infrastructure. With IT and communications facilities in safe, secure hands, telecommunications, internet, ASP and content providers, as well as enterprises, enjoy less latency and the freedom to focus on their core business. Additionally, customers reduce their traffic back-haul costs and free up their internal networks for other uses. Moreover, by outsourcing network traffic to a colocation service provider with greater bandwidth capacity, web site access speeds should improve considerably. Most colocation centres offer different types of services to customers ranging from dedicated suites/rooms or cages to smaller racks or partial racks. Some colocation centres also offer some degree of SLAs (service level agreements) to support a wide range of computer and network related services, for example server reboots, hardware replacements, software updates etc. Some colocation centres feature a "meet-me-room" where the different carriers housed in the centre can efficiently exchange data. Most peering points sit in colocation centres.
Most colocation centres have high levels of physical security and multiple redundant power and humidity / air-conditioning systems.
A typical Colocation centre setup would consist of the following hardware and services:
Building: o Usually built near a GlassFibre ring. o Fibre has multiple access points into building to prevent back hoe cuts. o Guarded 24/7 and secured with closed circuit cameras. o "Clean" rooms to ensure optimal running conditions for computer and network hardware. o Empty pipe fire suppression of some sort. o Relay racks, cabinets or cages to mount servers into.
Power:
o Connected to two or more different power stations/grids. o Inline power backup using a system of UPS batteries (often with a diesel standby generator). o Possibility to connect two different grids of power distribution to one server.
Connections:
o Because of the high concentration of servers inside a colocation centre most carriers will be interested in bringing direct connections to such buildings.
o In most cases there will be a larger Internet-Exchange hosted inside a colocation centre, on which customers can connect for peering.

FirstMile.US An Alternate Middle Mile Fiber Feasibility Study
Page 12
3.2 Potential Obstacles This section discusses a number of potential obstacles including annual fees and the public utility permitting process.
3.2.1 Fees Since there is no statute that requires CalTrans to charge these fees, nor any clear scale to on which to base the amount of the fees, this policy seems obstructionist to economic development and technological advancement. Given the tax revenue that would be generated from economic expansion in the region once the redundant line is in place, it is also counterproductive and, I would think, counter to our current Governor’s vision for the state.
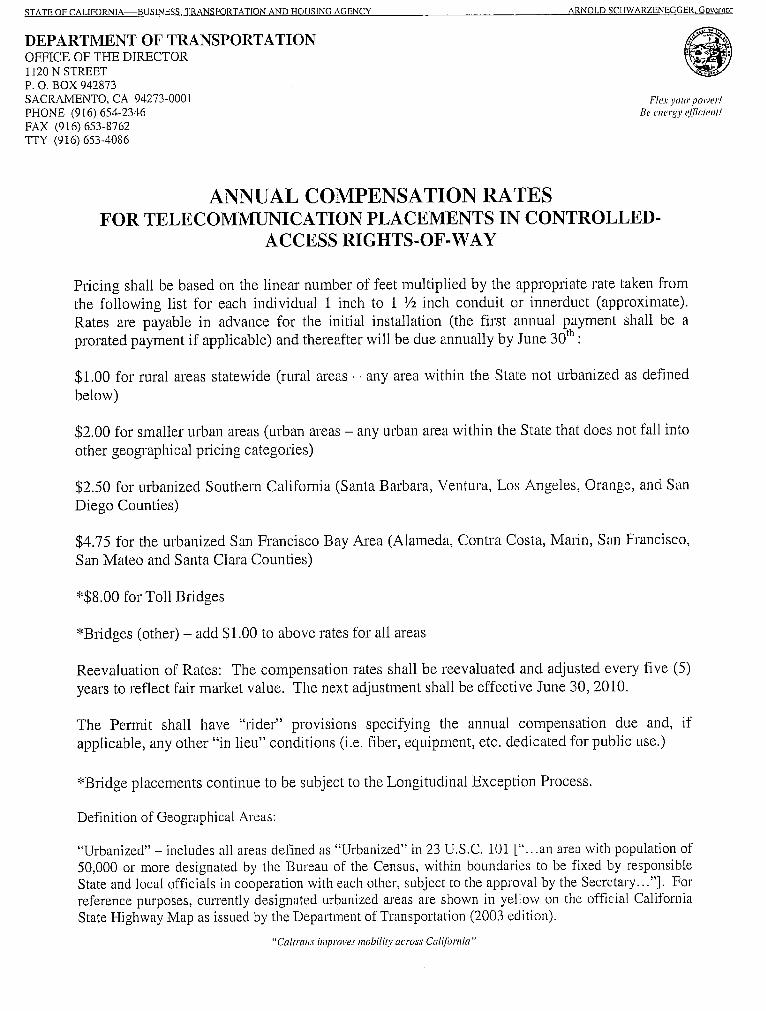
Bob Morse, Talking Tech Blog Recurring fees that have a significant impact on the operations of this fiber. The proposed aerial build uses existing PG&E poles and as such PG&E charges annual pole attachment fees, which are not significant. The proposed direct burial build utilizes State Highway 299 and thus is subject to Caltrans right of way fees. These fees certainly have a significant impact on the operational costs for the direct burial build. Full cost impact is discussed in Section 6 of this report. While we have not received definitive costs from PG&E, we believe their recurring fees of will amount to $27K annually based on the figures in Appendix F. The estimates were validated with other California-based utility companies. PG&E is working on an estimate that will be provided directly to Humboldt and should be incorporated in the business plan. They are interested in utilizing the fiber once built. Caltrans, the California Department of Transportation, considers proposals to install communication lines in controlled-access right of way (freeways, expressways and bridges.) The route chosen, State Highway 299, is varied between controlled access and conventional roadway. Controlled access roadway is subject to right of way fees based on geographical location, length of placement, and the number of conduits installed. Current estimates for the direct buried fiber build indicate that approximately 40 miles (211,200 feet) of the installation will be in controlled-access right of way. Current Caltrans charges are $1.00 per foot per year for rural areas statewide which will result in a $211,200 annual fee for the direct burial build option.
3.2.2 Public Utility and Permitting Process There are two things to consider when dealing with the installation of the new fiber: California Public Utility Commission (CPUC) licensing and California Environmental Quality Act (CEQA) compliance. Both have an impact on the time to build and the cost associated with the build. The CPUC manages a process for communications companies to obtain a Certificate of Public Convenience and Necessity (CPCN) to become a Competitive Local Carrier (CLC)4. Based on conversations with the CPUC, the new fiber company would be considered to be a public utility since it will be selling/leasing services to companies that are public utilities (e.g. phone companies.) It is recommended that the during the business plan process this be further investigated with the CPUC, since the plan proposed herein falls into a grey area within the 4 The communications trade commonly refers to CLCs as CLECs (pronounced see-leck), Competitive Local Exchange Carriers. However, the CPUC utilizes the term CLC in its official processes, rather than CLEC.
FirstMile.US An Alternate Middle Mile Fiber Feasibility Study
Page 13
CPUC. Generally, the CPUC almost never fails to grant authority to become a CLC but the process will take about 3 months and should be done in advance of construction. The business planners should send a written description of the final plan to the CPUC and get a ruling regarding its need for CLC status. In addition, we suggest that the business planners consult with the prospective customers to understand specific requirements for interconnection to the new fiber. It may be easier for them to interconnect to a company with CLC status. Links for contacts and detailed information are included in Appendix H. If the new fiber company becomes a CLC, the CPUC will also manage the California Environmental Quality Act (CEQA) compliance for the fiber build. CEQA is a statute that requires state and local agencies to identify the significant environmental impacts of their actions and to avoid or mitigate those impacts, if feasible. This process can take years depending upon how quickly everyone signs off. The CEQA process will take the longest and cost the most for the direct burial fiber build. A conservative minimum estimate for processing time and cost is 11 months and $300,000. If everything goes well and the initial application is perfect, which rarely happens, it is possible to get an 11 month turnaround. The process takes a long time due to bureaucracy. The CPUC is obligated to hire an outside consultant to do a review which means a public bid process taking 3-4 months. There are also mandated public review periods -- 45 days for public review of the consultant’s report and then another possible 30 days for a commission proposed decision comment period. The aerial fiber build utilizing the PG&E transmission poles would be easier. The concern of CEQA is primarily ground-oriented environmental impact which would be minimal in this case. Estimates are that this study would be inexpensive and take about a month for processing. Currently, the CPUC is trying to make communications cable installation on existing poles CEQA exempt. This would eliminate the CEQA requirement entirely for the aerial build. Other local permitting may be required and we recommend that the business planner further investigate these and other unidentified legal requirements and costs.

FirstMile.US An Alternate Middle Mile Fiber Feasibility Study
Page 14
4. Potential Anchor Tenants and High Volume Users With only one fiber route into and out of Humboldt County, we are only a backhoe, tree fall, or landslide away from being cut off. The SBC microwave system that used to serve as our only link to the outside world is not adequate for the volume of traffic the fiber now carries - both voice and data. A redundant fiber route could be a "failover" in case of damage to the current fiber.
Tina Nerat, Times Standard, October 10, 2005
This section discusses anchor tenants who are the expected major purchasers of middle mile services. Additionally, high volume users are discussed including communications users who have a high need to purchase connectivity outside of the Humboldt County area.
4.1 Anchor Tenants In the proposed middle mile structure, the anchor tenants are comprised of communication companies and companies that need large amounts of network resources for internal management purposes. Communications companies are also commonly called carriers in the industry. They buy conditioned circuits or dark fiber or something in between, depending on their requirements. They will generally interconnect via the AT&T or Level 3 intersecting fibers to traverse additional networks to their chosen point of termination. Figure 1 below shows how the interconnections help form rings that provide redundancy into and out of Humboldt County.
Figure 1. Carriers in the Redwood Region will connect to the Eureka colocation point to utilize the new fiber. They can then interconnect to a variety of north/south options for traversing to the rest of the nation’s fiber networks.

FirstMile.US An Alternate Middle Mile Fiber Feasibility Study
Page 15
We estimate that 10 fibers can be initially sold to carriers as backup or new links. Carrier’s needs for the type of fiber configuration and the hardware needed to provide the configure may vary and needs to be included when looking at operational expenses and sales income. Depending on price and performance, we expect that reasonable growth in the 5-10% range will occur on an annual basis. The list of carriers in the area who are likely users includes:
AT&T CENIC Frontier Communications Level 3 PG&E Sudden Link Verizon
4.2 High Volume Users As part of the study, we talked to regional users of communications services to determine their future needs as well as to figure out the buying patterns both within and outside of the county. Except for the communications carriers as discussed earlier, it is likely that high volume users will be purchasing their connectivity directly from the carriers as opposed to directly from Neworg. The carriers serving the high volume users will purchase fiber access from Neworg to meet their customers’ needs.
4.2.1 Vertical Markets in Humboldt We have broken out the vertical markets (those that are oriented to one particular specialty) in Humboldt County into seven different areas. These areas were determined after interviews as well as researching general Humboldt business data. In particular, we noted segments that seem to have a great need to communicate outside the Humboldt area. The vertical markets and their core buyers include:
Communications Companies o Sudden Link, Frontier, Verizon (Northwest, California, Cellular), Almega, US
Cellular, Edge, Sprint Education
o Humboldt State University, College of the Redwoods, County Office of Education
Healthcare o St. Joseph’s Hospital, Open Door Clinics, Telehealth Center, Mad River
Community Hospital, United Indian Health Services, Southern Humboldt Community Healthcare District, Redwood Rural Health Center
County and City Governments o Eureka, Fortuna, Ferndale, Arcata, Fortuna, Blue Lake, Trinidad, Rio Dell
State Government o State Parks, Department of Fish & Game, CDF, CHP, Caltrans

FirstMile.US An Alternate Middle Mile Fiber Feasibility Study
Copyright 2006 FirstMile.US All Rights Reserved Page 16
Federal Government o National Park Service, National Weather Service, Coast Guard, National Forest,
Postal Service, Port, Homeland Security, Army Corps of Engineers, BLM, Fish & Wildlife Service
Industry o Manufacturing (e.g. Humboldt Creamery) o Services (e.g. Humboldt Merchant Services, Security National, ISPs) o Tourism, Media (e.g. Newspapers, TV and Radio)
Figure 2. Humboldt Creamery is one example of an industry that needs data communications to communicate with its statewide facilities.
4.2.2 How Buyers Buy Humboldt County and the surrounding areas are comprised of a unique set of users who are likely to purchase their services under bulk contacts. Generally, federal, state and local government offices are mandated or eligible to purchase communications services via a large contract. For example, the state government must buy communications services via the CALNET contract. Municipalities and schools are not mandated to purchase via this same contract but are eligible for its reduced pricing. This means that many of the inbound and outbound circuits in Humboldt County are using AT&T services, the awardee of the current CALNET contract with the State of California. The State of California is currently undergoing a rebid of the CALNET contract. According to Ron Kaplan, research manager of IDC's IP VPN Research, "This RFP is important because it represents an enormous five-year, $1.5 billion contract for telecommunications services and because it contains significant requirements for transitioning state telecommunications services to converged IP delivery and to broadband wireless access facilities." The award of the CALNET II contracts for telecommunications and network services is targeted for October 2006. Instead of

FirstMile.US An Alternate Middle Mile Fiber Feasibility Study
Copyright 2006 FirstMile.US All Rights Reserved Page 17
bidding on a single bundled contract, CALNET II has been split into four separate modules. The modules are:
• Core services (local voice and statewide data) • Long distance voice • Internet Protocol services • Broadband fixed wireless access
CALNET II, at a value of up to $2.1 billion if all extensions are exercised, stands to be one of the largest contracts in the state's history and is meant to serve the state's telecommunications needs through 2012.
Contract purchasing also holds true for federal agencies and other regional/national organizations. Generally, an agency will purchase from a bulk contract under a central budget authority, which mandates a particular carrier for services. Public educational institutions in Humboldt County purchase their middle mile services from CENIC, a non-profit focused on developing, deploying and operating leading-edge network-based services for the research and education community. The California State University System and the California Community College System direct their wide area network needs and budgets to CENIC for the provisioning of communications infrastructure. The K-12 High Speed Network (K12HSN) is a state program which provides network connectivity, Internet services, teaching and learning application coordination, and videoconferencing coordination and support for California’s K-12 community. K12HSN provides for K-12’s participation in CENIC’s network, generally connecting the local County Office of Education (i.e. Humboldt County Office of Education.) Industry may have different buying patterns, but in many cases, will have a preferred provider for out-of-county services generally chosen through a competitive bidding process. Until recently, these included Sprint, MCI and AT&T. With the recent merger of AT&T with SBC and MCI with Verizon, buying will be consolidated. There is another consideration for buyers of broadband services. A number of groups in Humboldt County are eligible for special funds that subsidize a portion of their connectivity. Healthcare, education and library groups are eligible for both federal and state subsidy programs through the Universal Service Fund and the California Teleconnect Fund. Their communications provider is responsible for filing for the subsidies and rebating these users and must be certified by the federal and state government.
FirstMile.US An Alternate Middle Mile Fiber Feasibility Study
Copyright 2006 FirstMile.US All Rights Reserved Page 18
5. Ownership Model In the 21st century, connectivity is our basic infrastructure. The more you have -- the more speed, the more access across all sorts of boundaries -- the greater your access to the world. And the greater your access to the world -- the more connectivity you have -- the more wealth you can create and accumulate. Let me summarize this in a way you might understand:
Guns defined the 17th century, colonization. Ships defined the 18th century, trade. Canals and railroads defined the 19th century, industrialization. Roads defined the 20th century, mass production. Connectivity will define the 21st century, information.
Dana Blankenhorn, www.danablankenhorn.com
To make it simple to understand, we have entitled the ownership structure “Neworg”, short for new organization. We are recommending that the ownership of Neworg be a privately-held, for-profit C corporation with a focus on selling fiber services to communications companies (carriers) in the region including telephone companies, cable companies, wireless companies, Internet companies and cellular companies.
5.1 Recommended Model The ownership model we are recommending is based on a number of criteria that came to light during the study. While talking with residents of Humboldt County and with potential purchasers of service on this new fiber, it became clear that Neworg needed to encompass the following characteristics to be successful:
Solid financial status Technical and operational credentials in the communications technology area Deep, long-term commitment to the economic vitality of the region Clear understanding of the communication needs of the region Entrepreneurial creativity backed with solid business skills Avoidance of decision-by-committee structures No government ownership or operation
In the end, we are recommending a new privately-held, C corporation be formed to run Neworg. Neworg will become a carrier’s carrier – that is, focus on selling services to the companies who want to provide the local communications connectivity in the Humboldt County area and the surrounding regions. With the focus on selling to the communications companies in the area (see Section 4 for more details), Neworg can operate with a lean organization and stay focused on helping carriers who want to provide data and broadband services in the region build their local market. In some aspects, Neworg needs to take on the ideals of a non-profit – to serve the region’s public good by identifying underserved communities and by catalyzing local demand for broadband services. In turn, this will grow the service providers’ markets and ultimately create new demand for middle mile fiber connectivity. At the same time, it must retain the nimbleness and flexibility afforded to it by the for-profit C corporate structure to attract investors with a long-range economic interest in the region.

FirstMile.US An Alternate Middle Mile Fiber Feasibility Study
Copyright 2006 FirstMile.US All Rights Reserved Page 19
Neworg, as a visible technology company in the area, can assist the county in becoming recognized as a technology center – a critical step for relocation of businesses into the area. As such, Neworg should retain local staff and work closely with the local colleges and high schools to provide internship opportunities. In this model, the fiber and other assets of Neworg are owned by the shareholders of the C corporation. It is critical to find investors who have a long-range economic interest in the region and are not investing to make a quick buck. The financing of Neworg is discussed in detail in Section 6.4 of this report, but bears a mention in this section. It is unlikely that Neworg will have any profit for at least 5 years, due to the large upfront investment required by the fiber build. This means that it will be difficult for the organization to obtain traditional commercial financing or meet today’s return on investment expectations.
5.2 Process The ownership model was selected based on:
governance models that have previously succeeded in the Humboldt County area governance models that have succeeded in other jurisdictions for similar assets solutions that may be unique to the culture of Humboldt County
During the course of the study, we spoke to a variety of different organizations and individuals from the Humboldt area to gain more insight into what works and what doesn’t work in the area. In addition, we spoke to a variety of potential customers of Neworg and listened to their opinions as well. These conversations were particularly valuable in that they really provided a laser-focus to the ownership model proposed. The potential customers had solid ideas about how an organization needed to be structured to allow them to most easily purchase services. The Humboldt organizations and individuals had very definitive ideas about what works and what doesn’t in the county. In addition, we looked at other structures of fiber holding companies and found that some are transitioning from traditional non-profits to for profit or LLC companies to make it easier to function. The net result was the recommended model.

FirstMile.US An Alternate Middle Mile Fiber Feasibility Study
Copyright 2006 FirstMile.US All Rights Reserved Page 20
6. Financial Model This section discusses the estimated expenses for the aerial and fiber build as well as their minimum revenue requirements and breakeven points. It also covers financing.
6.1 Expenses We have included capital expenditure installation expenses and annual operation expenditures for two different options: an aerial fiber build utilizing the PG&E poles and a buried fiber build utilizing State Route 299. Many of the costs are similar between the two options, but some costs are unique to the technique. In general, the aerial build option appears to be the most cost effective over time and, as such, creates a good opportunity to provide a realistic ROI for investors. Over ten years, the aerial cost of building and operating the fiber is approximately $11M. The same cost for the buried fiber build and operations is approximately $24M. Detailed expenses are shown in the next two sections for each type of build.
10 Year Estimate of Opex and Capex Costs
$-
$5,000,000
$10,000,000
$15,000,000
$20,000,000
$25,000,000
Aerial vs. Buried 10 Year Costs
Aerial 10 Year EstimateBuried 10 Year Estimate
Figure 3. The aerial fiber build is about half the cost of the buried build when looking at total costs
over 10 years, making it an attractive option for Humboldt County.

FirstMile.US An Alternate Middle Mile Fiber Feasibility Study
Copyright 2006 FirstMile.US All Rights Reserved Page 21
6.1.1 Aerial Build In Figures 4 and 5, we have detailed the expected expenses of an aerial fiber build. We utilized the following assumptions in these calculations:
Approximately 147 miles of fiber needed (776,160 feet) where 30% utilizes existing burial routes (typical in city centers)
44 miles of buried fiber (232,848 feet of buried fiber) 103 miles of aerial fiber (543,312 feet of aerial fiber) 17.6 poles per mile for the aerial run Installation of a 144 strand single mode fiber
We have also defined both one time installation costs and recurring costs for planning purposes. The Project Item column shows the different items that need to be considered for a fiber build including project management and a contingency fee. The average costs were obtained from industry sources and from specific pricing information provided by right of way holders (see Appendice for detailed information.) The Cost Basis and the Based On columns provide information as to how the calculations were based. The Capex includes the capital expenditures needed for the initial installation and the Opex includes the ongoing annual expenses. The estimated total cost of installation is $8.8M. The ongoing maintenance and operations cost for this option is $220K annually.

FirstMile.US An Alternate Middle Mile Fiber Feasibility Study
Copyright 2006 FirstMile.US All Rights Reserved Page 22
Aerial Capital Expenditure (Capex)
Project Item Cost Cost Basis Based on Initial Capex
Survey, route design, mapping 0.49$ foot total mileage 380,318$ Develop scope of work 0.05$ foot total mileage 38,808$ Submittal of utility ROW agreements 0.35$ foot total mileage 271,656$ Environmental Impact Study 0.25$ foot total mileage 194,040$ Aerial construction permits 0.17$ foot aerial mileage 92,363$ Agency permit fees 0.03$ foot total mileage 23,285$ Traffic plans 0.39$ foot total mileage 302,702$
Pole engineering, wind loading 540.00$ pole pole count 977,962$ Installation of utility pole attachments 0.55$ foot aerial mileage 298,822$ Pole anchors, bonding, grounding 0.25$ foot aerial mileage 135,828$ Aerial cable placement 0.79$ foot aerial mileage 429,216$
Underground cable placement 0.89$ foot buried mileage 207,235$ Fiber 1.25$ foot total mileage 2,328,480$ Weatherproof enclosures with electronics 100,000$ site # 100,000$ Full time inspector 750.00$ day 250 build days 187,500$ Asbuilt drawings 0.50$ foot total mileage 388,080$ Subtotal Installation 6,356,295$
Project Management/Administration 15%
Installation Subtotal 953,444$
Subtotal Installation and Management 7,309,739$
Contingency 20%
Installation & Maintenance Subtotal 1,461,948$
Grand Total 8,771,687$ Figure 4. This spreadsheet shows the initial aerial build costs.

FirstMile.US An Alternate Middle Mile Fiber Feasibility Study
Copyright 2006 FirstMile.US All Rights Reserved Page 23
Aerial Annual Operations Expenditure (Opex)
Project Item Cost Cost Basis Based on Annual OpexPG&E Pole Attachment 17.35$ pole/year pole count 31,422$ AT&T Conduit Lease 0.55$ foot/year buried mileage 128,066$ Subtotal Installation 159,488$
Project Management/Administration 15%
Installation Subtotal 23,923$
Subtotal Installation and Management 183,411$
Contingency 20%
Installation & Maintenance Subtotal 36,682$
Grand Total 220,093$
Figure 5. This spreadsheet estimates the annual operating cost of the fiber.
6.1.2 Buried Build In Figures 6 and 7, we have detailed the expected expenses of an buried fiber build. We utilized the following assumptions in these calculations:
Approximately 147 miles of fiber needed (776,160 feet) 40 miles of controlled roadway subject to Caltrans fees Installation of a 144 strand single mode fiber
We have also defined both one time installation costs and recurring costs for planning purposes. The Project Item column shows the different items that need to be considered for a fiber build including project management and a contingency fee. The average costs were obtained from industry sources and from specific pricing information provided by right of way holders such as Caltrans (see Appendix E for detailed information.) The Cost Basis and the Based On columns provide information as to how the calculations were based. The Capex includes the capital expenditures needed for the initial installation and the Opex includes the ongoing annual expenses. The total estimated cost of installation is $19M. The ongoing maintenance and operations cost for this option is $468K annually.

FirstMile.US An Alternate Middle Mile Fiber Feasibility Study
Copyright 2006 FirstMile.US All Rights Reserved Page 24
Buried Capital Expenditure (Capex)
Project Item Cost Cost Basis Based on Initial Capex
Survey, route design, mapping $ 0.49 foot total mileage $ 380,318
Develop scope of work $ 0.05 foot total mileage $ 38,808
Submittal of utility ROW agreements $ 0.35 foot
total mileage $ 271,656
Environmental Impact Study $ 0.25 foot total mileage $ 194,040
Trenching permits w/CADD dwgs. $ 2.95 foot
buried mileage $ 2,289,672
Agency permit fees $ 0.03 foot total mileage $ 23,285
Traffic plans $ 0.39 foot total mileage $ 302,702
Underground cable placement $ 0.89 foot buried mileage $ 690,782
Plow/rockwheel trenching $ 4.50 foot
80% of buried mileage $ 2,794,176
Trench/bore $ 24.50 foot
20% of buried mileage $ 3,803,184
Fiber $ 1.25 foot total mileage $ 2,328,480
Weatherproof enclosures with electronics
$100,000 site # $ 100,000
Full time inspector $ 750.00 day
250 build days $ 187,500
Asbuilt drawings $ 0.50 foot total mileage $ 388,080
Subtotal Installation $ 13,792,684 Project Management/Administration 15% I Subtotal $ 2,068,903 Subtotal Installation and Management $ 15,861,587 Contingency 20% I&M Subtotal $ 3,172,317 Grand Total $ 19,033,904
Figure 6. This spreadsheet shows the initial buried fiber build costs.

FirstMile.US An Alternate Middle Mile Fiber Feasibility Study
Copyright 2006 FirstMile.US All Rights Reserved Page 25
Buried Annual Operations Expenditure (Opex)Project Item Cost Cost Basis Based on Annual Opex
AT&T Conduit Lease 0.55$ foot/yearburied mileage 128,066$
Caltrans ROW 1.00$ foot/year 40 miles 211,200$ Subtotal Installation 339,266$
Project Management/Administration 15% I Subtotal 50,890$
Subtotal Installation and Management 390,156$
Contingency 20% I&M Subtotal 78,031$
Grand Total 468,188$ Figure 7. This spreadsheet shows the annual buried fiber build operating costs.
6.3 Revenue In order to determine the minimum revenue streams needed for the project to provide either a 5 year or 10 year ROI, we looked at expected expenses balanced against annual sales. The following assumptions were used:
10 fibers leased to communications carriers Annual expenses were based on operating expenses plus sales and marketing and general
and administrative costs. Wholesale price was based on breaking even for the anticipated model and should not be
considered a final sales price. The final sales price may vary considerably depending on the specific customer configuration.
Detailed spreadsheets showing the calculations are included in Appendix I. The most interesting outcome of this revenue model is that it seems reasonable to assume a 5 year ROI for the aerial fiber build. We found that an annual lease fee of $197,500 can be charged (considered affordable by the carriers.) In the 10 year breakeven example, the annual lease fee could be even less. This is shown clearly in Figure 8 below. Figure 8 also shows that the buried fiber build requires a much higher annual lease fee per fiber. There may be carriers who feel that the buried sales price is worth the expense, even though it is higher. Determining these preferences will be a key element of the detailed business plan.

FirstMile.US An Alternate Middle Mile Fiber Feasibility Study
Copyright 2006 FirstMile.US All Rights Reserved Page 26
Estimated Wholesale Cost per Lit Fiber for Breakeven
$-
$50,000
$100,000
$150,000
$200,000
$250,000
$300,000
$350,000
$400,000
$450,000
Aerial vs. Buried 5 Year and 10 Year Estimates5 year aerial lit cost per fiber
5 year buried lit cost per fiber
10 year aerial list cost per fiber
10 year buried lit cost per fiber
Figure 8. The aerial fiber build nets out a very affordable sales price for single fibers.
6.4 Financing Neworg has a difficult task in ensuring that the investment and revenue model instills confidence with the potential buyers of services. Nothing will turn off customers faster than inadequate or uncertain funding particularly the conservative, service-driven customer that Neworg will be pursuing. Because we are recommending a privately-held, for-profit company, we recommend that investment capital be raised to cover the initial build of the fiber. This will build confidence with carrier companies who will be purchasing fiber services. In the startup period, the monthly income generated by selling access to the fiber should be set such that ongoing expenses are covered and a repair and replacement reserve is funded.

FirstMile.US An Alternate Middle Mile Fiber Feasibility Study
Copyright 2006 FirstMile.US All Rights Reserved Page 27
To further complicate the financing strategy, traditional investors in private companies expect a return on investment (ROI) rather quickly – months to a small number of years is typical. As such, the Neworg will have to find investors who are interesting in growing the region economically, not just the ROI on their Neworg investment. A number of the study participants mentioned individuals, banks, foundations and companies that might have a vested interest in protecting their long-range investments in the area and, as such, would be potential investors with a long-term vision and willing to accept a long-range ROI. Once a business plan is finalized, we recommend that these sources of funds be further investigated for possible investment in the new venture. Because the company will be new, it will be difficult for it to secure institutional loans. But, there may be organizations within the county that might be in the position to fund Neworg through loans because of the fiber’s overall economic benefit to both Humboldt County and Redwood Region institutions. Alternative Model Advantages Disadvantages Government Financing Low interest loans -Tedious process
-No obvious agency -New company
Commercial Loan -Less upfront investment needed -Community bank or other lending institution could loan for the ‘good of the community’
-New company will have a difficult time getting commercial financing
Grant Unfettered funds -Grant opportunities are limited by the location of fiber. -No obvious source to cover the millions needed for the initial build
Venture Capital Investments generally available with solid business plan
18 month to 3 year exit strategy must be solid and provides risk for company and possible hesitancy from carriers to use fiber.
Figure 9. Summary chart of the advantages and disadvantages of alternative fund sources.

FirstMile.US An Alternate Middle Mile Fiber Feasibility Study
Copyright 2006 FirstMile.US All Rights Reserved Page 28
7. Service Provisioning Models This section discusses the recommendation of initial service provisioning as well as ongoing operations. Initially, service provisioning involves the fiber build itself and then involves the operations and maintenance of the fiber as well as operational requirements of new interconnections.
7.1 Recommended Model For the initial fiber build, we recommend that Neworg outsource the installation to a qualified contractor. It is essential that the build be done by a contractor who is well versed in laying fiber as well as the permitting process. This will ensure that a high quality installation is done and the fiber will perform as required. At the same time, it will be important to have a detailed engineering study done prior to the installation, particularly if you choose to install using direct buried fiber. This study will also be utilized for the CEQA process. Using an RFP would be good, but you might want to talk to local resources and knowledgeable folks to help determine who is the right fit. Neworg will also need to locate and outfit the colocation point in Eureka. This could be done in conjunction with one of the local providers such as AT&T or Sudden Link or be built by the fiber contractor. Operations and maintenance includes the following items:
Operations and monitoring of the fiber and associated hardware Ongoing maintenance of the fiber and associated hardware Emergency maintenance of the fiber and associated hardware Operations of the collocation point Installation and management of the interconnections with carriers
A number of potential customers of the fiber are also interested in providing on one or more of these functions. During the business planning process, we recommend that a list of potential bidders be compiled for an eventual RFP or contract.
7.2 Process One option for long term fiber maintenance is Level 3’s professional services. We recommend that once a final determination of the fiber build is determined, a quote be obtained from Level 3 for inclusion in the plan. See Appendix K for more information.

FirstMile.US An Alternate Middle Mile Fiber Feasibility Study
Copyright 2006 FirstMile.US All Rights Reserved Page 29
8. Implementation Project Plan One of the first steps for this project is to choose which build type will work best for the area and then develop a detailed business plan. The business plan should include a detailed marketing and sales strategy, potential customer commitments and definitive costs and revenues. The business plan is a critical element in finding and convincing investors to fund the enterprise and a solid story for working with potential customers. Appendix C has a sample table of contents for a business plan. During the study process, we identified construction and planning resources that may assist in the business planning process or the actual construction. These are listed in Appendix D. Additional resources should be collected and be incorporated in the business planning process. Also, during the business plan process, it will be important to obtain written commitment from both potential funders and potential customers and to make a firm determination and forecast of sales. A very important step is to set a firm timeline for installation and operations to ensure that potential customers have adequate time for budgeting and engineering plans. We want to make it easy for them to connect to the new fiber. The community and Neworg should work with Humboldt State University (HSU) to determine the feasibility of implementing a local peering point as part of the fiber install and make appropriate plans to fund the peering point and encourage use of the peering point. HSU currently has the largest communications path into its campus from outside the county. As such, it has the most leverage in encouraging providers to participate in building and connecting to a local peering point. Neworg should also work with the community to build widespread community support for broadband which will net larger broadband demand -- exactly what the carriers want and what Neworg needs to ensure its viability.
FirstMile.US An Alternate Middle Mile Fiber Feasibility Study
Copyright 2006 FirstMile.US All Rights Reserved Page 30
9. Acknowledgements
There have been many people who have been generous with their time and knowledge that helped with this report. First, Tina Nerat deserves thanks for her tireless efforts in helping identify and set up interviewees, keeping us straight about the region and her sage advice as we completed this report. She has been an invaluable silent partner in this endeavor. Connie Stewart also worked extensively during the interview process. Skip Dye graciously advised us on the technical details of the fiber world and was priceless in his assistance in navigating the financial understanding of the project. He also shared trusted contacts to benefit the community. Thanks to all the R groups who supplied advice when it was needed and continue to keep the community educated about the wonderful benefits of broadband. And, thanks to the wonderful communities that comprise Humboldt County. Your broadband enthusiasm and spirit keeps you unique in this nation – a community who ‘gets it’. Humboldt is the perfect example of a true First Mile community. Titus Moetsabi said it perfectly when he first described the attitude of a first mile of community, “Connect yourself to the rest of the world and all it has to offer.”

FirstMile.US An Alternate Middle Mile Fiber Feasibility Study
Copyright 2006 FirstMile.US All Rights Reserved Page 31
Appendices
FirstMile.US An Alternate Middle Mile Fiber Feasibility Study
Copyright 2006 FirstMile.US All Rights Reserved Page 32
Appendix A. Study Participants
Assembly Member Patty Berg’s Office
Connie Stewart
AT&T (formerly SBC) Rhunette Alums Gary Mandella
California State Parks
Ilijana Asara Liz Burko Phil Esry Alan Friedman Chris Ortiz
College of the Redwoods
John McBrearty
City of Arcata Dan Hauser Paul Pitino
City of Blue Lake
Wiley Buck
City of Eureka Dave Tyson
City of Ferndale
Michael Powers
City of Fortuna Duane Rigge
City of Rio Dell
Jay Parrish
Cox/Cebridge Mark Geiger
County of Humboldt Jacqueline Debets Kim Kerr Dan Larkin Loretta Nickolas John Woolley
Corporation for Education Network Initiatives in California (CENIC)
Jim Dolgonas
Edge Wireless Roy Willy
Eureka Chamber of Commerce
Chris Crawford
Frontier Donna Dilts
Hoopa Tribe
Jim Allen Gene Genoar Lyle Marshall
Humboldt Area Foundation
Kathy Moxon
Humboldt Artworks Angie Schwab
Humboldt County Office of Education
Garry Eagles Joe Sapper
Humboldt County Office of Economic Development
Jacqueline Debets
Humboldt Creamery Lisa Carnahan Rich Ghilarducci

FirstMile.US An Alternate Middle Mile Fiber Feasibility Study
Copyright 2006 FirstMile.US All Rights Reserved Page 33
Humboldt Merchant Services
Ann Condon
Humboldt State University Ann Burroughs Brad Finney Denice Helwig David Mashall Rollin Richmond Rick Vrem
Independent
John Hauser
Last Mile Digital Andy Johannesen
Level 3
Erik Huntsinger
National Weather Service Nancy Dean
Redwood Coast Rural Action (RCRA)
Various
Redwood Region Economic Development Commission (RREDC)
Gregg Foster and board
Redwood Technology Consortium (RTC) Bob Morse Tina Nerat
St. Joseph’s Hospital System
Larry Raizen
Security National Service Mark Hodgson
Small Business Development Center (SBDC)
Kristin Johnson
Sprint Phil Butler Steve Easley
State of California Business, Transportation and Housing Agency
Jeff Newman
Verizon Kurt Rasmussen
US Cellular Yurok Tribe
John Corbett Howard McConnell

FirstMile.US An Alternate Middle Mile Fiber Feasibility Study
Copyright 2006 FirstMile.US All Rights Reserved Page 34
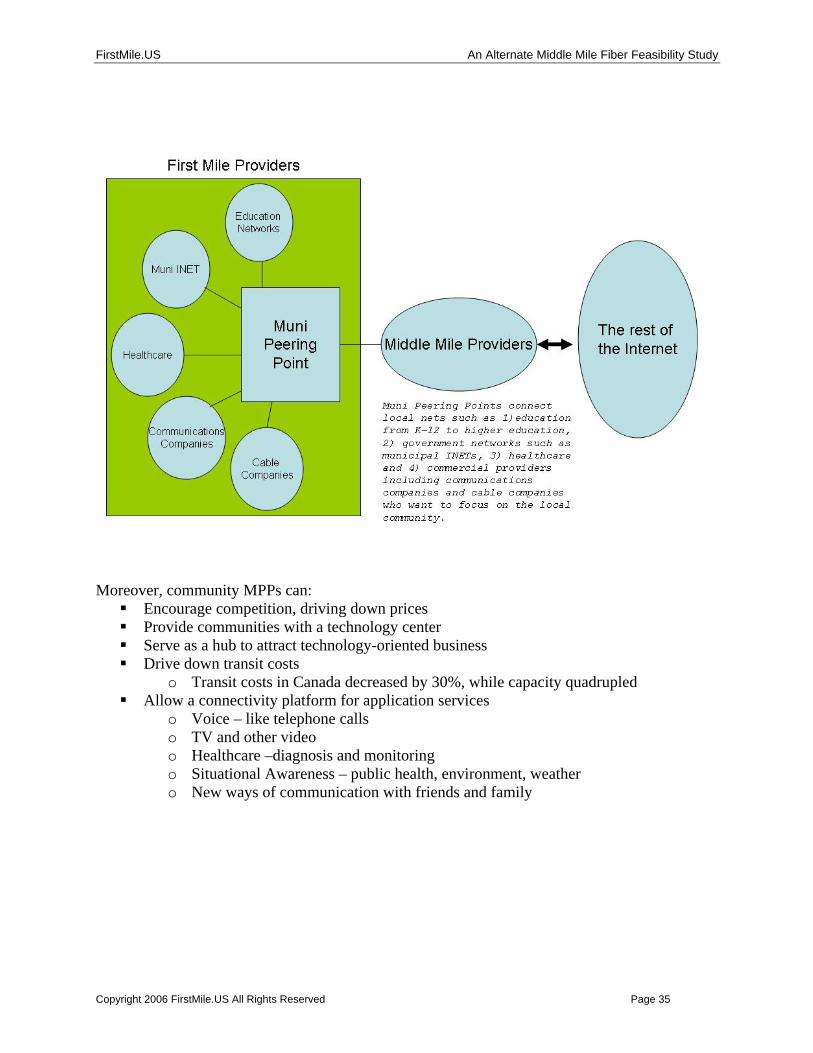
Appendix B. Introduction to Muni Peering Points Muni Peering Points (MPP) are the building blocks of new networks. They create community connectivity, essentially catalyzing companies to provide good first mile broadband solutions. They bring communities to the network and offer access to the currency of the 21st century: information. Just how critical are MPPs? As Dana Blankenhorn writes,
In the 21st century, connectivity is our basic infrastructure. The more you have -- the more speed, the more access across all sorts of boundaries -- the greater your access to the world. And the greater your access to the world -- the more connectivity you have -- the more wealth you can create and accumulate. Let me summarize this in a way you might understand:
Guns defined the 17th century, colonization. Ships defined the 18th century, trade. Canals and railroads defined the 19th century, industrialization. Roads defined the 20th century, mass production. Connectivity will define the 21st century, information.
One can think of the muni peering point as the new central office for communications—in essence, a communications commons. Peering among local networks, which can be thought of as the equivalent to free local calling, occurs within exchanges. The local community networks peer with each other at the MPP, exchanging traffic without leaving the area (see Figure 1). MPPs act as regional hubs that:
Keep local traffic as regional as possible Allow remote community ISPs (and maybe end users) to choose providers at MPP, rather
than having to use only the ones who can get to the community Allows municipalities to provide a cost-effective interconnect method while staying out
of the competitive service business MPPs allow communities to provide FACILITIES without providing SERVICES by connecting community networks consisting of providers plus fiber and/or wireless facilities. Transit providers connect this community facility network to the outside world. A MPP allows the local community to easily and economically support many transit links. Supplier networks interconnect MPPs. MPPs give communities what is needed for scalable networks – building local interconnections to what people want: education, healthcare, and entertainment as well as for communicating with colleagues, friends, and family. They offer a multitude of features, such as:
Solid off-the-shelf technology Innovative connections at layer 1, 2 or 3 Scope and choice for consumers Simple, fast and cheap to build and maintain
FirstMile.US An Alternate Middle Mile Fiber Feasibility Study
Copyright 2006 FirstMile.US All Rights Reserved Page 35
Moreover, community MPPs can:
Encourage competition, driving down prices Provide communities with a technology center Serve as a hub to attract technology-oriented business Drive down transit costs
o Transit costs in Canada decreased by 30%, while capacity quadrupled Allow a connectivity platform for application services
o Voice – like telephone calls o TV and other video o Healthcare –diagnosis and monitoring o Situational Awareness – public health, environment, weather o New ways of communication with friends and family

FirstMile.US An Alternate Middle Mile Fiber Feasibility Study
Copyright 2006 FirstMile.US All Rights Reserved Page 36
Appendix C. Sample Business Plan Table of Contents Taken from http://www.bizplanit.com/vplan/toc/samples.html Company Description ÊÊ Legal Description ÊÊ Business History & Description ÊÊ Current Status ÊÊ Future Plans ÊÊ Key Management Mission & Vision ÊÊ Mission Statement ÊÊ Company Vision ÊÊ Corporate Values & Approach Product & Service Description ÊÊ Overview of Products & Services ÊÊ Product & Service Advantages ÊÊ Proprietary Features ÊÊ Product Development Activities ÊÊ Product Liability Industry Analysis ÊÊ Industry Overview ÊÊ Industry Participants ÊÊ Industry Trends & Growth Target Market ÊÊ Market Demographics ÊÊ Market Trends & Growth Patterns ÊÊ Market Size and Potential Marketing Plan ÊÊ Marketing Strategies ÊÊ Marketing Tactics ÊÊ Positioning ÊÊ Public Relations Sales Plan ÊÊ Sales Strategies ÊÊ Sales Process ÊÊ Sales Team ÊÊ Distribution Channels Competitive Analysis ÊÊ Competitive Overview ÊÊ Market Share Analysis ÊÊ Direct Competitors ÊÊ Indirect Competitors ÊÊ Competitive Advantages ÊÊ Barriers to Entry Operations Plan ÊÊ Location ÊÊ Property Ownership/Lease Terms ÊÊ Equipment ÊÊ Purchasing Policies ÊÊ Quality Control Measures
ÊÊ Administrative Procedures ÊÊ Staffing and Training ÊÊ Labor Considerations ÊÊ Management Control Systems ÊÊ Organizational Chart Regulatory Requirements State Federal Management Team ÊÊ Key Management ÊÊ Board of Advisors ÊÊ Board of Directors ÊÊ Professional Service Providers Financial Plan ÊÊ Financial Summary ÊÊ Current Ownership Summary ÊÊ Funding Request / Terms of Investment ÊÊ Sources and Uses of Funds ÊÊ Exit Strategy ÊÊ Projected Financial Statements ÊÊ Financial Assumptions ÊÊ Historical Financials ÊÊ Break-Even Analysis ÊÊ Financial Ratios Appendices ÊÊ Product Samples/Pictures ÊÊ Management Resumes ÊÊ Business Location Site Information ÊÊ Legal Documents ÊÊ Other Critical Data

FirstMile.US An Alternate Middle Mile Fiber Feasibility Study
Copyright 2006 FirstMile.US All Rights Reserved Page 37
Appendix D. Implementation Resources
D. 1 Environmental Consultants Premiere Environmental Consultants Monica M. Oscarson MPH,CH 5532 Woodruff Ave. Department 330 Lakewood, Ca. 90713 562-804-1145
D.2 Contractors Oasis Telecom Companies Bill Purcell 717-732-2387 NcI Network Cabling, Inc. Jason Plasse 760-743-1900 Underground Construction Co.,Inc Jim Curry 707-746-8800 Skip Dye Datalog, A, C7 7710 Balboa Ave., #223C San Diego, CA 92111 858 569 4812 office 858 569 4273 fax 760 497 9286 cell [email protected]

FirstMile.US An Alternate Middle Mile Fiber Feasibility Study
Copyright 2006 FirstMile.US All Rights Reserved Page 38
Appendix E. Caltrans Telecommunications Information

FirstMile.US An Alternate Middle Mile Fiber Feasibility Study
Copyright 2006 FirstMile.US All Rights Reserved Page 40
Appendix F. Pacific Gas and Electric Fee Schedule


FirstMile.US An Alternate Middle Mile Fiber Feasibility Study
Copyright 2006 FirstMile.US All Rights Reserved Page 44
Appendix G. Humboldt County Statistics

Page 44
Tons of air pollution emissions County State2001 per person
Carb
onM
onox
ide
Nitr
ogen
Oxid
es
Part
icul
ate
Mat
ter
< 10
mic
rons
Sulfu
rOx
ides
Reac
tive
Orga
nic
Gas
0
0.1
0.2
0.3
0.4
0.5
0.6
Population Trend County: historic forecast
State: historic forecastPercent change relative to 1990
1995 2000 2005 2010 2015 2020
0%
10%
20%
30%
40%
50%
60%
Unemployment and IncomeCounty State County State
Unemployment Rate Per Capita Personal Income
0
2
4
6
8
10
12
1991 1992 1993 1994 1995 1996 1997 1998 1999 2000 2001$0
$5,000
$10,000
$15,000
$20,000
$25,000
$30,000
$35,000
Value of New ConstructionCounty State County State
Non-residential
Building permits issued in unincorporated area per person.
Residential
1990 1991 1992 1993 1994 1995 1996 1997 1998 1999 2000 2001$0
$200
$400
$600
$800
$1,000
$1,200
landfill divertedSolid Waste
Pounds of solid waste generated per person, portions landfilled or diverted (e.g. recycled)
countylandfill diverted
state
0
1000
2000
3000
4000
5000
6000
7000
8000
9000
1995 1996 1997 1998 1999 2000
Humboldt CountyPopulation
Economy
Environment
County 23.2% 24.3% 22.9% 17.9% 11.8% 37.5State 28.4% 23.1% 23.2% 15.2% 10.2% 36.7
Workforce Characteristics:
Population Trend:1990 PopulationPortion of pop. living in unincorporated area
2000 PopulationPortion of pop. living in unincorporated area
Population change, 1990 to 2000Projected population change, 2000 to 2010
Population by Age, 2003: Averageunder 18 18-34 35-49 50-64 65+ Age
County State
Total workforce(2001)High school graduates(2001)High school dropoutrate (2000-01)% of grad’s qualifiedfor UC/CSU (2001)Average SATscore (2001)Average wageper job (2000)Housing demand*(2001)Home ownershiprate (2000)% of pop. belowpoverty (1999)Average cost of care,infant age 0-2 (2001)Average cost of care,child age 2-5 (2001)
*ratio of change in workforce to new units of housing (based on building permits issued)
119,11852.2%
127,70052.9%
7.2%6.9%
59,100 17,362,300
1,377 316,124
2.3% 2.8%
33.5% 35.6%
1,058 1,006
$ 24,932 $ 40,367
-2.20 1.82
57.6% 56.9%
19.5% 14.2%
$ 6,473 $ 9,404
$ 5,127 $ 6,394

Page 45Page 45
County Revenues County State
1999-2000 per person
$0 $100 $200 $300 $400 $500 $600 $700 $800 $900
Property Taxes
Other Taxes
Special Assess.
Licenses, Permits
Fines, Forfeitures
Intergovernmental
Charge for Service
Other
County Expenditures County State
1999-2000 per person
$0 $50 $100 $150 $200 $250 $300 $350 $400 $450
General
Public Protection
Pub. Ways & Fac.
Health
Sanitation
Public Assistance
Education
Rec. & Cultural Srv.
Debt Service
AFDC/CalWORKs Recipients County State
Fiscal years 1987-88 through 2000-01, per 100,000 population
1987
-88
1988
-89
1989
-90
1990
-91
1991
-92
1992
-93
1993
-94
1994
-95
1995
-96
1996
-97
1997
-98
1998
-99
1999
-00
2000
-01
0
2000
4000
6000
8000
10000
12000
Crimes Reported County State
1994 through 2001 per 1,000 people
1994 1995 1996 1997 1998 1999 2000 2001
-
5
10
15
20
25
30
35
Public Finance
Social Services
Public Safety
Civic Participation
County Expenditures:
Source information for the data in this county profile is available on page 138.
Property Taxes $ 12,788,137 $ 99.58 $ 112.61 38Other Taxes $ 6,246,538 $ 48.64 $ 33.12 27Special Assess. $ 0 $ 0.00 $ 0.50 15Licenses, Permits $ 1,889,861 $ 14.72 $ 9.67 37Fines, Forfeitures $ 1,936,438 $ 15.08 $ 19.97 46Intergovernmental $ 106,747,147 $ 831.24 $ 578.00 13Charge for Service $ 8,710,957 $ 67.83 $ 102.37 47Other $ 3,274,079 $ 25.50 $ 80.16 57Total $ 141,593,157 $ 1,103 $ 1,066 24
General $ 12,483,492 $ 97.21 $ 88.39 39Public Protection $ 35,129,093 $ 273.55 $ 266.56 36Pub. Ways & Fac. $ 12,010,893 $ 93.53 $ 30.07 20Health $ 26,686,600 $ 207.81 $ 153.49 14Sanitation $ 0 $ 0.00 $ 0.50 14Public Assistance $ 49,899,334 $ 388.57 $ 305.29 17Education $ 1,934,467 $ 15.06 $ 8.31 18Rec. & Cultural Srv. $ 415,985 $ 3.24 $ 8.02 36Debt Service $ 1,881,198 $ 14.65 $ 29.06 37Total $ 140,441,062 $ 1,094 $ 890 21
Humboldt County
Fiscal Year 1999-00: – Per Capita –Total County State Avg. RankCounty Revenues:
Hospital admissions for drug or alcohol treatment, 2000County total
per 1,000 peopleState average per 1,000 people
Mental health programs clients served, fiscal year 1999-00County total
per 1,000 peopleState average per 1,000 people
Live births with late (3rd trimester) or no prenatal care, 2001County percentState average
2001 data, except where otherwise specified:
County State
Violent crimes per 1,000 people
Property crimes per 1,000 people
Arrests per 1,000 people
% of trials resulting in conviction (2000)
Adult Probation cases per 1,000 people
Law enforcement expenditures per person(fiscal year 1999-2000)
County State
Percent of registered voters who voted in the 2002 General Election
Percent of residents eligible to vote who voted in the 2002 General Election
Percent of 2001 income tax returns with voluntary contributions
4.20 5.97
11.45 12.23
56.80 39.19
83% 84%
11.76 9.32
$ 131 $ 240
54.4 49.6
43.5 35.4
1.5 0.9
9067.064.74
3,30425.7314.36
4.1%2.9%

FirstMile.US An Alternate Middle Mile Fiber Feasibility Study
Copyright 2006 FirstMile.US All Rights Reserved Page 47
Appendix H. CPUC and CEQA Information and Links Competitive Local Carrier information at the CPUC can be found at http://www.cpuc.ca.gov/static/telco/information+for+providing+service/clc+application/ Contact within the CPUC’s Telecommunications Division for information about CLC and necessity for CEQA study:
Jack Leutza, Director Telecommunications Division 505 Van Ness San Francisco, CA 94102 (415) 703-1060
Contact within the CPUC’s CEQA Division for details about CEQA study:
John Boccio CEQA Telecommunications Projects Manager Energy Division 505 Van Ness Ave San Francisco, CA 94102 (415) 703-2641

FirstMile.US An Alternate Middle Mile Fiber Feasibility Study
Copyright 2006 FirstMile.US All Rights Reserved Page 48
FirstMile.US An Alternate Middle Mile Fiber Feasibility Study
Copyright 2006 FirstMile.US All Rights Reserved Page 49
Appendix I. RFP Resources from CompuMentor The following resources are available for free from CompuMentor and could be helpful in the RFP process for the fiber installation. The RFP Process: An Overview If you plan to use an outside vendor, an RFP (request for proposal) can be a valuable tool. Here, NPower provides some basic considerations and tips for each phase of the bidding process. It also includes a link to a sample RFP. http://ga0.org/ct/wpqByD61oRQ5/ Sample RFP Timeline This sample timeline and checklist can serve as your rough guide to keeping the RFP process on track -- from developing and writing an RFP, to distributing it to vendors, to making a final selection. http://ga0.org/ct/w7qByD61oRQv/

FirstMile.US An Alternate Middle Mile Fiber Feasibility Study
Copyright 2006 FirstMile.US All Rights Reserved Page 50
Appendix J. Breakeven Financial Charts 5 Year Breakeven for Capital and Operating Costs
Aerial Annual ExpensesAerial Operating Expense 213,688$ Sales and Marketing 42,738$ 20% of OpexG&A 76,928$ 30% of Opex + S&MTotal Annual Expenses 333,353$
Annual SalesAnnual lit fiber wholesale price 193,000$ Quantity of fibers sold 10$ Total Annual Sales 1,930,000$
Annual Profit/Loss 1,596,647$
Five Year Cost 9,640,755$ Estimated CostFive Year Breakeven 9,650,000$ Revenue Estimate
BuriedAnnual ExpensesBuried Operating Cost 468,188$ Sales and Marketing 93,638$ 20% of OpexG&A 168,548$ 30% of Opex + S&MTotal Annual Expenses 730,373$
Annual SalesAnnual lit fiber wholesale price 427,500$ Quantity of fibers sold 10$ Total Annual Sales 4,275,000$
Annual Profit/Loss 3,544,627$
Five Year Costs 21,374,842$ Estimated CostFive Year Breakeven 21,375,000$ Revenue Estimate

FirstMile.US An Alternate Middle Mile Fiber Feasibility Study
Copyright 2006 FirstMile.US All Rights Reserved Page 51
10 Year Breakeven for Capital and Operating Costs
AerialAnnual ExpensesAerial Operating Cost 213,688$ Sales and Marketing 42,738$ 20% of OpexG&A 76,928$ 30% of Opex + S&MTotal Annual Expenses 333,353$
Annual SalesAnnual lit fiber wholesale price 107,500$ Quantity of fibers sold 10$ Total Annual Sales 1,075,000$
Annual Profit/Loss 741,647$
Ten Year Costs 10,709,193$ Estimated CostTen Year Breakeven 10,750,000$ Revenue Estimate
BuriedAnnual ExpensesBuried Operating Cost 468,188$ Sales and Marketing 93,638$ 20% of OpexG&A 168,548$ 30% of Opex + S&MTotal Annual Expenses 730,373$
Annual SalesAnnual lit fiber wholesale price 237,500$ Quantity of fibers sold 10$ Total Annual Sales 2,375,000$
Annual Profit/Loss 1,644,627$
Ten Year Costs 23,715,780$ Estimated CostTen Year Breakeven 23,750,000$ Revenue Estimate

FirstMile.US An Alternate Middle Mile Fiber Feasibility Study
Copyright 2006 FirstMile.US All Rights Reserved Page 52
Appendix K. Level 3 Services Brochures

Level 3® Professional Services
Customized Solutions for Critical Network Projects Today’s evolving business climate presents both challenges and numerous opportunities. Your network can be a key factor in your ability to navigate change effectively.
The Level 3® Professional Services offering provides custom solutions that your business needs to address every stage of network growth. We will help you plan, deploy, optimize, manage and run your network infrastructure – regardless of its complexity or your organization's size. Our expertise and business-centric approach will help you reduce costs, manage complexity and boost your competitive edge.
Level 3's comprehensive Professional Services include:
Network Audit and Optimization Services – We resolve issues affecting the performance and health of your network, prepare for changes in your business, or better manage the costs associated with your communications needs. We perform a variety of assessments from network performance to cost analysis to asset utilization.
Network Design and Engineering Services – We develop end-to-end network design plans across all major technologies and vendors to meet your specific network objectives and constraints. We deliver a baseline network design recommendation and documentation to fully support the network design.
Network Implementation and Migration Services – We perform simple cutovers to major network migrations, as well as conversions and implementations. We can plan and execute an entire deployment strategy from start to finish: identify the goals, define the migration process, develop schedules and checklists, and manage the implementation.
Custom Network Monitoring & Management – We provide 24 x 7 proactive monitoring and management of customer networks via our Customer Network Control Center. Our shared environment ensures the most cost-effective services possible.
Tech Services – We deliver responsive, on-going network support, including "smart hands" maintenance support, parts logistics support, and other value added services to support life-cycle engineering for management and maintenance of customer network assets.
Relying on our experience Our team of professionals includes the same engineers who planned, built and maintain our 23,000 mile fiber-optic network. Our first-hand experience combines with a depth of networking expertise to provide best-in-class network solutions for your business, whether that solution includes wide area and metro IP, VoIP, Switched Data, or Optical networks.
Leveraging shared resources for cost efficiencies You gain the cost advantages of our shared resources such as lab services, maintenance and monitoring resources, third-party vendor relationships and our own expert networking specialists.
Managing expenses and gaining productivity Alleviate the need for internal network resources and focus on your core business. We will empower you to better manage operating expenses by uncovering methods for simplified network management, increased operating efficiencies and increased network productivity.
To learn more about the Level 3 Professional Services, call 1-877-2LEVEL3 or visit: www.Level3.com.
©2006 Level 3 Communications, Inc. All rights reserved. Level 3 and the Level 3 logo are registered service marks of Level 3 Communications, Inc. in the United States and/or other countries.
www.Level3.com 1-877-2LEVEL3

The Freedom to Connect Level 3 provides a colocation environment in which customers have the freedom to network on their terms, not ours. Our 42 largest facilities across North America and Europe — our “Gateways” — offer connectivity to an average of eight telecommunications carriers just a cross connect away.
Level 3 Colocation service equips you with physical security, redundant power availability, customer support, and the infrastructure flexibility you need to meet your specific networking needs.
Trusting a state-of-the-art and secure environment Every Level 3 Colocation facility houses premium space built according to uniform environmental and security standards.
Security: Multi-layer security control procedures, biometric palm readers, and 24 x 7 closed-circuit video and alarm monitoring Power: Uninterruptible redundant AC and DC power solutions that are flexible and upgradeable to meet all types of needs Cooling: HVAC redundant design with air distribution under raised flooring for maximum temperature control Fire Suppression: Smoke detection system above and below raised floor; double-interlock, pre-action, dry-pipe fire suppression Overhead Cable Management and Ladder Racking: Provides easy access to all cabling while deterring obstructions from under the
raised flooring
Integrating with the Level 3 Network Because our data centers form a critical part of Level 3’s infrastructure, you can easily add connectivity options to your space without looking to a separate provider. At our Gateways, you can choose from a full suite of Level 3 connectivity options, all of which ride a unified metro and intercity network infrastructure that is solely owned and operated by Level 3.
Responding in real-time We’re committed to resolving your issues quickly. To that end, Level 3 provides numerous support options through the Level 3® Tech Services offering, which is available around the clock in every facility. With this paid-by-the-hour service, Level 3 Tech Services customers can take advantage of our world-class field service organization to meet installation and maintenance requirements.
Level 3® Colocation
Yellow
AC-1Apollo North
Apollo SouthWilmingtonWashington, D.C.
Toronto
Tampa
Stamford
Stratford
St. Louis
Seattle
Santa Teresa
San Luis Obispo
San Jose
San Francisco
San Diego
San Antonio
San Bernardino
Salt Lake City
Sacramento
Richmond
Raleigh
Princeton
Portland
Pittsburgh
Philadelphia
Phoenix
Paris
Orlando
Orange County
Omaha
Oakland
Ogden
New York City
New Orleans
Newark
Nashville
Munich
Miami
Memphis
Louisville
Los Angeles
Long Island
London
Las Vegas
Kansas CityWeehawken
Jacksonville
Indianapolis
Houston
Herndon
Hartford
Hamburg
Frankfurt
Fort Worth
El Paso
Dusseldorf
Detroit
Denver
Dallas
Cleveland
Cincinnati
Chicago
Charlotte
Buffalo
Brussels
BostonBerlin
Baltimore
Austin
Atlanta
AmsterdamAlbany
Gateway Site
Synergy Site
Level 3 Network

Leading the industry in coverage Level 3 operates 78 data centers across the United States and Europe. Forty-two of these facilities are IP-enabled Level 3 Gateways that give you a choice of cabinets or suites, custom or pre-built configurations, AC or DC power, and the whole gamut of Level 3 networking services.
The remaining sites — our Synergy sites — offer carrier-grade DC power, private line, Ethernet, dark fiber, and wavelength services. Our broad footprint of consistently designed facilities virtually eliminates the hassle of finding another vendor as your needs evolve.
Rely on a Trusted Provider The Level 3 Network carries traffic for the world’s largest and most sophisticated networks, including 9 of the world’s 10 largest telecom carriers, 9 of the top 10 North American ISPs, and 9 of the 10 largest U.S. cable companies.
To learn more about how the Level 3 Colocation service can work for your business, call 1-877-2LEVEL3 or visit: www.Level3.com.
©2006 Level 3 Communications, Inc. All rights reserved. Level 3 and the Level 3 logo are registered service marks of Level 3 Communications, Inc. in the United States and/or other countries.
www.Level3.com 1-877-2LEVEL3