amplified dna nanoarray sequencing - harvard …arep.med.harvard.edu/pdf/drmanac_sup_09.doc · web...
TRANSCRIPT
SUPPLEMENTAL ONLINE MATERIAL – 1181498S - Drmanac R, et al.
Section 1: Sample prep and library construction
The 4-adaptor library construction process is summarized in Fig. S1. This process incorporates several
DNA engineering innovations to realize: i) high yield adaptor ligation and DNA circularization with
minimal chimera formation, ii) directional adaptor insertion with minimal creation of structures
containing undesired adaptor topologies, iii) iterative selection of constructs with desired adaptor
topologies by PCR, iv) efficient formation of strand-specific ssDNA circles, and v) single tube solution-
phase amplification of ssDNA circles to generate discrete (non-entangled) DNA nanoballs (DNBs) in high
concentration. Whereas the process involves many independent enzymatic steps, it is largely recursive
in nature and is amenable to automation for the processing of 96 sample batches.
Genomic DNA (gDNA) was fragmented by sonication to a mean length of 500 bp, and fragments
migrating within a 100 bp range (e.g. ~400 to ~500 bp for NA19240) were isolated from a
polyacrylamide gel and recovered by QiaQuick column purification (Qiagen, Valencia, CA).
Approximately 1 ug (~3 pmol) of fragmented gDNA was treated for 60 min at 37°C with 10 units of
FastAP (Fermentas, Burlington, ON, CA), purified with AMPure beads (Agencourt Bioscience, Beverly,
MA), incubated for 1h at 12°C with 40 units of T4 DNA polymerase [New England Biolabs (NEB), Ipswich,
MA), and AMPure purified again, all according to the manufacturers’ recommendations, to create non-
phosphorylated blunt termini. The end-repaired gDNA fragments were then ligated to synthetic adaptor
1 (Ad1) arms (Table S1) with a novel nick translation ligation process which produces efficient adaptor-
fragment ligation with minimal fragment-fragment and adaptor-adaptor ligation. Approximately 1.5
pmol of end repaired gDNA fragments were incubated for 120 min at 14°C in a reaction containing
50mM Tris-HCl (pH 7.8), 5% PEG 8000, 10mM MgCl2, 1mM rATP, a 10-fold molar excess of 5’-
phosporylated (5’PO4) and 3’ dideoxy terminated (3’dd) Ad1 arms (Table S1) and 4,000 units of T4 DNA
ligase (Enzymatics, Beverly, MA). T4 DNA ligation of 5’PO4 Ad1 arm termini to 3’OH gDNA termini
1
SUPPLEMENTAL ONLINE MATERIAL – 1181498S - Drmanac R, et al.
produced a nicked intermediate structure, where the nicks consisted of dideoxy (and therefore non-
ligatable) 3’ Ad1 arm termini and non-phosphorylated (and therefore non-ligatable) 5’ gDNA termini.
After AMPure purification to remove unincorporated Ad1 arms, the DNA was incubated for 15 min at
60°C in a reaction containing 200uM Ad1 PCR1 primers (Table S1), 10mM Tris-HCl (pH 78.3), 50 mM KCl,
1.5 mM MgCl2, 1 mM rATP, 100 uM dNTPs, to exchange 3’ dideoxy terminated Ad1 oligos with 3’OH
terminated Ad1 PCR1 primers. The reaction was then cooled to 37°C and, after addition of 50 units of
Taq DNA polymerase (NEB) and 2000 units of T4 DNA ligase, was incubated a further 30 min at 37°C, to
create functional 5’PO4 gDNA termini by Taq-catalyzed nick translation from Ad1 PCR1 primer 3’ OH
termini, and to seal the resulting repaired nicks by T4 DNA ligation.
Approximately 700 pmol of AMPure purified Ad1-ligated material was subjected to PCR (6-8 cycles of
95°C for 30 sec, 56°C for 30 sec, 72°C for 4min) in a 800uL reaction consisting of 40 units of PfuTurbo Cx
(Stratagene, La Jolla, CA) 1X Pfu Turbo Cx buffer, 3 mM MgSO4, 300 uM dNTPs, 5% DMSO, 1M Betaine,
and 500nM each Ad1 PCR1 primer (Table S1). This process resulted in selective amplification of the ~350
fmol of template containing both left and right Ad1 arms, to produce approximately 30 pmol of PCR
product incorporating dU moieties at specific locations within the Ad1 arms. Approximately 24pmol of
AMPure-purified product was treated at 37°C for 60 min with 10 units of a UDG/EndoVIII cocktail (USER;
NEB) to create Ad1 arms with complementary 3’ overhangs and to render the right Ad1 arm-encoded
AcuI site partially single-stranded. This DNA was incubated at 37C for 12h in a reaction containing 10
mM Tris-HCl (pH7.5), 50 mM NaCl, 1 mM EDTA, 50uM s-adenosyl-L-methionine, and 50 units of Eco57I
(Fermentas, Glen Burnie, MD), to methylate the left Ad1 arm AcuI site as well as genomic AcuI sites.
Approximately 18pmol of AMPure-purified, methylated DNA was diluted to a concentration of 3 nM in a
reaction consisting of 16.5 mM Tris-OAc (pH 7.8), 33 mM KOAc, 5 mM MgOAc, and 1 mM ATP, heated to
55°C for 10 min, and cooled to 14°C for 10 min, to favor intramolecular hybridization (circularization).
2
SUPPLEMENTAL ONLINE MATERIAL – 1181498S - Drmanac R, et al.
The reaction was then incubated at 14°C for 2h with 3600 units of T4 DNA ligase (Enzymatics) in the
presence of 180nM of non-phosphorylated bridge oligo (Table S1) to form monomeric dsDNA circles
containing top-strand-nicked Ad1 and double-stranded, unmethylated right Ad1 AcuI sites. The Ad1
circles were concentrated by AMPure purification and incubated at 37°C for 60 min with 100U
PlasmidSafe exonuclease (Epicentre, Madison, WI) according to the manufacturer’s instructions, to
eliminate residual linear DNA.
Approximately 12 pmol of Ad1 circles were digested at 37°C for 1h with 30 units of AcuI (NEB) according
to the manufacturer’s instructions to form linear dsDNA structures containing Ad1 flanked by two
segments of insert DNA. After AMPure purification, approximately 5 pmol of linearized DNA was
incubated at 60°C for 1h in a reaction containing 10 mM Tris-HCl (pH8.3), 50 mM KCl, 1.5 mM MgCl2,
0.163 mM dNTP, 0.66 mM dGTP, and 40 units of Taq DNA polymerase (NEB), to convert the 3’
overhangs proximal to the active (right) Ad1 AcuI site to 3’G overhangs by translation of the Ad1 top-
strand nick. The resulting DNA was incubated for 2h at 14°C in a reaction containing 50mM Tris-HCl (pH
7.8), 5% PEG 8000, 10mM MgCl2, 1mM rATP, 4000 units of T4 DNA ligase, and a 25-fold molar excess of
asymmetric Ad2 arms (Table S1), with one arm designed to ligate to the 3’ G overhang, and the other
designed to ligate to the 3’ NN overhang, thereby yielding directional (relative to Ad1) Ad2 arm ligation.
Approximately 2 pmol of Ad2-ligated material was purified with AMPure beads, PCR-amplified with
PfuTurbo Cx and dU-containing Ad2-specific primers (Table S1), AMPure purifies, treated with USER,
circularized with T4 DNA ligase, concentrated with AMPure and treated with PlasmidSafe, all as above,
to create Ad1+2-containing dsDNA circles.
Approximately 1 pmol of Ad1+2 circles were PCR-amplified with Ad1 PCR2 dU-containing primers (Table
S1), AMPure purified, and USER digested, all as above, to create fragments flanked by Ad1 arms with
complimentary 3’ overhangs and to render the left Ad1 AcuI site partially single-stranded. The resulting
3
SUPPLEMENTAL ONLINE MATERIAL – 1181498S - Drmanac R, et al.
fragments were methylated to inactivate the right Ad1 AcuI site as well as genomic AcuI sites, AMPure
purified and circularized, all as above, to form dsDNA circles containing bottom strand-nicked Ad1 and
double stranded unmethylated left Ad1 AcuI sites. The circles were concentrated by AMPure
purification, AcuI digested, AMPure purified G-tailed, and ligated to asymmetric Ad3 arms (Table S1), all
as above, thereby yielding directional Ad3 arm ligation. The Ad3-ligated material was AMPure purified,
PCR-amplified with dU-containing Ad3-specific primers (Table S1), AMPure purified, USER-digested,
circularized and concentrated, all as above, to create Ad1+2+3-containing circles, wherein Ad2 and Ad3
flank Ad1 and contain EcoP15 recognition sites at their distal termini.
Approximately 10 pmol of Ad1+2+3 circles were digested for 4h at 37°C with 100 units of EcoP15 (NEB)
according to the manufacturer’s instructions, to liberate a fragment containing the three adaptors
interspersed between four gDNA fragments. After AMPure purification, the digested DNA was end-
repaired with T4 DNA polymerase as above, AMPure purified as above, incubated for 1h at 37°C in a
reaction containing 50 mM NaCl, 10 mM Tris-HCl (pH7.9), 10 mM MgCl2, 0.5 mM dATP, and 16 units of
Klenow exo- (NEB) to add 3’ A overhangs, and ligated to T-tailed Ad4 arms as above. The ligation
reaction was run on a polyacrylamide gel, and Ad1+2+3+Ad4-arm-containing fragments were eluted
from the gel and recovered by QiaQuick purification. Approximately 2 pmol of recovered DNA was
amplified as above with Pfu Turbo Cx (Stratagene) plus a 5’-biotinylated primer specific for one Ad4 arm
and a 5’PO4 primer specific for the other Ad4 arm (Table S1).
Approximately 25 pmol of biotinylated PCR product was captured on streptavidin-coated, Dynal
paramagnetic beads (Invitrogen, Carlsbad, CA), and the non-biotinylated strand, which contained one 5’
Ad4 arm and one 3’ Ad4 arm, was recovered by denaturation with 0.1N NaOH, all according to the
manufacturer’s instructions. After neutralization, strands containing Ad1+2+3 in the desired orientation
with respect to the Ad4 arms were purified by hybridization to a three-fold excess of an Ad1 top strand-
4

SUPPLEMENTAL ONLINE MATERIAL – 1181498S - Drmanac R, et al.
specific biotinylated capture oligo (Table 1), followed by capture on streptavidin beads and 0.1N NaOH
elution, all according to the manufacturer’s instructions. Approximately 3 pmol of recovered DNA was
incubated for 1h at 60°C with 200 units of CircLigase (Epicentre) according to manufacturer’s
instructions, to form single-stranded (ss)DNA Ad1+2+3+4-containing circles, and then incubated for 30
min at 37C with 100 units of ExoI and 300 units of ExoIII (both from Epicenter) according to the
manufacturer’s instructions, to eliminate non-circularized DNA.
100fmol of Ad1+2+3+4 ssDNA circles were incubated for 10 min at 90°C in a 400uL reaction containing
50mM Tris-HCl (pH 7.5), 10mM (NH4)2SO4, 10mM MgCl2, 4 mM DTT, and 100nM Ad4 PCR 5B primer
(Table S1). The reaction was adjusted to an 800uL reaction containing the above components plus
800uM each dNTP and 320 units of Phi29 DNA polymerase (Enzymatics), and incubated for 30 min at
30°C to generate DNBs. Short palindromes in the adaptors (Table S1) promote coiling of ssDNA
concatamers via reversible intra-molecular hybridization into compact ~300 nm DNBs, thereby avoiding
entanglement with neighboring replicons. The combination of synchronized RCR conditions and
palindrome-driven DNB assembly enable generation of over 20 billion discrete DNBs/ml of RCR reaction.
These compact structures are stable for several months without evidence of degradation or
entanglement.
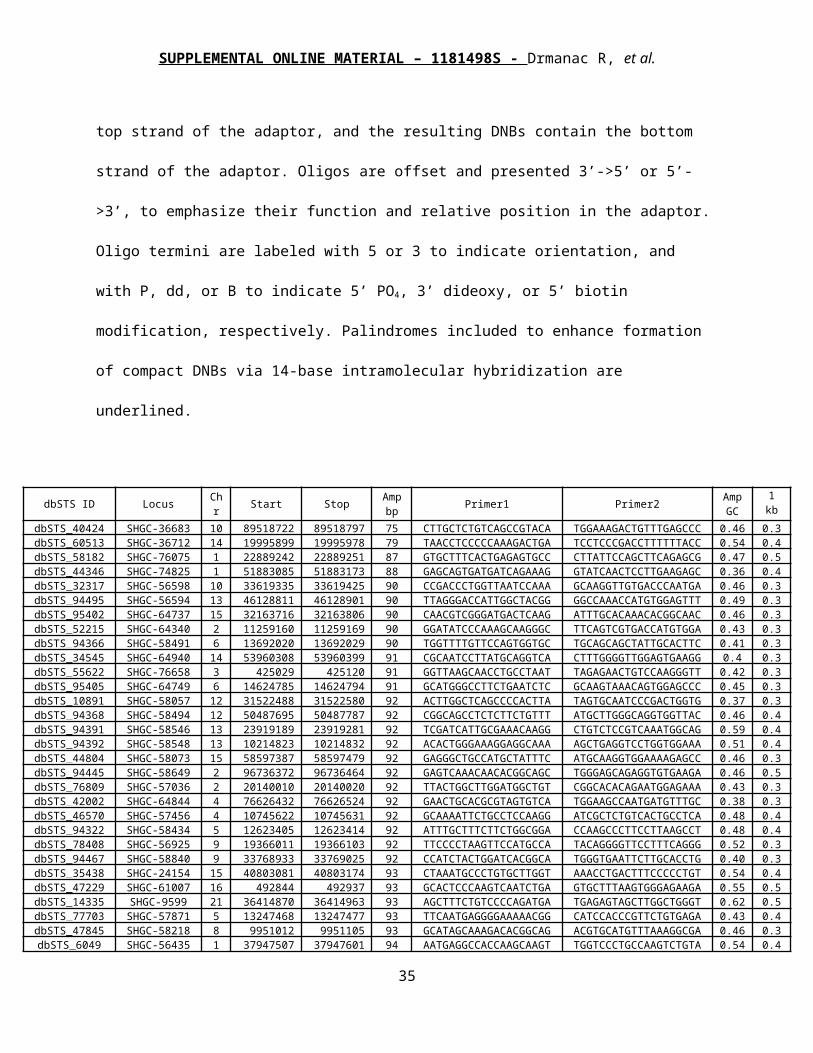
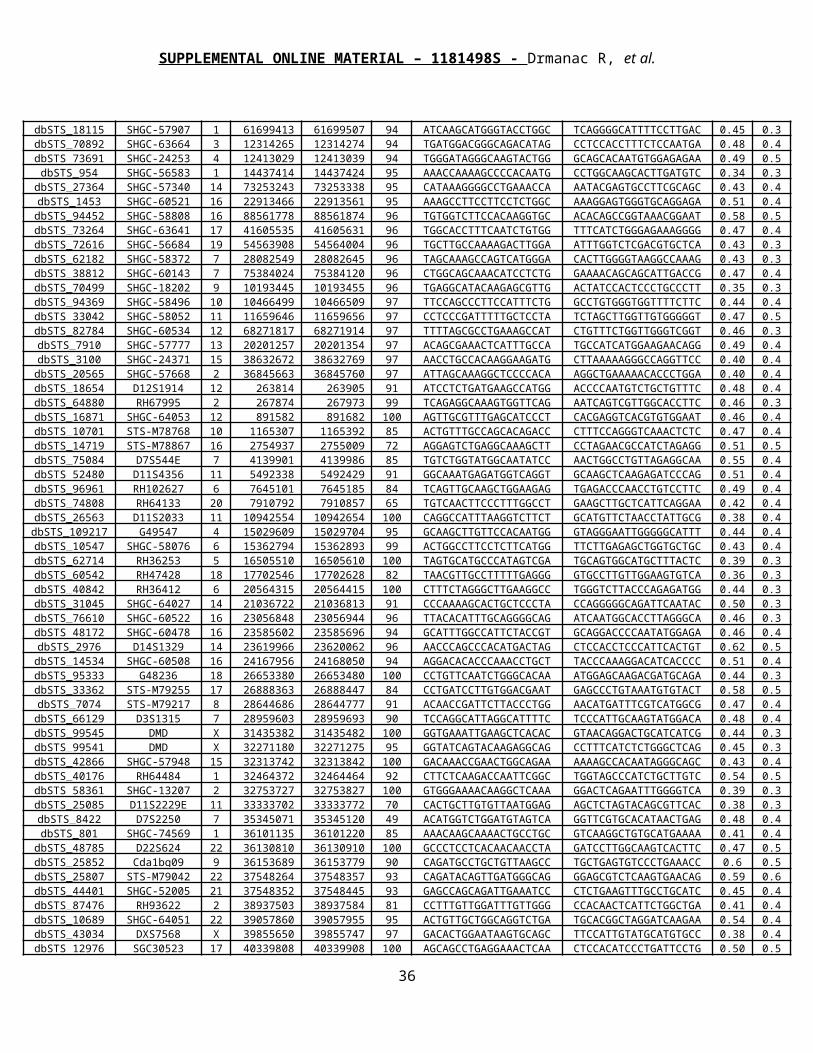
Section 2: Library construction QC
To assess coverage bias, library construction intermediates were assayed by quantitative PCR (QPCR)
with the StepOne platform (Applied Biosystems, Foster City, CA) and a SYBR Green-based QPCR assay
(Quanta Biosciences, Gaithersburg, MD) for the presence and concentration of a set of 96 dbSTS
markers (Table S2) representing a range of locus GC contents. Raw cycle threshold (Ct) values were
collected for each marker in each sample. Next, the mean Ct for each sample was subtracted from its
5
SUPPLEMENTAL ONLINE MATERIAL – 1181498S - Drmanac R, et al.
respective raw Ct values, to generate a set of normalized Ct values, such that the mean normalized Ct
value for each sample was zero. Finally, the mean (from four replicate runs) normalized Ct of each
marker in gDNA was subtracted from its respective normalized Ct values, to produce a set of delta Ct
values for each marker in each sample (Fig. S2).
To assess library construct structure, 4Ad hybrid-captured, single-stranded library DNA was PCR-
amplified with Taq DNA polymerase (NEB) and Ad4-specific PCR primers. These PCR products were
cloned with the TopoTA cloning kit (Invitrogen), and colony PCR was used to generate PCR amplicons
from 192 independent colonies. These PCR products were purified with AMPure beads and sequence
information was collected from both strands with Sanger dideoxy sequencing (MCLAB, South San
Francisco, CA). The resulting traces were filtered for high quality data, and clones containing a library
insert with at least one good read were included in the analysis (Tables S3, S4).
The assembled genome datasets were subjected to a routine identity QC analysis protocol to confirm
their sample of origin. Assembly-derived SNP genotypes were found to be highly concordant with those
independently obtained from the original DNA samples, indicating the dataset was derived from the
sample in question. Also, mitochondrial genome coverage in each lane was sufficient to support lane-
level mitochondrial genotyping (average of 31-fold per lane). A 39-SNP mitochondrial genotype profile
was compiled for each lane, and compared to that of the overall dataset, demonstrating that each lane
derived from the same source.
Section 3: DNB array manufacturing
To manufacture patterned substrates, a layer of silicon dioxide was grown on the surface of a standard
silicon wafer (Silicon Quest International, Santa Clara, CA). A layer of titanium was deposited over the
silicon dioxide, and the layer was patterned with fiducial markings with conventional photolithography
6
SUPPLEMENTAL ONLINE MATERIAL – 1181498S - Drmanac R, et al.
and dry etching techniques. A layer of hexamethyldisilizane (HMDS) (Gelest Inc., Morrisville, PA) was
added to the substrate surface by vapor deposition, and a deep-UV, positive-tone photoresist material
was coated to the surface by centrifugal force. Next, the photoresist surface was exposed with the array
pattern with a 248 nm lithography tool, and the resist was developed to produce arrays having discrete
regions of exposed HMDS. The HMDS layer in the holes was removed with a plasma-etch process, and
aminosilane was vapor-deposited in the holes to provide attachment sites for DNBs. The array
substrates were recoated with a layer of photoresist and cut into 75 mm x 25 mm substrates, and all
photoresist material was stripped from the individual substrates with ultrasonication. Next, a mixture of
50 µm polystyrene beads and polyurethane glue was applied in a series of parallel lines to each diced
substrate, and a coverslip was pressed into the glue lines to form a six-lane gravity/capillary-driven flow
slide. The aminosilane features patterned onto the substrate serve as binding sites for individual DNBs,
whereas the HMDS inhibits DNB binding between features. DNBs preps were loaded into flow slide lanes
by pipetting 2- to 3-fold more DNBs than binding sites on the slide. Loaded slides were incubated for 2h
at 23°C in a closed chamber, and rinsed to neutralize pH and remove unbound DNBs.
Section 4: cPAL sequencing
Unchained sequencing of target nucleic acids by combinatorial probe anchor ligation (cPAL) involves
detection of ligation products formed by an anchor oligo hybridized to part of an adaptor sequence, and
a fluorescent degenerate sequencing probe that contains a specified nucleotide at an “interrogation
position”. If the nucleotide at the interrogation position is complementary to the nucleotide at the
detection position within the target, ligation is favored, resulting in a stable probe-anchor ligation
product that can be detected by fluorescent imaging.
7
SUPPLEMENTAL ONLINE MATERIAL – 1181498S - Drmanac R, et al.
Four fluorophores were used to identify the base at an interrogation position within a sequencing probe,
and pools of four sequencing probes were used to query a single base position per hybridization-
ligation-detection cycle. For example, to read position 4, 3’ of the anchor, the following 9mer
sequencing probes were pooled where “p” represents a phosphate available for ligation and “N”
represents degenerate bases:
5’-pNNNANNNNN-Quasar 670
5’- pNNNGNNNNN-Quasar 570
5’- pNNNCNNNNN-Cal fluor red 610
5’- pNNNTNNNNN-fluorescein
A total of forty probes were synthesized (Biosearch Technologies, Novato, CA) and HPLC-purified with a
wide peak cut. These probes consisted of five sets of four probes designed to query positions 1 through
5 5’ of the anchor and five sets of four probes designed to query positions 3’ of the anchor. These
probes were pooled into 10 pools, and the pools were used in combinatorial ligation assays with a total
of 16 anchors [4 adaptors x 2 adaptor termini x 2 anchors (standard and extended)], hence the name
combinatorial probe-anchor ligation (cPAL).
To read positions 1-5 in the target sequence adjacent to the adaptor, 1 µM anchor oligo was pipetted
onto the array and hybridized to the adaptor region directly adjacent to the target sequence for 30 min
at 28°C. A cocktail of 1000 U/ml T4 DNA ligase plus four fluorescent probes (at typical concentrations of
1.2 µM T, 0.4 µM A, 0.2 µM C, and 0.1 µM G) was then pipetted onto the array and incubated for 60 min
at 28°C. Unbound probe was removed by washing with 150 mM NaCl in Tris buffer pH 8.
In general, T4 DNA ligase will ligate probes with higher efficiency if they are perfectly complementary to
the regions of the target nucleic acid to which they are hybridized, but the fidelity of ligase decreases
8
SUPPLEMENTAL ONLINE MATERIAL – 1181498S - Drmanac R, et al.
with distance from the ligation point. To minimize errors due to incorrect pairing between a sequencing
probe and the target nucleic acid, it is useful to limit the distance between the nucleotide to be detected
and the ligation point of the sequencing and anchor probes. By employing extended anchors capable of
reaching 5 bases into the unknown target sequence, we were able to use T4 DNA ligase to read positions
6-10 in the target sequence.
Creation of extended anchors involved ligation of two anchor oligos designed to anneal next to each
other on the target DNB. First-anchor oligos were designed to terminate near the end of the adaptor,
and second-anchor oligos, comprised in part of five degenerate positions that extended into the target
sequence, were designed to ligate to the first anchor. In addition, degenerate second-anchor oligos
were selectively modified to suppress inappropriate (e.g., self) ligation. For assembly of 3’ extended
anchors (which contribute their 3’ ends to ligation with sequencing probe), second-anchor oligos were
manufactured with 5’ and 3’ phosphate groups, such that 5’ ends of second-anchors could ligate to 3’
ends of first-anchors, but 3’ ends of second-anchors were unable to participate in ligation, thereby
blocking second-anchor ligation artifacts. Once extended anchors were assembled, their 3’ ends were
activated by dephosphorylation with T4 polynucleotide kinase (Epicentre). Similarly, for assembly of 5’
extended anchors (which contribute their 5’ ends to ligation with sequencing probe), first-anchors were
manufactured with 5’ phosphates, and second-anchors were manufactured with no 5’ or 3’ phosphates,
such that the 3’ end of second-anchors could ligate to 5’ ends of first-anchors, but 5’ ends of second-
anchors were unable to participate in ligation, thereby blocking second-anchor ligation artifacts. Once
extended anchors were assembled, their 5’ ends were activated by phosphorylation with T4
polynucleotide kinase (Epicentre).
First-anchors (4 µM) were typically 10 to 12 bases in length and second-anchors (24 µM) were 6 to 7
bases in length, including the five degenerate bases. The use of high concentrations of second-anchor
9
SUPPLEMENTAL ONLINE MATERIAL – 1181498S - Drmanac R, et al.
introduced negligible noise and minimal cost relative to the alternative of our using high concentrations
of labeled probes. Anchors were ligated with 200 U/ml T4 DNA ligase at 28°C for 30 min and then
washed three times before addition of 1 U/ml T4 polynucleotide kinase (Epicentre) for 10 min.
Sequencing of positions 6-10 then proceeded as above for reading positions 1-5.
After imaging, the hybridized anchor-probe conjugates were removed with 65% formamide, and the
next cycle of the process was initiated by the addition of either single-anchor hybridization mix or two-
anchor ligation mix. Removal of the probe-anchor product after every assayed base is an important
feature of unchained base reading. Starting a new ligation cycle on the clean DNA allows accurate
measurements at 20 to 30% ligation yield, which can be achieved at low cost and high accuracy with low
concentrations of probes and ligase.
Section 5: Imaging
A Tecan (Durham NC) MSP 9500 liquid handler was used for automated cPAL biochemistry, and a robotic
arm was used to interchange the slides between the liquid handler and an imaging station. The imaging
station consisted of a four-color epi-illumination fluorescence microscope built with off-the-shelf
components, including an Olympus (Center Valley, PA) NA=0.95 water-immersion objective and tube
lens operated at 25-fold magnification; Semrock (Rochester, NY) dual-band fluorescence filters,
FAM/Texas Red and CY3/CY5; a Wegu (Markham, Ontario, Canada) autofocus system; a Sutter (Novato
CA) 300W xenon arc lamp coupled to Lumatec (Deisenhofen, Germany) 380 liquid light guide; an
Aerotech (Pittsburgh, PA) ALS130 X-Y stage stack; and two Hamamatsu (Bridgewater, NJ) 9100 1-
megapixel EM-CCD cameras. Each slide was divided into 6,396 320 µm x 320 µm fields. The fields were
organized into six 1066-field groups, corresponding to the lanes created by glue lines on the substrate.
Four-color images of each group were generated (requiring one filter change) before moving to the next
10
SUPPLEMENTAL ONLINE MATERIAL – 1181498S - Drmanac R, et al.
group. Images were taken in step-and-repeat mode at an effective rate of seven frames per second. To
maximize microscope utilization and match the biochemistry cycle time and imaging cycle time, six slides
were processed in parallel with staggered biochemistry start times, such that the imaging of slide N was
completed just as slide N+1 was completing its biochemistry cycle
Section 6: Base calling
Each imaging field contains 225 x 225 = 50625 spots or potential DNB features. The four images
associated with a field were processed independently to extract DNB intensity information, with the
following steps: 1) background removal, 2) image registration, 3) intensity extraction. First, background
was estimated with a morphological opening (erosion followed by dilation) operation. The resulting
background image was then subtracted from the original image. Next, a flexible grid was registered to
the image. In addition to correction for rotation and translation, this grid allowed for (R-1) + (C-1)
degrees (here: R=C=225) of freedom for scale/pitch, where R and C are the number of DNB rows and
columns, respectively, such that each row or column of the grid was allowed to float slightly in order to
find the optimal fit to the DNB array. This process accommodates optical aberrations in the image as
well as fractional pixels per DNB. Finally, for each grid point, a radius of one pixel was considered; and
within that radius, the average of the top 3 pixels was computed and returned as the extracted intensity
value for that DNB.
The data from each field were then subjected to base calling, which involved four major steps: 1)
crosstalk correction, 2) normalization, 3) calling bases, and 4) raw base score computation. First,
crosstalk correction was applied to reduce optical (fixed) and biochemical (variable) crosstalk between
the four channels. All the parameters—fixed or variable—were estimated from the data for each field. A
system of four intercepting lines (at one point) was fit to the four-dimensional intensity data with a
11
SUPPLEMENTAL ONLINE MATERIAL – 1181498S - Drmanac R, et al.
constrained optimization algorithm. Sequential quadratic programming and genetic algorithms were
used for the optimization process. The fit model was then used to reverse-transform the data into the
canonical space. After crosstalk correction, each channel was independently normalized, with the
distribution of the points on the corresponding channel. Next, the axis closest to each point was
selected as its base call. Bases were called on all spots regardless of quality. Each spot then received a
raw base score, reflecting the confidence level in that particular base call. The raw base score
computation was made by the geometrical mean of several sub-scores, which capture the strength of
the clusters as well as their relative position and spread and the position of the data point within its
cluster.
Section 7: DNB mapping
The gapped read structure described above requires some adjustments to standard informatic analyses.
It is possible to represent each arm as a continuous string of bases if one fixes the lengths of the gaps
between reads (e.g. with the most common values), replaces positive gaps with Ns, and uses a
consensus call for base positions where reads overlap. Such a string can be aligned to a reference
sequence using dynamic programming including standard Smith-Waterman local alignment scoring, or
with modified scoring schemes that allow indels only at the locations of gaps between reads. Methods
for high-speed mapping of short reads involving some form of indexing of the reference genome can
also be applied, though indexes relying on ungapped seeds longer than 10 bases limit the portion of the
arm that can be compared to the index and/or require limits on the allowed gap sizes. In simulations,
we have found that missing the correct gap structure for even a small fraction (<1%) of arms can
substantially increase variation calling errors, because we miss the correct alignment for these arms and
may thus put too much confidence in a false mapping with the wrong gap structure. Consequently, we
have developed an efficient method for mapping DNBs that can find nearly all correct mappings.
12
SUPPLEMENTAL ONLINE MATERIAL – 1181498S - Drmanac R, et al.
Mate-paired arm reads were aligned to the reference genome in a two-stage process. First, left and right
arms were aligned independently using indexing of the reference genome. This initial search is
guaranteed to find all locations in the genome that match the arm with at most two single-base
substitutions, but may find some locations that have up to five mismatches. The number of mismatches
in the reported alignments was further limited so that the expectation of finding an alignment to
random sequence of the same length as the reference was < 4-3. If a particular arm had more than 1000
alignments, no alignments were carried forward, and the arm was marked as “overflow”. Second, for
every location of a left arm identified in the first stage, the right arm was subjected to a local alignment
process, which was constrained to a genomic interval informed by the distribution of the mate distance
(here, 0 to 700 bases away). Up to four single-base mismatches were allowed during this process; the
number of mismatches was further limited so that the expectation of a random alignment of the entire
mate pair was <4-7. The same local search for the left arms was performed in the vicinity of right arm
alignments.
At both stages, the alignment of a gapped arm read was performed by trying multiple combinations of
gap values. The frequencies of gap values were estimated for every library by aligning a sample of arm
reads from that library with lenient limits on the gap values. During the bulk alignment, only a subset of
the gap values was used for performance reasons; the cumulative frequency of the neglected gap values
was approximately 10-3. Both stages were capable of aligning arms containing positions that were not
sequenced successfully (no-calls). The expectation calculations above take into account the number of
no-calls in the arm. Finally, if a mate-pair had any consistent locations of arms (that is, left and right
arms were on the same strand, in the proper order and within the expected mate-distance distribution),
then only these locations were retained. Otherwise, all locations of the mate-pair were retained. In
either case, for performance reasons, at most 50 locations for every arm were reported; arms that had
13
SUPPLEMENTAL ONLINE MATERIAL – 1181498S - Drmanac R, et al.
more retained locations were marked as “overflow”, and no locations were reported. The overall data
yield of spots imaged through mapped reads varied between 40 and 50% reflecting end-to-end losses
from all process inefficiencies including unoccupied array spots, low quality areas, abnormal DNBs and
DNBs with non-human (e.g. EBV-derived) DNA.
Section 8: Local assembly
Reconstruction of the genome being sequenced was performed as a reference-guided assembly based
on the mappings described above, using as reference NCBI Build 36 of the human genome. SNPs and
indels of perhaps a few bases could be reconstructed by a consensus base calling method applied to a
multiple-sequence alignment of mapped reads aligned to a reference sequence. To facilitate
exploration of such methods, mappings can be transformed into common alignment formats such as
SAM/BAM (albeit with some loss of information where reads overlap). However, such an
‘alignment+consensus’ approach is limited and ultimately prone to certain types of errors. Regions of
the genome that differ enough from the reference to prevent discovery of a correct alignment during a
mapping step such as described above will be unresolved, called as reference (esp. in the case of
heterozygous variations), or even called with an incorrect sequence in those cases where reads are
mapped but with an incorrect alignment. Consequently, we developed an approach to genome
reconstruction that identifies regions where the reference sequence is a poor fit to the data and then
performs a local assembly of such regions using a set of reads recruited based on the mapping of the
other arm of each DNB.
The identification of regions of interest involves determining at every base in the reference whether
recruited reads provide consistent support for an alternative to the reference. All possible SNPs, one-
base indels, and single-copy expansions or contractions of small tandem repeat motifs are evaluated
14
SUPPLEMENTAL ONLINE MATERIAL – 1181498S - Drmanac R, et al.
using the likelihood scoring described below. Additionally, the possibility of longer changes is evaluated
by using segments of the reference as seed nodes in a De Bruijn graph and iteratively adding additional
nodes that are supported by recruited reads; novel paths in the De Bruijn graph that reconverge on the
original nodes are input to the same likelihood calculation. If insufficient support for the reference over
any of these alternatives is found, the corresponding portion of the reference, plus a few bases (typically
three) on either side, is subjected to more extensive analysis as detailed below.
Assembly was performed relative to NCBI Build 36 reference human genome ( ). The resequenced
genome ( was obtained by iteratively maximizing its a posteriori probability , which
accounts for all DNBs obtained during the experiment.
From Bayes’s theorem, and under the simplifying assumption that each DNB is generated independently
of all others, the a posteriori probability satisfies
Here, and are a priori probabilities. The assumption that all ’s have the same a priori
probability yields
The conditional probabilities were evaluated under the assumption that all positions in the
genome, both alleles at each genome location, and both DNA strands, are all equally likely to generate a
DNB. Each DNB can therefore originate from a large number of mappings M, each consisting of a
15
SUPPLEMENTAL ONLINE MATERIAL – 1181498S - Drmanac R, et al.
hypothesis for the location of each of the contiguous reads that make up the DNB. This hypothesis must
be consistent with the known possible values for read gaps, but all possible mappings should in principle
be considered, regardless of the number of mismatches between the genome and the DNB. Since all
mappings are exclusive events, this gives
Here, can be or . The sum is over all possible mappings, and is the probability of that
mapping being realized, given the known distribution of read gap values. is the probability
of reading the observed bases once the mapping is fixed.
was evaluated at each position under the assumptions that all errors are base
substitutions, errors are uncorrelated, and errors are equally likely at all positions in the genome. An
error rate ( ) was estimated for each base call from its raw base score, with a calibration curve
obtained from mapping results. Under this model, is a product of a factor for each
base position in the DNB which agrees with the genome, and a factor for each position which does
not agree.
The above model can in principle evaluate the probability ratio for any .
This requires a product over all DNBs and, for each DNB, a sum over all possible mappings, which is
computationally prohibitive. However, the vast majority of mappings ( ) give a negligibly small
16
SUPPLEMENTAL ONLINE MATERIAL – 1181498S - Drmanac R, et al.
contribution to . Only mappings with a small number of mismatches contribute significantly,
because the factor for each mismatch reduces the contribution in an exponential fashion.
Thus, to make computation tractable, the approximation
was employed, where the sum was applied only to the subset of mappings which were likely to
contribute most, and where the contribution of the neglected mappings was approximated as a
constant assumed to be the same for all DNBs. An additional simplification consisted of only
considering possibilities in which and are identical except for a small localized region. This
formulation allowed efficient computation of for any , and enabled an
iterative optimization process in which was initially set equal to and was then locally perturbed.
Recomputing at each iteration allowed guiding of a simple greedy
optimization process towards a (local) maximum. The greedy optimization process considered only
single-base changes or single-base insertions or deletions, guaranteeing optimality for all variations
consisting of a single base. The optimization process works for longer variations as well, but its
effectiveness degrades as the deviations from the reference become longer and denser.
For this reason, the optimization process was supplemented with a procedure in which local de novo
assemblies were performed at selected locations, to generate multiple plausible seed sequences, which
were used in turn to drive the optimization process towards more global optima. Local de novo assembly
17

SUPPLEMENTAL ONLINE MATERIAL – 1181498S - Drmanac R, et al.
used a method similar to the De Bruijn graph approaches to contiguous reads, but with substantial
modifications to accommodate our variably gapped reads. The pool of DNB arms used for each local de
novo assembly was selected from DNBs that mapped to the reference one mate pair away from the
region of interest. This seeding procedure made the optimization process much more resilient to the
existence of local optima in the landscape. Also, although genomic regions
were processed one at a time, joint probabilities of pairs of distant variations were computed, resulting
in a substantial reduction of false positives in regions of segmental duplication.
The above-described resequencing assembly procedure generated a hypothesis file consisting of, for
each localized region of the genome, a set of sequence hypotheses for the alleles in said region, as
well as their respective probability ratios relative to the null hypothesis . In addition, the process
generated a variations file containing, for each reference location, a single most likely reconstruction of
the diploid target genome, together with a variant quality score. This was accomplished by identifying
variations found consistently in the top hypotheses (hypotheses with computed probabilities greater
than the probability of the most likely hypothesis divided by a threshold, usually set around a factor of
1000, i.e. 30 dB) and scoring each variation on the basis of the likelihood ratio of the top hypothesis
versus the best hypothesis inconsistent with that variation. Areas in which the most likely hypotheses
gave contradicting results were “no-called”.
Section 9: Sanger sequencing of discordances with reference data
Sanger sequencing of selected loci was performed for NA07022 to evaluate predicted heterozygous and
homozygous SNPs, indels, and discordances with HapMap genotyping. Once loci for confirmation
sequencing were identified, PCR primer sequences flanking the variants of interest were designed with
18

SUPPLEMENTAL ONLINE MATERIAL – 1181498S - Drmanac R, et al.
the JCVI Primer Designer (http://sourceforge.net/projects/primerdesigner/, S1), a management and
pipeline suite build atop Primer3. Synthetic oligos [Integrated DNA Technologies, Inc. (IDT), Coralville, IA]
were used to amplify the loci with Taq polymerase and the PCR products were purified by SPRI
(Agencourt). Purified PCR products were Sanger sequenced on both strands (MCLAB). The resulting
traces were filtered for high quality data, run through TraceTuner
(http://sourceforge.net/projects/tracetuner/, S2) to generate mixed base calls, and aligned to their
expected read sequence with applications from the EMBOSS Software Suite
(http://emboss.sourceforge.net/, S3). For each locus, the expected read sequence was generated for
each strand by modifying the reference based on the predicted variation(s) to reflect the combination of
the two allele sequences. A locus was determined to be confirmed if the corresponding traces aligned
exactly to the expected read sequence at that variant position for at least one strand. Any strand
contradiction or discrepancies due to background noise were resolved by visual inspection of the traces.
Section 10: Analysis of impact of coding SNPs
All SNP variants identified in NA07022 were analyzed with Trait-o-Matic software (as in S25). This
software, run as a website, returns all non-synonymous SNP (nsSNP) variants found in HGMD, OMIM
and SNPedia (cited SNPs), as well as all nsSNPs not specifically listed in the preceding databases, but that
occur in genes listed in OMIM (uncited nsSNPs). Analysis of the NA07022 genome with Trait-o-Matic
returned 1,141 variants, including 605 cited nsSNPs, and 536 uncited nsSNPs. Filtering of 320 variants
with BLOSUM100 scores below 3 and 725 variants with a minor allele frequency (MAF) > 0.06 in the
Caucasian/European (CEU) population (weighted average of HapMap and 1000 genomes frequency
data) left 55 cited nsSNPs and 41 uncited SNPs. Forty one cited nsSNPs were removed either because
their phenotypic evidence was based solely on association studies, or because they were not disease-
associated (e.g. olfactory receptor, blood type, eye color), and 38 uncited nsSNPs were removed
19

SUPPLEMENTAL ONLINE MATERIAL – 1181498S - Drmanac R, et al.
because they had non-obvious functional consequences. Table S9 lists the remaining 14 cited nsSNPs (12
heterozygous loci and one compound heterozygous locus), three uncited nsSNPs (two nonsense
mutations and one homozygous mutation) as well as two common variants in APOE with potential
phenotypic consequences.
Section 11. False Discovery rate (FDR) calculation for novel variations
Of the variations called in NA07022 that were novel with respect to dbSNP (build 129) and non-
synonymous with respect to the NM_* set of NCBI Build 36.3 annotated transcripts, a random subset
was assessed with Sanger sequencing (Table S8). For the purposes of this analysis, all indels that overlap
the coding regions of transcripts were treated as non-synonymous changes irrespective of frame
change. Errors detected within these assessed variations were used to estimate 95% confidence
intervals (exact) for the FDR within non-synonymous novel variations of each type (homozygous or
heterozygous forms of SNP, insertion, deletion and block substitution). These error rates were multiplied
by the total number of novel non-synonymous variations detected and divided by the total length of
coding sequence in the NM_* set of transcripts to estimate the number of false positives (FPs) per
megabase of genomic sequence. The calculation for SNPs also corrected for the fact that not all possible
mutations are non-synonymous. The FDR rate for novel variations was computed from the estimated FP
rate and the total number of novel variations detected.
This approach yields a FP rate estimate of between 1 and 5 heterozygous events per megabase of each
variation type. Heterozygote indels and block substitutions have a similar combined novel FP rate per
Mb to SNPs (3.0-5.6 vs. 2.1-5.3). There was insufficient data to estimate FDRs and FPs reliably for
homozygous novel variations, though very few homozygous non-synonymous variations were called,
and those that were detected were generally confirmed.
20
SUPPLEMENTAL ONLINE MATERIAL – 1181498S - Drmanac R, et al.
We also estimated the overall FDR within all our variation calls (SNP, deletion, insertion, block
substitutions) in Table 3. For this purpose, in the absence of statistically reliable estimates of the FPs and
FDR in homozygote calls, we used the higher estimated rates for heterozygote calls. This is a
conservative choice, as the error rate for homozygote calls is substantially lower than that for
heterozygotes (e.g. Fig. S8) and the number of false positive errors in known variations is also lower.
Conversely, our projections based on testing coding variants may underestimate FDRs in non-coding
regions.
Supplemental Materials Online - References
S1. G. A. Denisov, A. B. Arehart, and M. D. Curtin, US Patent 6681186 (2004).S2. K. Li et al., BMC Bioinformatics 9, 1 (2008).S3. P. Rice et al., TIG 16, 276 (2000).S4. J.C. Venter, et al. Science 291, 1304 (2001).S5. S. Levy et al., PLoS Biol 5, e254 (2007).S6. D.R. Bentley, et al., Nature 456, 53(2008).S7. D. Pushkarev, N.F. Neff, S.R. Quake, Nat. Biotechnol. 27, 847 (2009). S8. G.R. Villani, G. Pontarelli, D. Vitale, P. DiNatale, Hum Genet 115, 173 (2004).S9. D. A. Wheeler et al., Nature 452, 872 (2008).S10. K. Assink et al., Kidney Int 63, 1995 (2003).S11. http://www.ncbi.nlm.nih.gov/entrez/dispomim.cgi?id=209901 S12. J. Wang et al., Cell 98, 47 (1999).S13. M. Buzza et al., Kidney Int 63, 447 (2003)S14. E. Gross et al., Hum Mutat 22, 498 (2003).S15. http://www.ncbi.nlm.nih.gov/entrez/dispomim.cgi?id=276700 S16. K. Ritis et al., Ann Rheum Dis 63, 438 (2004).S17. F. Donaudy F et al., Am J Hum Genet 72, 1571 (2003).S18. S. Furuki et al., J Biol Chem 281, 1317 (2006).S19. C. G. et al., Cytokine 24, 173 (2003).S20. J. P. Hugot et al., Nature 411, 599 (2001).S21. http://www.ncbi.nlm.nih.gov/entrez/dispomim.cgi?id=600805 S22. http://www.ncbi.nlm.nih.gov/entrez/dispomim.cgi?id=605514 S23. http://www.ncbi.nlm.nih.gov/entrez/dispomim.cgi?id=605194
21
SUPPLEMENTAL ONLINE MATERIAL – 1181498S - Drmanac R, et al.
S24. http://www.ncbi.nlm.nih.gov/entrez/dispomim.cgi?id=107741 S25. J.I. Kim, et al. Nature. 460, 1011 (2009).
22
SUPPLEMENTAL ONLINE MATERIAL – 1181498S - Drmanac R, et al.
SOM Tables
Ad Position in Ad Purpose Sequence
Ad1 3T R ARM 5-CGGGAACGCTGAAGA-3ddAd1 3B R ARM 3dd-CACGTGCTATGCAGAGCCCTTGCGACTTCT-5PAd1 5T L ARM 5P-ACTTCAGAACCGCAATGCACGATACGC-3ddAd1 5B L ARM 3dd-TGAAGTCTTGGCGTT-5Ad1 3T BRIDGE1 5-CTCGGGAACGCT-3Ad1 3T PCR1 5-ATGCACGATACGUCTCGGGAACGCUGAAGA-3Ad1 5B PCR1 3-TGAAGTCTTGGCGTUACGTGCTATGCA-5Ad1 3T PCR2 5-GCACGATACGUCTCGGGAACGCTGAAGA-3Ad1 5B PCR2 3-TGAAGUCTTGGCGTUACGTGCTATGCA-5Ad1 5B BRIDGE2 3-TCTTGGCGTTA-5Ad1 B CAPTURE 3-TGAAGTCTTGGCGTTACGTGCTATGCAGAGCCCTTGCGACTTCT-5BAd2 3T R ARM 5-TTGCAATGACGTCTCGACTCAGCAGANN-3Ad2 3B R ARM 3dd-CGTTACTGCAGAGCTGAGTCGTCT-5Ad2 5T L ARM 5-GCTCCAGCGGCTAACGATAGCTC-3ddAd2 5B L ARM 3-CCGAGGTCGCCGATTGCTATCGAGTT-5Ad2 3T BRIDGE 5-GACGTCTCGACT-3Ad2 3T PCR 5-AGCTCGAGCAAUGACGTCTCGACUCA-3Ad2 5B PCR 3-CCGAGGTCGCCGATTGCTATCGAGCUCGAGCUCGTTA-5Ad3 3T R ARM 5-TTGACTGCGCTTCGACTGGAGAC-3Ad3 3B R ARM 3dd-CTGACGCGAAGCTGACCTCT-5Ad3 5T L ARM 5-ACTGCTGACGTACTGCGAGC-3ddAd3 5B L ARM 3-NNTGACGACTGCATGACGCTCGTT-5Ad3 3T PCR 5-AAGCTCGAGCUCGAGCGACTGCGCTTCGACTGG-3Ad3 5B PCR 3-TGACGACUGCATGACGCTCUTCGAGCTCGA-5Ad3 5B BRIDGE 3-TGCATGACGCTC-5Ad4 3T PCR 5P-AGACAAGCTCGAGCTCGAGCGATCGGGCCGTACGTCCAACT-3Ad4 3T R ARM 5-TTGCGTCGGGCCGTACGTCCAACTT-3Ad4 3B R ARM 3-CGCAGCCCGGCATGCAGGTTGA-5PAd4 5T L ARM 5P-AGTCGGAGGCCAAGCGGTCGTC-3Ad4 5B L ARM 3-TTCAGCCTCCGGTTCGCCAGCAGTT-5Ad4 5B PCR 3-TCAGCCTCCGGTTCGCCAGAATCCT-5B
Table S1: Library construction oligos. Oligos used in creating and inserting each adaptor are presented.
All oligos were purchased from IDT. Adaptor position indicates the position (3 = 3’, 5=5’) and strand
(T=top, B=bottom) of the oligo relative to the top strand of the inserted adaptor, such that the resulting
ssDNA circles contain the top strand of the adaptor, and the resulting DNBs contain the bottom strand of
the adaptor. Oligos are offset and presented 3’->5’ or 5’->3’, to emphasize their function and relative
position in the adaptor. Oligo termini are labeled with 5 or 3 to indicate orientation, and with P, dd, or B
to indicate 5’ PO4, 3’ dideoxy, or 5’ biotin modification, respectively. Palindromes included to enhance
formation of compact DNBs via 14-base intramolecular hybridization are underlined.
23

SUPPLEMENTAL ONLINE MATERIAL – 1181498S - Drmanac R, et al.
dbSTS ID Locus Chr Start Stop Amp bp Primer1 Primer2 Amp
GC1 kb GC
dbSTS_40424 SHGC-36683 10 89518722 89518797 75 CTTGCTCTGTCAGCCGTACA TGGAAAGACTGTTTGAGCCC 0.46 0.37dbSTS_60513 SHGC-36712 14 19995899 19995978 79 TAACCTCCCCCAAAGACTGA TCCTCCCGACCTTTTTTACC 0.54 0.47dbSTS_58182 SHGC-76075 1 228892429 228892516 87 GTGCTTTCACTGAGAGTGCC CTTATTCCAGCTTCAGAGCG 0.47 0.51dbSTS_44346 SHGC-74825 1 51883085 51883173 88 GAGCAGTGATGATCAGAAAG GTATCAACTCCTTGAAGAGC 0.36 0.45dbSTS_32317 SHGC-56598 10 33619335 33619425 90 CCGACCCTGGTTAATCCAAA GCAAGGTTGTGACCCAATGA 0.46 0.38dbSTS_94495 SHGC-56594 13 46128811 46128901 90 TTAGGGACCATTGGCTACGG GGCCAAACCATGTGGAGTTT 0.49 0.34dbSTS_95402 SHGC-64737 15 32163716 32163806 90 CAACGTCGGGATGACTCAAG ATTTGCACAAACACGGCAAC 0.46 0.35dbSTS_52215 SHGC-64340 2 112591609 112591699 90 GGATATCCCAAAGCAAGGGC TTCAGTCGTGACCATGTGGA 0.43 0.36dbSTS_94366 SHGC-58491 6 136920206 136920296 90 TGGTTTTGTTCCAGTGGTGC TGCAGCAGCTATTGCACTTC 0.41 0.34dbSTS_34545 SHGC-64940 14 53960308 53960399 91 CGCAATCCTTATGCAGGTCA CTTTGGGGTTGGAGTGAAGG 0.4 0.35dbSTS_55622 SHGC-76658 3 425029 425120 91 GGTTAAGCAACCTGCCTAAT TAGAGAACTGTCCAAGGGTT 0.42 0.32dbSTS_95405 SHGC-64749 6 146247850 146247941 91 GCATGGGCCTTCTGAATCTC GCAAGTAAACAGTGGAGCCC 0.45 0.31dbSTS_10891 SHGC-58057 12 31522488 31522580 92 ACTTGGCTCAGCCCCACTTA TAGTGCAATCCCGACTGGTG 0.37 0.39dbSTS_94368 SHGC-58494 12 50487695 50487787 92 CGGCAGCCTCTCTTCTGTTT ATGCTTGGGCAGGTGGTTAC 0.46 0.45dbSTS_94391 SHGC-58546 13 23919189 23919281 92 TCGATCATTGCGAAACAAGG CTGTCTCCGTCAAATGGCAG 0.59 0.42dbSTS_94392 SHGC-58548 13 102148231 102148323 92 ACACTGGGAAAGGAGGCAAA AGCTGAGGTCCTGGTGGAAA 0.51 0.48dbSTS_44804 SHGC-58073 15 58597387 58597479 92 GAGGGCTGCCATGCTATTTC ATGCAAGGTGGAAAAGAGCC 0.46 0.39dbSTS_94445 SHGC-58649 2 96736372 96736464 92 GAGTCAAACAACACGGCAGC TGGGAGCAGAGGTGTGAAGA 0.46 0.51dbSTS_76809 SHGC-57036 2 201400109 201400201 92 TTACTGGCTTGGATGGCTGT CGGCACACAGAATGGAGAAA 0.43 0.38dbSTS_42002 SHGC-64844 4 76626432 76626524 92 GAACTGCACGCGTAGTGTCA TGGAAGCCAATGATGTTTGC 0.38 0.32dbSTS_46570 SHGC-57456 4 107456223 107456315 92 GCAAAATTCTGCCTCCAAGG ATCGCTCTGTCACTGCCTCA 0.48 0.48dbSTS_94322 SHGC-58434 5 126234050 126234142 92 ATTTGCTTTCTTCTGGCGGA CCAAGCCCTTCCTTAAGCCT 0.48 0.42dbSTS_78408 SHGC-56925 9 19366011 19366103 92 TTCCCCTAAGTTCCATGCCA TACAGGGGTTCCTTTCAGGG 0.52 0.37dbSTS_94467 SHGC-58840 9 33768933 33769025 92 CCATCTACTGGATCACGGCA TGGGTGAATTCTTGCACCTG 0.40 0.38dbSTS_35438 SHGC-24154 15 40803081 40803174 93 CTAAATGCCCTGTGCTTGGT AAACCTGACTTTCCCCCTGT 0.54 0.46dbSTS_47229 SHGC-61007 16 492844 492937 93 GCACTCCCAAGTCAATCTGA GTGCTTTAAGTGGGAGAAGA 0.55 0.58dbSTS_14335 SHGC-9599 21 36414870 36414963 93 AGCTTTCTGTCCCCAGATGA TGAGAGTAGCTTGGCTGGGT 0.62 0.50dbSTS_77703 SHGC-57871 5 132474685 132474778 93 TTCAATGAGGGGAAAAACGG CATCCACCCGTTCTGTGAGA 0.43 0.49dbSTS_47845 SHGC-58218 8 9951012 9951105 93 GCATAGCAAAGACACGGCAG ACGTGCATGTTTAAAGGCGA 0.46 0.34dbSTS_6049 SHGC-56435 1 37947507 37947601 94 AATGAGGCCACCAAGCAAGT TGGTCCCTGCCAAGTCTGTA 0.54 0.47
dbSTS_18115 SHGC-57907 1 61699413 61699507 94 ATCAAGCATGGGTACCTGGC TCAGGGGCATTTTCCTTGAC 0.45 0.38dbSTS_70892 SHGC-63664 3 123142651 123142745 94 TGATGGACGGGCAGACATAG CCTCCACCTTTCTCCAATGA 0.48 0.42dbSTS_73691 SHGC-24253 4 124130296 124130390 94 TGGGATAGGGCAAGTACTGG GCAGCACAATGTGGAGAGAA 0.49 0.51
dbSTS_954 SHGC-56583 1 144374149 144374244 95 AAACCAAAAGCCCCACAATG CCTGGCAAGCACTTGATGTC 0.34 0.37dbSTS_27364 SHGC-57340 14 73253243 73253338 95 CATAAAGGGGCCTGAAACCA AATACGAGTGCCTTCGCAGC 0.43 0.45dbSTS_1453 SHGC-60521 16 22913466 22913561 95 AAAGCCTTCCTTCCTCTGGC AAAGGAGTGGGTGCAGGAGA 0.51 0.47
dbSTS_94452 SHGC-58808 16 88561778 88561874 96 TGTGGTCTTCCACAAGGTGC ACACAGCCGGTAAACGGAAT 0.58 0.52dbSTS_73264 SHGC-63641 17 41605535 41605631 96 TGGCACCTTTCAATCTGTGG TTTCATCTGGGAGAAAGGGG 0.47 0.42dbSTS_72616 SHGC-56684 19 54563908 54564004 96 TGCTTGCCAAAAGACTTGGA ATTTGGTCTCGACGTGCTCA 0.43 0.38dbSTS_62182 SHGC-58372 7 28082549 28082645 96 TAGCAAAGCCAGTCATGGGA CACTTGGGGTAAGGCCAAAG 0.43 0.37dbSTS_38812 SHGC-60143 7 75384024 75384120 96 CTGGCAGCAAACATCCTCTG GAAAACAGCAGCATTGACCG 0.47 0.43dbSTS_70499 SHGC-18202 9 101934459 101934555 96 TGAGGCATACAAGAGCGTTG ACTATCCACTCCCTGCCCTT 0.35 0.35dbSTS_94369 SHGC-58496 10 104664993 104665090 97 TTCCAGCCCTTCCATTTCTG GCCTGTGGGTGGTTTTCTTC 0.44 0.41dbSTS_33042 SHGC-58052 11 116596468 116596565 97 CCTCCCGATTTTTGCTCCTA TCTAGCTTGGTTGTGGGGGT 0.47 0.54dbSTS_82784 SHGC-60534 12 68271817 68271914 97 TTTTAGCGCCTGAAAGCCAT CTGTTTCTGGTTGGGTCGGT 0.46 0.37dbSTS_7910 SHGC-57777 13 20201257 20201354 97 ACAGCGAAACTCATTTGCCA TGCCATCATGGAAGAACAGG 0.49 0.46dbSTS_3100 SHGC-24371 15 38632672 38632769 97 AACCTGCCACAAGGAAGATG CTTAAAAAGGGCCAGGTTCC 0.40 0.44
dbSTS_20565 SHGC-57668 2 36845663 36845760 97 ATTAGCAAAGGCTCCCCACA AGGCTGAAAAACACCCTGGA 0.40 0.46dbSTS_18654 D12S1914 12 263814 263905 91 ATCCTCTGATGAAGCCATGG ACCCCAATGTCTGCTGTTTC 0.48 0.40dbSTS_64880 RH67995 2 267874 267973 99 TCAGAGGCAAAGTGGTTCAG AATCAGTCGTTGGCACCTTC 0.46 0.36dbSTS_16871 SHGC-64053 12 891582 891682 100 AGTTGCGTTTGAGCATCCCT CACGAGGTCACGTGTGGAAT 0.46 0.44dbSTS_10701 STS-M78768 10 1165307 1165392 85 ACTGTTTGCCAGCACAGACC CTTTCCAGGGTCAAACTCTC 0.47 0.48dbSTS_14719 STS-M78867 16 2754937 2755009 72 AGGAGTCTGAGGCAAAGCTT CCTAGAACGCCATCTAGAGG 0.51 0.50dbSTS_75084 D7S544E 7 4139901 4139986 85 TGTCTGGTATGGCAATATCC AACTGGCCTGTTAGAGGCAA 0.55 0.49
24

SUPPLEMENTAL ONLINE MATERIAL – 1181498S - Drmanac R, et al.
dbSTS_52480 D11S4356 11 5492338 5492429 91 GGCAAATGAGATGGTCAGGT GCAAGCTCAAGAGATCCCAG 0.51 0.46dbSTS_96961 RH102627 6 7645101 7645185 84 TCAGTTGCAAGCTGGAAGAG TGAGACCCAACCTGTCCTTC 0.49 0.44dbSTS_74808 RH64133 20 7910792 7910857 65 TGTCAACTTCCCTTTGGCCT GAAGCTTGCTCATTCAGGAA 0.42 0.46dbSTS_26563 D11S2033 11 10942554 10942654 100 CAGGCCATTTAAGGTCTTCT GCATGTTCTAACCTATTGCG 0.38 0.42
dbSTS_109217 G49547 4 15029609 15029704 95 GCAAGCTTGTTCCACAATGG GTAGGGAATTGGGGGCATTT 0.44 0.42dbSTS_10547 SHGC-58076 6 15362794 15362893 99 ACTGGCCTTCCTCTTCATGG TTCTTGAGAGCTGGTGCTGC 0.43 0.47dbSTS_62714 RH36253 5 16505510 16505610 100 TAGTGCATGCCCATAGTCGA TGCAGTGGCATGCTTTACTC 0.39 0.38dbSTS_60542 RH47428 18 17702546 17702628 82 TAACGTTGCCTTTTTGAGGG GTGCCTTGTTGGAAGTGTCA 0.36 0.32dbSTS_40842 RH36412 6 20564315 20564415 100 CTTTCTAGGGCTTGAAGGCC TGGGTCTTACCCAGAGATGG 0.44 0.39dbSTS_31045 SHGC-64027 14 21036722 21036813 91 CCCAAAAGCACTGCTCCCTA CCAGGGGGCAGATTCAATAC 0.50 0.39dbSTS_76610 SHGC-60522 16 23056848 23056944 96 TTACACATTTGCAGGGGCAG ATCAATGGCACCTTAGGGCA 0.46 0.34dbSTS_48172 SHGC-60478 16 23585602 23585696 94 GCATTTGGCCATTCTACCGT GCAGGACCCCAATATGGAGA 0.46 0.42dbSTS_2976 D14S1329 14 23619966 23620062 96 AACCCAGCCCACATGACTAG CTCCACCTCCCATTCACTGT 0.62 0.58
dbSTS_14534 SHGC-60508 16 24167956 24168050 94 AGGACACACCCAAACCTGCT TACCCAAAGGACATCACCCC 0.51 0.42dbSTS_95333 G48236 18 26653380 26653480 100 CCTGTTCAATCTGGGCACAA ATGGAGCAAGACGATGCAGA 0.44 0.38dbSTS_33362 STS-M79255 17 26888363 26888447 84 CCTGATCCTTGTGGACGAAT GAGCCCTGTAAATGTGTACT 0.58 0.56dbSTS_7074 STS-M79217 8 28644686 28644777 91 ACAACCGATTCTTACCCTGG AACATGATTTCGTCATGGCG 0.47 0.43
dbSTS_66129 D3S1315 7 28959603 28959693 90 TCCAGGCATTAGGCATTTTC TCCCATTGCAAGTATGGACA 0.48 0.42dbSTS_99545 DMD X 31435382 31435482 100 GGTGAAATTGAAGCTCACAC GTAACAGGACTGCATCATCG 0.44 0.33dbSTS_99541 DMD X 32271180 32271275 95 GGTATCAGTACAAGAGGCAG CCTTTCATCTCTGGGCTCAG 0.45 0.31dbSTS_42866 SHGC-57948 15 32313742 32313842 100 GACAAACCGAACTGGCAGAA AAAAGCCACAATAGGGCAGC 0.43 0.44dbSTS_40176 RH64484 1 32464372 32464464 92 CTTCTCAAGACCAATTCGGC TGGTAGCCCATCTGCTTGTC 0.54 0.52dbSTS_58361 SHGC-13207 2 32753727 32753827 100 GTGGGAAAACAAGGCTCAAA GGACTCAGAATTTGGGGTCA 0.39 0.39dbSTS_25085 D11S2229E 11 33333702 33333772 70 CACTGCTTGTGTTAATGGAG AGCTCTAGTACAGCGTTCAC 0.38 0.30dbSTS_8422 D7S2250 7 35345071 35345120 49 ACATGGTCTGGATGTAGTCA GGTTCGTGCACATAACTGAG 0.48 0.42dbSTS_801 SHGC-74569 1 36101135 36101220 85 AAACAAGCAAAACTGCCTGC GTCAAGGCTGTGCATGAAAA 0.41 0.41
dbSTS_48785 D22S624 22 36130810 36130910 100 GCCCTCCTCACAACAACCTA GATCCTTGGCAAGTCACTTC 0.47 0.57dbSTS_25852 Cda1bg09 9 36153689 36153779 90 CAGATGCCTGCTGTTAAGCC TGCTGAGTGTCCCTGAAACC 0.6 0.54dbSTS_25807 STS-M79042 22 37548264 37548357 93 CAGATACAGTTGATGGGCAG GGAGCGTCTCAAGTGAACAG 0.59 0.61dbSTS_44401 SHGC-52005 21 37548352 37548445 93 GAGCCAGCAGATTGAAATCC CTCTGAAGTTTGCCTGCATC 0.45 0.46dbSTS_87476 RH93622 2 38937503 38937584 81 CCTTTGTTGGATTTGTTGGG CCACAACTCATTCTGGCTGA 0.41 0.41dbSTS_10689 SHGC-64051 22 39057860 39057955 95 ACTGTTGCTGGCAGGTCTGA TGCACGGCTAGGATCAAGAA 0.54 0.46dbSTS_43034 DXS7568 X 39855650 39855747 97 GACACTGGAATAAGTGCAGC TTCCATTGTATGCATGTGCC 0.38 0.43dbSTS_12976 SGC30523 17 40339808 40339908 100 AGCAGCCTGAGGAAACTCAA CTCCACATCCCTGATTCCTG 0.50 0.58dbSTS_56232 RH64488 1 42107935 42108031 96 GTACAGTCTAATGAGTTGGG CACAGAAACTCTTGCAGGTG 0.45 0.43dbSTS_22659 D14S47 14 43567803 43567878 75 CAACATAGCAAGACCCTGTC GCACATGCCACCAAGACAAG 0.50 0.43dbSTS_70883 D11S4606 11 43834547 43834638 91 TGATGCTGATAGCAGATGGC GGCCTTAGCTTCTGGCTTTT 0.36 0.37dbSTS_3864 NIB1885 16 45674296 45674396 100 AAGAGCAGTCTTCTTGTTGC TTTATAGGAAGCACTGCCAG 0.48 0.37
dbSTS_67522 STS-M78744 2 46467139 46467221 82 TCGTTACGTTGACAGGTAGG AGGGCATTTTACCCTTGCAG 0.36 0.41dbSTS_64465 STS-M79003 12 47616289 47616377 88 TCACAGTCATCGCGTTATCC GTTCCTCCTCTGGAATGTAG 0.42 0.49dbSTS_99100 DXS1267 X 47726699 47726755 56 CACAGAGTTGTACAACCATC CAGTGTGATGAACACGTTCT 0.42 0.39dbSTS_95308 G48211 17 47807954 47808053 99 TGAATCCACTCCAATTCCCA AGCTAATTTCCCTCCTCGGG 0.36 0.39
Table S2: QPCR marker details. Markers were selected from dbSTS to be less than 100 bp in length, to
use primers 20 bases in length and with GC content of 45-55%, and to represent a range of locus GC
contents. Start and stop coordinates are from NCBI Build 36. Amplicon GC contents are of the amplified
PCR product, and 1 kb GC contents are calculated from the 1 kb interval centered on the amplicons.
25
SUPPLEMENTAL ONLINE MATERIAL – 1181498S - Drmanac R, et al.
# clones % of clonesAll adaptors intact 143 97.2Adaptor 2 missing 1 0.7
Adaptor 1, 2, 3 missing* 1 0.7Adaptor 1, 2, 3 wrong orientation* 2 1.4
Total 147 100.0
Table S3: Sanger sequencing of library intermediates to assess adaptor structure. See SOM text for
details. 147 of 192 library clones contained at least one high quality Sanger read. 143 of these 147
clones (>97%) contained all 4 adaptors in the expected orientation and order. Moreover, 3 of the 4
clones (*) with aberrant adaptor structure were expected to be eliminated from the library during the
RCR reaction used to generate DNBs, implying about 99% of DNBs were expected to have the correct
adaptor structure. Data derived from NA07022.
Adaptor bp # clones Total bpMutations in:
Mutation rateAdaptor
terminiOther region
All regions
1 44 89 3916 3 2 5 0.13%2 56 89 4984 2 4 6 0.12%3 56 89 4984 0 5 5 0.10%4 66 89 9523 0 8 8 0.08%
Total 222 89 23407 5 19 24 0.10%
Table S4: Sanger sequencing of library intermediates to identify adaptor mutations. Analysis of 89
cloned library constructs for which high quality forward and reverse Sanger sequencing data was
available revealed about one mutation per 1000 bp of adaptor sequence. Also, 5 of the 89 cloned library
constructs (5.6%) had mutations within 10 bp of one of its eight adaptor termini; such mutations might
be expected to affect cPAL data quality. The majority of the adaptor mutations are likely introduced by
errors in oligo synthesis. A much lower mutation rate would be expected to result from 32 cycles of high
fidelity PCR (32*1.3E-6 < 1in 10,000 bp). Data derived from NA07022.
26
SUPPLEMENTAL ONLINE MATERIAL – 1181498S - Drmanac R, et al.
Year reference Technology Sample
Average Reported Coverage
depth (fold)
Reported sequencing
consumables cost
Estimated cost per 40-fold
coverage
2007 S4 Sanger (ABI) JCV 7 $10,000,000 $57,000,0002008 S5 Roche(454) JDW 7 $1,000,000 $5,700,0002008 S6 Illumina NA18507 30 $250,000 $330,0002009 S7 Helicos SRQ 28 $48,000 $69,0002009 this work this work NA07022 87 $8,005 $3,7002009 this work this work NA19240 63 $3,451 $2,2002009 this work this work NA20431 45 $1,726 $1,500
Table S5: Historical human genome sequencing costs that have improved after these genomes
(including this work) were sequenced. JDW costs may include more than consumable costs. Our costs
were calculated from the amount and purchase prices of reagents (including labware and sequencing
substrates) used in generating all raw reads resulting in the reported number of mapped reads.
27
SUPPLEMENTAL ONLINE MATERIAL – 1181498S - Drmanac R, et al.
Variation type NA07022 Variant count (% novel1)
NA19240 Variant count (% novel1)
NA20431 Variant count (% novel1)
SNPs
All 3,076,869 (10%) 4,042,801 (19%) 2,905,517 (10%)Homozygous2 1,097,899 (2%) 1,297,601 (4%) 965,029 (1%)Heterozygous2 1,800,287 (15%) 2,639,864 (27%) 1,657,540 (16%)
Transitions3 2,858,818 3,635,882 2,658,112Transversions3 1,316,837 1,706,195 1,213,232
Coding 18,723 (9%) 23,000 (16%) 16,532 (10%)Non-synonymous 9,286 (11%) 11,400 (19%) 8215 (12%)
Short Insertions 168,909 (37%) 242,391 (40%) 136,786 (37%)Short Deletions 168,726 (37%) 253,803 (44%) 133,008 (36%)
Coding Short Indels 556 (58%) 549 (56%) 435 (59%)Frameshifting Short Indels 310 (62%) 327 (61%) 299 (71%)Block
substitutions4Length conserving 40,103 (42%) 54,054 (39%) 38,449 (33%)Length changing 22,680 (61%) 34,432 (64%) 18,166 (60%)
Table S6: Variations detected relative to Build 36 reference. 1 % novel; Proportion not found in dbSNP
release 129. 2The remainder of SNPs were hemizygous, of unknown zygosity, or opposite a non-SNP
allele. 3Count by allele; homozygous variants contribute 2x, heterozygous 1x. 4Block substitutions are
complex events involving multiple SNPs (length conserving) or multiple indels with or without SNPs
(length changing). Block substitutions are considered novel if they are not consistent with combinations
of one or more dbSNP entries.
28
SUPPLEMENTAL ONLINE MATERIAL – 1181498S - Drmanac R, et al.
500k HapMap phase I&II SNPs
HapMap Infinium subset
NA19240
# reported - 3.8 M 144 K% called - 98.46% 98.45%
% locus concordance - 99.14% 99.85%
HapMap genotype
calls
Homozygous ref - 99.22% 99.92%Heterozygous - 99.62% 99.81%
Homozygous alt - 98.26% 99.79%
NA20431
# reported 475 K - -% called 94.18% - -
% locus concordance 99.75% - -
Array genotype
calls
Homozygous ref 99.88% - -Heterozygous 99.45% - -
Homozygous alt 99.78% - -
Table S7: Concordance with genotypes generated by the HapMap Project (release 24) and the highest quality Infinium assay subset of the
HapMap genotypes or from genotyping on Affy 500k (genotypes were assayed in duplicate, only SNPs with identical calls are considered).
29
SUPPLEMENTAL ONLINE MATERIAL – 1181498S - Drmanac R, et al.
95% confidence interval (exact)
Variation type
Total novel non-synonymous
variations detected in
coding regions
Successful Sanger assays
Variation confirmed
Variation not
confirmed
Novel non-synonymous
false discovery rate (FDR)
Estimated non-
synonymous false
positives in coding regions
Novel false
positive / Mb
Estimated novel false
positives on
genome
Novel variations detected
Estimated novel false
discovery rate
SNPhet 660 132 115 17 13% 8-20% 51-131 2.1-5.3 6k-15k 274,489 2-6%
hom 16 10 10 0 0% 0-31% Insf. Insf. Insf. 18,384 Insf.
Deletionhet 76 49 20 29 59% 44-73% 34-55 1.1-1.7 3k-5k 36,574 8-14%
hom 11 9 9 0 0% 0-34% Insf. Insf. Insf. 8,095 Insf.
Insertionhet 96 50 21 29 58% 43-72% 41-69 1.3-2.2 4k-6k 34,777 11-18%
hom 9 7 5 2 22% 4-71% Insf. Insf. Insf. 6,493 Insf.
Block substitution
het 93 32 20 12 38% 21-56% 20-52 0.6-1.6 2k-5k 16,391 11-29%
hom 3 2 2 0 0% 0-84% Insf. Insf. Insf. 2,985 Insf.
Table S8: Sanger sequencing of variants in NA07022. Non-HapMap variation call accuracy was assessed for 291 loci with Sanger sequencing on a random subset of variants that were novel (with respect to dbSNP build 129) non-synonymous (with respect to the NM_* set of NCBI Build 36.3 annotated transcripts; all indels are treated as non-synonymous changes irrespective of frame change) heterozygous and homozygous (not hemizygous, of unknown zygosity, or part of more complex events). This category of variants is enriched for errors, thus error rates can be extrapolated from a modest amount of targeted sequencing. The extrapolation of errors assumes that error modes are similar within coding sequence and genome-wide as indicated by similar variant quality score distributions. A 95% confidence interval was computed for the resulting novel non-synonymous false discovery rate (FDR), and projected onto the entire set of variants as described above (SOM text). The testing of additional non-coding variants would increase accuracy of the genome-wide FDR estimates.
State Chr Location Gene Alteration Phenotype Notes on Variants
Het 17 37949759 NAGLU R737G Sanfilippo Syndrome B
Identified in a patient with Sanfilippo Syndrome B, in association with a known Sanfilippo variant (S8). Also identified in Watson genome (S9) and NA20431.
30

SUPPLEMENTAL ONLINE MATERIAL – 1181498S - Drmanac R, et al.
Het 9 135291831 ADAMTS13 P426L TTP Identified as part of a compound heterozygote in Thrombotic Thrombocytopenic Purpura patient (S10).
Het 11 66050228 BBS1 M390R Bardet-Beidl Syndrome
Homozygous variant reported as causative for Bardet-Beidl Syndrome in an oligogenic fashion (S11).
Het 19 6664262 C3 L314P C3 structural variant
Codes for a structural variant of C3, of unknown clinical significance. Also identified in NA20431.
Het 2 201782343 CASP10 V410I ALPS type II Reported as recessive for ALPS type II (S12).
Het 2 227624091 COL4A4 G999E TBMD G->E mutations are often causative in TBMD; possibly pathogenic in a heterozygous form (S13). Also identified in Venter genome (S5).
Het 1 97754009 DPYD S534N DPYD deficiency Heterozygote may reduce DPYD expression. Gross et al. (S14) note a severe phenotype in two compound heterozygotes.
Het 15 78259581 FAH R341W FAH deficiency Is a pseudodeficiency allele for FAH and is observed in compound heterozygotes with FAH deficiency (S15).
Het 16 3244464 MEFV R202Q FMF Possibly autosomal recessive causative variant for FMF (S16).
Het 12 55711185 MYO1A S797F early onset hearing loss
Reported as causative for dominant early onset moderate sensorineural hearing loss (S17). Also identified in NA20431.
Het 22 16946288 PEX26 L153V Infantile Refsum Disorder
Reported as part of a compound heterozygote causative of Infantile Refsum Disorder (S18).
Het 19 46550716 TGFB1 R25P hepatic fibrosis Affects TGFβ1 levels. Associated with hepatic fibrosis in chronic HCV infections (S19).
Comp. Het 16 49303427/
49314041 NOD2 R702W/ G908R Crohn's disease Compound heterozygote involving two variants (one with MAF of 0.03) associated with
Crohn's disease (S20).
Het 18 19737949 LAMA3 K2069Xjunctional
epidermolysis bullosa
LAMA3 inactivation is implicated in autosomal recessive Epidermolysis Bullosa (S21). The most C-terminal mutation causative of disease is Q1368X.
Het 10 55296582 PCDH15 Y1181X deafness PCDH15 inactivation is implicated in autosomal recessive deafness (S22). The most C-terminal mutation causative of disease is S647X.
Hom 2 130996158 CFC1 W78R Left-right axis abnormalities
BLOSUM score of 4. CFC1 has 4 OMIM-listed variants that exhibit a dominant expression for left-right axis abnormalities; two of these have incomplete penetrance (S23).
Comp. Het 19 50103781/
50103919 APOE C130R/R176C
Alzheimer’s Disease These variants represent a ApoE4/ApoE2 heterozygote (S24)
Table S9: Summary of impact of coding variants in NA07022. See SOM text for details.
31
SOM Figures
Figure S1: Library construction process details. A. Process schematic; see SOM text for details. B. Oligos
and intermediates in Ad1 insertion; insertion of subsequent adaptors follow similar logic. Adaptor arms
are oriented as they would be in circle formation. 5’, 3’, and 5’-phosphate oligo termini are indicated as
5, 3, 5P, respectively. Phosphodiester linkages to insert sequences are indicated by -> for the top strand
and <- for the bottom strand. Grey sequences are products of previous steps. Oligo names correspond to
details listed in Table S1. Asterisk indicates nick in Ad1 circle ligation product. C. Polyacrylamide gels of
selected library construction intermediates. Marker (M) for each gel contains fragments of 1000, 900,
850, 700, 600, 500, 400, 300, 200, 100, and 80 bp. Original fragmented DNA (F), Ad ligation (L), PCR (P),
USER digestion (U), circularization ligation (C), PlasmidSafe exonuclease treatment (E), AcuI digestion (A),
or EcoP15 digestion (Eco), are indicated, appended by the number of the adaptor involved in the
reaction, where appropriate. L1 demonstrates near complete decoration of DNA with Ad1 arms with
novel nick translation ligation process. Smearing of the bands in the U lanes is characteristic of less
mobile USER products with 15-30b ssDNA overhangs. The low mobility DNA in the C lanes is
characteristic of circular dsDNA; we typically observe >70% conversion of linear to circular dsDNA. The
descreet linear DNA band in the A lanes indicates near complete AcuI methylation and digestion. The
650pb band in the Eco lane indicates incomplete (50%) EcoP15 digestion. P4 depicts the ~300 bp PCR
product used to generate the ssDNA circles that are amplified to form DNBs. Data derived from
NA07022.
Figure S2 QPCR analysis of library construction intermediates. Input genomic DNA and PlasmidSafe-
treated circles were assayed with 96 STS markers. QPCR could not be performed on intermediates after
SUPPLEMENTAL ONLINE MATERIAL – 1181498S - Drmanac R, et al.
EcoP15 digest, as the relevant insert fragments were too short to support amplification by QPCR
primers. This analysis revealed an increase in the concentration of higher GC content markers at the
expense of higher AT content markers in the Ad1 (purple), Ad2 (blue), and Ad3 (black) circles relative to
genomic DNA (red). On average, there was a 1.4 Ct (2.5-fold) difference in concentrations of loci with 1
kb GC content of 30-35% versus those of 50-55%. This bias is similar to the fragment and base level
coverage bias observed in the mapped cPAL data. Data derived from NA07022.
Figure S3: DNB position represents the 70 sequenced positions within one DNB. Read positions of up to
10 bases from an adaptor were detected as described in Section 4. Positions 1 to 5 from an adaptor are
represented by blue bars and positions 6 to 10 from an adaptor are represented by red bars. From left
to right the adaptors and anchor read structures are: ad1 3’(1-5), ad2 5’ (10-6), ad2 5’(5-1), ad2 3’ (1-5),
ad2 3’ (6-10), ad4 5’ (10-6), ad4 5’(5-1), ad4 3’ (1-5), ad4 3’ (6-10), ad3 5’(10-6), ad3 5’ (5-1), ad3 3’ (1-5),
ad3 3’ (6-10), ad1 5’ (5-1). Discordance was determined by mapping reads to the reference (taking the
best match in cases where multiple reasonable hits were found) and tallying disagreements between the
read and the reference at each position. Unchained base reading tolerates sporadic base detection
failures in otherwise good reads. The majority of errors occur in a small fraction of low quality bases.
Data derived from NA07022.
Figure S4: The iterative adaptor insertion and sequencing strategy yields 8 distinct blocks of contiguous
genomic reads. Four blocks comprise each arm of a mate pair. The spacing of the blocks is governed by
read lengths and the distances between the restriction endonuclease recognition sites and cut sites.
33

SUPPLEMENTAL ONLINE MATERIAL – 1181498S - Drmanac R, et al.
While each enzyme used has a preferred cut distance, digestion is seen at lengths slightly greater and
lesser (generally +/-1 of the preferred distance; ~1% of observations outside this range). Rare gaps
between r2-r3 and r6-r7 are presumably created by AcuI double cutting (e.g. first cut at base 13 and
second cut at base 12), as these gaps correlate with rare -3 gaps between r1-r2 and r7-r8. The exact
length distribution for each library is determined by aligning a sample of reads to reference with
permissive mapping settings, and examining only high-quality hits. These distributions are then used as
parameters to guide mapping of the bulk of the data, to reduce both computational cost and frequency
of spurious alignments, as well as to indicate likelihood of a DNB deriving from a hypothesized
sequence. Note that not all of the genomic bases in the library construct are sequenced due to the
limitation of reading a maximum of 10 bases from an inserted adaptor.
Figure S5. A. Cumulative coverage for each genome. The distributions are normalized for facile
comparison. The distribution for Poisson sampling of reads (blue), and for mapping with simulated 400
bp mate-pair DNB reads (purple) are provided for comparison. In NA19240 only a few percent of the
mappable genome is more than 3-fold underrepresented or more than 2-fold overrepresented. B.
Percent coverage of genome, sorted by GC content of 501-base windows plotted against the mean
normalized coverage , reported by cumulative fraction of the genome represented for NA07022 (Green
line) and NA19240 (blue line). NA20431 was similar to NA07022. The principal differences between
these two libraries are in the conditions used for adapter ligation and PCR. NA19240 was processed
using conditions described in SOM, above. In contrast, NA07022 used Taq instead Klenow polymerase
for A tailing at 72°C (minimizing the denaturation of AT rich sequences), and was amplified using twice
the amount of DMSO and Betaine as was used for NA19240, resulting in overrepresentation of high GC
content regions of the genome. C. The power to detect Infinium SNPs with heterozygous (brown,
34
SUPPLEMENTAL ONLINE MATERIAL – 1181498S - Drmanac R, et al.
triangle) or homozygous (blue, circle) Infinium genotypes as a function of actual coverage depth at the
variant site in NA07022. Single-allele calls (one alternate allele, one no-called allele) are considered
detected if they passed the call threshold (SOM).
Figure S6: The proportion of insertions and deletions at sizes that are multiples of three is enhanced in
coding sequence, reflecting their less disruptive impact. Data derived from NA07022.
Figure S7: Anomalous mapping of mate-paired arms can be used to call larger and more complex
variations than is possible with unmated arms. Here mapping evidence for a 1,500 bp heterozygous
deletion on chromosome 1 is shown (A). A pair of PCR primers was designed such that one primer lies
adjacent to (but outside of) each end of the putative deletion. The presence of two PCR products at the
expected lengths confirms the deletion (B). Data derived from NA07022.
Figure S8: Concordance of 1M Infinium SNPs with called variants by percent of data sorted by variant
quality score. The percent of discordant loci can be decreased by using variant quality score thresholds
that filter the percent of the data indicated. Note the differently scaled y-axes. Data derived from
NA07022.
35
SUPPLEMENTAL ONLINE MATERIAL – 1181498S - Drmanac R, et al.
Figure S9: The proportion of variation calls that are novel (not corroborated by dbSNP, release 129)
varies with variant quality score threshold. The variant quality score can be used to select the desired
balance between novelty rate and call rate. Each point on the plots is the number of known and novel
variations detected at a single variant quality score threshold. The dotted lines are an extrapolation of
the novel rate from the highest-scoring 20% of known variation calls. Note that novelty rate is not a
direct proxy for error rate (Tables 3, S8) and that variant quality score has a different meaning for
different variant types. Data derived from NA07022.
Figure S10: Schematic of six-adaptor read structure that increases read length from 70 to 104 bases per
DNB. Each arm of the DNB has two inserted adaptors (Ad2+Ad3 and Ad4+Ad5) that support assaying
13+13+26 bases per arm. All inserted adaptors (Ad2-Ad5, in the order of insertion) are introduced with
the same IIS enzyme (e.g. AcuI. The alternative use of MmeI increases the number of assayable bases
per arm to 18+18+26 or per DNB to 124) with the following steps recursively on an automated
instrument: IIS cutting of DNA circles, directional adaptor ligation, PCR, USER digestion, selective
methylation, and DNA circularization. The reaction time per adaptor can be as low as 10 hr per batch of
96 libraries in an automated system, yielding sufficient throughput to support multiple advanced
sequencing instruments. Each directionally inserted adaptor substantially extends the read length of
SBS or SBL in addition to cPAL.
36

SUPPLEMENTAL ONLINE MATERIAL – 1181498S - Drmanac R, et al.
Figure S11: Tight distribution of DNB size range. Signal is measured as direct hybridization of Cy3
labeled, adaptor-specific probe. Times are from synchronized reaction initiation (SOM).
Figure S12: A. Composite 4-color image of a scanned array showing high occupancy of patterned array
positions. B. Cluster-plot of normalized intensities from a high-density test array with 700nm center-to-
center spot distance. This array has 3.4 fold more DNA spots per image than 1.29 micorn arrays. It uses
only 4.2 pixels per spot and generates similar raw base discordances.
37