&^ch6(cv »-^^fx. joint program in oceanography/ applied
TRANSCRIPT

MIT/WHOI 2004-01
Massachusetts Institute of Technology Woods Hole Oceanographic Institution
&^CH6(cv
OfTtC^^
Joint Program in Oceanography/
Applied Ocean Science and Engineering
»-^^fX.
1930
DOCTORAL DISSERTATION
Observations and Modeling of Wave-Acceleration-Induced Sediment Transport
in the Surfzone
by DISTRIBUTION STATEMENT A
Approved for Public Release Distribution Unlimited
Fernanda G. Hoefel
February 2004 BEST AVAILABLE COPY
20040810 Oil

MIT/WHOI 2004-01
Observations and Modeling of Wave-Acceleration-Induced Sediment Transport
in the Surfzone
by
Fernanda G. Hoefel
Massachusetts Institute of Technology Cambridge, Massachusetts 02139
and
Woods Hole Oceanographic Institution Woods Hole, Massachusetts 02543
February 2004
DOCTORAL DISSERTATION
Funding was provided by the Army Research Office (DAAD1999-1-0250 and DAAD19-03-10072); the Office of Naval Research, Coastal Dynamics and Coastal Geosciences Programs (N00014-02-10145); the
National Ocean Partnership Program (B-428260); the National Science Foundation, Physical Oceanography (OCE-O115850); and fellowships from Conselho Nacional de Desenvolvimento Cientifico (CNPq)-Brazil (201085/97-6), and from the Academic Programs Office of the Woods Hole Oceanographic
Institution.
Reproduction in whole or in part is permitted for any purpose of the United States Government. This thesis should be cited as: Fernanda G. Hoefel, 2004. Observations and Modeling of Wave-Acceleration-lnduced
Sediment Transport in the Surfzone. Ph.D. thesis. MIT/WHOI, 2004-01.
Approved for publication; distribution unlimited.
Approved for Distribution:
Robert S. Detrick, Chair
Department of Geology and Geophysics
,.^Jiu jpJl^^^Jbi^ Paola Malanotte-Rizzoli John W. Farrington MIT Director of Joint Program WHOI Dean of Graduate Studies
Observations and Modeling of Wave-Acceleration-Induced Sediment Transport in the Surfzone
by
Fernanda Gemael Hoefel
B.S., Fundacao Universidade do Rio Grande, Brazil, 1996 M.S., Universidade Federal do Rio de Janeiro, Brazil, 1998
Submitted in partial fulfillment of the requirements for the degree of
Doctor of Philosophy
at the
MASSACHUSETTS INSTITUTE OF TECHNOLOGY
and the
WOODS HOLE OCEANOGRAPHIC INSTITUTION
February 2004
©WHOI, 2004.
Author '^^l^y^^'Sh:^..: Joint Program in Oceanography/Applied Ocean Science and Engineering
Massachusetts Institute of Technology and Woods Hole Oceanographic Institution
February, 2004
Certified by ... .^^,S?>v..-.. L^J^^I^J^^ yY Steve Elgar ^ Thesis Supervisor
Accepted by 'X).'7,rj^..^.:.M^.<^ Dan McCorkle
Chair, Joint Comittee for Marine Geology and Geophysics Woods Hole Oceanographic Institution

Observations and Modeling of Wave-Acceleration-Induced Sediment
Transport in the Surfzone
by
Fernanda Gemael Hoefel
Submitted on February, 2004, in partial fulfillment of the requirements for the degree of
Doctor of Philosophy
Abstract
Onshore sediment transport and sandbar migration are important to the morphological evolution of beaches, but are not understood well. Here, a new model that accounts for accelerations of wave-orbital velocities predicts onshore sandbar migration observed on an ocean beach. In both the observations and the model, the location of the maximum acceleration-induced transport moves shoreward with the sandbar, resulting in feedback between waves and morphology that drives the bar shoreward until conditions change. A model that combines the effects of transport by waves and mean currents simulates both onshore and offshore bar migration observed over a 45-day period. A stochastic nonlinear Boussinesq model for the evolution of waves in shallow water is coupled with the wave-acceleration-driven sediment transport model to predict observed onshore sediment transport and sandbar migration given observations of the offshore wave field and initial bathymetry. The Boussinesq-wave model has skill in predicting wave spectra, as well as velocity and accceleration statistics across the surfzone, but it underpredicts acceleration skewness on top of the sandbar. As a result, the coupled wave-sediment transport model underpredicts sediment transport, and thus fails to move the sandbar onshore. Although the coupled wave and sediment model can be tuned to yield skillful predictions of onshore sandbar migration, in general, closer agreement between observed and modeled statistics of the wave field is essential for the successful application of wave models to predict sediment transport.
Thesis Supervisor: Steve Elgar

Acknowledgements
First things first. Steve Elgar greatly contributed to every aspect of this thesis (certainly
to every sentence). I appreciate very much his generosity, commitment, and invaluable
guidance. It has been my privilege to have him as an advisor.
Other people contributed in different but equally important ways. I am grateful to all
of them: my thesis committee members, Rob Evans, Edith Gallagher, Ole Madsen, Britt
Raubenheimer, and Albert Williams, for the advice, comments, and for all they taught
me; Tom Herbers and Mark Orzech for providing the Boussinesq-wave model, and for
helping me to understand and implement it; Joe Calantoni, Daniel Conley, Tom Drake,
Diane Foster, Bob Guza, Steve Henderson, Tom Herbers, Tom Hsu, Tim Maddux, Pieter
Nielsen for all the valuable discussions and comments; the staff of the Academic Programs
Office, WHOI, the Joint Committee for Marine Geology and Geophysics (JCMG&G),
Susan Humphris and Dan McCorkle for the integral support at all times.
Many thanks to Bob Guza, Tom Herbers, Edith Gallagher, and Britt Raubenheimer for
providing the field observations, and also to the staffs of the Center for Coastal Studies,
Scripps Institution of Oceanography, and US Army Corps of Engineers Field Research
Facility for the excellent logistical support provided during arduous field conditions.
My family and friends (old and new ones) have always made life worthed. It was no
different during the last five years, obrigada. For you, meu querido Tom Corbett, I have
two words: I do.
Financial support was provided by the Army Research Office (DAAD1999-1-0250
and DAAD19-03-10072); the Office of Naval Research, Coastal Dynamics and Coastal
Geosciences Programs (N00014-02-10145); the National Ocean Partnership Program (B-
428260); the National Science Foundation, Physical Oceanography (OCE-0115850); and
fellowships from Conselho Nacional de Desenvolvimento Cientifico (CNPq) - Brazil (201085/
97-6), and from the Academic Programs Office of the Woods Hole Oceanographic Institu-
tion.

Contents
1 Introduction 8
1.1 Thesis Outline 9
1.2 Background 10
1.3 Data and Methods 14
2 Wave-Acceleration-Induced Sediment Transport and Sandbar Migra-
tion 22
2.1 Introduction 23
2.2 Acceleration-based Sediment Transport Model 25
2.3 Results 26
2.4 Discussion 29
3 Coupled Boussinesq-Wave and Sediment Transport Model Applied to
Onshore Sandbar Migration 40
3.1 Introduction 41
3.2 Boussinesq Wave Model 42
3.3 Sediment Transport Model 44
3.4 Field Observations and Data Analysis 45
3.5 Coupled Wave and Sediment Transport Model Implementation 46
3.6 Model Application 46
3.7 Summary 54
A Combined Energetics and Acceleration Model Performance 59
4

List of Figures
1-1 Observed wave and near-bottom cross-shore velocity and acceleration statis-
tics from Duck, N.C 13
1-2 Bathymetric map of the field site located near Duck, N.C, on 20 September
1994 15
1-3 Cross-shore variation of mean grain size and settling velocity 17
2-1 Schematic of the feedbacks that drive ofiFshore and onshore surfzone sandbar
migration 24
2-2 Observed and predicted cross-shore bottom elevation profiles during an on-
shore bar migration event (22 to 27 Sep 1994) 27
2-3 Acceleration skewness and bottom elevation profiles during an onshore
sandbar migration event (between 22 and 27 Sep, 1994) 28
2-4 Acceleration skewness and bottom elevation profiles during an offshore
sandbar migration event (between 10 and 15 Oct, 1994) 29
2-5 Observed and predicted total bottom elevation changes versus cross-shore
position during an offshore sandbar migration event 30
2-6 Observed and predicted cross-shore bottom elevation profiles on 10 Oct and
15 Oct 1994 31
2-7 Observed wave height, cross-shore sandbar crest position, and observed and
predicted bottom elevation changes at four cross-shore locations between
01 Sep and 15 Oct 1994 32

2-8 Observed and predicted cross-shore bottom elevation profiles on 01 Sep and
15 Oct 1994 33
2-9 Time-averaged cross-shore distribution of normaUzed velocity and acceler-
ation skewness between 22 and 27 September 1994 34
2-10 Root mean square bottom roughness near the sandbar between 20 and 25
September 1994 35
3-1 Observed and modeled wave spectra near the sandbar crest, cross-shore
distribution of velocity skewness, velocity asymmetry and seafloor elevation
between 23 and 27 September 1994 48
3-2 Observed and modeled Uspike, associated rates and gradients of sediment
transport, and seafloor elevation versus cross-shore position between 23
and 27 September 1994 50
3-3 Observed and modeled dimensional acceleration skewness, and cross-shore
gradients of associated sediment transport versus normalized cross-shore
distance 51
3-4 Observed and predicted (by the data-driven sediment transport model and
by the coupled wave-sediment transport model) cumulative change in seafloor
elevation at two cross-shore locations versus time during an onshore sand
bar migration event, between 22 and 27 September 1994 52
3-5 Observed and predicted (by the data-driven sediment transport model and
by the coupled wave-sediment transport model) bottom elevation profiles
during an onshore sandbar migration event, between 22 and 27 September
1994 53
3-6 Observed and predicted (by the data-driven sediment transport model and
by the coupled wave-sediment transport model) bottom elevation profiles
during an onshore sandbar migration event, between 22 and 27 September
1994 for /c = 0.4 Hz 54
A-1 Combined energetics and acceleration sediment transport model skill as a
function of model constants ka and Ucrit ^^
6

Chapter 1
Introduction
Sand bars are ubiquitous morphologic features of sandy beaches. They protect the adja-
cent beach from direct wave attack and are important expressions of sediment transport
patterns in the surfzone, migrating back and forth across the beach responding to and
affecting waves and currents, both of which cause sediment transport and morphological
evolution, including beach erosion and accretion. Consequently, understanding the pro-
cesses that cause cross-shore bar migration is necessary to model and predict the behavior
of sandy beaches on time scales from days to months.
During high energy wave events, strong offshore directed mean flows (undertow) cause
rapid offshore motion of shore-parallel sand bars [Thornton et al., 1996, Gallagher et al.,
1998a], whereas during periods of low energy waves, bars move slowly onshore, often
becoming crescentic [Wright and Short, 1984, Lippmann and Holman, 1990]. However,
the mechanisms responsible for onshore sediment transport and bar migration are not
understood, and thus many state-of-the-art models fail to predict the observed beach
changes. When bars move onshore undertow is usually weak, and thus oscillatory flows
must be the dominant hydrodynamic forcing [Gallagher et al., 1998a, Elgar et al., 2001].
The goal of this thesis is to understand and model the wave-orbital velocity-driven
mechanisms responsible for onshore sediment transport and cross-shore sandbar migra-
tion in the surfzone. The central hypothesis to be tested is that fluid accelerations asso-
ciated with pitched-forward waves in the surf zone result in onshore sediment transport

on a natural beach. Nearly continuous observations of waves, near-bottom velocity, and
bathymetry collected along a cross-shore transect on a sandy, barred beach near Duck,
NC, during the fall of 1994 are used to pursue the following specific objectives:
• Implement and test an acceleration-based sediment transport model that explains
onshore sediment transport and bar migration;
• Combine an existing energetics-type cross-shore sediment transport model [Bagnold,
1966, Bowen, 1980, Bailard, 1981], known to have skill in predicting offshore bar mi-
gration, with the acceleration-based sediment transport model to reproduce observed
patterns of off and onshore sandbar migration during extended periods of time;
• Couple a stochastic Boussinesq wave-shoaling model [Herbers and Burton, 1997,
Herbers et al., 2003] with the acceleration-based sediment transport model to repro-
duce observed onshore bar migration given offshore wave conditions and the initial
bathymetry.
1.1 Thesis Outline
The remainder of this chapter presents relevant theoretical background for the accomplish-
ment of the objectives outlined above, followed by a Data and Methods section. Results are
introduced in Chapters 2 and 3 in the form of two independent articles. Model calibration
is discussed in Appendix A.
Chapter 2, "Wave-Acceleration-Induced Sediment Transport and Sandbar Migration,"
an extension of Hoefel and Elgar [2003], discusses the effects of wave-acceleration on
onshore sediment transport in the surfzone, and the implementation of an acceleration-
based sediment transport model that predicts onshore sandbar migration observed on an
ocean beach. The model is forced with observed near-bottom fluid accelerations and tested
by comparison with observed bathymetric changes. The acceleration-based model is then
combined with an energetics sediment transport formulation that reproduces observed
sediment transport patterns over a 45-day period during which the sandbar moved offshore
during storms, and onshore between storms.

Chapter 3, "Coupled Boussinesq-Wave and Sediment Transport Model Applied to On-
shore Sandbar Migration," describes the coupling of a stochastic Boussinesq wave model
[Berbers and Burton, 1997, Berbers et al., 2003] to the acceleration-based sediment trans-
port model to predict observed onshore bar migration given observations of the offshore
wave field and initial bathymetry.
1.2 Background
The hydrodynamic processes that contribute to cross-shore sediment transport in the near-
shore zone include wave-orbital velocities over a range of frequencies, mean currents, and
wave breaking-induced turbulence [Bowen, 1980, Bailard, 1981, Roelvink and Stive, 1989,
Wright et al, 1991, Thornton et al., 1996, Gallagher et al., 1998a, Ruessink et al, 1998].
During storms, breaking-wave-driven undertow carries suspended sediment offshore
[Dally and Dean, 1984, Thornton et al., 1996, Gallagher et al., 1998a]. Cross-shore gradi-
ents in undertow, which is maximum just onshore of the bar crest [Thornton et al., 1996,
Feddersen et al, 1998, Gallagher et al., 1998a], result in net transport of sediment from
onshore to offshore of the bar crest, causing the bar to move offshore. As the bar moves off-
shore, the locations of wave breaking (on the bar crest) and maximum undertow (onshore
of the bar crest) also move offshore, resulting in feedback that promotes continued offshore
bar migration as long as there is breaking-induced undertow. Energetics-type sediment
transport models [Bowen, 1980, Bailard, 1981], originally developed to describe transport
under unidirectional river flow [Bagnold, 1966], accurately predict offshore migration of
sandbars observed during storms [Stive, 1986, Russel et al., 1995, Thornton et al., 1996,
Gallagher et al, 1998a].
For low energy wave conditions, when the bar is observed to move slowly onshore,
wave breaking on the bar and corresponding offshore mean currents are reduced, and
sediment transport is predominantly caused by oscillatory flows [Aagaard et al., 1998,
Gallagher et al., 1998a]. This transport is usually attributed to the skewed wave orbital
velocities associated with the sharp peaks and flat troughs of nonlinear shallow water waves
[Bailard, 1981]. In the absence of strong mean flows, a sediment transport formulation

that depends on an odd power of wave-orbital velocity predicts more transport under
the larger onshore velocities associated with the sharply peaked wave crests than under
the flat, broad, wave troughs, when velocities are ofFshore. However, velocity-skewness
based sediment transport models, such as the energetics model, fail to predict onshore bar
migration events observed within the surfzone [Roelvink and Stive, 1989, Russel et al.,
1995, Thornton et al., 1996, Gallagher et al., 1998a], mostly owing to the absence of
significant cross-shore gradients of velocity skewness near the sand bar.
As waves shoal, their shapes and orbited velocities evolve from skewed profiles in inter-
mediate water depths, to asymmetric, pitched-forward shapes in the surfzone [Elgar and
Guza, 1985, Elgar et al., 1988]. The sawtooth-like shape of nearly breaking and broken
waves is associated with large fluid accelerations and decelerations during the passage of
the steep wave faces, followed by relatively smaller decelerations during the passage of
the gently sloping rear of the wave, producing a skewed acceleration profile. Field ob-
servations [Hanes and Huntley, 1986, Elgar et al., 2001, Foster et al., 2002], laboratory
experiments [Madsen, 1974, Cox et al., 1991, King, 1991, Sleath, 1999], and numerical
simulations [Drake and Calantoni, 2001, Hsu and Hanes, in preparation] suggest that fluid
accelerations may have a significant effect on sediment transport.
Two-phase sheet flow simulations [Hsu and Hanes, in preparation] corroborate previ-
ous field observations [Madsen, 1974, Foster et al., 2002] that indicate severe bed failure
under the large flow accelerations, or horizontal pressure gradients, that precede maxi-
mum onshore velocities of near-broken waves in the surfzone. If sediment is mobilized by
accelerating flows, it is expected that transport will be larger when velocities are onshore
directed (just after strong accelerations and decelerations) than during ofFshore directed
flows, resulting in net onshore transport. Discrete-particle computer simulations of sheet
flow under unsteady oscillatory flows [Drake and Calantoni, 2001] support this hypoth-
esis and led to the parameterization of acceleration effects of pitched-forward waves in
sediment transport as a function of a dimensional form of acceleration skewness (dis-
cussed in Chapter 2). Eff'ects of flow acceleration on bedload sediment transport have also
been accounted for in a modified, time-varying Shields paramenter [Nielsen, 2002, Nielsen
and Callaghan, 2003] used in a Meyer-Peter-type transport formulation to yield sediment
10

transport predictions.
Observations along a cross-shore transect of the beach near Duck, N.C., extending from
the shoreline to 8-in water depth [Elgar et al., 2001], show that acceleration skewness is
maximum near the bar crest for a wide range of hydrodynamic conditions and bar crest
positions (Figure 1-1). The distribution of cross-shore gradients of acceleration skewness
is consistent with erosion offshore (negative gradients) and accretion onshore (positive
gradients) of the bar crest (Figure 1-ld). Net onshore sandbar migration would result
when mean flows are weak {e.g. between days 50 and 60 in Figure 1-1). In contrast, the
correlation between bar crest position and location of maximum velocity skewness is low,
and cross-shore gradients in velocity skewness could not account for onshore bar migration
(not shown, Elgar et al. [2001]).
Energetics Sediment Transport Model
Energetics sediment transport models are among the most used in the surfzone. The orig-
inal approach was developed by Bagnold [1966] for unidirectional flows, and later it was
adapted for oscillatory flows by Bowen [1980] and Bailard [1981]. The model relates sedi-
ment transport to fluid power, and it can be written such that it explicitly discriminates
between mean-flow, oscillatory-flow, and gravity induced suspended load and bedload.
Each term is expressed as a function of odd powers of fluid velocity, sediment character-
istics, and efficiency factors that represent the ratio of energy expended in transporting
sediment as bedload and suspended load to the total rate of energy production by the
stream, given by e^ and Cg, respectively. The total sediment transport rate, Q, is given by
[Bagnold, 1966]
where subscripts b and s refer to bedload and suspended load, respectively, ps and p axe
the sediment and fluid density, respectively, (j> is the internal friction angle of the sediment,
/? is the bed slope, W is the sediment fall velocity, and « is the fluid velocity. The last
term, w, is the rate of dissipation of energy by the fluid via bed friction and sediment flux.
11

.-Ml
-401
-201
0.91
0.01
-o.sl
0.05 F
0.001
-o.osl
30 40 50 60 70 Time (days since 1 Aug 1994)
Figure 1-1: Observed wave and near-bottom cross-shore velocity and acceleration statistics from Duck, N.C. (a) Significant wave height of 3-hour long records of sea-surface eleva- tion fluctuations observed in 5-m water depth versus time. Contours of (b) mean current (negative values are offshore-directed), (c) acceleration skewness, and (d) cross-shore gra- dient of the acceleration skewness as a function of cross-shore location and time. The cross-shore location of the sandbar crest is indicated by the solid curve on each contour plot. In panel d yellow-red contours imply accretion (mostly onshore of the bar crest), and blue-green contours imply erosion (offshore of the bar crest), consistent with onshore motion of sediment, especially when mean currents (panel b) are weak (e.g., between days 50 and 60) (from Elgar et al. [2001]).
For unsteady, oscillatory flows w is a time-varying quantity given by
,-r |3 W(t) = 'r(f)W(t) = pCf\u(^t)
where r is the bed shear stress, Cf is the drag coefficient, and W(t), the velocity vector,
consists of u and v components, parallel to the x (cross-shore) and y (alongshore) axes.
Following this, the time-averaged, cross-shore volume sediment transport per unit width
per unit time is given by [Bowen, 1980, Bailard, 1981]
12

Q, = K,{{\u\\) + {\ufu) - 1^(1^1')} + Ks{{\u\\) + {\u\\) - ^tanP{\u\')} (1.2)
where u and u are the mean and oscillatory components of the cross-shore near-bottom
velocity, respectively, tan /3 is the local cross-shore beach slope, and angle brackets indicate
time average. The coefficients Kb and Ks are
Bailard [1982] suggested that eft = 0.13 and Cg = 0.01, similar to the results of Bagnold
[1966] for unidirectional flows. Church and Thornton [1993], Thornton et al. [1996], and
Gallagher et al. [1998a] have used e^ = 0.135, e^ = 0.015, Cj = 0.003, and tan^ = 0.63.
The cross-shore transport, Qx (eq. 1.2) is a hnear combination of bedload and sus-
pended load, each driven by skewed oscillatory velocities, mean currents, and gravity.
The energetics model assumes an instantaneous response of the sediment to the flow and
yields a vertically integrated estimate of the transport. Although details of the suspended
sediment concentration are not considered, the model uses the ratio between fluid velocity
and sediment fall velocity as a surrogate.
1.3 Data and Methods
Pertinent information about observations and data processing techniques are described
in Chapters 2 and 3. This section describes general information or details not discussed
elsewhere.
Data were collected as part of the Duck94 field experiment conducted on a micro-
tidal (ze, tidal range < 1 m) ocean beach located near Duck, on the Outer Banks of North
Carolina, during the fall of 1994. The beach, roughly oriented north-south, can present one
or two sandbars located between 30 and 400 m offshore. The mean foreshore slope of the
beach is approximately 4° (1:12) and the mean slope offshore of the bars is approximately
0.3° (1:170) [Lippmann et al., 1993].
13
1000
I 900
U.
£ V) w 3 <
400 100 200 300 400 500 600 700 800 900 1000
Cross-shore distance (FRF coordinates, m)
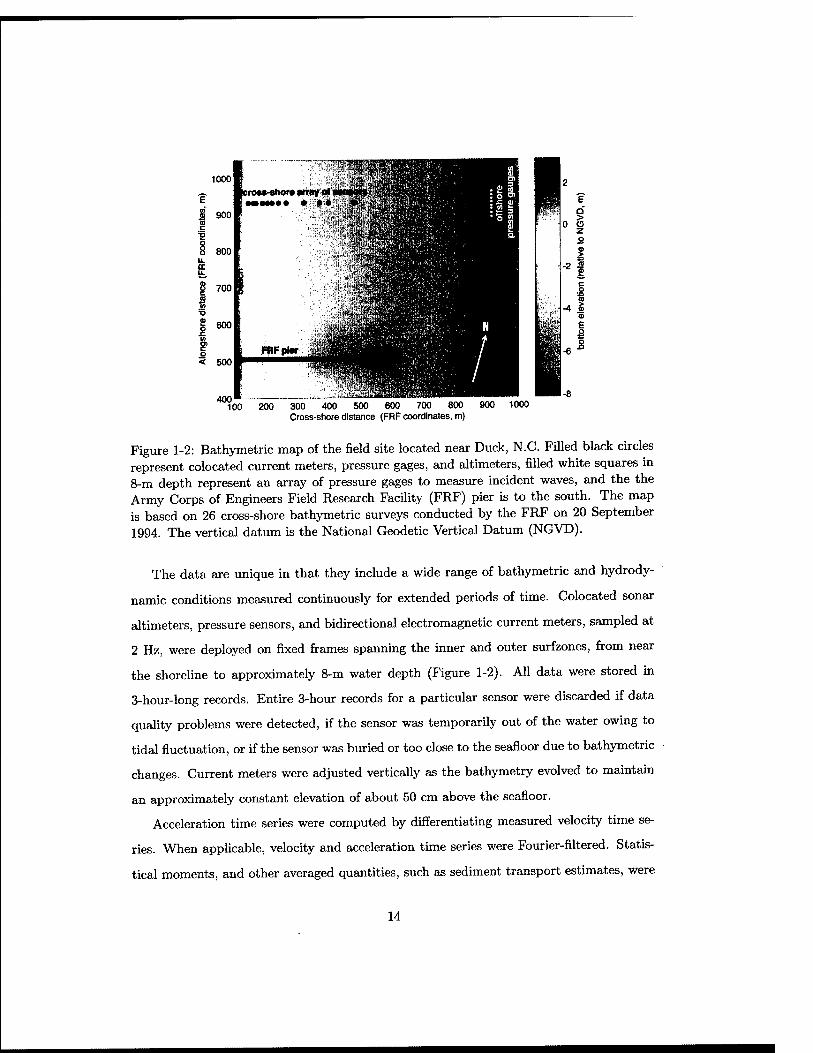
Figure 1-2: Bathymetric map of the field site located near Duck, N.C. Filled black circles represent colocated current meters, pressure gages, and altimeters, filled white squares in 8-m depth represent an array of pressure gages to measure incident waves, and the the Army Corps of Engineers Field Research Facility (FRF) pier is to the south. The map is based on 26 cross-shore bathymetric surveys conducted by the FRF on 20 September 1994. The vertical datum is the National Geodetic Vertical Datum (NGVD).
The data are unique in that they include a wide range of bathymetric and hydrody-
namic conditions measured continuously for extended periods of time. Colocated sonar
altimeters, pressure sensors, and bidirectional electromagnetic current meters, sampled at
2 Hz, were deployed on fixed frames spanning the inner and outer surfzones, from near
the shoreline to approximately 8-m water depth (Figure 1-2). All data were stored in
3-hour-long records. Entire 3-hour records for a particular sensor were discarded if data
quality problems were detected, if the sensor was temporarily out of the water owing to
tidal fluctuation, or if the sensor was buried or too close to the seafloor due to bathymetric
changes. Current meters were adjusted vertically as the bathymetry evolved to maintain
an approximately constant elevation of about 50 cm above the seafloor.
Acceleration time series were computed by diflterentiating measured velocity time se-
ries. When applicable, velocity and acceleration time series were Fourier-filtered. Statis-
tical moments, and other averaged quantities, such as sediment transport estimates, were
14

computed over 3-hour long records. Data gaps were linearly interpolated in time and
space.
Based on sediment transport estimates at each sensor location, cross-shore gradients
in transport were computed for the mid-points between sensors, and then interpolated
back to match sensor locations following Gallagher et al. [1998a].
The seafloor location under each altimeter (averaged over the approximately 6-cm di-
ameter circular footprint of the altimeter) was estimated for every 3-hour period [Gallagher
et al., 1996]. Spatially dense surveys were obtained as often as daily using a GPS mounted
on the Coastal Amphibious Buggy (CRAB). These surveys were used in conjunction with
altimeter measurements to estimate sandbar crest positions.
Surface sediment samples collected along the surveyed beach transect show small tem-
poral variation of cross-shore distribution of grain sizes (not shown) but significant spatial
variation, with poorly sorted medium sand in the swash and inner surf zones and well-
sorted fine sand seaward (Figure l-3a). Gallagher et al. [1998a] demonstrated improved
energetics model performance by taking into account cross-shore grain size variations.
The same procedure is adopted here. Sediment fall velocities were computed according to
Jimenez and Madsen [2003] (Figure l-3b).
Limited observations show significant temporal and spatial cross- and alongshore vari-
ations of bedform distribution during the fall of 1994 and 1997 [Thornton et al., 1998,
Gallagher et al., 1998b, 2003] that include the occurrence of plane beds, wave-orbital
ripples (length scale 0(0.1 m),vertical scale 0(0.01 m)) , and megaripples (length scale
0(1 m), vertical scale 0(0.01 m)). For example, under small waves {Hg < 1 m) and
weak currents (8 Oct 1994) megaripples were observed in the trough and seaward slope
of the bar crest, and small ripples were observed on the bar crest, whereas 200 m to
the south, in similar water depths, the seafloor displayed a uniform distribution of small
ripples, even though the large scale bathymetry was alongshore homogenous [Thornton
et al., 1998]. Under moderate storm waves {Hs ~ 2 m) and strong alongshore currents
(0.5 to 1 m/s), Thornton et al. [1998] observed wave-orbital ripples superimposed on
straight-crested megaripples in the inner trough region, lunate megaripples oriented in
the direction of the alongshore current on the outer trough, and plane beds seaward of
15

100 200 250 300 350 400
Cross-Shore position (m)
450 500
Figure 1-3: (a) Mean grain size and (b) sediment fall velocity, W, versus cross-shore position for samples collected in September 1994.
the bar crest (no observations were made on the bar crest). Following a storm (Hs ~ 4
m), megaripples were observed along the axis of a rip current, with plane beds farther
alongshore [Thornton et al., 1998].
Correlations of root-mean-squaxe (RMS) bed roughness with mobility number^ and
Shields parameter^ estimated from measurements over a 500 by 700 m area during the
fall of 1997 [Gallagher et al., 2003] suggest the transition from megaripples to plane beds
occurs at mobility numbers ~ 150 and Shields parameter ~ 0.5. However, no distinction
of regimes can be made below those transitions because the correlation between RMS
roughness and mobility number or Shields parameter is poor.
'Mobility number: rp = ''^s-tuD ' where U and V are the total (wave and current) instantaneous cross- and alongshore velocity components, respectively, s is the specific gravity, D is the mean grain diameter, g is the acceleration of gravity, and angle brackets denote time average.
^Shields parameter: 0 = p(,J\)yg, where r is the bed shear stress.
16

Bibliography
T. AagEiard, J. Nielsen, and B. Greenwood. Suspended sediment transport and nearshore
bar formation on a shallow intermediate-state beach. Marine Geology, 148:203-225,
1998.
R.A. Bagnold. An Approach to the Sediment Transport Problem from General Physics.
U.S. Geological Survey, 1966. Professional Paper 422-1.
J.A. Bailard. An energetics total load sediment transport model for a plane sloping beach.
Journal of Geophysical Research, 86(C11):10938-10954, 1981.
J.A. Bailard. Modeling of on-offshore sediment transport in the surf zone. In Proceedings of
the 18th International Conference in Coastal Engineering, pages 1419-1438. American
Society of Civil Engineering, 1982.
A.J. Bowen. Simple models of nearshore sedimentation of beach profiles and longshore
bars. In S.B. McCann, editor. The Costaline of Canada, pages 1-11. Geological Survey
of Canada Paper 10-80, Ottawa, 1980.
J.C. Church and E.B. Thornton. Effects of breaking wave induced turbulence within a
longshore current model. Coastal Engineering, 20:1-28, 1993.
D. T. Cox, N. Kobayashi, and H. Mase. Effects of fluid accelerations on sediment transport
in surf zones. In Coastal Sediments' 91, pages 447-461. ASCE, 1991.
W.R. Dally and R.D. Dean. Suspended sediment transport and beach profile evolution.
Journal of Waterway, Port and Coastal Engineering, 110:15-33, 1984.
17

T. G. Drake and J. Calantoni. Discrete particle model for sheet flow sediment transport
in the nearshore. Journal of Geophysical Research, 106(C9):1985&-19868, 2001.
S. Elgar, E. Gallagher, and R.T. Guza. Nearshore sandbar migration. Journal of Geo-
physical Research, 106(C6): 11623-11627, 2001.
S. Elgar and R.T. Guza. Observations of bispectra of shoaling surface gravity waves.
Journal of Fluid Mechanics, 161:425-448, 1985.
S. Elgar, R.T. Guza, and M.H. Preilich. Eulerian measurements of horizontal accelerations
in shoaling gravity waves. Journal of Geophysical Research, 93(C8):9261-9269, 1988.
F. Feddersen, R.T. Guza, S. Elgar, and T.H.C. Herbers. Alongshore momentum balances
in the nearshore. Journal of Geophysical Research, 103:15667-15676, 1998.
D.L. Foster, R.A. Holman, and A.J. Bowen. Field evidence for plug flow. Eos. Transactions
AGU, 83(47), Fall Meeting SuppL, Abstract OS72C-02, 2002.
E. Gallagher, S. Elgar, and R.T. Guza. Observations of sand bar evolution on a natural
beach. Journal of Geophysical Research, 103(C2):3203-3215, 1998a.
E.L. Gallagher, W. Boyd, S. Elgar, R.T. Guza, and B. Woodsward. Performance of a
sonar altimeter in the nearshore. Marine Geology, 133:241-248, 1996.
E.L. Gallagher, S. Elgar, and E.B. Thornton. Megaripple migration in a natural surfzone.
Nature, 394:165-168, 1998b.
E.L. Gallagher, E.B. Thornton, and T.P. Stanton. Sand bed roughness in the nearshore.
Journal of Geophysical Research, 108(C2):3039, doi:10.1029/2001JC001081 2003.
D.M. Hanes and D.A. Huntley. Continuous measurements of suspended sand concentration
in a wave dominated nearshore environment. Continental Shelf Research, 6(4):585-596,
1986.
T.H.C. Herbers and M.C. Burton. Nonlinear shoaUng of directionally spread waves on a
beach. Journal of Geophysical Research, 102(C9):21101-21114, 1997.
18
T.H.C. Berbers, M. Orzech, S. Elgar, and R.T. Guza. Shoaling transformation of wave
frequency-directional spectra. Journal of Geophysical Research, 108(C1):3013, 2003.
F. Hoefel and S. Elgar. Wave-induced sediment transport and sandbar migration. Science,
299:1885-1887, 2003.
T. Hsu and D.M. Hanes. The effects of wave nonlinearity and flow acceleration on coastal
sheet flow sediment transport. Journal of Geophysical Research, in preparation.
J.A. Jimenez and O.S. Madsen. A simple formula to estimate settling velocity of natural
sediments. Journal of Waterway, Port, Coastal and Ocean Engineering, 129(2):70-78,
2003.
D. B. King. Studies in oscillatory flow bed load sediment transport. PhD thesis, University
of California, San Diego, 1991.
T.C. Lippmann and R.A. Holman. The spatial and temporal variability of sand bar
morphology. Journal of Geophysical Research, 95(C7): 11575-11590, 1990.
T.C. Lippmann, R.A. Holman, and K.K. Hathaway. Episodic, nonstationary behavior of
a double bar system at Duck, North Carolina, USA. Journal of Coastal Research, 15
(SI):49-75, 1993.
O.S. Madsen. Stability of a sand bed under breaking waves. In Proceedings of the 14th
International Conference on Coastal Engineering, pages 776-794. American Society of
Civil Engineering, 1974.
P. Nielsen. Shear stress and sediment transport calculations for swash zone modelling.
Coastal Engineering, 45:53-60, 2002.
P. Nielsen and D.P. Callaghan. Shear stress and sediment transport calculations for sheet
flow under waves. Coastal Engineering, 47:347-354, 2003.
J.A. Roelvink and M.J.F. Stive. Bar-generating cross-shore flow mechanics on a beach.
Journal of Geophysical Research, 94(C4):4185-4800, 1989.
19

B.G. Ruessink, K.T. Houwman, and P. Hoekstra. The systematic contribution of trans-
porting mechanisms to the cross-shore sediment transport in water depths of 3 to 9 m.
Marine Geology, 152:295-324, 1998.
P. Russel, Y. Foote, and D. Huntley. An energetics approach to sand transport on beaches.
In Costal Dynamics'95, pages 829-840, 1995.
J.F.A. Sleath. Conditions for plug flow formation in oscillatory flow. Continental Shelf
Research, 19:1643-1664, 1999.
M.J.F. Stive. A model for cross-shore sediment transport. In 20th International Conference
on Coastal Engineering, pages 1550-1564. American Society of Civil Engineering, 1986.
E.B. Thornton, R.T. Humiston, and W. Birkemeier. Bar/trough generation on a natural
beach. Journal of Geophysical Research, 101(C5):12097-12110, 1996.
E.B. Thornton, J.L. Swayne, and J.R. Dingier. Small-scale morphology across the surf
zone. Marine Geology, 1998:173-196, 1998.
L.D. Wright, J.D. Boon, S.C. Kim, and J.H. List. Modes of cross-shore sediment transport
on the shoreface of the Middle Atlantic bight. Marine Geology, 96:19-51, 1991.
L.D. Wright and A.D. Short. Morphodynamics variability of surf zones and beaches: A
synthesis. Marine Geology, 56:93-118, 1984.
20

Chapter 2
Wave-Acceleration-Induced
Sediment Transport and Sandbar
Migration
Parts of this chapter were reprinted with permisssion from: F.Hoefel and S.Elgar, Wave-Induced Sediment Transport and Sandbar Migration, Science 299: 1855-1887 (21 Mar 03). Copyright 2003 American Association for the Advancement of Science.
Abstract
Onshore sediment transport and sandbar migration are important to the morphological evolution of beaches, but are not understood well. Here, a model that accounts for fluid accelerations in waves predicts the onshore sandbar migration observed on an ocean beach. In both the observations and the model, the location of the maximum acceleration-induced transport moves shoreward with the sandbar, resulting in feedback between waves and morphology that drives the bar shoreward until conditions change. A model that combines the effects of transport by waves and mean currents simulated both onshore and offshore bar migration observed over a 45-day period.
21

2.1 Introduction
Surfzone sand bars protect beaches from wave attack, and are a primary expression of
cross-shore sediment transport. During storms, intense wave breaking on the bar crest
drives strong undertow that carries sediment seaward, resulting in offshore sandbar migra-
tion [Thornton et al, 1996, Gallagher et al., 1998a] (Figure 2-la). If the beach morphology
is in equilibrium, the offshore migration is balanced by slower onshore transport between
storms [Aubrey, 1979, Wright and Short, 1984]. However, the causes of shoreward sedi-
ment transport and sandbar migration are not known, and thus models for beach evolution
are not accurate [Roelvink and Stive, 1989, Wright et al., 1991, Thornton et al., 1996, Gal-
lagher et al., 1998a].
As waves enter shallow water, their shapes evolve from sinusoidal to peaky, with sharp
wave crests separated by broad, flat wave troughs. It has been hypothesized that the
larger onshore velocities under the peaked wave crests transport more sediment than the
offshore velocities under the troughs [Bowen, 1980, Bailard, 1981]. However, models that
account for the onshore-skewed velocities do not accurately predict onshore bar migration
observed near the shoreline and in the surfzone [Roelvink and Stive, 1989, Wright et al.,
1991, Thornton et al., 1996, Gallagher et al., 1998a], although skewed velocities may be
important outside the surfzone [Trowbridge and Young, 1989]. As waves continue to
shoal and break, they evolve from profiles with sharp peaks to asymmetrical, pitched-
forward shapes with steep front faces. Water rapidly accelerates under the steep wave
front, producing high onshore velocities, followed by smaller decelerations under the gently
sloping rear of the wave [Elgar et al., 1988, 2001] (Figure 2-lb). Large accelerations
generate strong horizontal pressure gradients that act on the sediment [Madsen, 1974,
Drake and Calantoni, 2001, Nielsen, 2002]. Although the precise mechanisms are not fully
understood, it has been hypothesized that if accelerations increase the amount of sediment
in motion [Hallermeier, 1982, Hanes and Huntley, 1986, Drake and Calantoni, 2001, Elgar
et al., 2001], there will be more shoreward than seaward transport under pitched-forward
waves.
22

B
OFFSHORE Sandbar Migration
Gradients in currents move the sandbar offshore
Onshore accelarations are stronger than offshore accelerations
ONSHORE Sandbar Migration
icceleration skewness is onshiord & maximum near the.bar aest
Gradients in acceleration skewness move the sandbar onshore
Figure 2-1: Schematic of the feedbacks that drive sandbar migration, (a) Large waves in storms break on the sandbar, driving a strong offshore directed current (undertow) that is maximum just onshore of the bar crest [Gallagher et al., 1998a]. The cross-shore changes (gradients) in the strength of the undertow result in erosion onshore, and deposition offshore of the sandbar crest, and thus offshore bar migration. The location of wave breaking and the maximum of the undertow move offshore with the sandbar, resulting in feedback between waves, currents, and morphological change that drives the bar offshore until conditions change, (b) Small waves do not break on the bar, but develop pitched- forward shapes. Water rapidly is accelerated toward the shore under the steep front face of the waves, and decelerates slowly under the gently sloping rear faces. Thus, the time series of acceleration is skewed, with larger onshore than offshore values (rectangular panel). The cross-shore gradients in acceleration skewness (maximum on the bar crest) result in erosion offshore, and deposition onshore of the bar crest, and thus onshore bar migration. The location of the peak in acceleration skewness moves onshore with the sandbar, resulting in feedback between waves, currents, and morphological change that drives the bar onshore until conditions change. 23

2.2 Acceleration-based Sediment Transport Model
A surrogate for the effects of acceleration in pitched-forward waves is a dimensional form
of acceleration skewness [Drake and Calantoni, 2001] (ie, the difference in the magnitudes
of accelerations under the front and rear wave faces), Qspike = (a^)/(a )> where a is
the time series of acceleration and angle brackets denote averaging. Discrete-particle
computer simulations of bedload transport driven by asymmetrical waves characteristic of
surfzones indicate that sediment flux is proportional to Uspike once a threshold for sediment
motion is exceeded [Drake and Calantoni, 2001]. Unlike the monochromatic waves used
in the numerical simulations, accelerations in random waves in a natural surfzone can
be skewed either positively (onshore) or negatively (offshore). Thus, the expression for
cross-shore (x) acceleration-driven bedload sediment transport Qa{x) suggested by the
numerical simulations is extended to account for random waves by including a term that
depends on the sign (ie, the direction) of agpike, yielding,
kaittspike - Sgn[aspike]acrit) ioT \aspike\ > 0,crit ,_ ^ . Qa{x) ^ \ ^ , , ^ ^
0 for \aspike\ < 0,crit
where ka is a constant, sgnQ is the sign of the argument, and aa-u is a threshold that
must be exceeded for initiation of transport. By comparing model predictions with ob-
servations (see Appendix A for discussion on model calibration), the optimal values of
ka = 1.40X10"'* m s and of aa-it = 0.20 m s"^ were determined. These parameter values
are within a factor of 5 of those suggested by the highly idealized discrete particle numer-
ical simulations [Drake and Calantoni, 2001] {ka = 0.26X10-^ m s, aa-u == 1-00 m s'^).
Differences may be owing to random waves, a distribution of sediment grain sizes and
shapes, and breaking-induced turbulence in the ocean. If it is assumed that gradients in
alongshore transport are negligible, mass conservation in the cross-shore direction yields
dh _ 1 dQa{x) /g 2) dt n dx
where dh/dt is the change in bed elevation h with time t, and /x = 0.7 is a sediment packing
24

factor. Extensions to Equation 2.2 to account for alongshore changes are straightforward,
but not necessary for the small alongshore gradients in transport inferred for the observa-
tions discussed here [Gallagher et al., 1998a].
2.3 Results
To test the hypothesis that the cross-shore distribution of near-bottom accelerations result
in overall onshore sediment transport and sandbar migration when mean currents are weak,
morphological change predicted by the acceleration-based model (Equations 2.1, 2.2) was
compared with observations made along a cross-shore transect extending about 400 m
from the shoreline to 5-m water depth on the North Carolina coast [Gallagher et al.,
1998a]. The model was initialized (i = 0) with observed bathymetry and driven with
accelerations observed with near-bottom mounted current meters (Figure 2-2). During
a 5-day period with approximately 75-cm-high waves and cross-shore mean currents less
than 30 cm s~^, the observed onshore sandbar migration of about 30 m was predicted
accurately (Figure 2-2). A widely used energetics sediment transport model (Equation
1.2; Bagnold [1966], Bowen [1980], Bailard [1981], Thornton et al. [1996], Gallagher et al.
[1998a]) that accounts for transport both by velocity skewness (but not acceleration) and
by mean currents predicted no significant changes to the cross-shore depth profile, and
thus failed to predict the observed bar migration [Gallagher et al., 1998a] (not shown).
Addition of acceleration effects (Equation 2.1) to the energetics sediment transport model
results in skilful predictions (Figure 2-2).
During the onshore bar migration event, acceleration skewness {agpike) increased from
small values offshore to a maximum near the bar crest, and then decreased toward the
shoreline, producing cross-shore gradients in transport that are consistent with erosion
offshore and accretion onshore of the bar crest (Figure 2-3). The peak in acceleration
skewness moved shoreward with the bar crest (Figure 2-3), resulting in feedback between
wave evolution and bathymetry that promoted continued onshore sediment transport and
bar movement until conditions changed (Figure 2-lb). Feedback also occurs between
wave-breaking induced offshore-directed mean currents (maximum just onshore of the bar
25
I ■■■ ̂ — Observed 22 Sep c \ ^»u.^ —■ Observed 27 Sep o -2 V^^^^'V — Pred: ace, 27 Sep to %»«=—^^ .— Pred: energ + ace, 27 Sep S> -3 ^^ « ^^^^
1-4 ^****>»,^^^
m -5 A AA • ▲ A A A A • ^^'"^•^^^ ^
150 200 250 300 350 400 450 500 Cross-shore position (m)
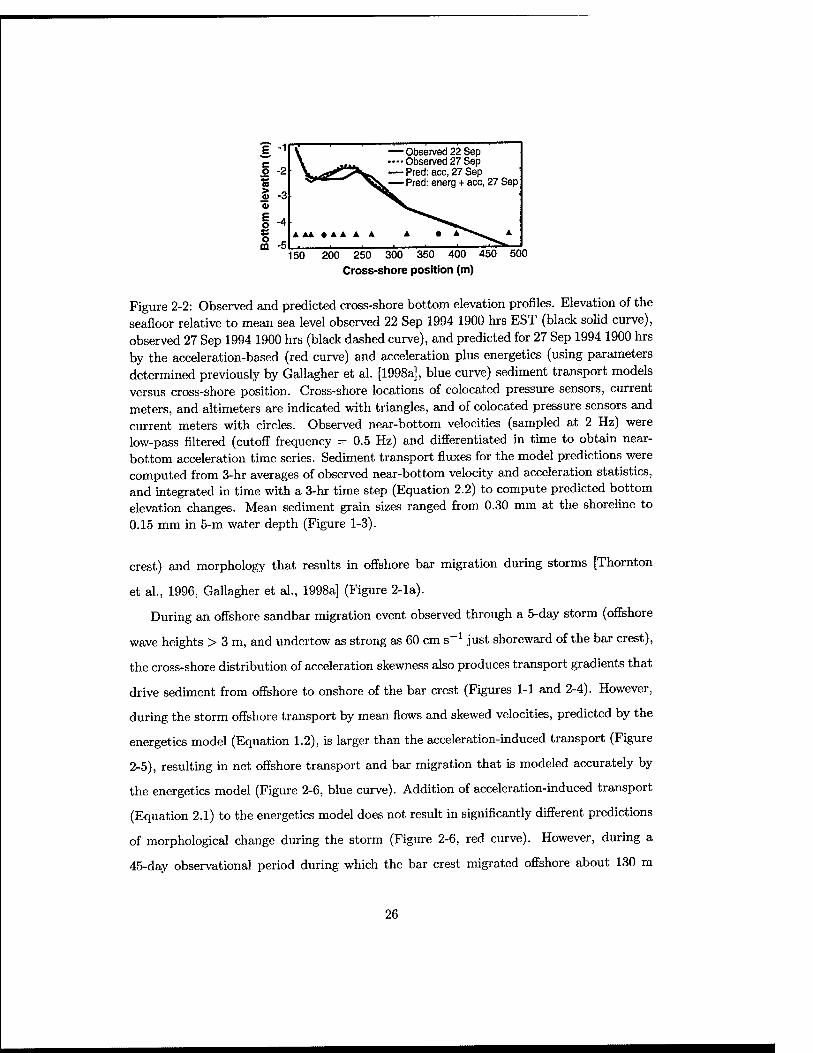
Figure 2-2: Observed and predicted cross-shore bottom elevation profiles. Elevation of the seafloor relative to mean sea level observed 22 Sep 1994 1900 hrs EST (black solid curve), observed 27 Sep 1994 1900 hrs (black dashed curve), and predicted for 27 Sep 1994 1900 hrs by the acceleration-based (red curve) and acceleration plus energetics (using parameters determined previously by Gallagher et al. [1998a], blue curve) sediment transport models versus cross-shore position. Cross-shore locations of colocated pressure sensors, current meters, and altimeters are indicated with triangles, and of colocated pressure sensors and current meters with circles. Observed near-bottom velocities (sampled at 2 Hz) were low-pass filtered (cutoff frequency = 0.5 Hz) and differentiated in time to obtain near- bottom acceleration time series. Sediment transport fluxes for the model predictions were computed from 3-hr averages of observed near-bottom velocity and acceleration statistics, and integrated in time with a 3-hr time step (Equation 2.2) to compute predicted bottom elevation changes. Mean sediment grain sizes ranged from 0.30 mm at the shoreline to 0.15 mm in 5-m water depth (Figure 1-3).
crest) and morphology that results in offshore bar migration during storms [Thornton
et al, 1996, Gallagher et al., 1998a] (Figure 2-la).
During an offshore sandbar migration event observed through a 5-day storm (offshore
wave heights > 3 m, and undertow as strong as 60 cm s"^ just shoreward of the bar crest),
the cross-shore distribution of acceleration skewness also produces transport gradients that
drive sediment from offshore to onshore of the bar crest (Figures 1-1 and 2-4). However,
during the storm offshore transport by mean flows and skewed velocities, predicted by the
energetics model (Equation 1.2), is larger than the acceleration-induced transport (Figure
2-5), resulting in net offshore transport and bar migration that is modeled accurately by
the energetics model (Figure 2-6, blue curve). Addition of acceleration-induced transport
(Equation 2.1) to the energetics model does not result in signiflcantly different predictions
of morphological change during the storm (Figure 2-6, red curve). However, during a
45-day observational period during which the bar crest migrated offshore about 130 m
26

E o
— Observed 22 Sep - - Observed 24 Sep ■ ■■'Observed 27 Sep
150 200 250 300 350 400
Cross-shore position (m)
Figure 2-3: Acceleration skewness and bottom elevation profiles during an onshore sandbar migration event, (a) Observed acceleration skewness (a^pifce), (b) cross-shore gradient of acceleration skewness, and (c) seafloor elevation relative to mean sea level versus cross- shore position. The solid curves are observations from 22 Sep 1900-2200 hrs, dashed curves are 24 Sep 1300-1600 hrs, and dotted curves are 27 Sep 1900-2200 hrs.
during storms and onshore about 40 m when waves and mean flows were small (Figure
2-7a), resulting in a net offshore migration of 90 m, the combined energetics plus acceler-
ation model has significantly higher skill than energetics alone in predicting the evolution
of the cross-shore profile. Although the energetics model without acceleration-induced
transport predicted the offshore migration, it had limited skill predicting the total change
to the beach over 45 days because it failed to predict onshore migration between storms
[Gallagher et al., 1998a]. The energetics model extended to include acceleration effects
does better predicting the change in the seafloor both onshore and offshore of the bar crest
(Figure 2-7), and the overall evolution of the cross-shore bottom elevation profile (Figure
2-8).
27

1 60
40
20
0
-20
\ A
/ f ^ „..•••"—••■■..
A
\y^ •m /
150 200 250 300 350 400 Cross-shore position (m)
Figure 2-4: Acceleration skewness and bottom elevation profiles during an offshore sandbar migration event, (a) Observed acceleration skewness {aspike), (b) cross-shore gradient of acceleration skewness, and (c) seafloor elevation relative to mean sea level versus cross- shore position. The sohd curves are observations from 10 Oct 2200-0100 hrs, dashed curves are 14 Oct 0400-0700 hrs, and dotted curves are 15 Oct 2200-0100 hrs.
2.4 Discussion
The development of sediment transport models has strong empirical character and re-
lies on physical insights and quantitative data obtained in laboratory and field studies
[Bowen, 1980, Bailard, 1981, Hallermeier, 1982, Trowbridge and Young, 1989, Dibajnia
and Watanabe, 1992, Thornton et al., 1996, Gallagher et al., 1998a, Ribberink, 1998,
Dohmen-Janssen, 1999, Malarkey et al., 2003, Nielsen and Callaghan, 2003].
Onshore sediment transport under oscillatory flows has been attributed to skewed
(sharp-peaks) near-bottom wave-orbital velocities in the shoaling and surf zones [Bowen,
1980, Bailard, 1981, Dibajnia and Watanabe, 1992, Ribberink, 1998]. Laboratory mea-
surements of transport of fine (0.15 < D50 < 0.20 mm) sand by second-order Stokes
28

o O) c a c u c o a >
UJ
-100L.
Cross-shore position (m)
Figure 2-5: Total bottom elevation changes observed and predicted by the combined energetics and acceleration model between 10 Oct 1994, 2200 hours and 15 Oct 1994, 2200 hours versus cross-shore position. Observed bottom elevation changes are shown by the dotted black curve, and changes predicted by individual sediment transport model terms are shown by solid curves: mean-flow-driven changes (green), velocity skewness-driven changes (blue), acceleration skewness-driven changes (red), and total changes (black).
(skewed) waves is consistent with velocity skewness-driven models, which relate sediment
transport to an odd power of velocity [Ribberink, 1998, Hassan, 2003], but transport of
fine (D^Q = 0.24 mm) and medium (D50 = 0.44 mm) sand under asymmetrical (pitched-
forward) waves is not [King, 1991, Ribberink et al., 2000]. For a perfectly asymmetrical
wave (ie, no skewness), time averaged odd powers of velocity would be zero, and thus
velocity-skewness based transport formulations would predict no transport. Sand trans-
port under pitched-forward waves is modeled more accurately by accounting for fluid
accelerations [Nielsen, 1992, 2002]. During the passage of the steep front face of a pitched-
forward wave, abrupt accelerations that precede maximum onshore velocities produce thin-
ner boundary layers (ie, enhanced bed shear stress) and greater pressure gradients than
those produced during the passage of the gently sloping rear face of the wave. A modified
shear stress formulation that includes these fluid acceleration effects describes sediment
transport in the swashzone [Nielsen, 2002], where waves can have strongly skewed accelera-
tions [Raubenheimer, 2002], and explains bedload transport rates of fine sand (D50 = 0.24
29

150 200 250 300 350 400 450 500 Cross-shore position (m)
Figure 2-6: Observed and predicted cross-shore bottom elevation profiles. Seafloor el- evation relative to mean sea level observed 10 Oct 1994, 2200 hrs (solid black curve), observed 15 Oct 1994, 2200 hrs (dashed black), and predicted for 15 Oct 1994, 2200 hrs by the energetics (blue) and energetics plus acceleration (red) models versus cross-shore
position.
mm) observed under pitched-forward laboratory waves [Nielsen and Callaghan, 2003].
In the surfzone, waves are skewed as well as asymmetric [Elgar and Guza, 1985, El-
gar, 1987], including during the onshore sandbar migration observed between 22 and 27
September 1994 (Figures 2-2 and 2-9a). However, morphological change requires gra-
dients in sediment transport, and thus depends primarily on the spatial distribution of
hydrodynamic forcing. During the onshore sandbar migration event, cross-shore gradients
in normalized velocity skewness were small and uncorrelated with sandbar crest position
(Figure 2-9b), and therefore were unlikely to have caused net onshore sediment transport
and bar migration. In contrast, gradients in normalized acceleration skewness were larger
than those in velocity skewness, and imply onshore bar migration (Figure 2-9b).
The precise mechanisms of sediment transport that result in the observed onshore
sandbar migration are not understood. Observations by SCUBA divers suggest there was
little suspended sediment, and none more than a few cm above the seafloor, consistent with
measurements for a range of conditions at this site [Conley and Beach, 2003]. Immediately
before the sandbar started to migrate shoreward, the seafloor was smoothed by strong
currents (offshore wave height about 2.3 m), and remained relatively smooth for at least a
50-m wide cross-shore section centered on the bar crest during the onshore bar migration
(wave heights about 0.75 m) (Figure 2-10). It is hypothesized that bedload dominated
sediment transport when the sandbar migrated onshore.
30

E
m X
c o IS 250 •
m
E o^ o at c (0 £ O
> lU
Sep02 Sep 12 Sep 22 Date in 1994
Oct02 Oct12
■ Observed ■ Pred: energetics ' Pred: energ + ace
X = 320 m
Sep 02 Sep 22 Oct12
Date in 1994 Sep 02 Sep 22 Oct12
Date in 1994
Figure 2-7: Observed wave height, cross-shore sandbar crest position, and observed and predicted bottom elevation changes at four cross-shore locations between 01 Sep 1900 hrs and 15 Oct 2200 hrs. (a) Significant wave height (4 times the standard deviation of 3-hr long records of sea-surface elevation fluctuations in the frequency bands between 0.01 and 0.3 Hz) observed in 5-m water depth and (b) cross-shore position of the sandbar crest versus time. The bar crest position was estimated from spatially dense surveys conducted with an amphibious vehicle approximately bi-weekly, combined with 3-hour-long estimates of seafloor elevation from altimeter measurements [Gallagher et al., 1998a] (Figure 2-2). The shorehne fluctuated (owing to a 1 m tide range) about cross-shore location a;=125 m. Observed (black circles) and predicted (blue curve for energetics model, red curve for combined energetics and acceleration model) cumulative change in seafloor elevation at cross-shore locations (c) 2;=161, (d) a;==220, (e) a:=265, and (f) a;=320 m. Parameters in the energetics model are the same as those in [Gallagher et al., 1998a].
31

-Observed 01 Sep ■ Observed 15 0ct -Pred: energ,15 0ct "Pred: energ + ace, 15 Oct
150 200 250 300 350 400 450 Cross-shore position (m)
Figure 2-8: Observed and predicted cross-shore bottom elevation profiles spanning a 45- day period. Seafloor elevation relative to mean sea level observed 01 Sep 1900 hrs (solid black curve), observed 15 Oct 2200 hrs (dashed black), and predicted for 15 Oct 2200 hrs by the energetics (blue) and energetics plus acceleration (red) models versus cross-shore
position.
Although the details of transport predicted by discrete particle simulations [Drake
and Calantoni, 2001] may not be strictly applicable to fine grains transported in a viscous
regime, pressure gradients produced by accelerating flows mobilize and move sediment
regardless of grain size. Theory [Madsen, 1974], numerical models [Drake and Calantoni,
2001], laboratory measurements [Sleath, 1999], and field observations [Foster et al., 2002]
suggest that horizontal pressure gradients can cause a sand bed to become fluidized such
that resistance to stress is greatly reduced, thus mobilizing sediment. Sediments in un-
steady flows respond to forces associated with flow-induced drag, particle stress (either
via collisions for coarse grains or via vicosity of interstitial fluid for concentrated fine
grains), and horizontal pressure gradients (caused by accelerating flows). Fine particles
respond rapidly (order 0.01 s for 0.2 mm diameter sand) to both drag and particle stresses
in concentrated regions. These forces tend to balance each other, potentially allowing
slower-acting (order 1 s for ocean waves) horizontal pressure gradient forces to dominate
[Hsu and Hanes, in preparation]. In the laboratory [Sleath, 1999] and the field [Foster
et al., 2002] blocks or plugs of fine sediment have been observed to move under waves
with strong accelerations. Under the pitched-forward waves commonly observed in the
surfzone, strong accelerations of near-bottom fluid occur immediately prior to and during
onshore-directed wave velocities. Consequently, mobilized sediment will be transported
shoreward, consistent with the observations.
32

150 200 250 300 350 400 Cross-shore position (m)
450
Figure 2-9: Cross-shore distribution of normalized fluid velocity and acceleration skewness (calculated as the mean cube of the demeaned velocity and acceleration time series , respectively, normalized by the variance [Elgar and Guza, 1985]). (a) Near-bottom velocity skewness (dashed curve) and velocity acceleration skewness (solid), (b) cross-shore gradient of velocity (dashed) and acceleration (solid) skewness, and (c) elevation of the seafloor relative to mean seal level versus cross-shore position. Values are averages of observations made between 22 September 1994 1900 hrs EST and 27 September 1994 1900 hrs {ie, during the onshore sandbar migration). Positive gradients (panel b) imply accretion and negative gradients imply erosion. The vertical arrows indicate the position of the sandbar crest.
33

i3^ w w CD C
JZ D1 D O
C/)
2 r
0
-40
OO
—1 ' ' ' 1 ' ' ' 1 ' ■T"^ g X = 265 m (offshore bar fooe) 9 X = 240 m (crest of sand Ijjr) ^ X = 220 m (onshore bar face) O X = 170 m (trough onshore of bar)
° O
o 5K O m
. •••■•■!
oooooo o o
"'!5iiij;|*i|i5^iii Bar starts to move onshore
■20 0 20 Time (hrs)
40 60
Figure 2-10: Roughness of the seafloor near the sandbar. Root-mean square (rms) seafloor roughness (bedform heights are about 4 times the rms [Gallagher et al., 2003]) versus time before and during the onshore bar migration (time = 0 hrs corresponds to 22 September 1994 1900 hrs EST). Roughness was estimated as the root-mean-square of time series of seafloor location determined by altimeters mounted on fixed frames offshore (squares), on the crest (filled circles), onshore (asterisks), and in the trough (open circles) of the sandbar (the cross-shore positions listed in the legend correspond to those in Figure 2- 9). The roughness estimation assumes ripples migrate beneath the altimeters [Gallagher et al., 1998b].
34

Bibliography
D.G. Aubrey. Seasonal patterns of onshore/offshore sediment movement. Journal of
Geophysical Research, 84(C10):6347-6354, 1979.
R.A. Bagnold. An Approach to the Sediment Transport Problem from General Physics.
U.S. Geological Survey, 1966. Professional Paper 422-1.
J.A. Bailard. An energetics total load sediment transport model for a plane sloping beach.
Journal of Geophysical Research, 86(C11):10938-10954, 1981.
A.J. Bowen. Simple models of nearshore sedimentation of beach profiles and longshore
bars. In S.B. McCann, editor, The Costaline of Canada, pages 1-11. Geological Survey
of Canada Paper 10-80, Ottawa, 1980.
D.G. Conley and R.A. Beach. Cross-shore sediment transport partitioning in the
nearshore during a storm event. Journal of Geophysical Research, 108(C3):3065,
doi:10.1029/2001JC001230, 2003.
M. Dibajnia and A. Watanabe. Sheet flow under nonlinear waves and currents. Coastal
Engineering, 12:2015-2029, 1992.
M. Dohmen-Janssen. Grain size influence on sediment transport in oscillatory sheet-flow,
phase-lags and modebile-bed effects. PhD thesis, Delft University of Technology, 1999.
T. G. Drake and J. Calantoni. Discrete particle model for sheet flow sediment transport
in the nearshore. Journal of Geophysical Research, 106(C9):19859-19868, 2001.
35

S. Elgar. Relationships involving third moments and bispectra of a harmonic process. IEEE
Transactions on Acoustics, Speech and Signal Processing, ASSP-35(12):1725-1987, 1987.
S. Elgar, E. Gallagher, and R.T. Guza. Nearshore sandbar migration. Journal of Geo-
physical Research, 106(C6):11623-11627, 2001.
S. Elgar and R.T. Guza. Observations of bispectra of shoaling surface gravity waves.
Journal of Fluid Mechanics, 161:425-448, 1985.
S. Elgar, R.T. Guza, and M.H. Preilich. Eulerian measurements of horizontal accelerations
in shoaling gravity waves. Journal of Geophysical Research, 93(08):9261-9269, 1988.
D.L. Foster, R.A. Holman, and A.J. Bowen. Field evidence for plug flow. Eos. Transactions
AGU, 83(47), Fall Meeting Suppl., Abstract OS72O-02, 2002.
E. Gallagher, S. Elgar, and R.T. Guza. Observations of sand bar evolution on a natural
beach. Journal of Geophysical Research, 103(C2):3203-3215, 1998a.
E.L. Gallagher, S. Elgar, and E.B. Thornton. Megaripple migration in a natural surfzone.
Nature, 394:165-168, 1998b.
E.L. Gallagher, E.B. Thornton, and T.R Stanton. Sand bed roughness in the nearshore.
Journal of Geophysical Research, 108(C2):3039, doi:10.1029/2001JC001081 2003.
R.J. Hallermeier. Oscillatory bedload transport: Data review and simple formulation.
Continental Shelf Research, 1(2):159-190, 1982.
D.M. Hanes and D.A. Huntley. Continuous measurements of suspended sand concentration
in a wave dominated nearshore environment. Continental Shelf Research, 6(4):585-596,
1986.
W.N.M Hassan. Transport of size-graded and uniform sediments under oscillatory sheet-
flow conditions. PhD thesis. University of Twente, 2003.
T. Hsu and D.M. Hanes. The effects of wave nonlinearity and flow acceleration on coastal
sheet flow sediment transport. Journal of Geophysical Research, in preparation.
36

D. B. King. Studies in oscillatory flow bed load sediment transport. PhD thesis, University
of California, San Diego, 1991.
O.S. Madsen. Stability of a sand bed under breaking waves. In Proceedings of the 14th
International Conference on Coastal Engineering, pages 776-794. American Society of
Civil Engineering, 1974.
J. Malarkey, A.G. Davies, and Z. Li. A simple model on unsteady sheet-flow sediment
transport. Coastal Engineering, 48:171-188, 2003.
P. Nielsen. Coastal Bottom Boundar Layers and Sediment Transport. World Scientific,
1992.
P. Nielsen. Shear stress and sediment transport calculations for swash zone modelling.
Coastal Engineering, 45:53-60, 2002.
P. Nielsen and D.P. Callaghan. Shear stress and sediment transport calculations for sheet
flow under waves. Coastal Engineering, 47:347-354, 2003.
B. Raubenheimer. Observations and predictions of fluid velocities in the surf and swash
zones. Journal of Geophysical Research, 107(Cll):3190-doi:10.1029/2001JC001264,
2002.
J.S. Ribberink. Bed-load transport for steady flows and unsteady oscillatory flows. Coastal
Engineering, 34:59-82, 1998.
J.S. Ribberink, CM. Dohmen-Janssen, D. Hanes, S.R. McLean, and C. Vincent. Near-bed
sand transport mechanisms under waves: a large scale flume experiment (Sistex99). In
Proceedings of the 27th International Conference on Coastal Engineering, pages 3263-
3276. American Society of Civfl Engineers, 2000.
J.A. Roelvink and M.J.F. Stive. Bar-generating cross-shore flow mechanics on a beach.
Journal of Geophysical Research, 94(C4):4185-4800, 1989.
J.F.A. Sleath. Conditions for plug flow formation in oscillatory flow. Continental Shelf
Research, 19:1643-1664, 1999.
37
E.B. Thornton, R.T. Humiston, and W. Birkemeier. Bar/trough generation on a natural
beach. Journal of Geophysical Research, 101(C5):12097-12110, 1996.
J. TVowbridge and D. Young. Sand transport by unbroken water waves under sheet flow
conditions. Journal of Geophysical Research, 94(C8):10971-10991, 1989.
L.D. Wright, J.D. Boon, S.C. Kim, and J.H. List. Modes of cross-shore sediment transport
on the shoreface of the Middle Atlantic bight. Marine Geology, 96:19-51, 1991.
L.D. Wright and A.D. Short. Morphodynamics variability of surf zones and beaches: A
synthesis. Marine Geology, 56:93-118, 1984.
38

Chapter 3
Coupled Boussinesq-Wave and
Sediment Transport Model
Applied to Onshore Sandbar
Migration
Abstract
A stochastic Boussinesq model for the nonlinear transformation of surface gravity waves is coupled with a wave-acceleration-driven cross-shore sediment transport model to predict onshore sediment transport and sandbar migration observed on a natural beach. The coupled model is initialized with observed bathymetry and driven with wave frequency- directional spectra estimated from measurements in 8-m water depth. Similar to earlier studies, the wave model has skill in predicting wave frequency spectra, as well as wave velocity skewness and asymmetry across the surfzone. Dimensional acceleration skewness, a third-order moment previously shown to explain onshore sandbar migration in the surf zone, also is predicted fairly well, although modeled values are smaller than observations on the crest of the sandbar. As a result, when driven with modeled acceleration skewness, the sediment transport model (calibrated with observed acceleration moments) underpre- dicts the rates and cross-shore gradients of sediment transport, failing to move the sandbar onshore. Thus, despite the overall qualitative agreement between observed and modeled statistics of the wave field across the surfzone, closer agreement is essential for the suc- cessful application of the Boussinesq-wave model to predict observed sediment transport. Improved skill of the coupled model can be obtained by calibrating the sediment transport model with modeled acceleration moments.
39

3.1 Introduction
Models for the evolution of ocean surface gravity waves in shallow water are important
to the prediction of nearshore circulation and sediment transport. Weakly nonlinear,
weakly dispersive Boussinesq wave transformation models accurately predict the observed
evolution of sea-surface elevation [Preilich and Guza, 1984, Elgar and Guza 1985b, Elgar
et al., 1990, Madsen et al. 1997, Norheim et al., 1998, Berbers et al, 2003, and many
others], fluid velocities [Bosboom et al, 1997], and the frequency-directional spectrum
[Norheim et al., 1998, Berbers et al., 2003] of waves propagating through the shoaling
and surf zones. In addition, Boussinesq models have skill predicting third-order moments
(skewness and asymmetry) of velocity [Elgar et al., 1990, Bosboom et al., 1997, Ozanne
et al., 2000, Berbers et al., 2003] and velocity acceleration [Elgar et al., 1990] thought to
be important to sediment transport [Bowen, 1980, Bailard, 1981, Ribberink, 1998, Drake
and Calantoni, 2001, Elgar et al., 2001, Hoefel and Elgar, 2003].
In shallow water {kh « 1, where k is the wavenumber magnitude and h is the water
depth), nonzero third-order moments of wave-orbital velocity and acceleration arise from
near resonant triad nonlinear interactions in which two primary wave components with
frequencies /i and /2 and wavenumbers ki and fe2 excite a secondary wave component with
the sum (/i + f2,ki + k2 + Sk) or difference (/i - /2, kx-k2- 5k) frequency and wavenum-
ber (where 5k is a slight mismatch in the wavenumber), respectively [Preilich and Guza,
1984]. As a result of the energy transfer from the incident wave components to higher and
lower frequencies, the wave frequency spectrum is broadened, and the nonlinearly excited
secondary wave components are phase-coupled to the primary components, causing devi-
ations of the wave field from Gaussian statistics and the steepening and pitching-forward
characteristic of near-breaking waves [Elgar and Guza, 1985a]. Strong accelerations un-
der the steep front of a pitched-forward wave are followed by smaller decelerations under
the gently sloping rear of the wave, generating nonzero acceleration skewness that has
been used to explain wave-driven onshore sediment transport in the surfzone [Drake and
Calantoni, 2001, Hoefel and Elgar, 2003].
Here, a stochastic Boussinesq model for the nonlinear transformation of directionally
40

spread waves propagating over an alongshore uniform beach [Herbers and Burton, 1997,
Berbers et al., 2003] is coupled with a wave-acceleration-skewness-driven sediment trans-
port model [Hoefel and Elgar, 2003] to predict onshore sediment transport and sandbar
migration observed on an ocean beach. When driven with observed near-bottom wave-
orbital velocities, the sediment transport model predicts the observed onshore sandbar
migration [Hoefel and Elgar, 2003]. Although the Boussinesq model qualitatively predicts
the evolution of the wave field during the 5-day onshore sandbar migration event, under-
prediction of near-bottom fluid acceleration skewness on the sandbar crest results in poor
predictions of sediment transport and onshore bar migration. The coupled model pre-
dictions are improved by recalibrating model coefficients to account for the discrepancies
between observed and modeled acceleration skewness.
3.2 Boussinesq Wave Model
The Boussinesq equations [Peregrine, 1967] are based on assumptions of weak nonlinearity
{a/h « 1, where a is the wave amplitude) and weak dispersion {{kh) « 1) such that
the Ursell number, U = {a/h)/{k/h)^, is approximately unity. Stochastic models solve
the Boussinesq evolution equations for statistically averaged spectral wave properties, and
thus are computationally efficient. However, unlike deterministic models that solve the
approximate equations of motion without any assumptions about higher-order statistics,
stochastic models require a statistical closure that may yield errors over long propagation
distances and in regions of strong nonlinearity [Holloway and Hendershott, 1977]. Thus,
a relaxation of the bispectrum to Gaussian statistics over evolution distances comparable
with the surfzone width is used in the closure to prevent spurious spatial oscillations and
negative spectral values [Orzag, 1970, Herbers and Burton, 1997, Herbers et al., 2003].
Here, a two-dimensional stochastic Boussinesq model for the evolution of the frequency-
directional spectrum and bispectrum of surface gravity waves propagating over a gently
sloping, alongshore uniform beach [Herbers and Burton, 1997] is used to model the evolu-
tion of the wave field across the shoaling and surf zones. Dissipation due to wave breaking
is incorporated with a heuristic frequency-dependent term [Kaihatu and Kirby, 1995].
41

The model, based on a third-order closure (assuming phase coupling between quar-
tets of wave components is weak), is cast in terms of a coupled set of first-order evolu-
tion equations for the frequency-alongshore wavenumber (/) spectrum E{f, I) and bispec-
trum B{fi,li,f2,l2)- The two-dimensional spectrum E{f,l) defines the energy density of
component (/,Z), and the four-dimensional (complex) bispectrum B{fi,lij2M) defines
the average phase relationship of a triad consisting of components {fi,h), (/2,'2), and
(-/i - /2, -h - h)- The integrals of E and B over all frequencies yield, respectively, the
mean square and mean cube of the sea-surface elevation. The third-order moments skew-
ness and asymmetry are the integrals of the real and imaginary parts of the bispectrum
[Elgar and Guza, 1985a], respectively. Consistent with the depth-averaged Boussinesq
equations, linear shallow water transfer functions that neglect vertical variations in the
wave-orbital velocity field were used to convert spectra and bispectra of sea-surface el-
evation to spectra and bispectra of wave-orbital velocity and acceleration, allowing the
third-order moments of velocity and acceleration used in the sediment transport model to
be estimated from Boussinesq predictions.
Discretized forms of the evolution equations are integrated from the offshore bound-
ary across the beach with a fixed step size of 2 m. The wave model is initialized with
bathymetry observed at the beginning of the onshore bar migration event. Offshore bound-
ary conditions are provided by wave frequency-directional spectra Eoif, I) estimated from
3-hr long records of near-bottom pressure (converted to sea-surface elevation using hn-
ear finite depth theory) measured with an array of pressure gages, and the correspond-
ing Boifi,h,hJ2) approximated by second-order finite-depth theory (Hasselmann, 1962,
Herbers et al., 2003].
The infragravity frequency range / < 0.05 Hz was excluded from all bulk wave statistics
because strong shoreline reflection of these low-frequency waves is not represented in the
model. The maximum wave frequency fmax was set to 0.5 Hz to include higher frequency
components that may contribute to sediment transport.
42

3.3 Sediment Transport Model
The importance of wave-acceleration effects on sediment transport has been suggested
by field observations [Hanes and Huntley, 1986, Elgar et al., 2001, Foster et al., 2002],
laboratory experiments [Madsen, 1974, Cox et al, 1991, King, 1991, Sleath, 1999], and
numerical simulations [Drake and Calantoni, 2001, Hsu and Hanes, in preparation]. Al-
though the precise mechanisms involved are not completely understood, two-phase sheet
flow simulations [Hsu and Hanes, in preparation] corroborate previous field observations
[Foster et al., 2002] that indicate severe bed failure under the large flow accelerations, or
horizontal pressure gradients, that precede maximum onshore velocities of pitched-forward
nearly-broken or broken waves in shallow water. If sediment is mobilized by accelerating
flows, it is expected that transport will be larger when velocities are onshore directed (just
after strong accelerations and decelerations) than during offshore directed flows, resulting
in net onshore transport. Discrete-particle computer simulations of sheet flow under un-
steady oscillatory flows [Drake and Calantoni, 2001] support this hypothesis and led to the
parameterization of acceleration effects of pitched-forward waves on sediment transport
as a function of a dimensional form of acceleration skewness, aspike = {o^)l{<^)^ where
a is the time series of acceleration and angle brackets denote averaging. The expression
for cross-shore (x) acceleration-driven bedload sediment transport Qa suggested by the
discrete-particle numerical simulations [Drake and Calantoni, 2001] can be extended to
account for random waves in the surfzone, yielding [Hoefel and Elgar, 2003]
Qa{x) = ' ka{a-spike - Sga[aspike]acrit) for \aspike\ > acrit . .
{6.1} 0 for Iflspifcel < O'crit
where fca is a constant, sgn[] is the sign of the argument, and acru is a threshold that must
be exceeded for initiation of transport. By comparing model predictions with observations,
the optimal values of ka — 0.014 cm s and of acrit = 20 cm s"'^ were determined [Hoefel and
Elgar 2003, and also Appendix A]. If it is assumed that gradients in alongshore transport
are negligible (as inferred by Gallagher et al. [1998] for the observations discussed here).
43

mass conservation in the cross-shore direction yields
dh _ 1 dQa{x) /g 2) dt fi dx
where dh/dt is the change in bed elevation h with time i, and /x = 0.7 is a sediment
packing factor.
3.4 Field Observations and Data Analysis
The field observations discussed here were collected on a barrier island beach in the At-
lantic Ocean, near Duck, N.C., during an onshore sandbar migration event observed be-
tween 22 and 27 September 1994 [Gallagher et al., 1998, Elgar et al., 2001, Hoefel and
Elgar, 2003]. Offshore waves were approximately 75-cm high and surfzone cross-shore
mean currents were less than 30 cm s"!. Twelve colocated sonar altimeters, pressure
sensors, and bidirectional electromagnetic current meters (positioned approximately 50
cm above the seafloor) were mounted on fixed frames deployed from near the shoreline
to approximately 5-m water depth [Gallagher et al., 1998, Herbers et al., 2003]. Mean
sediment grain sizes along the transect ranged from 0.30 mm at the shoreline to 0.15 mm
in 5-m water depth (Figure 1-2, Gallagher et al. [1998]). Beach profiles used to initialize
the wave model were obtained through linear interpolation of altimeter measurements.
Using high-spatial resolution surveys made with an amphibious vehicle does not change
the results presented here.
All instruments were sampled at 2 Hz. Incident wave frequency-directional spectra
were estimated from 3-hr long records from a 9-element array of bottom-mounted pres-
sure gauges located in 8-m water depth, about 800 m from the shoreline. Sea-surface
elevation frequency-spectra across the transect were estimated from 3-hr-long records of
near-bottom pressure using linear finite depth theory Three-hr long records of observed
near-bottom velocities were band-pass filtered (with a Fourier-type filter) between 0.05
and 0.5 Hz to match wave-model output, and differentiated in time to obtain near-bottom
acceleration time series. Third-order moments of velocity (skewness and asymmetry) were
44

calculated as the mean cube of the demeaned time series and Hilbert-transformed time
series, respectively, normalized by the variance [Elgar and Guza, 1985a]. Predicted sed-
iment transport fluxes (Equation 3.1) at each sensor location were computed from 3-hr
averages of observed or modeled (by the Boussinesq wave model) near-bottom accelera-
tion statistics, and integrated in time with a 3-hr time step (Equation 3.2) to compute
predicted bottom elevation changes.
3.5 Coupled Wave and Sediment Transport Model Imple-
mentation
The Boussinesq wave model (Section 3.2) was run over the initial observed bathymetry for
the first 3-hr boundary condition (22 September 1900 hrs). The results were used to update
the bathymetry for the next 3-hr period, the same time interval for which the incident
offshore wave spectrum (estimated from observations) was updated, based on sediment
transport fluxes (Section 3.3, Equations 3.1 and 3.2) computed from modeled agpike at
8-m intervals along the profile between the offshore pressure-gage array (x = 800 m) and
the sensor located closest to the shoreline {x = 145 m). Tests indicated no significant
difference between updating the coupled-model bathymetry at spatial steps of 8 m or at
the same locations were sensors were deployed.
The sequence of wave modeling and updating bathymetry every 3 hours was repeated
for the 5 day-long onshore migration event. The temporal evolution of the bathymetry,
including the relatively slow onshore sandbar migration is well resolved by the 3-hr update
cycle.
3.6 Model Application
Previous studies [Elgar et. al, 2001, Hoefel and Elgar, 2003] suggest that onshore sandbar
migration can result from feedback between waves and morphology. As waves shoal, veloc-
ity acceleration skewness is maximum near the crest of the sandbar, producing cross-shore
gradients in acceleration-driven transport that result in erosion offshore, and accretion on-
45

shore of the bar crest, causing shoreward bar migration. As the sandbar moves shoreward,
so does the location of the maximum of acceleration skewness. Thus, accurate predictions
of the Boussinesq wave model near the sandbar are of particular importance to modeling
morphological evolution. Similar to previous studies [Herbers and Burton, 1997, Herbers
et al., 2003], the Boussinesq wave model predicts sea-surface elevation frequency spectra
fairly well near the sandbar (Figures 3-la through 3-lc), except at frequencies above about
0.35 Hz. In all 3 cases, the significant wave height (4 times the standard deviation of sea-
surface elevation fluctuations) was about 0.9 m on the bar crest, which was in about 2-m
water depth, and thus there was some wave breaking. Deviations between modeled and
observed spectral levels at high frequencies may be owing to inaccuracies in the heuristic
frequency-dependent dissipation used in the model, or to neglected higher-order nonhnear
interactions. The Boussinesq model results shown here (Figures 3-1 through 3-3) are from
the coupled wave and sediment transport model, and thus for wave predictions over mod-
eled bathymetry. However, discrepancies between modeled and observed statistics of the
wave field likely are not caused by differences between modeled and observed bathymetry
because Boussinesq wave statistics over modeled bathymetry are similar to Boussinesq
wave statistics over observed bathymetry (not shown).
Even though the cross-shore evolution of velocity skewness (a measure of the differ-
ence in shape between wave crests and troughs, with sharp-crested waves having higher
skewness) is reproduced qualitatively (Figures 3-ld through 3-lf) by the Boussinesq wave
model, predicted values often are higher than observed values, consistent with previous
findings {eg, Herbers et al. [2003]). Velocity asymmetry (a measure of the difference be-
tween the front and rear faces of the waves, with pitched-forward waves having higher
asymmetry) is predicted more accurately (Figures 3-lg through 3-li) than velocity skew-
ness. Velocity asymmetry is closely related to acceleration skewness [Elgar and Guza,
1985a], but less sensitive to high frequency motions [Elgar et al., 1990]. Thus, inaccu-
racies in Boussinesq model predictions at high frequencies {eg, f > 0.35 Hz in Figures
3-la through 3-lc) may have a greater effect on acceleration skewness than on velocity
asymmetry (compare Figures 3-lg through 3-li with Figures 3-2a through 3-2c).
The cross-shore distribution of dimensional acceleration skewness, a spike, is predicted
46

23Sep 24Sep 27Sep
— Modeled — Observed
(a) X = 240 m (b) X = 220 m (c)
01 0 2 0.3 0.4 0.1 0.2 0.3 0.4 0.1 0.2 0.3 0.4 Frequency (Hz) Frequency (Hz) Frequency (Hz)
n 0) c
I I
a E E >. w <
2
1.5 /''-^-'X 1
0.5 -TF
U (d) (e) (f)
1.5
0.5
■S 0 >
(g) — Modeled * Observed
(h) (i)
* • <ff '
0)
E o
m 200 300 400 500 200 300 400 500 200 300 400 500 Cross-shore posHion (m) Cross-shore position (m) Cross-shore position (m)
Figure 3-1: Observed (symbols and black curves) and modeled by the coupled Boussinesq wave and acceleration-induced sediment transport model (red curves) sea-surface elevation spectral density near the crest of the sandbar (cross-shore (x) positions are given in each panel) versus frequency for (a) 23 September 1000 hrs, (b) 24 September 1900 hrs, and (c) 27 September 1000 hrs. Spectral estimates have approximately 100 degrees of freedom and 0.0049 Hz frequency resolution. Observed (black symbols) and modeled (red curves) (d-f) near-bottom velocity skewness, (g-i) near bottom velocity asymmetry, and (j-1) seafloor elevation (relative to mean sea level) versus cross-shore position for the same time periods
as the corresponding spectra (a-c).
fairly well by the coupled model (Figure 3-2a through 3-2c). For example, on 24 September
the agreement between observations and predictions is excellent (Figure 3-2b). However,
often aspike is underpredicted on top of the sandbar crest (Figures 3-2a and 3-2c), some-
47

times falling below the previously determined threshold for acceleration-induced transport,
acrit = 20 cm s~^ (shaded area in Figures 3-2a through 3-2c) [Hoefel and Elgar 2003, and
also Appendix A]. As a result, acceleration-induced cross-shore sediment transport (Equa-
tion 3.1, with ka — 0.014 cm s and aa-u = 20 cm s~^) driven by modeled moments also is
underpredicted on the sandbar crest compared with transport driven by observed Ugpike
using the same transport model coefRcients (Figures 3-2d and 3-2f). Cross-shore gradi-
ents of sediment transport estimated from modeled and observed agpike agree qualitatively,
and are consistent with erosion offshore (negative gradients), and accretion onshore of the
sandbar crest (positive gradients. Figures 3-2g through 3-2i). However, owing to the un-
derprediction of agpike near the sandbar crest, associated sediment transport gradients
driven by modeled moments often are smaller than those estimated from observations {eg,
Figures 3-2g and 3-2i).
During the 5-day onshore sandbar migration event, a spike is underpredicted near the
sandbar crest (Figure 3-3a), especially for the highest values oiagpike, which are associated
with strongly pitched-forward waves, possibly affected by higher-order nonlinear interac-
tions not included in the Boussinesq wave model, and by breaking-induced dissipation
that is simulated crudely in the model. Consequently, the coupled model often underpre-
dicts the cross-shore gradients in acceleration-induced sediment transport (Figure 3-3b).
Morphological evolution depends on gradients in sediment transport (eg, Equation 3.2), so
that the underprediction of transport gradients by the coupled model (Figure 3-3b) results
in somewhat less erosion offshore, and significantly less accretion onshore of the sandbar
crest than is observed and than is predicted by gradients estimated from observed Ospike
(Figure 3-4). Although the coupled model predicts some of the erosion observed offshore
of the sandbar crest (x = 265 m. Figure 3-4b), it fails to predict the accretion onshore of
the bar crest (x = 220 m, Figure 3-4a). As a result, unlike the sediment transport model
driven with observed agpike^ the coupled model fails to predict the onshore migration of
the sandbar (Figure 3-5).
Improved coupled-model skill in predicting observed morphological change would be
attained by improving the Boussinesq model predictions, especially near the sandbar crest,
perhaps by including higher-order nonlinearities or with a better parameterization of wave
48

a at
23 Se p
40 (a) *
20 * /Nf
0 \^ /* v_ M V- *S|(r- ■ ' 'W
24Sep 27Sep
CM
E o
0.4
0.2
—From modeled moments * From observed moments
%iit % \—% t% *■
200 300 400 500 200 300 400 500 200 300 400 500 Cross-shore position (m) Cross-sliore position (m) Cross-shore position (m)
Figure 3-2: (a-c) Observed (symbols and black curves) and modeled (red curves) flspifcei associated (d-f) acceleration-induced sediment transport Qa and (g-i) cross-shore gradi- ents of transport estimated from observed (symbols and black curves) and modeled (red curves) moments, and (j-1) seafloor elevation (relative to mean sea level) versus cross- shore position. Left-hand panels are for 23 September 1000 hrs, middle panels are for 24 September 1900 hrs, and right-hand panels are for 27 September 0100 hrs.
breaking. These improvements are beyond the scope of the present study. Alternatively,
the effect of underpredicting aspike on the sandbar crest {eg, Figure 3-3a) can be compen-
sated partially by lowering the threshold for initiation of acceleration-induced transport,
acrit- Comparison of coupled-model predictions with observations of morphological change
suggest that for the onshore migration event discussed here, the highest predictive skill is
attained for acrit = 8 cm s"^ and ka = 0.010 cm s (Figure 3-5).
49

%
a CO
CO
Modeled Observed
CM JO
X
a a
0.02
0.01
0
-0.01
-0.02
From modeled moments
jC • From observed moments i
\m Accretion
yf^^Z Erosion
• T * n
0.5 1 1.5 2 2.5
Normalized cross-shore position {^^^„)
Figure 3-3: (a) Dimensional acceleration skewness {aspike) and (b) cross-shore gradients in acceleration-driven sediment transport Qa versus cross-shore position (x) normalized by the position of the sandbar crest (xbar)- Thus, x/xbar = 1 is the cross-shore position corresponding to the (moving) bar crest. Symbols are observed values, and the red-shaded areas are the envelopes of values predicted by the coupled model from 41 consecutive 3-hr runs beginning 22 September 1900 hrs and ending 27 September 1900 hrs.
50

E
0) U) c n Xi o c o CO
a;
E o
X =:220 m
10
0< (b)
— 1 ' 1 1 —T
265 m •• HlaAttA. __ --.,••«»■
10 "••^ •••••
20
30 • c Dbserved
-^
^
40 • Predicted: from observed moments •
■50
-fin
• • Predicted: from modeled moments
23Sep 24Sep 25 Sep 26Sep 27 Sep
Date (day in 1994)
Figure 3-4: Observed (black circles) and predicted (blue circles for sediment transport model driven with observed aspike and red circles for the coupled wave and sediment transport model) cumulative change in seafloor elevation versus time at cross-shore loca- tions (a) X =220 m, and (b) a; =265 m. The dotted vertical lines indicate the time periods depicted in Figures 3-1 and 3-2: 23 September 1000 hrs, 24 September 1900 hrs, and 27 September 0100 hrs.
51

150 200 250 300 350
Cross-shore position (m) 400
Figure 3-5: Elevation of the seafloor (relative to mean sea level) versus cross-shore position observed on 22 September 1900 hrs (black solid curve), observed on 27 September 1900 hrs (black dashed curve), predicted on 27 September 1900 hrs by the acceleration-based sediment transport model driven with observed agpike (blue solid curve, acrit = 20 cm s~ , ka = 0.014 cm s), predicted on 27 September 1900 hrs by the coupled wave and sediment transport model (red solid curve, acrit = 20 cm s'^, ka = 0.014 cm s), and predicted on 27 September 1900 hrs by the coupled wave and sediment transport model (red dashed curve, Qcrit — 8 cm s""^, ka = 0.010 cm s).
The sensitivity of the coupled wave and sediment transport model to the choice of high
frequency cut-off was briefly investigated. Initially, the same high frequency cut-off (0.5
Hz) used for the data-driven sediment transport model (Chapter 2) was chosen for the
Boussinesq wave model. The performance of the sediment transport model driven with
observations is insensitive to the choice of high frequency cut-off to the extent that equally
skillfull predictions can be obtained for different high frequency cut-offs provided that
recalibrated sediment transport model constants are used. However, the underprediction
of wave spectral densities by the wave model at frequencies higher than about 0.35 Hz
(Figure 3-la through 3-lc) suggests that the wave model might be sensitive to the choice
of high frequency cut-oflF. Better agreement between observed and modeled moments is
obtained by lowering the high frequency cut-off to 0.4 Hz. For this frequency cut-off, both
the observation-driven and the coupled Boussinesq-wave sediment transport models yield
reasonable agreement with observed profile evolution using the same sediment transport
model constants {acrit = H cm s"^, ka = 0.017 cm s; Figure 3-6).
52

150 200 250 300 350 Cross-shore position (m)
400
Figure 3-6: Elevation of the seafloor (relative to mean sea level) versus cross-shore position observed on 22 September 1900 hrs (black solid curve), observed on 27 September 1900 hrs (black dashed curve), predicted on 27 September 1900 hrs by the acceleration-based sediment transport model driven with observed agpike (blue solid curve), and predicted on 27 September 1900 hrs by the coupled wave and sediment transport model (red solid curve). For both the data-driven and the coupled wave and sediment transport models the high frequency cut-off was set to 0.4 Hz, and acrit = H cm s~^ and ka = 0.017 cm s.
3.7 Summary
Although the cross-shore evolution of waves shoaling and breaking on a barred beach is
modeled well by a stochastic Boussinesq wave model initialized with the wave field ob-
served at the seaward edge of the beach profile [Herbers and Burton, 1997, Herbers et al.,
2003], relatively small errors in predicted higher-order moments of the wave field have im-
portant effects on subsequent sediment transport and morphological change modeling. In
particular, underprediction of near-bottom fluid acceleration skewness near the crest of the
sandbar results in reduced skill in acceleration-based sediment transport model predictions
relative to predictions based on observed acceleration time series. Consequently, the cou-
pled Boussinesq-wave and acceleration-induced sediment transport model introduced here
underpredicts the onshore migration of a sandbar observed on an ocean beach for moder-
ate wave conditions with weak mean cross-shore currents. However, adjustment of model
parameters, in particular lowering the threshold for initiation of acceleration-induced sed-
iment transport relative to the optimal threshold determined from data-driven transport
modeling, results in improved predictive skill of morphological change. Further research
is needed to improve the predictions of the Boussinesq wave model, especially in regions
53

of strong nonlinearity and wave-breaking induced dissipation {eg, near the sandbar crest),
and to calibrate sediment transport model coefficients with additional data sets. How-
ever, the results presented here suggest that coupUng a stochastic Boussinesq wave model
with a wave-induced sediment transport model can result in skillful predictions of the on-
shore sediment transport and sandbar migration observed on an ocean beach when mean
currents are weak.
54

Bibliography
J.A. Bailard. An energetics total load sediment transport model for a plane sloping beach.
Journal of Geophysical Research, 86(C11):10938-10954, 1981.
J. Bosboom, G. Klopman, J.A. Roelvink, and J.A. Battjes. Boussinesq modelling of
wave-induced horizontal particle velocities. Coastal Engineering, 32:163-180, 1997.
A.J. Bowen. Simple models of nearshore sedimentation of beach profiles and longshore
bars. In S.B. McCann, editor, The Costaline of Canada, pages 1-11. Geological Survey
of Canada Paper 10-80, Ottawa, 1980.
D. T. Cox, N. Kobayashi, and H. Mase. Effects of fluid accelerations on sediment transport
in surf zones. In Coastal Sediments' 91, pages 447-461. ASCE, 1991.
T. G. Drake and J. Calantoni. Discrete particle model for sheet flow sediment transport
in the nearshore. Journal of Geophysical Research, 106(C9):19859-19868, 2001.
S. Elgar and R.T. Guza. Observations of bispectra of shoaling surface gravity waves.
Journal of Fluid Mechanics, 161:425-448, 1985a.
S. Elgar and R.T. Guza. Shoaling gravity waves: Comparisons between field observations,
linear theory, and a nonlinear model. Journal of Fluid Mechanics, 158:47-70, 1985b.
S. Elgar, M.H. Freilich, and R.T. Guza. Model-data comparisons of moments of non-
breaking shoaling surface gravity waves. Journal of Geophysical Research, 95(C9):
16055-16063, 1990.
55

S. Elgar, E. Gallagher, and R.T. Guza. Nearshore sandbar migration. Journal of Geo-
physical Research, 106(C6):11623-11627, 2001.
D.L. Foster, R.A. Holman, and A.J. Bowen. Field evidence for plug flow. Eos. Transactions
AGU, 83(47), Fall Meeting Suppl., Abstract OS72C-02, 2002.
M.H. Preilich and R.T. Guza. Nonlinear effects on shoaling surface gravity waves. Philo-
sophical Transanctions of the Royal Society of London, A311:l-41, 1984.
E. Gallagher, S. Elgar, and R.T. Guza. Observations of sand bar evolution on a natural
beach. Journal of Geophysical Research, 103(C2):3203-3215, 1998.
D.M. Hanes and D.A. Huntley. Continuous measurements of suspended sand concentration
in a wave dominated nearshore environment. Continental Shelf Research, 6(4):585-596,
1986.
T.H.C. Herbers and M.C. Burton. Nonlinear shoaling of directionally spread waves on a
beach. Journal of Geophysical Research, 102(C9):21101-21114, 1997.
T.H.C. Herbers, M. Orzech, S. Elgar, and R.T. Guza. Shoaling transformation of wave
frequency-directional spectra. Journal of Geophysical Research, 108(C1):3013, 2003.
F. Hoefel and S. Elgar. Wave-induced sediment transport and sandbar migration. Science,
299:1885-1887, 2003.
G. Holloway and M.C. Hendershott. Stochastic closure for nonlinear Rosby waves. Journal
of Fluid Mechanics, 82:747-765, 1977.
T. Hsu and D.M. Hanes. The effects of wave nonlinearity and flow acceleration on coastal
sheet flow sediment transport. Journal of Geophysical Research, in preparation.
J.M. Kaihatu and J.T. Kirby. Nonlinear transformation of waves in finite water depth.
Physics of Fluids, 7:1903-1914, 1995.
D. B. King. Studies in oscillatory flow bed load sediment transport. PhD thesis. University
of California, San Diego, 1991.
56

O.S. Madsen. Stability of a sand bed under breaking waves. In Proceedings of the 14th
International Conference on Coastal Engineering, pages 776-794. American Society of
Civil Engineering, 1974.
P.A. Madsen, O.R. Sorensen, and H.A. Shaffer. Surf zone dynamics simulated by a Boussi-
nesq type model: Part I model description and cross-shore motion of regular waves.
Coastal Engineering, 41:361-397, 1997.
C.A. Norheim, T.H.C. Herbers, and S. Elgar. Nonlinear evolution of surface wave spectra
on a beach. Journal of Physical Oceanography, 28:1534-1551, 1998.
S.A. Orzag. Analj^tical theories of turbulence. Journal of Fluid Mechanics, 41:363-386,
1970.
F. Ozanne, A. Chadwick, D.A. Huntley, D.A. Simmonds, and J. Lawrence. Velocity
predictions for shoaling and breaking waves with a Boussinesq-type model. Costal
Engineering, 41:361-397, 2000.
D.H. Peregrine. Long waves on a beach. Journal of Fluid Mechanics, 27:815-827, 1967.
J.S. Ribberink. Bed-load transport for steady flows and unsteady oscillatory flows. Coastal
Engineering, 34:59-82, 1998.
J.F.A. Sleath. Conditions for plug flow formation in oscillatory flow. Continental Shelf
Research, 19:1643-1664, 1999.
57

Appendix A
Combined Energetics and
Acceleration Model Performance
Model performance can be quantified by means of the normalized root mean square {RMS)
prediction error ERMS/^RMS, where ERMS is the RMS error between final predicted and
observed 3-hour averaged profiles and A/JMS is the RMS change between the initial and
final observed profiles. Model skill is defined as (after Davis [1976] and Gallagher et al.
[1998])
skill = 1-^ (A.1)
where,
ERMS = 1
\ "rp / ^ [Jn\.'^pTedicted,n ~ i>,observed,n)i \-"—^) \ ■' n=l
and
^RMS — n=l
where N is the number of sensors along the cross-shore transect, hpredicted,n is the predicted
58

final profile at each location n, hobserved,n is the observed final profile, and A„ is the
measured change in seafloor elevation at each of the N sensor locations. To account for
irregular sensor spacing, estimates at each cross-shore location are weighted by Sn given
by
Sn f i(dx„_i+<ir„) foi.n=:2,...,Ar-l
dx dx iovn-l,N dx
(A.4)
where dxn — x„+i — x„ is the separation between adjacent sensors located at cross-shore
positions x„+i and Xn, and dx is the average sensor separation along a transect.
Model skill is maximum and equal to 1 when there is perfect agreement between final
observed and predicted profiles. If skill = 0, prediction errors are as large as observed
changes, whereas if skill < 0 prediction errors are larger than observed changes. If ob-
served changes between initial and final profiles are small (ie, ARMS is small), the corre-
sponding model skill may be low even if errors (ERMS) in predictions are small [Gallagher
et al., 1998].
The skill of the combined acceleration and energetics model was evaluated as a function
of the acceleration-based model constants ka and acrit for three simulation periods for the
Duck94 data set (Figure A-1). These periods include the onshore bar migration event
between 22 and 27 Sep (Figure 2-2), an offshore bar migration event observed during a
storm between 10 Oct and 15 Oct (Figure 2-6), and a 45-day long simulation between
01 Sep and 15 Oct that includes on and oflFshore bar migration events, as well as lower
energy wave events during which no significant bathymetric changes were observed (Figure
2-7). Calibration and model performance of the energetics formulation has been evaluated
previously by Thornton et al. [1996], and Gallagher et al. [1998].
Simulations for the onshore bar migration event (22 to 27 Sep, Figure A-la) indicate
Uttle model sensitivity to ka {ie, the maximum skill of approximately 0.7 is attained
for 0.02 < ka < 0.2 cm s) and large sensitivity to the acceleration threshold for sediment
transport, acrit (ie, maximum model skill is attained for a narrow range of acrit)- A similar
sensitivity to ka and aa-it is observed for the offshore bar migration event (10 to 15 Oct,
Figure A-lb). Including the effects of acceleration-induced transport (ie, when a^-it < 50
59
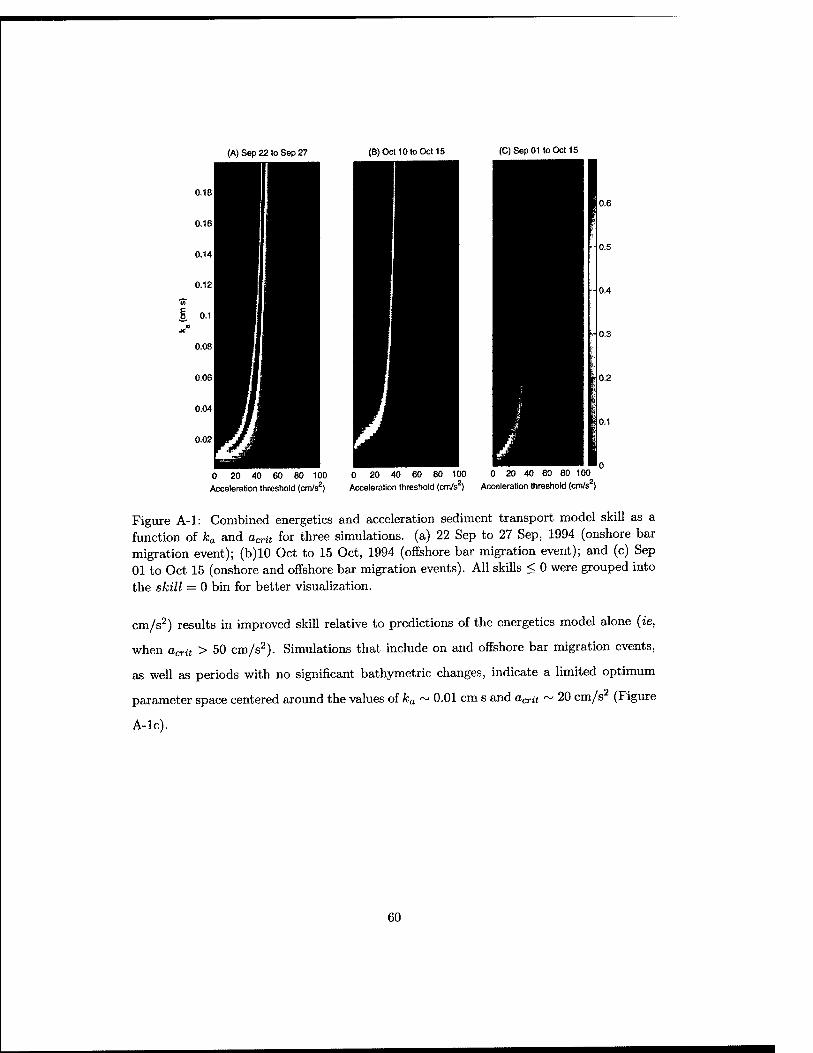
(A) Sep 22 to Sep 27 (B)Oct10toOct15 (C)Sep01 toOct15
I 0.
0 20 40 60 80 100 0 20 40 60 80 100 0 20 40 60 80 100
Acceleration threstiold (cm/s^) Acceleration threshold (cm/s^) Acceleration threshold (cm/s )
Figure A-1: Combined energetics and acceleration sediment transport model skill as a function of ka and acrit for three simulations, (a) 22 Sep to 27 Sep, 1994 (onshore bar migration event); (b)10 Oct to 15 Oct, 1994 (offshore bar migration event); and (c) Sep 01 to Oct 15 (onshore and offshore bar migration events). All skills < 0 were grouped into the skill = 0 bin for better visualization.
cm/s^) results in improved skill relative to predictions of the energetics model alone (ie,
when acrit > 50 cm/s^). Simulations that include on and offshore bar migration events,
as well as periods with no significant bathymetric changes, indicate a limited optimum
parameter space centered around the values of ka ~ 0.01 cm s and aa-it ~ 20 cm/s (Figure
A-lc).
60

Bibliography
R.E. Davis. Predictability of sea surface temperature and sea level pressure anomalies
over the North Pacific ocean. Journal of Physical Oceanography, 6:249-266, 1976.
E. Gallagher, S. Elgar, and R.T. Guza. Observations of sand bar evolution on a natural
beach. Journal of Geophysical Research, 103(C2):3203-3215, 1998.
E.B. Thornton, R.T. Humiston, and W. Birkemeier. Bar/trough generation on a natural
beach. Journal of Geophysical Research, 101(C5):12097-12110, 1996.
61

50272-101
REPORT DOCUMENTATION PAGE
1. REPORT NO.
MITAVHOI 2004-01 3. Recipient's Accession No.
4. Title and Subtitle
Observations and Modeling of Wave-Acceleration-Induced Sediment Transport in the Surfzone
5. Report Date February 2004
7. Author(s) Fernanda G. Hoefel
8. Performing Organization Rept. No.
9. Performing Organiration Name and Address
MTTAVHOI Joint Program in Oceanography/Applied Ocean Science & Engineering
10. Projectrrask/Work Unit No.
MTTAVHOI 2004-01 11. Contract(C) or Grant(G) No. ,p. DAAD1999-1-0250 ^ ' DAAD19-03-10072 (G) N00014-02-10145
OCE-0115850
12. Sponsoring Organization Name and Address Army Research Office Office of Naval Research National Ocean Partnership Program National Science Foundation
13. Type of Report & Period Covered
Ph.D. Thesis
14.
15. Supplementary Notes
This thesis should be cited as: Fernanda G. Hoefel, 2004. Observations and Modelmg of Wave-Acceleration-Induced Sediment
Transport in the Surfzone. Ph.D. Thesis. MITAVHOI, 2004-01.
16. Abstract (Limit: 200 words)
Onshore sediment transport and sandbar migration are important to the morphological evolution of beaches, but are not
understood well. Here, a new model that accounts for accelerations of wave-orbital velocities predicts onshore sandbar migration
observed on an ocean beach. In both the observations and the model, the location of the maximum acceleration-induced transport
moves shoreward with the sandbar, resulting in feedback between waves and morphology that drives the bar shoreward until
conditions change. A model that combines the effects of transport by waves and mean currents simulates both onshore and offshore bar migration observed over a 45-day period. A stochastic nonlinear Boussinesq model for the evolution of waves in shallow water is coupled with the wave-acceleration-driven sediment transport model to predict observed onshore sediment
transport and sandbar migration given observations of the offshore wave field and initial bathymetry. The Boussinesq-wave model
has skill in predicting wave spectra, as well as velocity and accceleration statistics across the surfzone, but it underpredicts
acceleration skewness on top of the sandbar. As a result, the coupled wave-sediment transport model underpredicts sediment
transport, and thus fails to move the sandbar onshore. Although the coupled wave and sediment model can be tuned to yield skillful predictions of onshore sandbar migration, in general, closer agreement between observed and modeled statistics of the
wave field is essential for the successful application of wave models to predict sediment transport.
17. Document Analysis a. Descriptors
sediment transport beach wave-acceleration
b. Identifiers/Open-Ended Terms
c. COSATI Field/Group
18. Availability Statement
Approved for publication; distribution unlimited.
19. Security Class (This Report)
UNCLASSIFIED 20. Security Class (This Page)
21.No. of Pages
61 22. Price
(SeeANSI-Z39.18) See Instructions on Reverse OPTIONAL FORM 272 (4-77) (Formerly NTlS-35) Department of Commerce