amkor technology inc. - credit suisse
TRANSCRIPT

DISCLOSURE APPENDIX AT THE BACK OF THIS REPORT CONTAINS IMPORTANT DISCLOSURES, ANALYST CERTIFICATIONS, AND THE STATUS OF NON-US ANALYSTS. US Disclosure: Credit Suisse does and seeks to do business with companies covered in its research reports. As a result, investors should be aware that the Firm may have a conflict of interest that could affect the objectivity of this report. Investors should consider this report as only a single factor in making their investment decision.
CREDIT SUISSE SECURITIES RESEARCH & ANALYTICS BEYOND INFORMATION®
Client-Driven Solutions, Insights, and Access
28 July 2015
Americas/United States
Equity Research
Semiconductor Equipment
Amkor Technology Inc.
(AMKR.OQ) DECREASE TARGET PRICE
Outlook consistent for another slow quarter
■ 2Q15 sales at the low end of guidance. Amkor's sales and profitability were below our lowered preview numbers of 15 July. Sales were US$737 mn, down 1% QoQ (vs -2% to +4% guidance) on Android weakness, excess fabless inventory, and lackluster PC/tablets. Lower sales impacted GM/OpM by -260 bp/-210 bp to 15.6%/5.2%, taking EPS to $0.04—below its $0.05-$0.15 guidance. Equipment capex was cut from US$450 mn to US$400 mn (-38%
YoY), plus US$150 mn was provided for K5, keeping FCF slightly negative.
■ Correction extends into 3Q15, but Apple boosts the 4Q outlook. 3Q15 sales were guided to be -5% to +2% QoQ, below our lowered +6% QoQ and the street's +11% QoQ estimates, keeping GMs at 13-16% vs our prior estimate of 19% and the street's 20%. Sales are falling the sharpest in mobile on Android weakness, although consumer (TV/STB) is lower and broad-based IDMs are staying more conservative. Off the lower base, we model 7% QoQ growth in 4Q15 due to double-digit exposure to Apple with
the AP, baseband, connectivity, sensors, and analog.
■ Targeting mild core growth in 2016 with a lift from J-Devices. We model +7% YoY Amkor base business plus US$1.02 bn consolidating J-Devices to drive 41% consolidated sales growth in 2016. Key targets will be WL CSP for mobile (15-20% of sales), China/Taiwan (5% of sales), automotive (>10% of sales), "SLIM and SWIFT" high-end packages, and continued growth from
memory (now 14% of sales). Inventory should also be more of a tailwind.
■ Reduce TP from US$7.40 to US$5.50—weakness getting priced in. On the softer outlook, we trim our 2015/16E EPS from US$0.62/0.70 to US$0.35/0.55. Our industry view remains muted due to higher fabless inventory, although a slowdown in consumer tech is increasingly getting priced in. We stay NEUTRAL with a lowered TP of US$5.50 (from US$7.40), based on 10x 2016E EPS and 1.0x forward P/B. Its valuation is at the low end of its trading
range—0.8x EV/sales (vs 0.5-1.2x) and 3.2x EV/EBITDA (vs 2.5-5.0x).
Share price performance
4
6
8
10
Jul-14 Oct-14 Jan-15 Apr-15
Daily Jul 28, 2014 - Jul 27, 2015, 7/28/14 = US$9.8
Price Indexed S&P 500 INDEX
On 07/27/15 the S&P 500 INDEX closed at 2067.64
Quarterly EPS 1Q 2Q 3Q 4Q 2013A 0.07 0.14 0.15 0.17 2014E 0.09 0.21 0.20 0.38 2015E 0.12 0.04 0.04 0.14
Financial and valuation metrics
Year 12/13A 12/14E 12/15E 12/16E EPS - (Excl. ESO) (US$) 0.53 0.87 0.35 0.55 EPS (CS adj.) (US$) 0.53 0.87 0.35 0.55 Prev. EPS (CS adj.) (US$) — — 0.62 0.70 P/E (CS adj., x) 9.3 5.6 14.0 8.9 P/E rel. (CS adj., %) 50.9 31.0 86.4 61.6 Revenue (US$ m) 2,956.4 3,129.4 2,981.7 4,202.7 EBITDA (US$ m) 652.5 761.2 687.8 886.9 Net debt (US$ m) 1,040 1,078 1,126 1,157 OCFPS (US$) 2.41 2.59 2.31 2.40 P/OCF (x) 2.5 1.9 2.1 2.1
Number of shares (m) 237.37 Price/sales(x) 0.37 BV/share (Next Qtr., US$) 4.5 P/BVPS (x) 0.98 Net debt (Next Qtr., US$ m) 1,021.3 Dividend (current, US$) 1.0 Dividend yield (%) 20.3
Source: Company data, Credit Suisse estimates
Rating NEUTRAL* Price (27 Jul 15, US$) 4.92 Target price (US$) (from 7.40) 5.50¹ 52-week price range 10.62 - 4.92 Market cap. (US$ mn) 1,167.88
*Stock ratings are relative to the coverage universe in each
analyst's or each team's respective sector.
¹Target price is for 12 months.
[V] = Stock considered volatile (see Disclosure Appendix).
Research Analysts
Randy Abrams, CFA
886 2 2715 6366
Farhan Ahmad
415 249 7929
Nickie Yue
886 2 2715 6364

28 July 2015
Amkor Technology Inc.
(AMKR.OQ) 2
Focus tables and charts Exhibit 1: Amkor—June results and September guidance light; revising down 2015/16 estimates
AMKR
Actual CS Old Cons Guidance CS CS Old Cons Guidance CS CS Old Cons CS CS Old Cons
Total Revenue $736.7 $750.3 $750.0 $725 - 775mn $725.7 $796.8 $820.0 $700-750mn $2,981.7 $3,118.7 $4,042.0 $4,202.7 $4,439.4 $4,006.5
% Q/Q chng -0.8% 1.0% 1.0% -2% to +4% -1.5% 6.2% 11.3% -5% to +2%
% Y/Y chng -4.0% -2.2% -2.3% -10.7% -2.0% 0.9% -4.7% -0.3% 29.8% 40.9% 42.3% -0.9%
Total GM* 15.6% 18.2% 17.8% 16-19% 15.0% 19.4% 20.9% 13-16% 16.8% 19.0% 19.5% 16.7% 17.5% 21.3%
Operating Exp.* $76.5 $81.4 $78.5 $82.2 $315.2 $327.9 $413.5 $431.8
Operating Mgin* 5.2% 7.3% 7.0% 4.1% 9.0% 10.6% 6.3% 8.5% 8.8% 6.8% 7.8% 10.2%
Net Income* $9.6 $27.0 $23.7 $12-$35mn $10.7 $41.1 $50.2 $7mn-$14mn $83.2 $147.0 $189.0 $131.5 $167.0 $225.3
Net Margin* 0.0% 0.0% 3.2% 1.5% 5.2% 6.1% 2.8% 4.7% 4.7% 3.1% 3.8% 5.6%
EPS* $0.04 $0.11 $0.11 $0.05-$0.15 $0.04 $0.17 $0.17 -0.03-$0.06 $0.35 $0.62 $0.74 $0.55 $0.70 $0.98
Fully diluted shares 237.3 237.4 237.3 237.4 237.4 237.4 237.3 237.4
F2016ESep-15Jun-15 F2015E
Source: Company data, Credit Suisse estimates, Bloomberg consensus
Exhibit 2: Industry equipment orders declining in 2H15 Exhibit 3: GMs lower in 2Q/3Q on the weaker outlook
0
75
150
225
300
375
450
0
5
10
15
20
25
30
Jan
-01
Au
g-0
1
Ma
r-0
2
Oct-
02
Ma
y-0
3
De
c-0
3
Jul-
04
Fe
b-0
5
Se
p-0
5
Ap
r-06
No
v-0
6
Jun
-07
Jan
-08
Au
g-0
8
Ma
r-0
9
Oct-
09
Ma
y-1
0
De
c-1
0
Jul-
11
Fe
b-1
2
Se
p-1
2
Ap
r-13
No
v-1
3
Jun
-14
Jan
-15
Au
g-1
5
Equipment Bookings (US$ mn)
Stock Price
BE Bookings AMKR Stock
-5.0%
0.0%
5.0%
10.0%
15.0%
20.0%
25.0%
30.0%
-$150,000
$0
$150,000
$300,000
$450,000
$600,000
$750,000
$900,000
Ma
r-09
Jun
-09
Se
p-0
9
Dec-0
9
Ma
r-10
Jun
-10
Se
p-1
0
Dec-1
0
Ma
r-11
Jun
-11
Se
p-1
1
Dec-1
1
Ma
r-12
Jun
-12
Se
p-1
2
Dec-1
2
Ma
r-13
Jun
-13
Se
p-1
3
Dec-1
3
Ma
r-14
Jun
-14
Se
p-1
4
Dec-1
4
Mar-
15
Jun
-15
Se
p-1
5
Dec-1
5
Revenue GM% OpM%
US$K GM (%)
Source: Company data, Credit Suisse estimates, SEMI Source: Company data, Credit Suisse estimates
Exhibit 4: FCF slightly negative due to K5's construction Exhibit 5: AMKR EV/EBITDA now at lower levels
-300
-200
-100
-
100
200
300
400
-$600
-$400
-$200
$0
$200
$400
$600
$800
F1
99
8
F1
99
9
F2
00
0
F2
00
1
F2
00
2
F2
00
3
F2
00
4
F2
005
F2
006
F2
007
F2
008
F2
00
9
F2
01
0
F2
01
1
F2
01
2
F2
01
3
F2
01
4
F2
01
5E
F2
01
6E
FCF (US$mn)Capex (US$ mn)
Operating CF Capex FCF
2.0
2.5
3.0
3.5
4.0
4.5
5.0
5.5
6.0
6.5
7.0
7.5
Sep
-05
Feb
-06
Ju
l-0
6
De
c-0
6
Ma
y-0
7
Oct-
07
Ma
r-08
Au
g-0
8
Ja
n-0
9
Ju
n-0
9
No
v-0
9
Ap
r-1
0
Sep
-10
Feb
-11
Ju
l-1
1
De
c-1
1
Ma
y-1
2
Oct-
12
Ma
r-13
Au
g-1
3
Ja
n-1
4
Ju
n-1
4
No
v-1
4
Ap
r-1
5
Sep
-15
EV/EBITDA
EV/EBITDA
Source: Company data, Credit Suisse estimates Source: Company data, Credit Suisse estimates
Exhibit 6: Amkor at a valuation discount but also has a lower ROE now Price Mkt Cap EV/Sales (x) EV/EBITDA (x) P/E Multiple (x) P/B Multiple (x) ROE Trough/Peak (EV/Sales)
Company Ticker 7/28/2015 (US$mn) 2014 2015 2016 2014 2015 2016 2014 2015 2016 2014 2015 2016 2014 2015 2016
Select backend peers
Amkor AMKR $4.25 $1,168 0.7 0.8 0.6 3.0 3.3 2.6 4.9 12.1 7.7 0.9 0.8 0.7 18.6 6.9 9.8
ASE 2311.TW $35.75 $8,857 1.2 1.1 1.0 5.6 5.4 5.1 12.1 12.9 11.3 1.9 1.9 1.8 15.7 14.5 15.6
SPIL 2325.TW $37.25 $3,676 1.4 1.4 1.2 4.4 4.0 3.7 10.0 9.5 8.6 1.6 1.5 1.5 16.3 16.1 17.2
Chipbond 6147.TWO $42.20 $867 1.8 1.8 1.5 5.4 5.5 4.5 10.7 11.8 8.0 1.2 1.2 1.1 11.0 9.8 13.4
ChipMOS 8150.TW $32.20 $934 1.0 1.1 0.9 3.5 3.3 2.9 8.3 10.2 8.9 1.5 1.5 1.4 18.2 14.4 15.4
Powertech 6239.TW $52.90 $1,280 1.0 0.9 0.8 3.1 2.8 2.6 12.5 10.6 9.8 1.3 1.2 1.1 10.3 11.3 11.6
Median 1.1 1.1 0.9 3.9 3.7 3.3 10.3 11.2 8.7 1.4 1.3 1.3 16.0 12.8 14.4
Mean 1.2 1.2 1.0 4.1 4.1 3.6 9.7 11.2 9.0 1.4 1.3 1.3 15.0 12.2 13.8 Source: Company data, Credit Suisse estimates

28 July 2015
Amkor Technology Inc.
(AMKR.OQ) 3
Outlook consistent for another slow quarter ahead of the Apple builds Amkor remains a technology leader in back-end packaging and test, with more
concentration on flip chip and wafer-level packaging (50% of revenue from advanced
packaging, versus 30% for ASE and SPIL), and most of its smartphones positioning is at
the higher end of the mobile market. In the near term, that high-end exposure is triggering
weakness as Samsung has shifted business from Amkor's top customer Qualcomm (17%
of sales in 2014) to its own internal silicon that is packaged mostly in-house in its back-end
facilities, and the other Android brands are seeing compression as mobile growth slows,
tablets decline and Apple takes more value share.
Beyond Android smartphones, Amkor is facing a more muted outlook from its broader
customer base, which we note (quarter-to-date) across fabless and IDMs' reporting—their
managements have guided 2Q15 sales on average to be down 2% QoQ, vs the normal 3-
5% QoQ growth, and inventory to be up a day to 94 days, up 16 days from last year, which
was more than the normal level. Amkor trimmed its 3Q15 revenue outlook to -5% to +2%
QoQ for 3Q15 vs the normal high-single-digit seasonality due to pullbacks from mobile and
consumer, and a bit of softness in the broad-based business, taking GMs down to 13-16%
and EPS to -US$0.03 to -US$0.06. The company should post mild growth in 4Q15 as it
ramps up Apple component orders for iPhone 6S. Equipment capex was also cut from
US$450 mn to US$400 mn, plus $150 mn was provided for facility investment in K5 in Korea.
The company should have relatively stable equipment investment next year but will still need
to spend US$200 mn to complete the construction of K5, pushing out positive FCF to 2017.
For 2016, we model a better year, with a +7% YoY Amkor base business plus a US$1.02
bn consolidating J-Devices driving 41% consolidated sales growth in 2016. Key targets will
be WL CSP for mobile (15-20% of sales), China/Taiwan (5% of sales), automotive (>10%
of sales), "SLIM and SWIFT" high-end packages, and continued growth from memory
(now 14% of sales). Inventory should also move from a headwind to a tailwind.
On the softer outlook, we trim our 2015/16E EPS from $0.62/0.70 to $0.35/0.55. Our
industry view remains muted due to higher fabless inventory and a slowdown in consumer
tech, although these are increasingly getting priced in. We maintain our NEUTRAL rating
with a lower TP of US$5.50 (from US$7.40), based on 10x 2016E EPS and 1.0x forward
P/B. The valuation is at the low end of its trading range—0.8x EV/sales (vs 0.5-1.2x) and
3.2x EV/EBITDA (vs 2.5-5.0x). This, in our view, is reasonable, although with growth
staying muted due to the mixed tech outlook the stock may remain range-bound, with a
possible trade into the iPhone ramp-up in 4Q15 and 1Q16 restocking as Amkor is
maintaining a pretty good share of the Apple processor business and peripheral
component orders.
Exhibit 7: Industry equipment orders declining in 2H15 Exhibit 8: FCF slightly negative due K5's construction
0
75
150
225
300
375
450
0
5
10
15
20
25
30
Jan
-01
Au
g-0
1
Ma
r-0
2
Oct-
02
Ma
y-0
3
De
c-0
3
Jul-
04
Fe
b-0
5
Se
p-0
5
Ap
r-06
No
v-0
6
Jun
-07
Jan
-08
Au
g-0
8
Ma
r-0
9
Oct-
09
Ma
y-1
0
De
c-1
0
Jul-
11
Fe
b-1
2
Se
p-1
2
Ap
r-13
No
v-1
3
Jun
-14
Jan
-15
Au
g-1
5
Equipment Bookings (US$ mn)
Stock Price
BE Bookings AMKR Stock
-300
-200
-100
-
100
200
300
400
-$600
-$400
-$200
$0
$200
$400
$600
$800
F1
99
8
F1
99
9
F2
00
0
F2
00
1
F2
00
2
F2
00
3
F2
00
4
F2
005
F2
006
F2
007
F2
008
F2
00
9
F2
01
0
F2
01
1
F2
01
2
F2
01
3
F2
01
4
F2
01
5E
F2
01
6E
FCF (US$mn)Capex (US$ mn)
Operating CF Capex FCF
Source: Company data, Credit Suisse estimates, SEMI Source: Company data, Credit Suisse estimates
Amkor has the leading
technology but is being
impacted by slowing mobile
and excess inventory
Amkor should return to mild
growth in 2016 and have
incremental earnings from
the consolidation of J-
Devices
Reducing estimates on the
lower sales outlook
28 July 2015
Amkor Technology Inc.
(AMKR.OQ) 4
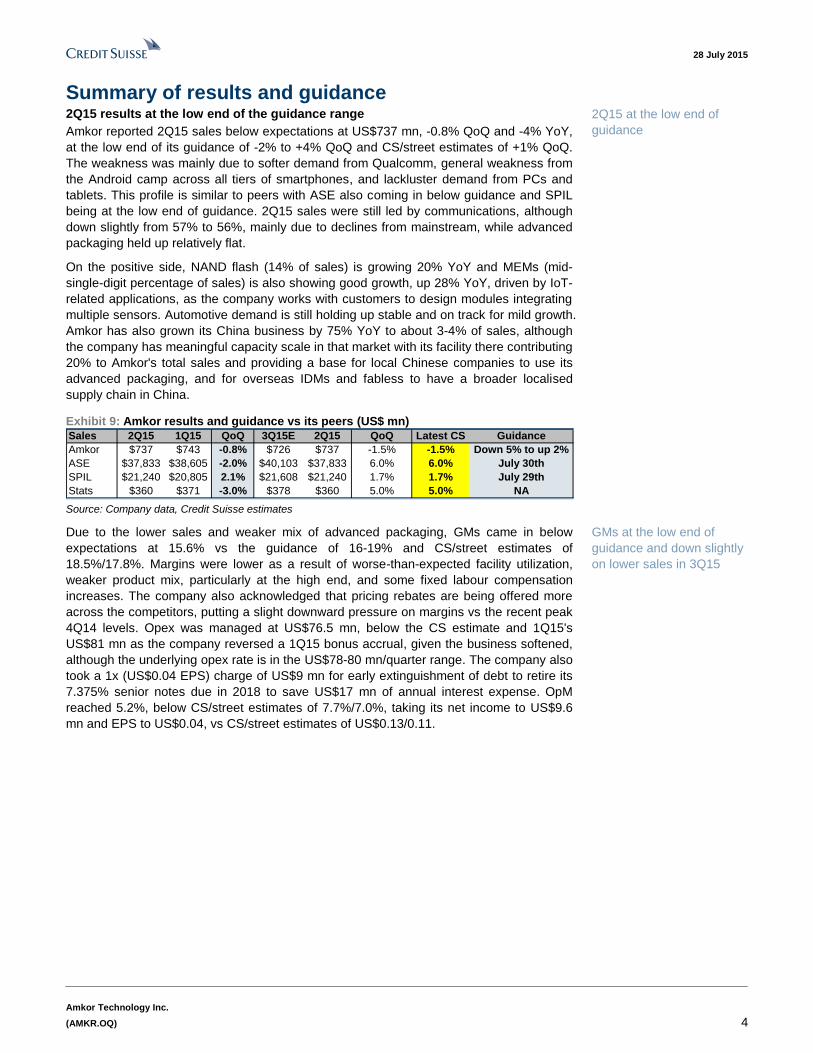
Summary of results and guidance 2Q15 results at the low end of the guidance range
Amkor reported 2Q15 sales below expectations at US$737 mn, -0.8% QoQ and -4% YoY,
at the low end of its guidance of -2% to +4% QoQ and CS/street estimates of +1% QoQ.
The weakness was mainly due to softer demand from Qualcomm, general weakness from
the Android camp across all tiers of smartphones, and lackluster demand from PCs and
tablets. This profile is similar to peers with ASE also coming in below guidance and SPIL
being at the low end of guidance. 2Q15 sales were still led by communications, although
down slightly from 57% to 56%, mainly due to declines from mainstream, while advanced
packaging held up relatively flat.
On the positive side, NAND flash (14% of sales) is growing 20% YoY and MEMs (mid-
single-digit percentage of sales) is also showing good growth, up 28% YoY, driven by IoT-
related applications, as the company works with customers to design modules integrating
multiple sensors. Automotive demand is still holding up stable and on track for mild growth.
Amkor has also grown its China business by 75% YoY to about 3-4% of sales, although
the company has meaningful capacity scale in that market with its facility there contributing
20% to Amkor's total sales and providing a base for local Chinese companies to use its
advanced packaging, and for overseas IDMs and fabless to have a broader localised
supply chain in China.
Exhibit 9: Amkor results and guidance vs its peers (US$ mn)
Sales 2Q15 1Q15 QoQ 3Q15E 2Q15 QoQ Latest CS Guidance
Amkor $737 $743 -0.8% $726 $737 -1.5% -1.5% Down 5% to up 2%
ASE $37,833 $38,605 -2.0% $40,103 $37,833 6.0% 6.0% July 30th
SPIL $21,240 $20,805 2.1% $21,608 $21,240 1.7% 1.7% July 29th
Stats $360 $371 -3.0% $378 $360 5.0% 5.0% NA Source: Company data, Credit Suisse estimates
Due to the lower sales and weaker mix of advanced packaging, GMs came in below
expectations at 15.6% vs the guidance of 16-19% and CS/street estimates of
18.5%/17.8%. Margins were lower as a result of worse-than-expected facility utilization,
weaker product mix, particularly at the high end, and some fixed labour compensation
increases. The company also acknowledged that pricing rebates are being offered more
across the competitors, putting a slight downward pressure on margins vs the recent peak
4Q14 levels. Opex was managed at US$76.5 mn, below the CS estimate and 1Q15's
US$81 mn as the company reversed a 1Q15 bonus accrual, given the business softened,
although the underlying opex rate is in the US$78-80 mn/quarter range. The company also
took a 1x (US$0.04 EPS) charge of US$9 mn for early extinguishment of debt to retire its
7.375% senior notes due in 2018 to save US$17 mn of annual interest expense. OpM
reached 5.2%, below CS/street estimates of 7.7%/7.0%, taking its net income to US$9.6
mn and EPS to US$0.04, vs CS/street estimates of US$0.13/0.11.
2Q15 at the low end of
guidance
GMs at the low end of
guidance and down slightly
on lower sales in 3Q15
28 July 2015
Amkor Technology Inc.
(AMKR.OQ) 5
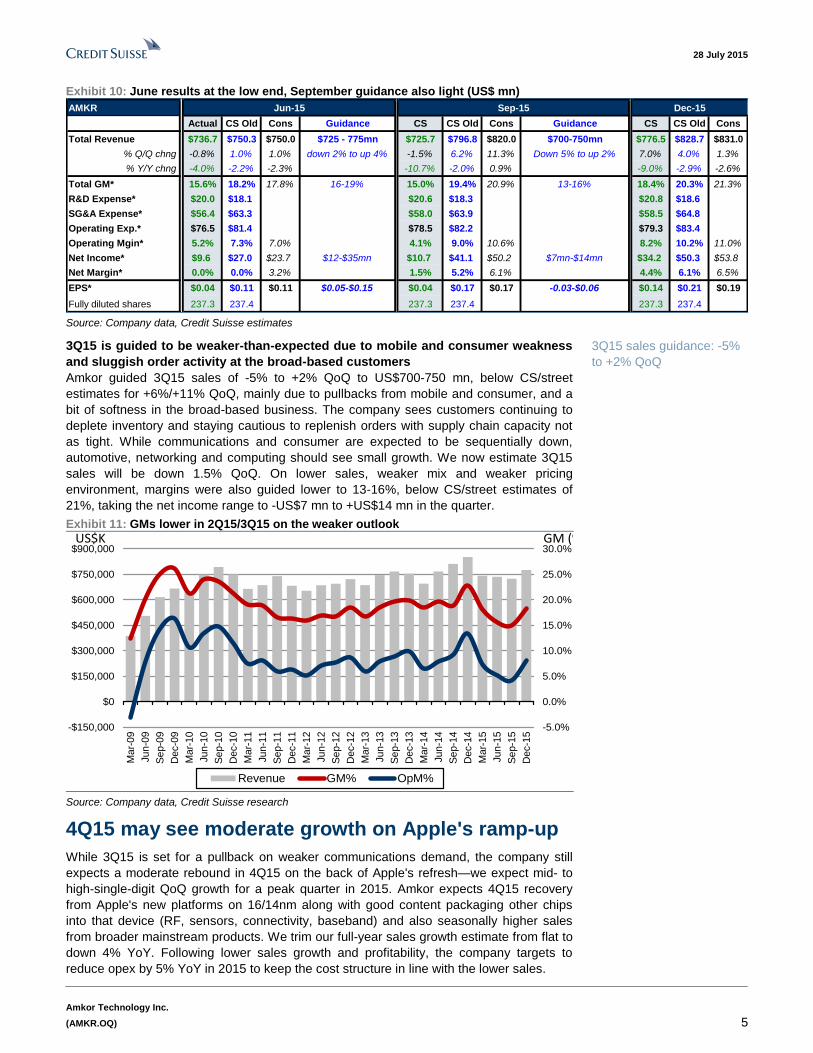
Exhibit 10: June results at the low end, September guidance also light (US$ mn)
AMKR
Actual CS Old Cons Guidance CS CS Old Cons Guidance CS CS Old Cons
Total Revenue $736.7 $750.3 $750.0 $725 - 775mn $725.7 $796.8 $820.0 $700-750mn $776.5 $828.7 $831.0
% Q/Q chng -0.8% 1.0% 1.0% down 2% to up 4% -1.5% 6.2% 11.3% Down 5% to up 2% 7.0% 4.0% 1.3%
% Y/Y chng -4.0% -2.2% -2.3% -10.7% -2.0% 0.9% -9.0% -2.9% -2.6%
Total GM* 15.6% 18.2% 17.8% 16-19% 15.0% 19.4% 20.9% 13-16% 18.4% 20.3% 21.3%
R&D Expense* $20.0 $18.1 $20.6 $18.3 $20.8 $18.6
SG&A Expense* $56.4 $63.3 $58.0 $63.9 $58.5 $64.8
Operating Exp.* $76.5 $81.4 $78.5 $82.2 $79.3 $83.4
Operating Mgin* 5.2% 7.3% 7.0% 4.1% 9.0% 10.6% 8.2% 10.2% 11.0%
Net Income* $9.6 $27.0 $23.7 $12-$35mn $10.7 $41.1 $50.2 $7mn-$14mn $34.2 $50.3 $53.8
Net Margin* 0.0% 0.0% 3.2% 1.5% 5.2% 6.1% 4.4% 6.1% 6.5%
EPS* $0.04 $0.11 $0.11 $0.05-$0.15 $0.04 $0.17 $0.17 -0.03-$0.06 $0.14 $0.21 $0.19
Fully diluted shares 237.3 237.4 237.3 237.4 237.3 237.4
Sep-15Jun-15 Dec-15
Source: Company data, Credit Suisse estimates
3Q15 is guided to be weaker-than-expected due to mobile and consumer weakness
and sluggish order activity at the broad-based customers
Amkor guided 3Q15 sales of -5% to +2% QoQ to US$700-750 mn, below CS/street
estimates for +6%/+11% QoQ, mainly due to pullbacks from mobile and consumer, and a
bit of softness in the broad-based business. The company sees customers continuing to
deplete inventory and staying cautious to replenish orders with supply chain capacity not
as tight. While communications and consumer are expected to be sequentially down,
automotive, networking and computing should see small growth. We now estimate 3Q15
sales will be down 1.5% QoQ. On lower sales, weaker mix and weaker pricing
environment, margins were also guided lower to 13-16%, below CS/street estimates of
21%, taking the net income range to -US$7 mn to +US$14 mn in the quarter.
Exhibit 11: GMs lower in 2Q15/3Q15 on the weaker outlook
-5.0%
0.0%
5.0%
10.0%
15.0%
20.0%
25.0%
30.0%
-$150,000
$0
$150,000
$300,000
$450,000
$600,000
$750,000
$900,000
Ma
r-09
Jun
-09
Se
p-0
9
Dec-0
9
Ma
r-10
Jun
-10
Se
p-1
0
Dec-1
0
Ma
r-11
Jun
-11
Se
p-1
1
Dec-1
1
Ma
r-12
Jun
-12
Se
p-1
2
Dec-1
2
Ma
r-13
Jun
-13
Se
p-1
3
Dec-1
3
Ma
r-14
Jun
-14
Se
p-1
4
Dec-1
4
Mar-
15
Jun
-15
Se
p-1
5
Dec-1
5
Revenue GM% OpM%
US$K GM (%)
Source: Company data, Credit Suisse research
4Q15 may see moderate growth on Apple's ramp-up
While 3Q15 is set for a pullback on weaker communications demand, the company still
expects a moderate rebound in 4Q15 on the back of Apple's refresh—we expect mid- to
high-single-digit QoQ growth for a peak quarter in 2015. Amkor expects 4Q15 recovery
from Apple's new platforms on 16/14nm along with good content packaging other chips
into that device (RF, sensors, connectivity, baseband) and also seasonally higher sales
from broader mainstream products. We trim our full-year sales growth estimate from flat to
down 4% YoY. Following lower sales growth and profitability, the company targets to
reduce opex by 5% YoY in 2015 to keep the cost structure in line with the lower sales.
3Q15 sales guidance: -5%
to +2% QoQ

28 July 2015
Amkor Technology Inc.
(AMKR.OQ) 6
Exhibit 12: Industry revenues falling off in 2015 Exhibit 13: Amkor market share still down slightly
-60%
-40%
-20%
0%
20%
40%
60%
80%
100%
$0
$500
$1,000
$1,500
$2,000
$2,500
$3,000
$3,500
$4,000
1Q
99
3Q
99
1Q
00
3Q
00
1Q
01
3Q
01
1Q
02
3Q
02
1Q
03
3Q
03
1Q
04
3Q
04
1Q
05
3Q
05
1Q
06
3Q
06
1Q
07
3Q
07
1Q
08
3Q
08
1Q
09
3Q
09
1Q
10
3Q
10
1Q
11
3Q
11
1Q
12
3Q
12
1Q
13
3Q
13
1Q
14
3Q
14
1Q
15
YoY GrowthUS$ mn
SiP SPIL Amkor Stats YoY Growth
10%
15%
20%
25%
30%
35%
40%
45%
50%
$0$400$800
$1,200$1,600$2,000$2,400$2,800$3,200$3,600$4,000
1Q
99
3Q
99
1Q
00
3Q
00
1Q
01
3Q
01
1Q
02
3Q
02
1Q
03
3Q
03
1Q
04
3Q
04
1Q
05
3Q
05
1Q
06
3Q
06
1Q
07
3Q
07
1Q
08
3Q
08
1Q
09
3Q
09
1Q
10
3Q
10
1Q
11
3Q
11
1Q
12
3Q
12
1Q
13
3Q
13
1Q
14
3Q
14
1Q
15
3Q
15E
ASE % of industryUS$ mn Sales
SiP SPIL Amkor Stats AMKR % of industry
Source: Company data, Credit Suisse estimates Source: Company data, Credit Suisse estimates
Amkor marketing technology capabilities to gain
share as customers migrate to advanced packages
As a strategy to differentiate its technology offerings, Amkor is now introducing a roadmap
of advanced packaging that combines more advanced substrate variations of its substrate
products (flip chip CSP and flip chip BGA), fan-out packaging and advanced wafer-level
packaging. At the advanced wafer-level packaging, the company has introduced a silicon
interposer solution (SLIM) that can work around using complicated through silicon vias and
an improved fan-out packaging architecture (SWIFT).
Exhibit 14: Amkor developing advanced packaging spanning fan-out, wafer-level and
advanced substrate packages
Source: Amkor
Amkor is now marketing its newly developed SWIFT (Silicon Wafer Integrated Fan Out
Tech) and SLIM (Silicon less integrated module) technologies. The company's fan-out and
2.5D solutions can combine multiple chips including processor, memory, base band and
other ICs, enabling customers to build very thin and very small products:
■ SLIM: Silicon interposer package. SLIM is a lower-cost solution that simplifies the
process and allows for supply-chain flexibility. The output will also deliver a reduction
in package thickness. It leverages Amkor's 2.5D wafer processing and assembly
equipment and expertise.
■ SWIFT: Advanced fan-out package. SWIFT is Amkor's advanced fan-out package
that targets mobile and networking applications. SWIFT combines baseband,
application processor, logic and memory to drive advanced die integration.
Amkor launching new fan-
out and wafer-level
packaging solutions for
2017 volumes

28 July 2015
Amkor Technology Inc.
(AMKR.OQ) 7
Exhibit 15: Amkor's advanced WLP positioning Exhibit 16: SLIM and SWIFT package definition
Source: Company data Source: Company data
Mobile under some pressure but diversifying into
new applications
To counteract the slowing smartphone and tablet growth rates, Amkor targets to keep its
high share at the flagship models while diversifying into new growth drivers, including (1)
expanding WL CSP in mobile (18% of sales), (2) growing China/Taiwan to 4-5% of sales,
(3) expanding automotive (>10% of sales), and (5) growing its MEMs/sensor business
(mid-single-digit contribution.
1. Another volume ramp-up for Apple, although some risk with TSMC InFO in
2016. We expect Amkor to maintain a good market share of the Apple processor
business out of TSMC this year, a project that should still reach 3-5% of 2H15
sales. In 2016, however, we believe TSMC will vertically integrate the business
using its internal InFO process as it is procuring equipment and has a large team
working with this customer on this strategic project. In the long term, Amkor has
presented a roadmap with SWIFT and SLIM to capture fan-out and 2.5D
businesses, but most of these volumes it notes would start from 2017.
2. US baseband high-end orders impacted by GS6; may recover when
Snapdragon 820 ramps up on Samsung 14nm. We believe Amkor was the
most exposed back-end supplier to Qualcomm's Snapdragon 810 licensing
technology supplied by Shinko, and consequently faces more impact in 2Q15
from that shift to Samsung. We see potential for some rebound in 2016 as
Qualcomm may recover some share into future high-end Samsung products with
the Snapdragon 820 moving back to Samsung on 14nm in late 2015. Qualcomm
still uses the external back-end suppliers, giving opportunity for Amkor to recover
share later in the year.
3. Low-cost Asian smartphone customer expansion. Amkor grew greater China
sales by about 75% in 1H15 to 3-4% of sales and targets to get to 4-5% of sales
exiting 2015. We believe Amkor has penetrated into a notable AP/baseband
smartphone IC supplier and in the longer term targets the largest China and
Taiwan IC design house.
Amkor's Apple business
ramping up again in 2015
but may be lost to TSMC
InFO in 2016
Qualcomm orders would
rebound if Snapdragon 820
is designed back into high-
end Samsung phones

28 July 2015
Amkor Technology Inc.
(AMKR.OQ) 8
Exhibit 17: End-market sales (US$ mn)—communications
the largest
Exhibit 18: Revenue % by end-market—communications
> 50%
$0
$100
$200
$300
$400
$500
$600
$700
$800
$900
De
c-1
2
Ma
r-1
3
Jun
-13
Se
p-1
3
De
c-1
3
Ma
r-1
4
Jun
-14
Se
p-1
4
De
c-1
4
Ma
r-1
5
Jun
-15
End Market Segments
Communications Computing Consumer Networking Industrial/Auto
0%
10%
20%
30%
40%
50%
60%
70%
80%
90%
100%
De
c-1
2
Ma
r-1
3
Jun
-13
Sep-1
3
De
c-1
3
Ma
r-1
4
Jun-1
4
Se
p-1
4
De
c-1
4
Ma
r-1
5
Jun
-15
End Market Segments Mix
Communications Computing Consumer Networking Industrial/Auto
Source: Company data, Credit Suisse research Source: Company data, Credit Suisse research
4. Memory growth from Toshiba NAND and some Mobile DRAM. Memory is now
14% of sales and still growing at 20% YoY. The company targets to continue
outgrowing the NAND market and also continuing to supply mobile DRAM
packaging and test to a US customer.
5. Growth from automotive. Amkor's automotive business grew 25% YoY in 2014
to US$760 mn (US$410 mn J-Devices + US$350 mn Amkor), and the company
targets growing that to US$1 bn in the next few years (about 20% of expected
sales by 2017).
6. Fan-in WLP strength. Amkor has almost 100 customers using the fan-in wafer-
level packaging, a growing area now at 25-30% of advanced packaging sales (10-
15% of total), and providing a lift due to good returns as the business has low
material content and high level of service requirement for the turn-key assembly,
probe, and bumping businesses. Fan-in packaging is seeing growth from lower
pin count small form-factor mobile devices, including RF, connectivity and power
management.
7. Sensor and RF growing through SiP packaging. Amkor has also ramped up its
fingerprint IC packaging and MEMs sensors for automotive and IoT, with sensors
now about mid-single-digits contribution and is also now creating RF front-end
modules for mobile products. The company highlighted this as a growth area, and
we believe it presents an opportunity for the company to do more SiP advanced
packaging with good margins. Amkor's SiP combines one or more ICs of different
functionalities, which may include passive components and/or MEMS assembled
into a single package. SiP may contain one or more IC chips, either wirebonded,
flip chip, or both, plus other components that are traditionally found on the system
motherboard. Amkor's business model for SiP is a contrast to ASE, which is also
trying to do board-level SiP modules using its USI Shanghai contract
manufacturing footprint that is additive to the top line with high materials content
but at lower margins due to its high pass-through content.
J-Devices acquisition provides incremental sales
once consolidated in 2016
Amkor currently owns 66% of J-Devices, a Japanese back-end supplier that has
consolidated several of the local back-end operations. Amkor disclosed in 2014 that J-
Devices had reached US$923 mn sales, US$123 mn gross profit and US$50 mn net
income. We believe that venture is now approaching US$1 bn run-rate for the fiscal year
ending March 2015. Amkor plans to raise its stake to 80% and consolidate operations in
2016, with a small minority interest deduction. We estimate by 2016 J-Devices could
contribute US$1 bn sales, 13% GMs, and 6% pretax margin and US$0.18 EPS.
Fan-in and sensor
packaging is growing
J-Devices consolidation
adds US$1 bn sales in 2016
once ownership reaches
80%
28 July 2015
Amkor Technology Inc.
(AMKR.OQ) 9
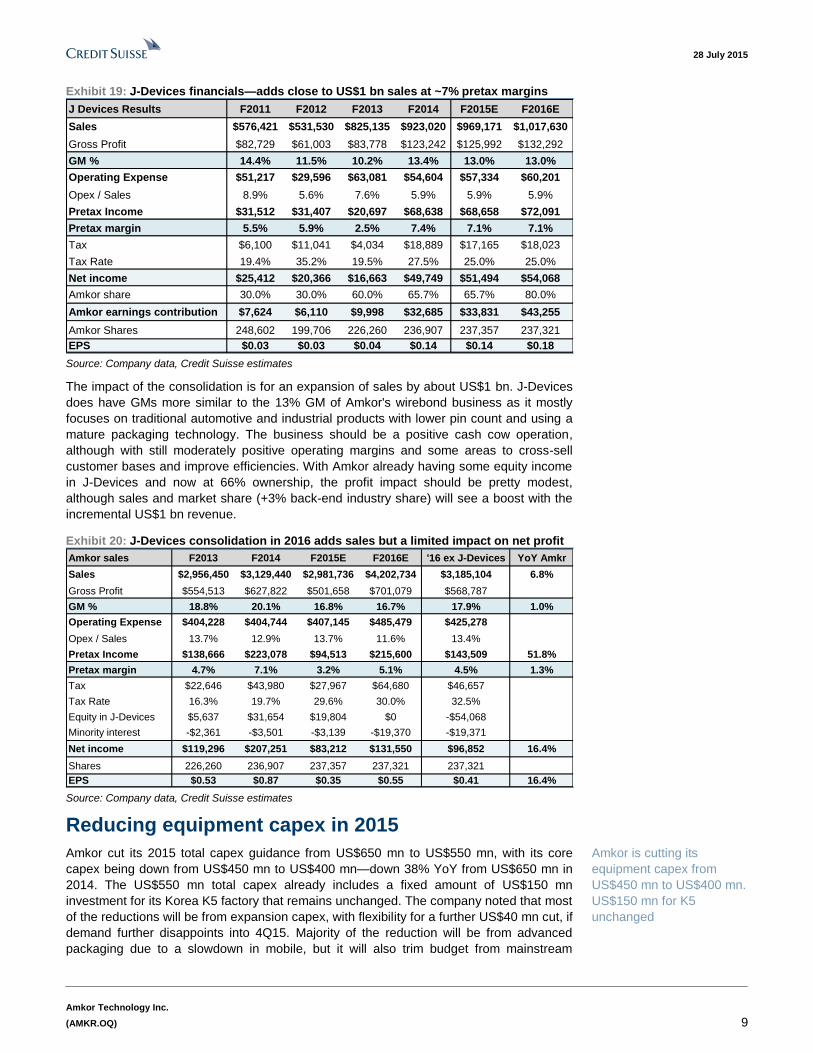
Exhibit 19: J-Devices financials—adds close to US$1 bn sales at ~7% pretax margins
J Devices Results F2011 F2012 F2013 F2014 F2015E F2016E
Sales $576,421 $531,530 $825,135 $923,020 $969,171 $1,017,630
Gross Profit $82,729 $61,003 $83,778 $123,242 $125,992 $132,292
GM % 14.4% 11.5% 10.2% 13.4% 13.0% 13.0%
Operating Expense $51,217 $29,596 $63,081 $54,604 $57,334 $60,201
Opex / Sales 8.9% 5.6% 7.6% 5.9% 5.9% 5.9%
Pretax Income $31,512 $31,407 $20,697 $68,638 $68,658 $72,091
Pretax margin 5.5% 5.9% 2.5% 7.4% 7.1% 7.1%
Tax $6,100 $11,041 $4,034 $18,889 $17,165 $18,023
Tax Rate 19.4% 35.2% 19.5% 27.5% 25.0% 25.0%
Net income $25,412 $20,366 $16,663 $49,749 $51,494 $54,068
Amkor share 30.0% 30.0% 60.0% 65.7% 65.7% 80.0%
Amkor earnings contribution $7,624 $6,110 $9,998 $32,685 $33,831 $43,255
Amkor Shares 248,602 199,706 226,260 236,907 237,357 237,321
EPS $0.03 $0.03 $0.04 $0.14 $0.14 $0.18 Source: Company data, Credit Suisse estimates
The impact of the consolidation is for an expansion of sales by about US$1 bn. J-Devices
does have GMs more similar to the 13% GM of Amkor's wirebond business as it mostly
focuses on traditional automotive and industrial products with lower pin count and using a
mature packaging technology. The business should be a positive cash cow operation,
although with still moderately positive operating margins and some areas to cross-sell
customer bases and improve efficiencies. With Amkor already having some equity income
in J-Devices and now at 66% ownership, the profit impact should be pretty modest,
although sales and market share (+3% back-end industry share) will see a boost with the
incremental US$1 bn revenue.
Exhibit 20: J-Devices consolidation in 2016 adds sales but a limited impact on net profit
Amkor sales F2013 F2014 F2015E F2016E '16 ex J-Devices YoY Amkr
Sales $2,956,450 $3,129,440 $2,981,736 $4,202,734 $3,185,104 6.8%
Gross Profit $554,513 $627,822 $501,658 $701,079 $568,787
GM % 18.8% 20.1% 16.8% 16.7% 17.9% 1.0%
Operating Expense $404,228 $404,744 $407,145 $485,479 $425,278
Opex / Sales 13.7% 12.9% 13.7% 11.6% 13.4%
Pretax Income $138,666 $223,078 $94,513 $215,600 $143,509 51.8%
Pretax margin 4.7% 7.1% 3.2% 5.1% 4.5% 1.3%
Tax $22,646 $43,980 $27,967 $64,680 $46,657
Tax Rate 16.3% 19.7% 29.6% 30.0% 32.5%
Equity in J-Devices $5,637 $31,654 $19,804 $0 -$54,068
Minority interest -$2,361 -$3,501 -$3,139 -$19,370 -$19,371
Net income $119,296 $207,251 $83,212 $131,550 $96,852 16.4%
Shares 226,260 236,907 237,357 237,321 237,321
EPS $0.53 $0.87 $0.35 $0.55 $0.41 16.4% Source: Company data, Credit Suisse estimates
Reducing equipment capex in 2015
Amkor cut its 2015 total capex guidance from US$650 mn to US$550 mn, with its core
capex being down from US$450 mn to US$400 mn—down 38% YoY from US$650 mn in
2014. The US$550 mn total capex already includes a fixed amount of US$150 mn
investment for its Korea K5 factory that remains unchanged. The company noted that most
of the reductions will be from expansion capex, with flexibility for a further US$40 mn cut, if
demand further disappoints into 4Q15. Majority of the reduction will be from advanced
packaging due to a slowdown in mobile, but it will also trim budget from mainstream
Amkor is cutting its
equipment capex from
US$450 mn to US$400 mn.
US$150 mn for K5
unchanged
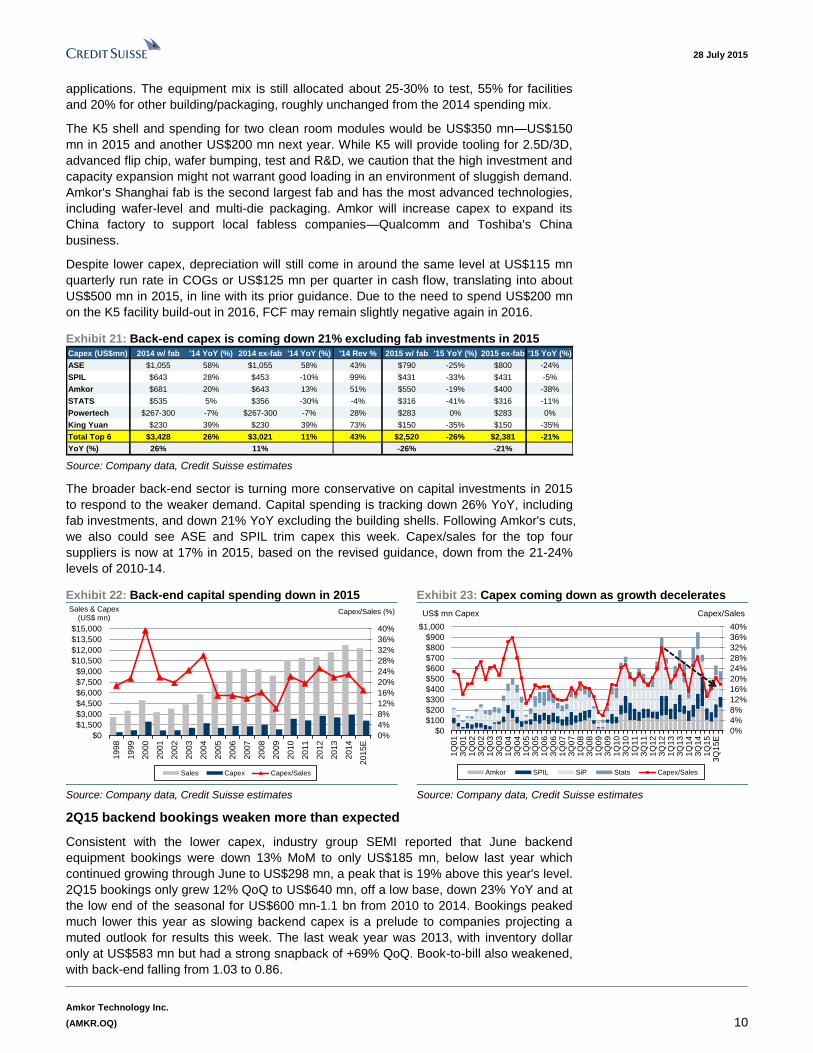
28 July 2015
Amkor Technology Inc.
(AMKR.OQ) 10
applications. The equipment mix is still allocated about 25-30% to test, 55% for facilities
and 20% for other building/packaging, roughly unchanged from the 2014 spending mix.
The K5 shell and spending for two clean room modules would be US$350 mn—US$150
mn in 2015 and another US$200 mn next year. While K5 will provide tooling for 2.5D/3D,
advanced flip chip, wafer bumping, test and R&D, we caution that the high investment and
capacity expansion might not warrant good loading in an environment of sluggish demand.
Amkor's Shanghai fab is the second largest fab and has the most advanced technologies,
including wafer-level and multi-die packaging. Amkor will increase capex to expand its
China factory to support local fabless companies—Qualcomm and Toshiba's China
business.
Despite lower capex, depreciation will still come in around the same level at US$115 mn
quarterly run rate in COGs or US$125 mn per quarter in cash flow, translating into about
US$500 mn in 2015, in line with its prior guidance. Due to the need to spend US$200 mn
on the K5 facility build-out in 2016, FCF may remain slightly negative again in 2016.
Exhibit 21: Back-end capex is coming down 21% excluding fab investments in 2015 Capex (US$mn) 2014 w/ fab '14 YoY (%) 2014 ex-fab '14 YoY (%) '14 Rev % 2015 w/ fab '15 YoY (%) 2015 ex-fab '15 YoY (%)
ASE $1,055 58% $1,055 58% 43% $790 -25% $800 -24%
SPIL $643 28% $453 -10% 99% $431 -33% $431 -5%
Amkor $681 20% $643 13% 51% $550 -19% $400 -38%
STATS $535 5% $356 -30% -4% $316 -41% $316 -11%
Powertech $267-300 -7% $267-300 -7% 28% $283 0% $283 0%
King Yuan $230 39% $230 39% 73% $150 -35% $150 -35%
Total Top 6 $3,428 26% $3,021 11% 43% $2,520 -26% $2,381 -21%
YoY (%) 26% 11% -26% -21% Source: Company data, Credit Suisse estimates
The broader back-end sector is turning more conservative on capital investments in 2015
to respond to the weaker demand. Capital spending is tracking down 26% YoY, including
fab investments, and down 21% YoY excluding the building shells. Following Amkor's cuts,
we also could see ASE and SPIL trim capex this week. Capex/sales for the top four
suppliers is now at 17% in 2015, based on the revised guidance, down from the 21-24%
levels of 2010-14.
Exhibit 22: Back-end capital spending down in 2015 Exhibit 23: Capex coming down as growth decelerates
0%
4%
8%
12%
16%
20%
24%
28%
32%
36%
40%
$0
$1,500
$3,000
$4,500
$6,000
$7,500
$9,000
$10,500
$12,000
$13,500
$15,000
19
98
19
99
20
00
20
01
20
02
20
03
20
04
20
05
20
06
20
07
20
08
20
09
20
10
20
11
20
12
20
13
20
14
20
15E
Capex/Sales (%)Sales & Capex (US$ mn)
Sales Capex Capex/Sales
0%
4%
8%
12%
16%
20%
24%
28%
32%
36%
40%
$0
$100
$200
$300
$400
$500
$600
$700
$800
$900
$1,000
1Q
01
3Q
01
1Q
02
3Q
02
1Q
03
3Q
03
1Q
04
3Q
04
1Q
05
3Q
05
1Q
06
3Q
06
1Q
07
3Q
07
1Q
08
3Q
08
1Q
09
3Q
09
1Q
10
3Q
10
1Q
11
3Q
11
1Q
12
3Q
12
1Q
13
3Q
13
1Q
14
3Q
14
1Q
15
3Q
15E
Capex/SalesUS$ mn Capex
Amkor SPIL SiP Stats Capex/Sales
Source: Company data, Credit Suisse estimates Source: Company data, Credit Suisse estimates
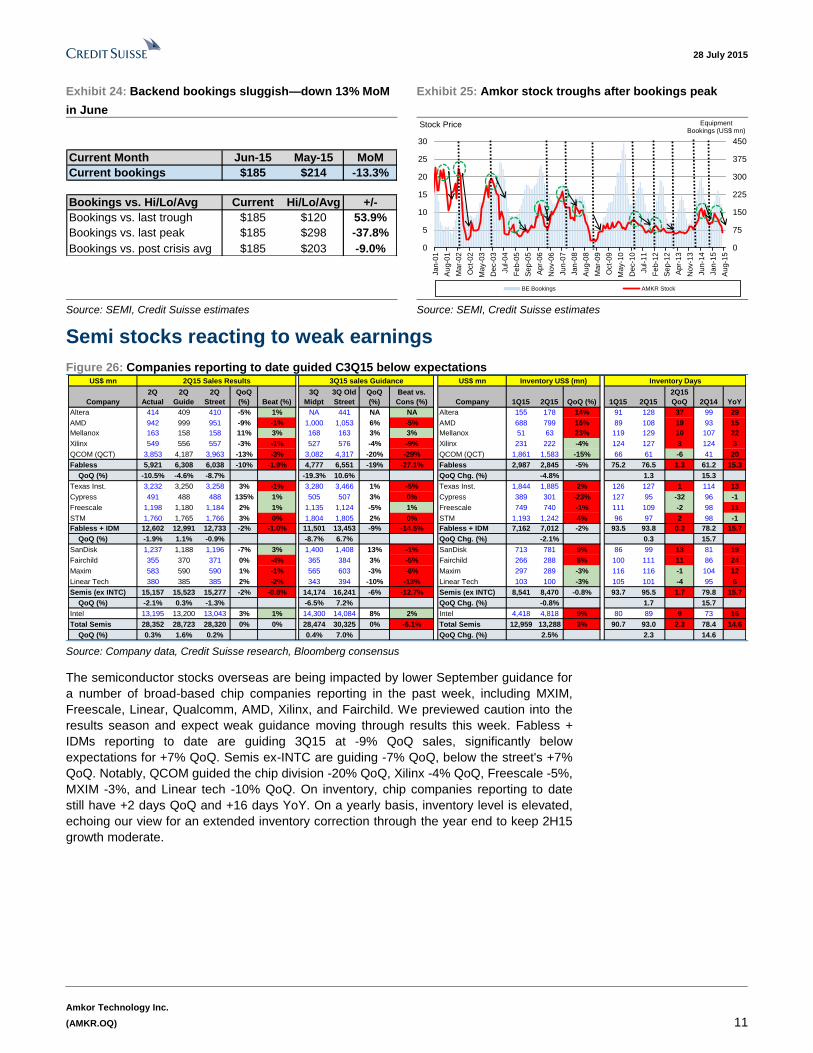
2Q15 backend bookings weaken more than expected
Consistent with the lower capex, industry group SEMI reported that June backend
equipment bookings were down 13% MoM to only US$185 mn, below last year which
continued growing through June to US$298 mn, a peak that is 19% above this year's level.
2Q15 bookings only grew 12% QoQ to US$640 mn, off a low base, down 23% YoY and at
the low end of the seasonal for US$600 mn-1.1 bn from 2010 to 2014. Bookings peaked
much lower this year as slowing backend capex is a prelude to companies projecting a
muted outlook for results this week. The last weak year was 2013, with inventory dollar
only at US$583 mn but had a strong snapback of +69% QoQ. Book-to-bill also weakened,
with back-end falling from 1.03 to 0.86.
28 July 2015
Amkor Technology Inc.
(AMKR.OQ) 11
Exhibit 24: Backend bookings sluggish—down 13% MoM
in June
Exhibit 25: Amkor stock troughs after bookings peak
Current Month Jun-15 May-15 MoM
Current bookings $185 $214 -13.3%
Bookings vs. Hi/Lo/Avg Current Hi/Lo/Avg +/-
Bookings vs. last trough $185 $120 53.9%
Bookings vs. last peak $185 $298 -37.8%
Bookings vs. post crisis avg $185 $203 -9.0%
0
75
150
225
300
375
450
0
5
10
15
20
25
30
Jan
-01
Au
g-0
1
Ma
r-0
2
Oct-
02
Ma
y-0
3
De
c-0
3
Jul-
04
Fe
b-0
5
Se
p-0
5
Ap
r-06
No
v-0
6
Jun
-07
Jan
-08
Au
g-0
8
Ma
r-0
9
Oct-
09
Ma
y-1
0
De
c-1
0
Jul-
11
Fe
b-1
2
Se
p-1
2
Ap
r-13
No
v-1
3
Jun
-14
Jan
-15
Au
g-1
5
Equipment Bookings (US$ mn)
Stock Price
BE Bookings AMKR Stock
Source: SEMI, Credit Suisse estimates Source: SEMI, Credit Suisse estimates
Semi stocks reacting to weak earnings
Figure 26: Companies reporting to date guided C3Q15 below expectations US$ mn 2Q15 Sales Results 3Q15 sales Guidance US$ mn Inventory US$ (mn) Inventory Days COGS
Company
2Q
Actual
2Q
Guide
2Q
Street
QoQ
(%) Beat (%)
3Q
Midpt
3Q Old
Street
QoQ
(%)
Beat vs.
Cons (%) Company 1Q15 2Q15 QoQ (%) 1Q15 2Q15
2Q15
QoQ 2Q14 YoY
Altera 414 409 410 -5% 1% NA 441 NA NA Altera 155 178 14% 91 128 37 99 29
AMD 942 999 951 -9% -1% 1,000 1,053 6% -5% AMD 688 799 16% 89 108 19 93 15
Mellanox 163 158 158 11% 3% 168 163 3% 3% Mellanox 51 63 23% 119 129 10 107 22
Xilinx 549 556 557 -3% -1% 527 576 -4% -9% Xilinx 231 222 -4% 124 127 3 124 3
QCOM (QCT) 3,853 4,187 3,963 -13% -3% 3,082 4,317 -20% -29% QCOM (QCT) 1,861 1,583 -15% 66 61 -6 41 20
Fabless 5,921 6,308 6,038 -10% -1.9% 4,777 6,551 -19% -27.1% Fabless 2,987 2,845 -5% 75.2 76.5 1.3 61.2 15.3
QoQ (%) -10.5% -4.6% -8.7% -19.3% 10.6% QoQ Chg. (%) -4.8% 1.3 15.3
Texas Inst. 3,232 3,250 3,258 3% -1% 3,280 3,466 1% -5% Texas Inst. 1,844 1,885 2% 126 127 1 114 13
Cypress 491 488 488 135% 1% 505 507 3% 0% Cypress 389 301 -23% 127 95 -32 96 -1
Freescale 1,198 1,180 1,184 2% 1% 1,135 1,124 -5% 1% Freescale 749 740 -1% 111 109 -2 98 11
STM 1,760 1,765 1,766 3% 0% 1,804 1,805 2% 0% STM 1,193 1,242 4% 96 97 2 98 -1
Fabless + IDM 12,602 12,991 12,733 -2% -1.0% 11,501 13,453 -9% -14.5% Fabless + IDM 7,162 7,012 -2% 93.5 93.8 0.3 78.2 15.7
QoQ (%) -1.9% 1.1% -0.9% -8.7% 6.7% QoQ Chg. (%) -2.1% 0.3 15.7
SanDisk 1,237 1,188 1,196 -7% 3% 1,400 1,408 13% -1% SanDisk 713 781 9% 86 99 13 81 19
Fairchild 355 370 371 0% -4% 365 384 3% -5% Fairchild 266 288 8% 100 111 11 86 24
Maxim 583 590 590 1% -1% 565 603 -3% -6% Maxim 297 289 -3% 116 116 -1 104 12
Linear Tech 380 385 385 2% -2% 343 394 -10% -13% Linear Tech 103 100 -3% 105 101 -4 95 6
Semis (ex INTC) 15,157 15,523 15,277 -2% -0.8% 14,174 16,241 -6% -12.7% Semis (ex INTC) 8,541 8,470 -0.8% 93.7 95.5 1.7 79.8 15.7
QoQ (%) -2.1% 0.3% -1.3% -6.5% 7.2% QoQ Chg. (%) -0.8% 1.7 15.7
Intel 13,195 13,200 13,043 3% 1% 14,300 14,084 8% 2% Intel 4,418 4,818 9% 80 89 9 73 16
Total Semis 28,352 28,723 28,320 0% 0% 28,474 30,325 0% -6.1% Total Semis 12,959 13,288 3% 90.7 93.0 2.3 78.4 14.6
QoQ (%) 0.3% 1.6% 0.2% 0.4% 7.0% QoQ Chg. (%) 2.5% 2.3 14.6 Source: Company data, Credit Suisse research, Bloomberg consensus
The semiconductor stocks overseas are being impacted by lower September guidance for
a number of broad-based chip companies reporting in the past week, including MXIM,
Freescale, Linear, Qualcomm, AMD, Xilinx, and Fairchild. We previewed caution into the
results season and expect weak guidance moving through results this week. Fabless +
IDMs reporting to date are guiding 3Q15 at -9% QoQ sales, significantly below
expectations for +7% QoQ. Semis ex-INTC are guiding -7% QoQ, below the street's +7%
QoQ. Notably, QCOM guided the chip division -20% QoQ, Xilinx -4% QoQ, Freescale -5%,
MXIM -3%, and Linear tech -10% QoQ. On inventory, chip companies reporting to date
still have +2 days QoQ and +16 days YoY. On a yearly basis, inventory level is elevated,
echoing our view for an extended inventory correction through the year end to keep 2H15
growth moderate.

28 July 2015
Amkor Technology Inc.
(AMKR.OQ) 12
Balance sheet leveraged—although debt refinancing
lessens the interest burden
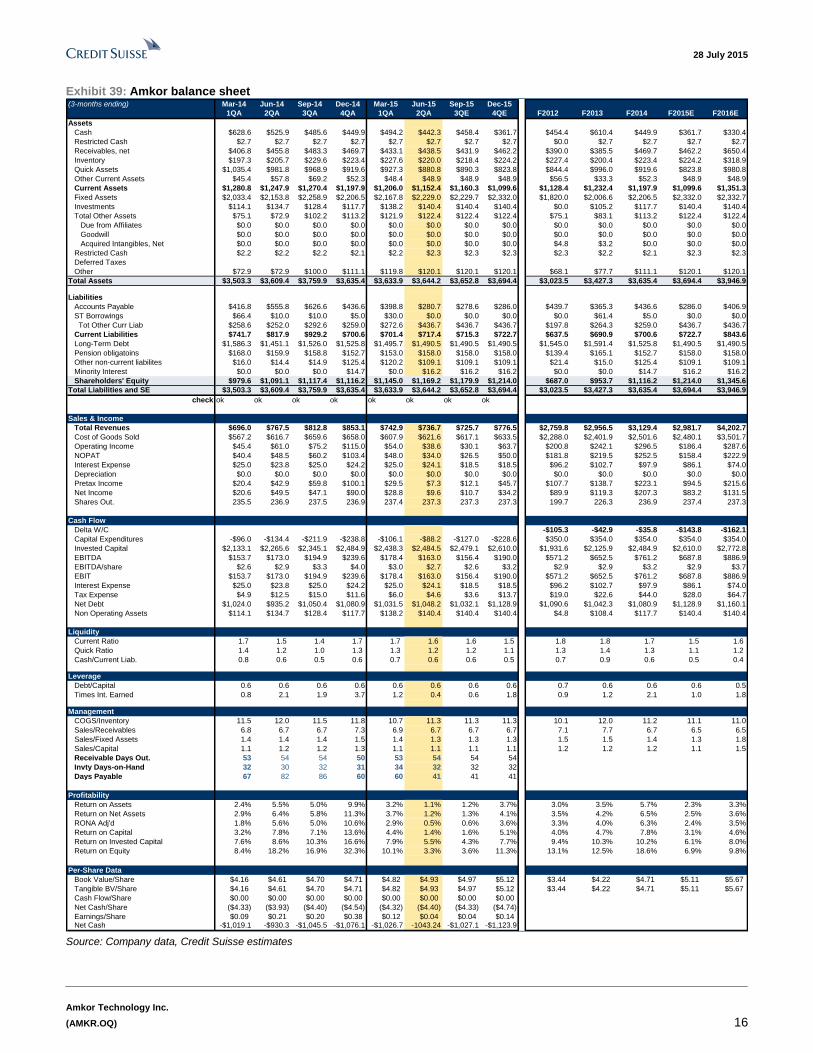
Exhibit 27: Amkor balance sheet relatively unchanged in June US$ mn, unless otherwise stated
Balance Sheet Mar-15 Jun-15 Q/Q %
Summary Actual Actual Change
Cash & Equivalents $494.2 $442.3 -10.5%
Total Debt $1,525.7 $1,490.5 -2.3%
Net Cash -$1,031.5 -$1,048.2 1.6%
Net Cash/Share -$4.32 -$4.40 1.7%
A/R $433.1 $438.5 1.2%
DSO 53 54 2.1%
Inventory $227.6 $220.0 -3.3%
Inventory Days 34 32 -5.5%
SH Equity (BV) $1,145.0 $1,169.2 2.1%
Book Value / Share $4.82 $4.93 2.2%
TBV / Share $4.82 $4.93 2.2% Source: Company data, Credit Suisse estimates
Amkor's balance sheet was slightly improved but still leveraged in 2Q15, with net debt
increasing from US$1,032 mn to US$1,048 mn and from -US$4.3 per share to -US$4.4
per share. Working capital increased for both receivables and inventory and had stable
book value at around US$4.93/share. The stock after hours was to 0.8x P/B, a discount to
its Taiwan peers at 1.3x P/B although ROE is also lower at 7% vs 13% for the Taiwan
back-end. The company still carries US$1.5 bn of debt on its balance sheet but is working
to reduce its interest burden by extinguishing the high-rate debt in 2Q15 at a discount to
par value—the company expects to save US$17 mn in annual interest expense and have
a US$18-19 mn quarterly run rate post the redemption.
Exhibit 28: Inventory days down QoQ in 2Q15 Exhibit 29: Receivable days up in 2Q15
20
22
24
26
28
30
32
34
36
38
40
$0
$50
$100
$150
$200
$250
Mar-
09
Jun
-09
Se
p-0
9
Dec-0
9
Mar-
10
Jun
-10
Se
p-1
0
Dec-1
0
Mar-
11
Jun
-11
Se
p-1
1
Dec-1
1
Mar-
12
Jun
-12
Se
p-1
2
Dec-1
2
Mar-
13
Jun
-13
Se
p-1
3
Dec-1
3
Mar-
14
Jun
-14
Se
p-1
4
Dec-1
4
Mar-
15
Jun
-15
Invento
ry D
ays
Invento
ry (
in $
mn)
Inventory Inventory Days
30
35
40
45
50
55
60
$0
$100
$200
$300
$400
$500
$600
Mar-
09
Jun
-09
Se
p-0
9
Dec-0
9
Mar-
10
Jun
-10
Se
p-1
0
Dec-1
0
Mar-
11
Jun
-11
Se
p-1
1
Dec-1
1
Mar-
12
Jun
-12
Se
p-1
2
Dec-1
2
Mar-
13
Jun
-13
Se
p-1
3
Dec-1
3
Mar-
14
Jun
-14
Se
p-1
4
Dec-1
4
Mar-
15
Jun
-15
Days
Sale
s O
uts
tandin
g
Receiv
able
( in $
mn)
Receivables Days Sales Outstanding
Source: Company data, Credit Suisse estimates Source: Company data, Credit Suisse estimates
Cutting estimates to reflect the weaker outlook
The Asian semi suppliers are seeing more muted growth in 2H15 due to the higher fabless
inventory and slowdown in smartphones and consumer tech (PCs/tablets/TVs), with each
end-market slightly below expectations YTD. On the softer 2H15 outlook, we trim
2015/16E EPS from US$0.62/0.70 to US$0.35/0.55.
Amkor's balance sheet
remains leveraged
Reducing 2016E sales to
-4.7% YoY from flat YoY

28 July 2015
Amkor Technology Inc.
(AMKR.OQ) 13
Exhibit 30: Revising down 2015 and 2016 estimates
AMKR
Actual CS CS Old Cons CS CS Old Cons
Total Revenue $3,129.4 $2,981.7 $3,118.7 $4,042.0 $4,202.7 $4,439.4 $4,006.5
% Q/Q chng
% Y/Y chng 5.9% -4.7% -0.3% 29.8% 40.9% 42.3% -0.9%
Total GM* 20.1% 16.8% 19.0% 19.5% 16.7% 17.5% 21.3%
R&D Expense* $76.9 $79.4 $73.0 $106.2 $97.2
SG&A Expense* $254.5 $235.9 $254.9 $307.3 $334.6
Operating Exp.* $331.4 $315.2 $327.9 $413.5 $431.8
Operating Mgin* 9.5% 6.3% 8.5% 8.8% 6.8% 7.8% 10.2%
Net Income* $207.3 $83.2 $147.0 $189.0 $131.5 $167.0 $225.3
Net Margin* 6.6% 2.8% 4.7% 4.7% 3.1% 3.8% 5.6%
EPS* $0.87 $0.35 $0.62 $0.74 $0.55 $0.70 $0.98
Fully diluted shares 236.9 237.4 237.4 237.3 237.4
F2016EF2014 F2015E
Source: Company data, Credit Suisse estimates, Bloomberg consensus
Valuation approaching support levels
After the recent correction on the weak consumer tech outlook and another 9% pullback
after hours, Amkor's valuation is reasonable with the stock trading at the low end of its
long-term range. Amkor is now trading at 3.3x/2.6x 2015/16E EV/EBITDA, vs the post-
crisis range of 2.5x-5.0x and EV/sales of 0.8x/0.6x for 2015/16 versus its post-crisis range
of 0.5x-1.2x. Amkor is also at a discount to peers averaging 4.1x EV/EBITDA and 1.2x
EV/sales.
Exhibit 31: AMKR EV/EBITDA now at lower levels Exhibit 32: AMKR EV/Sales at lower levels
2.0
2.5
3.0
3.5
4.0
4.5
5.0
5.5
6.0
6.5
7.0
7.5
Sep
-05
Feb
-06
Ju
l-0
6
De
c-0
6
Ma
y-0
7
Oct-
07
Ma
r-08
Au
g-0
8
Ja
n-0
9
Ju
n-0
9
No
v-0
9
Ap
r-1
0
Sep
-10
Feb
-11
Ju
l-1
1
De
c-1
1
Ma
y-1
2
Oct-
12
Ma
r-13
Au
g-1
3
Ja
n-1
4
Ju
n-1
4
No
v-1
4
Ap
r-1
5
Sep
-15
EV/EBITDA
EV/EBITDA
0.0
0.3
0.5
0.8
1.0
1.3
1.5
1.8
2.0
Ma
r-04
Sep
-04
Ma
r-05
Sep
-05
Ma
r-06
Sep
-06
Ma
r-07
Sep
-07
Ma
r-08
Sep
-08
Ma
r-09
Sep
-09
Ma
r-10
Sep
-10
Ma
r-11
Sep
-11
Ma
r-12
Sep
-12
Ma
r-13
Sep
-13
Ma
r-14
Sep
-14
Ma
r-15
Sep
-15
EV/Sales
EV/Sales multiple
Source: Company data, Credit Suisse estimates Source: Company data, Credit Suisse estimates
Amkor is also at a discount on P/B, trading at 0.8x/0.7x 2015/16E P/B, the bottom of its
post-crisis range and below the group average of 1.3x P/B. While Amkor's ROE used to be
at par with its competitors, it is now at 7%, below the average of 13%—although Amkor is
the first to report 2Q15 results and guide for 2H15, and we anticipate some weakness
across other backend companies as well taking down the group average ROE.
Exhibit 33: Amkor valuation reasonable vs peers Price Mkt Cap EV/Sales (x) EV/EBITDA (x) P/E Multiple (x) P/B Multiple (x) ROE Trough/Peak (EV/Sales)
Company Ticker 7/28/2015 (US$mn) 2014 2015 2016 2014 2015 2016 2014 2015 2016 2014 2015 2016 2014 2015 2016
Select backend peers
Amkor AMKR $4.25 $1,168 0.7 0.8 0.6 3.0 3.3 2.6 4.9 12.1 7.7 0.9 0.8 0.7 18.6 6.9 9.8
ASE 2311.TW $35.75 $8,857 1.2 1.1 1.0 5.6 5.4 5.1 12.1 12.9 11.3 1.9 1.9 1.8 15.7 14.5 15.6
SPIL 2325.TW $37.25 $3,676 1.4 1.4 1.2 4.4 4.0 3.7 10.0 9.5 8.6 1.6 1.5 1.5 16.3 16.1 17.2
Chipbond 6147.TWO $42.20 $867 1.8 1.8 1.5 5.4 5.5 4.5 10.7 11.8 8.0 1.2 1.2 1.1 11.0 9.8 13.4
ChipMOS 8150.TW $32.20 $934 1.0 1.1 0.9 3.5 3.3 2.9 8.3 10.2 8.9 1.5 1.5 1.4 18.2 14.4 15.4
Powertech 6239.TW $52.90 $1,280 1.0 0.9 0.8 3.1 2.8 2.6 12.5 10.6 9.8 1.3 1.2 1.1 10.3 11.3 11.6
Median 1.1 1.1 0.9 3.9 3.7 3.3 10.3 11.2 8.7 1.4 1.3 1.3 16.0 12.8 14.4
Mean 1.2 1.2 1.0 4.1 4.1 3.6 9.7 11.2 9.0 1.4 1.3 1.3 15.0 12.2 13.8 Source: Company data, Credit Suisse estimates

28 July 2015
Amkor Technology Inc.
(AMKR.OQ) 14
Exhibit 34: Amkor P/B now at a trough at only 0.8x Exhibit 35: Amkor P/B down slated for a rebound
0.8x
1.2x
2.0x
2.4x
0
5
10
15
Ap
r/09
Oct/0
9
Ap
r/10
Oct/1
0
Ap
r/11
Oct/1
1
Ap
r/12
Oct/1
2
Ap
r/13
Oct/1
3
Ap
r/14
Oct/1
4
Ap
r/15
US$ AMKR historical PB band
0%
7%
14%
21%
28%
35%
0
4
8
12
16
20
Jan
/11
Ap
r/11
Ju
l/11
Oct/1
1
Jan
/12
Ap
r/12
Ju
l/12
Oct/1
2
Jan
/13
Ap
r/13
Ju
l/13
Oct/1
3
Jan
/14
Ap
r/14
Ju
l/14
Oct/1
4
Jan
/15
Ap
r/15
Ju
l/15
Oct/1
5
Jan
/16
Ap
r/16
Ju
l/16
Oct/1
6US$ AMKR historical PB-ROE chart
Source: Company data, Credit Suisse estimates Source: Company data, Credit Suisse estimates
Amkor is still trading at a discount to its peers due to a more leveraged balance sheet and
lower operating margins. The company's current balance sheet has high debt/equity at
127% vs SPIL's only 39% and ASE 63%.
Exhibit 36: 2Q15 back-end balance sheet comparison Exhibit 37: Back-end valuation comparison Compares
(NT$mn/US$mn)ASE SPIL Amkor Stats
Cash and investments 57,399 37,790 442 195
Total debt 93,656 29,061 1,491 1,169
Net cash -36,257 8,729 -1,048 -974
Net cash/share (NT$) -4.61 2.82 -4.42 -0.44
Accounts receivable 43,009 17,367 281 221
Days sales outstanding 61 76 35 56
Inventory 47,605 4,509 220 75
Inventory days 83 27 35 20
Accounts payable days 55 43 41 99
Cash conversion days 88 60 29 -22
Debt / Equity 63% 39% 127% 124%
Shareholders' equity 148,329 75,035 1,169 945
Compares ASE SPIL Amkor Stats
2015E BVPS 19.0 24.2 5.1 0.4
P/B Ratio 1.9 1.5 1.0 0.8
2015E EPS 2.77 3.90 0.35 -0.01
P/E Ratio 12.9 9.5 14.0 n.m.
2015E EBITDA 1,751 956 688 353
EV/EBITDA 5.8 3.5 3.2 4.1
2015E Sales 5,325 2,860 2,760 1,487
EV/Sales 1.9 1.2 0.8 1.0
Enterprise Value 10,072 3,383 2,216 1,461
Market cap 8,857 3,676 1,168 740
Sharecount 7,868 3,098 237 2,202
Stock price: $35.75 $37.25 $4.92 $0.46
US$ conversion: $29.83 $29.83 $1.00 $1.35
Source: Company data, Credit Suisse estimates Source: Company data, Credit Suisse estimates

28 July 2015
Amkor Technology Inc.
(AMKR.OQ) 15
Exhibit 38: Amkor income statement summary (3-months ending) Mar-14 Jun-14 Sep-14 Dec-14 Mar-15 Jun-15 Sep-15 Dec-15
1QA 2QA 3QA 4QA 1QA 2QA 3QE 4QE F2012 F2013 F2014 F2015E F2016E
Total Sales $696,044 $767,459 $812,824 $853,113 $742,875 $736,722 $725,671 $776,468 $2,759,846 $2,956,450 $3,129,440 $2,981,736 $4,202,734
QoQ / YoY change -7.8% 10.3% 5.9% 5.0% -12.9% -0.8% -1.5% 7.0% -0.6% 7.1% 5.9% -4.7% 40.9%
Total COGS $567,224 $616,745 $659,607 $658,042 $607,928 $621,624 $617,062 $633,464 $2,287,975 $2,401,937 $2,501,618 $2,480,078 $3,501,655
Gross Profit $128,820 $150,714 $153,217 $195,071 $134,947 $115,098 $108,609 $143,004 $471,871 $554,513 $627,822 $501,658 $701,079
% GM 18.5% 19.6% 18.8% 22.9% 18.2% 15.6% 15.0% 18.4% 17.1% 18.8% 20.1% 16.8% 16.7%
incr GM 36.3% 30.7% 5.5% 103.9% 54.5% 322.6% 58.7% 67.7%
SG&A $62,424 $67,674 $61,600 $62,800 $62,942 $56,435 $57,959 $58,538 $217,000 $247,779 $254,498 $235,874 $307,256
% Sales 9.0% 8.8% 7.6% 7.4% 8.5% 7.7% 8.0% 7.5% 7.9% 8.4% 8.1% 7.9% 7.3%
R&D $21,045 $22,079 $16,437 $17,303 $18,026 $20,020 $20,561 $20,766 $54,118 $64,625 $76,864 $79,373 $106,222
% Sales 3.0% 2.9% 2.0% 2.0% 2.4% 2.7% 2.8% 2.7% 2.0% 2.2% 2.5% 2.7% 2.5%
Opex $83,469 $89,753 $78,037 $80,103 $80,968 $76,455 $78,519 $79,304 $271,118 $312,404 $331,362 $315,247 $413,479
Amort of GW $0 $0 $0 $0 $0 $0 $0 $0 $0 $0 $0 $0 $0
Op Income $45,351 $60,961 $75,180 $114,968 $53,979 $38,643 $30,089 $63,700 $200,753 $242,109 $296,460 $186,411 $287,600
OpM % 6.5% 7.9% 9.2% 13.5% 7.3% 5.2% 4.1% 8.2% 7.3% 8.2% 9.5% 6.3% 6.8%
Interest Expense -$24,964 -$23,779 -$25,023 -$24,159 -$25,019 -$24,087 -$18,500 -$18,500 -$96,198 -$102,745 -$97,925 -$86,106 -$74,000
FX gain/loss $0 $0 $0 $0 $0 $0 $0 $0 -$2,670 $1,841 $0 $0 $0
Other Income -$36 $5,699 $9,626 $9,254 $498 -$7,290 $500 $500 $5,800 $9,080 $24,543 -$5,792 $2,000
Interest, Net -$25,000 -$18,080 -$15,397 -$14,905 -$24,521 -$31,377 -$18,000 -$18,000 -$93,068 -$91,824 -$73,382 -$91,898 -$72,000
One-Time Charge $0 $0 $0 $0 $0 $0 $0 $0 $0 -$11,619 $0 $0 $0
Pretax Income $20,351 $42,881 $59,783 $100,063 $29,458 $7,266 $12,089 $45,700 $107,685 $138,666 $223,078 $94,513 $215,600
% Sales 2.9% 5.6% 7.4% 11.7% 4.0% 1.0% 1.7% 5.9% 3.9% 4.7% 7.1% 3.2% 5.1%
Tax $4,929 $12,511 $14,985 $11,555 $5,999 $4,631 $3,627 $13,710 $19,001 $22,646 $43,980 $27,967 $64,680
% Tax Rate 24.2% 29.2% 25.1% 11.5% 20.4% 63.7% 30.0% 30.0% 17.6% 16.3% 19.7% 29.6% 30.0%
Equity in J-Devices JV $5,761 $20,036 $3,372 $2,485 $6,238 $7,566 $3,000 $3,000 $0 $5,637 $31,654 $19,804 $0
Minority Interest -$550 -$885 -$1,073 -$993 -$916 -$623 -$800 -$800 $1,169 -$2,361 -$3,501 -$3,139 -$19,370
Net Income $20,633 $49,521 $47,097 $90,000 $28,781 $9,578 $10,663 $34,190 $89,853 $119,296 $207,251 $83,212 $131,550
% Sales 3.0% 6.5% 5.8% 10.5% 3.9% 1.3% 1.5% 4.4% 3.3% 4.0% 6.6% 2.8% 3.1%
EPS $0.09 $0.21 $0.20 $0.38 $0.12 $0.04 $0.04 $0.14 $0.45 $0.53 $0.87 $0.35 $0.55
EPS (excl. option exp) $0.09 $0.21 $0.20 $0.38 $0.13 $0.05 $0.05 $0.15 $0.47 $0.55 $0.89 $0.37 $0.57
Primary Shares $0.09 $0.21 $0.20 $0.38 $0.12 $0.04 $0.04 $0.14 $0.42 $0.51 $0.87 $0.35 $0.55
EPS fully taxed (25%) -$0.08 -$0.06 -$0.05 -$0.05 -$0.08 -$0.10 -$0.06 -$0.06 -$0.22 -$0.35 -$0.25 -$0.30 -$0.31
Primary Shares 216,757 232,891 236,337 236,578 236,708 236,840 236,840 236,840 191,151 195,364 230,641 236,807 236,840
Fully Diluted Shares 235,497 236,872 237,509 236,937 237,424 237,321 237,321 237,321 199,706 226,260 236,907 237,357 237,321
EBIT $45,351 $60,961 $75,180 $114,968 $53,979 $38,643 $30,089 $63,700 $200,753 $242,109 $296,460 $186,411 $287,600
EBIT Margin % 3.0% 2.9% 2.0% 2.0% 2.4% 2.7% 2.8% 2.7% 7.3% 8.2% 9.5% 6.3% 6.8%
EBITDA $153,689 $173,012 $194,880 $239,585 $178,366 $162,972 $156,418 $190,029 $571,232 $652,455 $761,166 $687,785 $886,916
EBITDA Margin % 22.1% 22.5% 24.0% 28.1% 24.0% 22.1% 21.6% 24.5% 20.7% 22.1% 24.3% 23.1% 21.1%
Capex -$95,999 -$134,393 -$211,916 -$238,812 -$106,149 -$88,211 -$126,992 -$228,648 -$533,425 -$566,256 -$681,120 -$550,000 -$600,000
Depreciation $108,338 $112,051 $119,700 $124,617 $124,387 $124,329 $126,329 $126,329 $370,479 $410,346 $464,706 $501,374 $599,316
FCF (OCF-Capex) $36,407 -$14,491 -$72,549 -$29,936 $59,839 -$27,717 $16,131 -$96,762 -$130,971 -$82,958 -$80,569 -$48,508 -$193,441
FCF/Share $0.15 -$0.06 -$0.31 -$0.13 $0.25 -$0.12 $0.07 -$0.41 -$0.66 -$0.37 -$0.34 -$0.20 -$0.82 Source: Company data, Credit Suisse estimates
28 July 2015
Amkor Technology Inc.
(AMKR.OQ) 16
Exhibit 39: Amkor balance sheet (3-months ending) Mar-14 Jun-14 Sep-14 Dec-14 Mar-15 Jun-15 Sep-15 Dec-15
1QA 2QA 3QA 4QA 1QA 2QA 3QE 4QE F2012 F2013 F2014 F2015E F2016E
Assets
Cash $628.6 $525.9 $485.6 $449.9 $494.2 $442.3 $458.4 $361.7 $454.4 $610.4 $449.9 $361.7 $330.4
Restricted Cash $2.7 $2.7 $2.7 $2.7 $2.7 $2.7 $2.7 $2.7 $0.0 $2.7 $2.7 $2.7 $2.7
Receivables, net $406.8 $455.8 $483.3 $469.7 $433.1 $438.5 $431.9 $462.2 $390.0 $385.5 $469.7 $462.2 $650.4
Inventory $197.3 $205.7 $229.6 $223.4 $227.6 $220.0 $218.4 $224.2 $227.4 $200.4 $223.4 $224.2 $318.9
Quick Assets $1,035.4 $981.8 $968.9 $919.6 $927.3 $880.8 $890.3 $823.8 $844.4 $996.0 $919.6 $823.8 $980.8
Other Current Assets $45.4 $57.8 $69.2 $52.3 $48.4 $48.9 $48.9 $48.9 $56.5 $33.3 $52.3 $48.9 $48.9
Current Assets $1,280.8 $1,247.9 $1,270.4 $1,197.9 $1,206.0 $1,152.4 $1,160.3 $1,099.6 $1,128.4 $1,232.4 $1,197.9 $1,099.6 $1,351.3
Fixed Assets $2,033.4 $2,153.8 $2,258.9 $2,206.5 $2,167.8 $2,229.0 $2,229.7 $2,332.0 $1,820.0 $2,006.6 $2,206.5 $2,332.0 $2,332.7
Investments $114.1 $134.7 $128.4 $117.7 $138.2 $140.4 $140.4 $140.4 $0.0 $105.2 $117.7 $140.4 $140.4
Total Other Assets $75.1 $72.9 $102.2 $113.2 $121.9 $122.4 $122.4 $122.4 $75.1 $83.1 $113.2 $122.4 $122.4
Due from Affiliates $0.0 $0.0 $0.0 $0.0 $0.0 $0.0 $0.0 $0.0 $0.0 $0.0 $0.0 $0.0 $0.0
Goodwill $0.0 $0.0 $0.0 $0.0 $0.0 $0.0 $0.0 $0.0 $0.0 $0.0 $0.0 $0.0 $0.0
Acquired Intangibles, Net $0.0 $0.0 $0.0 $0.0 $0.0 $0.0 $0.0 $0.0 $4.8 $3.2 $0.0 $0.0 $0.0
Restricted Cash $2.2 $2.2 $2.2 $2.1 $2.2 $2.3 $2.3 $2.3 $2.3 $2.2 $2.1 $2.3 $2.3
Deferred Taxes
Other $72.9 $72.9 $100.0 $111.1 $119.8 $120.1 $120.1 $120.1 $68.1 $77.7 $111.1 $120.1 $120.1
Total Assets $3,503.3 $3,609.4 $3,759.9 $3,635.4 $3,633.9 $3,644.2 $3,652.8 $3,694.4 $3,023.5 $3,427.3 $3,635.4 $3,694.4 $3,946.9
Liabilities
Accounts Payable $416.8 $555.8 $626.6 $436.6 $398.8 $280.7 $278.6 $286.0 $439.7 $365.3 $436.6 $286.0 $406.9
ST Borrowings $66.4 $10.0 $10.0 $5.0 $30.0 $0.0 $0.0 $0.0 $0.0 $61.4 $5.0 $0.0 $0.0
Tot Other Curr Liab $258.6 $252.0 $292.6 $259.0 $272.6 $436.7 $436.7 $436.7 $197.8 $264.3 $259.0 $436.7 $436.7
Current Liabilities $741.7 $817.9 $929.2 $700.6 $701.4 $717.4 $715.3 $722.7 $637.5 $690.9 $700.6 $722.7 $843.6
Long-Term Debt $1,586.3 $1,451.1 $1,526.0 $1,525.8 $1,495.7 $1,490.5 $1,490.5 $1,490.5 $1,545.0 $1,591.4 $1,525.8 $1,490.5 $1,490.5
Pension obligatoins $168.0 $159.9 $158.8 $152.7 $153.0 $158.0 $158.0 $158.0 $139.4 $165.1 $152.7 $158.0 $158.0
Other non-current liabilites $16.0 $14.4 $14.9 $125.4 $120.2 $109.1 $109.1 $109.1 $21.4 $15.0 $125.4 $109.1 $109.1
Minority Interest $0.0 $0.0 $0.0 $14.7 $0.0 $16.2 $16.2 $16.2 $0.0 $0.0 $14.7 $16.2 $16.2
Shareholders' Equity $979.6 $1,091.1 $1,117.4 $1,116.2 $1,145.0 $1,169.2 $1,179.9 $1,214.0 $687.0 $953.7 $1,116.2 $1,214.0 $1,345.6
Total Liabilities and SE $3,503.3 $3,609.4 $3,759.9 $3,635.4 $3,633.9 $3,644.2 $3,652.8 $3,694.4 $3,023.5 $3,427.3 $3,635.4 $3,694.4 $3,946.9
check ok ok ok ok ok ok ok ok
Sales & Income
Total Revenues $696.0 $767.5 $812.8 $853.1 $742.9 $736.7 $725.7 $776.5 $2,759.8 $2,956.5 $3,129.4 $2,981.7 $4,202.7
Cost of Goods Sold $567.2 $616.7 $659.6 $658.0 $607.9 $621.6 $617.1 $633.5 $2,288.0 $2,401.9 $2,501.6 $2,480.1 $3,501.7
Operating Income $45.4 $61.0 $75.2 $115.0 $54.0 $38.6 $30.1 $63.7 $200.8 $242.1 $296.5 $186.4 $287.6
NOPAT $40.4 $48.5 $60.2 $103.4 $48.0 $34.0 $26.5 $50.0 $181.8 $219.5 $252.5 $158.4 $222.9
Interest Expense $25.0 $23.8 $25.0 $24.2 $25.0 $24.1 $18.5 $18.5 $96.2 $102.7 $97.9 $86.1 $74.0
Depreciation $0.0 $0.0 $0.0 $0.0 $0.0 $0.0 $0.0 $0.0 $0.0 $0.0 $0.0 $0.0 $0.0
Pretax Income $20.4 $42.9 $59.8 $100.1 $29.5 $7.3 $12.1 $45.7 $107.7 $138.7 $223.1 $94.5 $215.6
Net Income $20.6 $49.5 $47.1 $90.0 $28.8 $9.6 $10.7 $34.2 $89.9 $119.3 $207.3 $83.2 $131.5
Shares Out. 235.5 236.9 237.5 236.9 237.4 237.3 237.3 237.3 199.7 226.3 236.9 237.4 237.3
Cash Flow
Delta W/C -$105.3 -$42.9 -$35.8 -$143.8 -$162.1
Capital Expenditures -$96.0 -$134.4 -$211.9 -$238.8 -$106.1 -$88.2 -$127.0 -$228.6 $350.0 $354.0 $354.0 $354.0 $354.0
Invested Capital $2,133.1 $2,265.6 $2,345.1 $2,484.9 $2,438.3 $2,484.5 $2,479.1 $2,610.0 $1,931.6 $2,125.9 $2,484.9 $2,610.0 $2,772.8
EBITDA $153.7 $173.0 $194.9 $239.6 $178.4 $163.0 $156.4 $190.0 $571.2 $652.5 $761.2 $687.8 $886.9
EBITDA/share $2.6 $2.9 $3.3 $4.0 $3.0 $2.7 $2.6 $3.2 $2.9 $2.9 $3.2 $2.9 $3.7
EBIT $153.7 $173.0 $194.9 $239.6 $178.4 $163.0 $156.4 $190.0 $571.2 $652.5 $761.2 $687.8 $886.9
Interest Expense $25.0 $23.8 $25.0 $24.2 $25.0 $24.1 $18.5 $18.5 $96.2 $102.7 $97.9 $86.1 $74.0
Tax Expense $4.9 $12.5 $15.0 $11.6 $6.0 $4.6 $3.6 $13.7 $19.0 $22.6 $44.0 $28.0 $64.7
Net Debt $1,024.0 $935.2 $1,050.4 $1,080.9 $1,031.5 $1,048.2 $1,032.1 $1,128.9 $1,090.6 $1,042.3 $1,080.9 $1,128.9 $1,160.1
Non Operating Assets $114.1 $134.7 $128.4 $117.7 $138.2 $140.4 $140.4 $140.4 $4.8 $108.4 $117.7 $140.4 $140.4
Liquidity
Current Ratio 1.7 1.5 1.4 1.7 1.7 1.6 1.6 1.5 1.8 1.8 1.7 1.5 1.6
Quick Ratio 1.4 1.2 1.0 1.3 1.3 1.2 1.2 1.1 1.3 1.4 1.3 1.1 1.2
Cash/Current Liab. 0.8 0.6 0.5 0.6 0.7 0.6 0.6 0.5 0.7 0.9 0.6 0.5 0.4
Leverage
Debt/Capital 0.6 0.6 0.6 0.6 0.6 0.6 0.6 0.6 0.7 0.6 0.6 0.6 0.5
Times Int. Earned 0.8 2.1 1.9 3.7 1.2 0.4 0.6 1.8 0.9 1.2 2.1 1.0 1.8
Management
COGS/Inventory 11.5 12.0 11.5 11.8 10.7 11.3 11.3 11.3 10.1 12.0 11.2 11.1 11.0
Sales/Receivables 6.8 6.7 6.7 7.3 6.9 6.7 6.7 6.7 7.1 7.7 6.7 6.5 6.5
Sales/Fixed Assets 1.4 1.4 1.4 1.5 1.4 1.3 1.3 1.3 1.5 1.5 1.4 1.3 1.8
Sales/Capital 1.1 1.2 1.2 1.3 1.1 1.1 1.1 1.1 1.2 1.2 1.2 1.1 1.5
Receivable Days Out. 53 54 54 50 53 54 54 54
Invty Days-on-Hand 32 30 32 31 34 32 32 32
Days Payable 67 82 86 60 60 41 41 41
Profitability
Return on Assets 2.4% 5.5% 5.0% 9.9% 3.2% 1.1% 1.2% 3.7% 3.0% 3.5% 5.7% 2.3% 3.3%
Return on Net Assets 2.9% 6.4% 5.8% 11.3% 3.7% 1.2% 1.3% 4.1% 3.5% 4.2% 6.5% 2.5% 3.6%
RONA Adj'd 1.8% 5.6% 5.0% 10.6% 2.9% 0.5% 0.6% 3.6% 3.3% 4.0% 6.3% 2.4% 3.5%
Return on Capital 3.2% 7.8% 7.1% 13.6% 4.4% 1.4% 1.6% 5.1% 4.0% 4.7% 7.8% 3.1% 4.6%
Return on Invested Capital 7.6% 8.6% 10.3% 16.6% 7.9% 5.5% 4.3% 7.7% 9.4% 10.3% 10.2% 6.1% 8.0%
Return on Equity 8.4% 18.2% 16.9% 32.3% 10.1% 3.3% 3.6% 11.3% 13.1% 12.5% 18.6% 6.9% 9.8%
Per-Share Data
Book Value/Share $4.16 $4.61 $4.70 $4.71 $4.82 $4.93 $4.97 $5.12 $3.44 $4.22 $4.71 $5.11 $5.67
Tangible BV/Share $4.16 $4.61 $4.70 $4.71 $4.82 $4.93 $4.97 $5.12 $3.44 $4.22 $4.71 $5.11 $5.67
Cash Flow/Share $0.00 $0.00 $0.00 $0.00 $0.00 $0.00 $0.00 $0.00
Net Cash/Share ($4.33) ($3.93) ($4.40) ($4.54) ($4.32) ($4.40) ($4.33) ($4.74)
Earnings/Share $0.09 $0.21 $0.20 $0.38 $0.12 $0.04 $0.04 $0.14Net Cash -$1,019.1 -$930.3 -$1,045.5 -$1,076.1 -$1,026.7 -1043.24 -$1,027.1 -$1,123.9
Source: Company data, Credit Suisse estimates

28 July 2015
Amkor Technology Inc.
(AMKR.OQ) 17
Exhibit 40: Amkor cash flow statement (3-months ending) Mar-14 Jun-14 Sep-14 Dec-14 Mar-15 Jun-15 Sep-15 Dec-15
1QA 2QA 3QA 4QA 1QA 2QA 3QE 4QE F2012 F2013 F2014 F2015E F2016E
Operating
Net Income before Extraordinaries $21.2 $50.4 $48.2 $14.1 $29.7 $10.2 $10.7 $34.2 $62.9 $111.7 $133.9 $84.8 $131.5
Depreciation and Amortization $108.3 $112.1 $119.7 $124.6 $124.4 $124.3 $126.3 $126.3 $370.5 $410.3 $464.7 $501.4 $599.3
Deferred Taxes and Investment Tax Credit $0.0 $0.0 $0.0 $0.0 $0.0
Loss on impairment of investment $0.0
Other Operating Activities -$4.3 -$28.9 -$3.8 $27.8 $0.0 $5.2 -$16.0 -$9.2 $0.0 $0.0
Equity in loss of investees
Minority Interest
Gross Cash Flow - Operating $125.2 $133.6 $164.1 $166.6 $154.1 $134.5 $137.0 $160.5 $439.4 $517.6 $589.4 $586.1 $730.9
Extraordinary Items $0.0 $0.0 $0.0 $0.0 $0.0 $2.5 $0.0 $0.0
Loss(Gain) - Sale Prop, Plant and Equip $0.0 $0.0 $0.0 $0.0 $0.0 $0.0 $0.0 $0.0
Net Chg in Operating Assets and Liabs $6.7 -$30.3 $6.4 $41.7 $10.9 -$25.1 $6.1 -$28.6 -$56.4 $39.9 $24.5 -$36.7 -$162.1
A/R -49.041 -27.492 $13.6 $35.5 -$35.5 $6.6 -$30.2 $0.0 $0.0 -$62.9 -$23.7 -$188.3
Other Rec's
Inventories -8.371 -23.889 $6.2 -$4.2 $4.2 $1.6 -$5.8 $0.0 $0.0 -$26.1 -$4.2 -$94.7
Due from Affiliates
Other Curr Assets -12.404 -11.422 $17.0 $3.9 -$3.9 $0.0 $0.0
Other non-current assets
A/P 139.016 70.801 -$190.0 -$37.8 $37.8 -$2.1 $7.4 $0.0 $0.0 $19.8 $5.3 $120.9
Accrued Expenses -6.51 40.571 -$33.6 $13.6 -$62.3 $0.0 $0.0
Other LT Liabilities
Net Cash Flow - Operating $131.9 $103.3 $170.4 $208.2 $176.0 $52.3 $143.1 $131.9 $383.0 $557.5 $613.9 $503.3 $568.7
Investing
Capital Expenditures ("accrual basis") -$96.0 -$134.4 -$211.9 -$238.8 -$106.1 -$88.2 -$127.0 -$228.6 -$533.5 -$556.3 -$681.1 -$550.0 -$600.0
Capital Expenditures ("cash basis") -$96.0 -$134.4 -$211.9 -$238.8 -$106.1 -$88.2 -$127.0 -$228.6 -$533.4 -$566.3 -$681.1 -$550.0 -$600.0
Sale of Property and Investments $0.7 $16.7 -$15.2 $0.6 $3.3 $0.8 $0.0 $0.0 $2.7 $27.2 $2.8 $4.1 $0.0
Acquisitions and Investments $0.0 $0.0 -$15.8 $0.0 -$12.9 $8.4 $0.0 $0.0 $0.0 -$41.9 -$15.8 -$4.6 $0.0
Other Investing Activities -$0.3 -$0.1 $0.0 $0.0 -$0.3 -$1.0 $0.0 $0.0 $16.8 -$59.6 -$0.4 -$1.3 $0.0
Net Cash Flow - Investing -$95.5 -$117.8 -$243.0 -$238.2 -$116.1 -$80.0 -$127.0 -$228.6 -$513.9 -$640.5 -$694.5 -$551.8 -$600.0
Financing
Cash Dividends $0.0 $0.0 $0.0 $0.0 $0.0 $0.0 $0.0 $0.0 $0.0 $0.0 $0.0 $0.0 $0.0
Borrowings under revolving credit facilities $0.0 $30.0 $150.0
Payment under revolving credit facilities $0.0 -$30.0
Proceeds from issuance of short-term working capital facility$0.0 $0.0
Payments of short-term working capital facility $0.0 $0.0
Change in Current Debt $0.0 $0.0 $0.0 $340.0 $0.0 $0.0 $0.0 $0.0 $0.0 $340.0 $0.0
Change in Long-Term Debt $0.0 -$60.0 $0.0 -$5.9 -$35.0 -$495.0 $0.0 $0.0 $217.4 $283.4 -$65.9 -$530.0 $0.0
Payment of Debt Issuane Costs $0.0 $0.0
Change in Capital Stock $0.0 $0.0 $0.0 $6.3 $0.6 -$0.6 $0.0 $0.0 -$80.8 $0.0 $6.3 $0.0 $0.0
Other Financing Activity -$18.4 $3.5 $0.7 -$6.1 -$0.2 $0.5 $0.0 $0.0 -$0.6 $0.0 -$20.3 $0.2 $0.0
Net Cash Flow - Financing -$18.4 -$56.5 $0.7 -$5.7 -$4.7 -$35.1 $0.0 $0.0 $110.0 $280.1 -$80.0 -$39.8 $0.0
Currency Effect $0.2 -$0.1 $0.1 -$0.1 $0.0 $0.0 $0.0 $0.0 -$0.6 $0.2 $0.1 $0.0 $0.0
Increase (Dec) Cash & ST Investments $18.1 -$71.1 -$71.8 -$35.7 $55.2 -$62.8 $16.1 -$96.8 -$21.5 $197.4 -$160.5 -$88.3 -$31.3
Cash and Cash Equivalents at the beginning of the period$610.4 $628.6 $525.9 $485.6 $449.9 $494.2 $442.3 $458.4 $474.0 $454.4 $610.4 $449.9 $361.7
Cash and Cash Equivalents at the end of the period $628.6 $525.9 $485.6 $449.9 $494.2 $442.3 $458.4 $361.7 $454.4 $610.4 $449.9 $361.7 $330.4
Free Cash Flow $36.4 -$14.5 -$72.5 -$29.9 $59.8 -$27.7 $16.1 -$96.8 -$131.0 -$83.0 -$80.6 -$48.5 -$193.4
FCF/ Share $0.15 -$0.06 -$0.31 -$0.13 $0.25 -$0.12 $0.07 -$0.41 -$0.66 -$0.37 -$0.34 -$0.20 -$0.82
Capex/Rev -14% -18% -26% -28% -14% -12% -18% -29% -19% -19% -22% -18% -19%
Dep / Rev 16% 15% 15% 15% 17% 17% 17% 16%
Revenue $696.0 $767.5 $812.8 $853.1 $742.9 $736.7 $725.7 $776.5 $2,759.8 $2,956.5 $3,129.4 $2,981.7 $3,216.0 Source: Company data, Credit Suisse estimates

28 July 2015
Amkor Technology Inc.
(AMKR.OQ) 18
Companies Mentioned (Price as of 27-Jul-2015)
Advanced Micro Devices, Inc. (AMD.OQ, $1.62) Advanced Semicon. Engr. (2311.TW, NT$35.75) Altera Corp. (ALTR.OQ, $48.92) Amkor Technology Inc. (AMKR.OQ, $4.92, NEUTRAL[V], TP $5.5) Apple Inc (AAPL.OQ, $122.77) Audience, Inc. (ADNC.OQ, $4.89) Broadcom Corp. (BRCM.OQ, $50.79) Cypress Semiconductor Corp. (CY.OQ, $11.57) Fairchild Semiconductor International Inc. (FCS.OQ, $14.565) Freescale Semiconductor Inc. (FSL.N, $36.62) Google, Inc. (GOOGL.OQ, $658.27) Infineon Technologies AG (IFXGn.DE, €10.18) Integrated Dvc (IDTI.OQ, $19.17) Intel Corp. (INTC.OQ, $28.35) Intersil Corp. (ISIL.OQ, $11.4) JCET (600584.SS, Rmb19.53) KYEC (2449.TW, NT$19.75) Linear Technology Corp. (LLTC.OQ, $40.27) Maxim Integrated Products (MXIM.OQ, $33.85) MediaTek Inc. (2454.TW, NT$317.5) Mellanox Technologies Ltd. (MLNX.OQ, $44.51) Microchip Technology Inc. (MCHP.OQ, $41.78) NXP Semiconductors N.V. (NXPI.OQ, $88.22) Novatek Microelectronics Corp Ltd (3034.TW, NT$114.5) ON Semiconductor Corp. (ONNN.OQ, $10.14) QUALCOMM Inc. (QCOM.OQ, $61.98) STATS (STTS.SI, S$0.46) STMicroelectronics NV (STM.PA, €6.958) Samsung Electronics (005930.KS, W1,230,000) SanDisk Corp. (SNDK.OQ, $61.16) Silicon Laboratories Inc. (SLAB.OQ, $50.15) Silicon Mtn Tec (SIMO.OQ, $27.65) Siliconware Precision (2325.TW, NT$37.25) Taiwan Semiconductor Manufacturing (2330.TW, NT$134.0) Tessera Tech (TSRA.OQ, $34.4) Texas Instruments Inc. (TXN.OQ, $49.03) Toshiba (6502.T, ¥386) Xilinx (XLNX.OQ, $40.06)
Disclosure Appendix
Important Global Disclosures
Randy Abrams, CFA, Farhan Ahmad and Nickie Yue each certify, with respect to the companies or securities that the individual analyzes, that (1) the views expressed in this report accurately reflect his or her personal views about all of the subject companies and securities and (2) no part of his or her compensation was, is or will be directly or indirectly related to the specific recommendations or views expressed in this report.
3-Year Price and Rating History for Amkor Technology Inc. (AMKR.OQ)
AMKR.OQ Closing Price Target Price
Date (US$) (US$) Rating
26-Oct-12 4.05 6.00 O
25-Apr-13 3.86 5.50
26-Jul-13 4.34 *
30-Jul-13 4.28 5.50 O
29-Apr-14 7.80 8.40
29-Jul-14 9.43 10.20 N *
28-Oct-14 6.33 8.00
11-Feb-15 8.69 9.00
15-Jul-15 5.65 7.40
* Asterisk signifies initiation or assumption of coverage.
O U T PERFO RM
N EU T RA L
The analyst(s) responsible for preparing this research report received Compensation that is based upon various factors including Credit Suisse's total revenues, a portion of which are generated by Credit Suisse's investment banking activities
As of December 10, 2012 Analysts’ stock rating are defined as follows:
Outperform (O) : The stock’s total return is expected to outperform the relevant benchmark*over the next 12 months.
Neutral (N) : The stock’s total return is expected to be in line with the relevant benchmark* over the next 12 months.

28 July 2015
Amkor Technology Inc.
(AMKR.OQ) 19
Underperform (U) : The stock’s total return is expected to underperform the relevant benchmark* over the next 12 months.
*Relevant benchmark by region: As of 10th December 2012, Japanese ratings are based on a stock’s total return relative to the analyst's coverage universe which consists of all companies covered by the analyst within the relevant sector, with Outperforms representing the most attractiv e, Neutrals the less attractive, and Underperforms the least attractive investment opportunities. As of 2nd October 2012, U.S. and Canadian as well as European ratings are based on a stock’s total return relative to the analyst's coverage universe which consists of all companies covered by the analyst within the relevant sector, with Outperforms representing the most attractive, Neutrals the less attractive, and Underperforms the least attractive investment opportunities. For Latin Ame rican and non-Japan Asia stocks, ratings are based on a stock’s total return relative to the average total return of the relevant country or regional benchmark; prior to 2nd October 2012 U.S. and Canadia n ratings were based on (1) a stock’s absolute total return potential to its current share price and (2) the relative attractiveness of a stock’s total return potential within an analyst’s coverage universe. For Australian and New Zealand stocks, the expected total return (ETR) calculation includes 1 2-month rolling dividend yield. An Outperform rating is assigned where an ETR is greater than or equal to 7.5%; Underperform where an ETR less than or equal to 5%. A Neutral may be assigned where the ETR is between -5% and 15%. The overlapping rating range allows analysts to assign a rating that puts ETR in the context of associated risks. Prior to 18 May 2015, ETR ranges for Outperform and Underperform ratings did not overlap with Neutral thresholds between 15% and 7.5%, wh ich was in operation from 7 July 2011.
Restricted (R) : In certain circumstances, Credit Suisse policy and/or applicable law and regulations preclude certain types of communications, including an investment recommendation, during the course of Credit Suisse's engagement in an investment banking transaction and in certain other circumstances.
Volatility Indicator [V] : A stock is defined as volatile if the stock price has moved up or down by 20% or more in a month in at least 8 of the past 24 months or the analyst expects significant volatility going forward.
Analysts’ sector weightings are distinct from analysts’ stock ratings and are based on the analyst’s expectations for the fundamentals and/or valuation of the sector* relative to the group’s historic fundamentals and/or valuation:
Overweight : The analyst’s expectation for the sector’s fundamentals and/or valuation is favorable over the next 12 months.
Market Weight : The analyst’s expectation for the sector’s fundamentals and/or valuation is neutral over the next 12 months.
Underweight : The analyst’s expectation for the sector’s fundamentals and/or valuation is cautious over the next 12 months.
*An analyst’s coverage sector consists of all companies covered by the analyst within the relevant sector. An analyst may cover multiple sectors.
Credit Suisse's distribution of stock ratings (and banking clients) is:
Global Ratings Distribution
Rating Versus universe (%) Of which banking clients (%)
Outperform/Buy* 49% (27% banking clients)
Neutral/Hold* 35% (43% banking clients)
Underperform/Sell* 13% (38% banking clients)
Restricted 3%
*For purposes of the NYSE and NASD ratings distribution disclosure requirements, our stock ratings of Outperform, Neutral, and Underperform most closely correspond to Buy, Hold, and Sell, respectively; however, the meanings are not the same, as our stock ratings are determined on a relative basis. (Please refer to definitions above.) An investor's decision to buy or sell a security should be based on investment objectives, current holdin gs, and other individual factors.
Credit Suisse’s policy is to update research reports as it deems appropriate, based on developments with the subject company, the sector or the market that may have a material impact on the research views or opinions stated herein.
Credit Suisse's policy is only to publish investment research that is impartial, independent, clear, fair and not misleading. For more detail please refer to Credit Suisse's Policies for Managing Conflicts of Interest in connection with Investment Research: http://www.csfb.com/research-and-analytics/disclaimer/managing_conflicts_disclaimer.html
Credit Suisse does not provide any tax advice. Any statement herein regarding any US federal tax is not intended or written to be used, and cannot be used, by any taxpayer for the purposes of avoiding any penalties.
Price Target: (12 months) for Amkor Technology Inc. (AMKR.OQ)
Method: Our target price of $5.50 is based on the 10x 2016E EPS and 1.0x forward P/B. Valuation is at the lower-end at 0.8x EV/Sales vs. 0.5-1.2x range and 3.2x EV/EBITDA vs. 2.5-5x range.
Risk: The following are risks to our $5.50 price target for AMKR. We think there is a risk that sub-con group multiples could expand as a result of a re-rating in the sector due to better capital discipline this cycle. A worse-than-expected inventory correction or macro demand weakness could result in pricing, margin, estimate and multiple risk for the group.
Please refer to the firm's disclosure website at https://rave.credit-suisse.com/disclosures for the definitions of abbreviations typically used in the target price method and risk sections.
See the Companies Mentioned section for full company names
The subject company (AMKR.OQ) currently is, or was during the 12-month period preceding the date of distribution of this report, a client of Credit Suisse.

28 July 2015
Amkor Technology Inc.
(AMKR.OQ) 20
Credit Suisse expects to receive or intends to seek investment banking related compensation from the subject company (AMKR.OQ) within the next 3 months.
Important Regional Disclosures
Singapore recipients should contact Credit Suisse AG, Singapore Branch for any matters arising from this research report.
The analyst(s) involved in the preparation of this report have not visited the material operations of the subject company (AMKR.OQ) within the past 12 months
Restrictions on certain Canadian securities are indicated by the following abbreviations: NVS--Non-Voting shares; RVS--Restricted Voting Shares; SVS--Subordinate Voting Shares.
Individuals receiving this report from a Canadian investment dealer that is not affiliated with Credit Suisse should be advised that this report may not contain regulatory disclosures the non-affiliated Canadian investment dealer would be required to make if this were its own report.
For Credit Suisse Securities (Canada), Inc.'s policies and procedures regarding the dissemination of equity research, please visit https://www.credit-suisse.com/sites/disclaimers-ib/en/canada-research-policy.html.
Credit Suisse has acted as lead manager or syndicate member in a public offering of securities for the subject company (AMKR.OQ) within the past 3 years.
As of the date of this report, Credit Suisse acts as a market maker or liquidity provider in the equities securities that are the subject of this report.
Principal is not guaranteed in the case of equities because equity prices are variable.
Commission is the commission rate or the amount agreed with a customer when setting up an account or at any time after that.
Taiwanese Disclosures: This research report is for reference only. Investors should carefully consider their own investment risk. Investment results are the responsibility of the individual investor. Reports may not be reprinted without permission of CS. Reports written by Taiwan based analysts on non-Taiwan listed companies are not considered recommendations to buy or sell securities under Taiwan Stock Exchange Operational Regulations Governing Securities Firms Recommending Trades in Securities to Customers.
To the extent this is a report authored in whole or in part by a non-U.S. analyst and is made available in the U.S., the following are important disclosures regarding any non-U.S. analyst contributors: The non-U.S. research analysts listed below (if any) are not registered/qualified as research analysts with FINRA. The non-U.S. research analysts listed below may not be associated persons of CSSU and therefore may not be subject to the NASD Rule 2711 and NYSE Rule 472 restrictions on communications with a subject company, public appearances and trading securities held by a research analyst account.
Credit Suisse AG, Taipei Securities Branch ........................................................................................................ Randy Abrams, CFA ; Nickie Yue
For Credit Suisse disclosure information on other companies mentioned in this report, please visit the website at https://rave.credit-suisse.com/disclosures or call +1 (877) 291-2683.

28 July 2015
Amkor Technology Inc.
(AMKR.OQ) 21
References in this report to Credit Suisse include all of the subsidiaries and affiliates of Credit Suisse operating under its investment banking division. For more information on our structure, please use the following link: https://www.credit-suisse.com/who-we-are This report may contain material that is not directed to, or intended for distribution to or use by, any person or entity who is a citizen or resident of or located in any locality, state, country or other jurisdiction where such distribution, publication, availability or use would be contrary to law or regulation or which would subject Credit Suisse AG or its affiliates ("CS") to any registration or licensing requirement within such jurisdiction. All material presented in this report, unless specifically indicated otherwise, is under copyright to CS. None of the material, nor its content, nor any copy of it, may be altered in any way, transmitted to, copied or distributed to any other party, without the prior express written permission of CS. All trademarks, service marks and logos used in this report are trademarks or service marks or registered trademarks or service marks of CS or its affiliates. The information, tools and material presented in this report are provided to you for information purposes only and are not to be used or considered as an offer or the solicitation of an offer to sell or to buy or subscribe for securities or other financial instruments. CS may not have taken any steps to ensure that the securities referred to in this report are suitable for any particular investor. CS will not treat recipients of this report as its customers by virtue of their receiving this report. The investments and services contained or referred to in this report may not be suitable for you and it is recommended that you consult an independent investment advisor if you are in doubt about such investments or investment services. Nothing in this report constitutes investment, legal, accounting or tax advice, or a representation that any investment or strategy is suitable or appropriate to your individual circumstances, or otherwise constitutes a personal recommendation to you. CS does not advise on the tax consequences of investments and you are advised to contact an independent tax adviser. Please note in particular that the bases and levels of taxation may change. Information and opinions presented in this report have been obtained or derived from sources believed by CS to be reliable, but CS makes no representation as to their accuracy or completeness. CS accepts no liability for loss arising from the use of the material presented in this report, except that this exclusion of liability does not apply to the extent that such liability arises under specific statutes or regulations applicable to CS. This report is not to be relied upon in substitution for the exercise of independent judgment. CS may have issued, and may in the future issue, other communications that are inconsistent with, and reach different conclusions from, the information presented in this report. Those communications reflect the different assumptions, views and analytical methods of the analysts who prepared them and CS is under no obligation to ensure that such other communications are brought to the attention of any recipient of this report. Some investments referred to in this report will be offered solely by a single entity and in the case of some investments solely by CS, or an associate of CS or CS may be the only market maker in such investments. Past performance should not be taken as an indication or guarantee of future performance, and no representation or warranty, express or implied, is made regarding future performance. Information, opinions and estimates contained in this report reflect a judgment at its original date of publication by CS and are subject to change without notice. The price, value of and income from any of the securities or financial instruments mentioned in this report can fall as well as rise. The value of securities and financial instruments is subject to exchange rate fluctuation that may have a positive or adverse effect on the price or income of such securities or financial instruments. Investors in securities such as ADR's, the values of which are influenced by currency volatility, effectively assume this risk. Structured securities are complex instruments, typically involve a high degree of risk and are intended for sale only to sophisticated investors who are capable of understanding and assuming the risks involved. The market value of any structured security may be affected by changes in economic, financial and political factors (including, but not limited to, spot and forward interest and exchange rates), time to maturity, market conditions and volatility, and the credit quality of any issuer or reference issuer. Any investor interested in purchasing a structured product should conduct their own investigation and analysis of the product and consult with their own professional advisers as to the risks involved in making such a purchase. Some investments discussed in this report may have a high level of volatility. High volatility investments may experience sudden and large falls in their value causing losses when that investment is realised. Those losses may equal your original investment. Indeed, in the case of some investments the potential losses may exceed the amount of initial investment and, in such circumstances, you may be required to pay more money to support those losses. Income yields from investments may fluctuate and, in consequence, initial capital paid to make the investment may be used as part of that income yield. Some investments may not be readily realisable and it may be difficult to sell or realise those investments, similarly it may prove difficult for you to obtain reliable information about the value, or risks, to which such an investment is exposed. This report may provide the addresses of, or contain hyperlinks to, websites. Except to the extent to which the report refers to website material of CS, CS has not reviewed any such site and takes no responsibility for the content contained therein. Such address or hyperlink (including addresses or hyperlinks to CS's own website material) is provided solely for your convenience and information and the content of any such website does not in any way form part of this document. Accessing such website or following such link through this report or CS's website shall be at your own risk. This report is issued and distributed in Europe (except Switzerland) by Credit Suisse Securities (Europe) Limited, One Cabot Square, London E14 4QJ, England, which is authorised by the Prudential Regulation Authority and regulated by the Financial Conduct Authority and the Prudential Regulation Authority. This report is being distributed in Germany by Credit Suisse Securities (Europe) Limited Niederlassung Frankfurt am Main regulated by the Bundesanstalt fuer Finanzdienstleistungsaufsicht ("BaFin"). This report is being distributed in the United States and Canada by Credit Suisse Securities (USA) LLC; in Switzerland by Credit Suisse AG; in Brazil by Banco de Investimentos Credit Suisse (Brasil) S.A or its affiliates; in Mexico by Banco Credit Suisse (México), S.A. (transactions related to the securities mentioned in this report will only be effected in compliance with applicable regulation); in Japan by Credit Suisse Securities (Japan) Limited, Financial Instruments Firm, Director-General of Kanto Local Finance Bureau (Kinsho) No. 66, a member of Japan Securities Dealers Association, The Financial Futures Association of Japan, Japan Investment Advisers Association, Type II Financial Instruments Firms Association; elsewhere in Asia/ Pacific by whichever of the following is the appropriately authorised entity in the relevant jurisdiction: Credit Suisse (Hong Kong) Limited, Credit Suisse Equities (Australia) Limited, Credit Suisse Securities (Thailand) Limited, regulated by the Office of the Securities and Exchange Commission, Thailand, having registered address at 990 Abdulrahim Place, 27th Floor, Unit 2701, Rama IV Road, Silom, Bangrak, Bangkok 10500, Thailand, Tel. +66 2614 6000, Credit Suisse Securities (Malaysia) Sdn Bhd, Credit Suisse AG, Singapore Branch, Credit Suisse Securities (India) Private Limited (CIN no. U67120MH1996PTC104392) regulated by the Securities and Exchange Board of India (registration Nos. INB230970637; INF230970637; INB010970631; INF010970631), having registered address at 9th Floor, Ceejay House, Dr.A.B. Road, Worli, Mumbai - 18, India, T- +91-22 6777 3777, Credit Suisse Securities (Europe) Limited, Seoul Branch, Credit Suisse AG, Taipei Securities Branch, PT Credit Suisse Securities Indonesia, Credit Suisse Securities (Philippines ) Inc., and elsewhere in the world by the relevant authorised affiliate of the above. Research on Taiwanese securities produced by Credit Suisse AG, Taipei Securities Branch has been prepared by a registered Senior Business Person. Research provided to residents of Malaysia is authorised by the Head of Research for Credit Suisse Securities (Malaysia) Sdn Bhd, to whom they should direct any queries on +603 2723 2020. This report has been prepared and issued for distribution in Singapore to institutional investors, accredited investors and expert investors (each as defined under the Financial Advisers Regulations) only, and is also distributed by Credit Suisse AG, Singapore branch to overseas investors (as defined under the Financial Advisers Regulations). By virtue of your status as an institutional investor, accredited investor, expert investor or overseas investor, Credit Suisse AG, Singapore branch is exempted from complying with certain compliance requirements under the Financial Advisers Act, Chapter 110 of Singapore (the "FAA"), the Financial Advisers Regulations and the relevant Notices and Guidelines issued thereunder, in respect of any financial advisory service which Credit Suisse AG, Singapore branch may provide to you. This information is being distributed by Credit Suisse AG, Dubai Branch, duly licensed and regulated by the Dubai Financial Services Authority (DFSA), and is directed at Professional Clients or Market Counterparties only, as defined by the DFSA. The financial products or financial services to which the information relates will only be made available to a client who meets the regulatory criteria to be a Professional Client or Market Counterparty only, as defined by the DFSA, and is not intended for any other person. This research may not conform to Canadian disclosure requirements. In jurisdictions where CS is not already registered or licensed to trade in securities, transactions will only be effected in accordance with applicable securities legislation, which will vary from jurisdiction to jurisdiction and may require that the trade be made in accordance with applicable exemptions from registration or licensing requirements. Non-U.S. customers wishing to effect a transaction should contact a CS entity in their local jurisdiction unless governing law permits otherwise. U.S. customers wishing to effect a transaction should do so only by contacting a representative at Credit Suisse Securities (USA) LLC in the U.S. Please note that this research was originally prepared and issued by CS for distribution to their market professional and institutional investor customers. Recipients who are not market professional or institutional investor customers of CS should seek the advice of their independent financial advisor prior to taking any investment decision based on this report or for any necessary explanation of its contents. This research may relate to investments or services of a person outside of the UK or to other matters which are not authorised by the Prudential Regulation Authority and regulated by the Financial Conduct Authority and the Prudential Regulation Authority or in respect of which the protections of the Prudential Regulation Authority and Financial Conduct Authority for private customers and/or the UK compensation scheme may not be available, and further details as to where this may be the case are available upon request in respect of this report. CS may provide various services to US municipal entities or obligated persons ("municipalities"), including suggesting individual transactions or trades and entering into such transactions. Any services CS provides to municipalities are not viewed as "advice" within the meaning of Section 975 of the Dodd-Frank Wall Street Reform and Consumer Protection Act. CS is providing any such services and related information solely on an arm's length basis and not as an advisor or fiduciary to the municipality. In connection with the provision of the any such services, there is no agreement, direct or indirect, between any municipality (including the officials, management, employees or agents thereof) and CS for CS to provide advice to the municipality. Municipalities should consult with their financial, accounting and legal advisors regarding any such services provided by CS. In addition, CS is not acting for direct or indirect compensation to solicit the municipality on behalf of an unaffiliated broker, dealer, municipal securities dealer, municipal advisor, or investment adviser for the purpose of obtaining or retaining an engagement by the municipality for or in connection with Municipal Financial Products, the issuance of municipal securities, or of an investment adviser to provide investment advisory services to or on behalf of the municipality. If this report is being distributed by a financial institution other than Credit Suisse AG, or its affiliates, that financial institution is solely responsible for distribution. Clients of that institution should contact that institution to effect a transaction in the securities mentioned in this report or require further information. This report does not constitute investment advice by Credit Suisse to the clients of the distributing financial institution, and neither Credit Suisse AG, its affiliates, and their respective officers, directors and employees accept any liability whatsoever for any direct or consequential loss arising from their use of this report or its content. Principal is not guaranteed. Commission is the commission rate or the amount agreed with a customer when setting up an account or at any time after that.
Copyright © 2015 CREDIT SUISSE AG and/or its affiliates. All rights reserved.
Investment principal on bonds can be eroded depending on sale price or market price. In addition, there are bonds on which investment principal can be eroded due to changes in redemption amounts. Care is required when investing in such instruments. When you purchase non-listed Japanese fixed income securities (Japanese government bonds, Japanese municipal bonds, Japanese government guaranteed bonds, Japanese corporate bonds) from CS as a seller, you will be requested to pay the purchase price only.
TC2167.doc