amino acid metabolism conflicts with protein diversitymate.dm.uba.ar/~krick/mbe2014.pdf · amino...
TRANSCRIPT

ii
“NaiveIdea-MBE-25-06-14” — 2014/7/2 — 18:59 — page 1 — #2 ii
ii
ii
Article
Amino acid metabolism conflicts with protein diversity
Teresa Krick,
1Nina Verstraete,
2Leonardo G. Alonso,
3David A. Shub,
4Diego U. Ferreiro,
2
Michael Shub,
5and Ignacio E. Sánchez
⇤,2
1Departamento de Matemática, Facultad de Ciencias Exactas y Naturales and IMAS - CONICET, Universidadde Buenos Aires2Protein Physiology Laboratory, Departamento de Química Biológica, Facultad de Ciencias Exactas y Naturalesand IQUIBICEN - CONICET, Universidad de Buenos Aires, C1428EGA Buenos Aires3Fundación Instituto Leloir - IIBBA CONICET, Buenos Aires4Department of Biological Sciences, University at Albany, State University of New York.5IMAS - CONICET, Universidad de Buenos Aires⇤Corresponding author: E-mail: [email protected].
Abstract
The twenty protein coding amino acids are found in proteomes with different relative abundances.
The most abundant amino acid, leucine, is nearly an order of magnitude more prevalent than the
least abundant amino acid, cysteine. Amino acid metabolic costs differ similarly, constraining their
incorporation into proteins. On the other hand, a diverse set of protein sequences is necessary to build
functional proteomes. Here we present a simple model for a cost-diversity trade-off postulating that
natural proteomes minimize amino acid metabolic flux while maximizing sequence entropy. The model
explains the relative abundances of amino acids across a diverse set of proteomes. We found that the data
is remarkably well explained when the cost function accounts for amino acid chemical decay. More than
one hundred organisms reach comparable solutions to the trade-off by different combinations of proteome
cost and sequence diversity. Quantifying the interplay between proteome size and entropy shows that
proteomes can get optimally large and diverse.
Key words: amino acid decay, amino acid metabolism, information theory, maximum entropy, proteomics.
Introduction
The twenty proteinogenic amino acids are present
in nature in different amounts, spanning nearly
an order of magnitude (The UniProt Consortium
(2013)). The most abundant amino acid in both
Swissprot and TrEMBL databases is leucine, while
tryptophan and cysteine are the least abundant.
According to statistical studies, natural protein
sequences are indistinguishable from strings
of amino acids chosen at random with the
abovementioned abundances (Weiss et al. (2000)).
Amino acid relative abundances are fairly well
conserved across organisms, suggesting that a
single underlying principle might determine the
amino acid composition of proteomes.
1© The Author(s) 2014. Published by Oxford University Press on behalf of the Society for Molecular Biology and Evolution. This is an Open Access article distributed under the terms of the Creative Commons Attribution Non-Commercial License (http://creativecommons.org/licenses/by-nc/4.0/), which permits non-commercial re-use, distribution, and reproduction in any medium, provided the original work is properly cited. For commercial re-use, please contact [email protected]
MBE Advance Access published August 1, 2014 at Sistem
a de Bibliotecas y de Inform
ación Universidad de B
uenos Aires on A
ugust 13, 2014http://m
be.oxfordjournals.org/D
ownloaded from
ii
“NaiveIdea-MBE-25-06-14” — 2014/7/2 — 18:59 — page 2 — #3 ii
ii
ii
MBE
Some forty years ago Dyer (Dyer (1971); Gupta
(2005)) suggested that protein sequences could
be the result of transcription and translation
of random DNA sequences. The amino acid
distribution arises from the interplay between
the genomic GC content, codon assignment and
redundancy of the genetic code. We will refer
to this as the genetic code model and describe
it in more detail below. Despite its simplicity
the calculated amino acid relative abundances
correlate fairly well with the observed ones,
although with prominent outliers (Dyer (1971);
Gupta (2005)).
The "cost minimization principle" suggests
that organisms minimize the cost of protein
biosynthesis (Heizer et al. (2011); Seligmann
(2003)). A linear relationship between amino acid
abundance and amino acid molecular weight or
amino acid metabolic cost is supported by a
reasonably high Pearson coefficient of correlation
(Heizer et al. (2011); Seligmann (2003)). However,
the linear relationship is presented as such
rather than justified from first principles (Heizer
et al. (2011); Seligmann (2003)) and cost
minimization alone predicts that proteins would
be homopolymers of the cheapest amino acid.
On the other hand, natural protein folds can not
be encoded with homopolymers, as described by
the energy landscape theory of protein folding
(Bryngelson and Wolynes (1987)). A sufficiently
large alphabet is needed to encode the diversity
of known proteins (Wolynes (1997), Shakhnovich
(1998)). Precisely how cost minimization and
sequence diversity requirements balance each
other is not known.
Here, we explicitly treat the trade-off between
two competing forces: the minimization of the
metabolic cost of amino acid biosynthesis and the
maximization of the number of sequences that can
be generated in a proteome from a given amino
acid composition. From this basic hypothesis,
we deduce a mathematical relationship between
amino acid metabolic cost and the logarithm of
amino acid abundances. This simple relationship
describes the data remarkably better than both
the genetic code model and the linear cost-
abundance model.
TheoryA linear relationship
A naive idea suggests that the probability
that an amino acid is incorporated in proteins
might reflect the energetic cost of producing
the amino acid (with less costly amino acids
used more frequently) while maintaining the
flexibility to code as many polypeptide chains as
possible. Previous work suggested that the relative
abundance of amino acids in proteomes is linearly
related to the energetic costs of making the amino
acids (Heizer et al. (2011); Seligmann (2003)).
Here we suggest that it is more appropriate to look
for a linear relationship between the logarithms of
the relative abundances and the energetic costs.
2
at Sistema de B
ibliotecas y de Información U
niversidad de Buenos A
ires on August 13, 2014
http://mbe.oxfordjournals.org/
Dow
nloaded from
ii
“NaiveIdea-MBE-25-06-14” — 2014/7/2 — 18:59 — page 3 — #4 ii
ii
ii
MBE
We derive this relationship via a maximization
principle.
Given probabilities pi, 1 i20, representing
the relative abundances of the twenty amino acids
in a proteome, the number of probable peptide
chains of length n in a proteome can be calculated
from Shannon’s information theory as e
nh, where
h=h(p1,...,p20)=�20X
i=1
pi ln(pi)
is the entropy (Shannon (1948); Shannon and
Weaver (1949)). The average energetic cost of
amino acids in a cell isP20
i=1piei, where ei is the
energetic cost of i-th amino acid.
The maximization of the number of probable
sequences in a proteome and the simultaneous
minimization of metabolic cost is equivalent to
maximizing the function:
f(p1,...,p20)=h(p1,...,p20)�20X
i=1
piei. (1)
The maximum of this function has the property
that at a given energetic cost the entropy is
highest, that is the flexibility of a proteome to
produce different polypeptide chains is greatest.
Conversely, at a given entropy the energy
consumed by producing proteins is minimized.
These properties hold for any choice of units for
the energies and the entropy.
Maximizing f predicts a linear relationship with
negative slope between the logarithms of the
relative abundances and the energetic costs. We
maximize the function f by differential calculus
given a constraint, namely that the sum of
the relative abundances equals unity,P20
i=1pi=
1. The gradient of the function should be a
constant multiple of the gradient of the constraint,
the Lagrange multiplier �. Taking the partial
derivative with respect to pi of (1) and the
constraintP20
i=1pi=1 gives for each i:
�ln(pi)�1�ei=�, i.e. ln(pi)=�ei�(1+�).
The value of the intercept �(1+�) can be derived
from the constraint:
1=20X
j=1
pj=20X
j=1
e
�ej�(1+�)=e
�(1+�)20X
j=1
e
�ej
which implies that �(1+�)=�ln(P20
j=1e�ej ).
This gives the linear relation:
ln(pi)=�ei� ln(20X
j=1
e
�ej ), 1 i20, (2)
between the logarithm of the relative abundance
and the energetic cost referred to above, with slope
�1 when the energetic cost ei is given in the
“correct" natural unit e. Taking the exponential of
(2) gives the relative abundance of the ith-amino
acid pi in terms of the costs in unit e:
pi=e
�ei
P20j=1e
�ej. (3)
The formula is reminiscent of the Gibbs
distribution in physics.
The slope of the linear relationship
Since the "correct” natural unit e for the energetic
costs ei, 1 i20, is not known, we can assume
that the energetic costs ci used in the examples
below are given in terms of some other unit c
satisfying c=me for some m2R>0, and are thus
3
at Sistema de B
ibliotecas y de Información U
niversidad de Buenos A
ires on August 13, 2014
http://mbe.oxfordjournals.org/
Dow
nloaded from

ii
“NaiveIdea-MBE-25-06-14” — 2014/7/2 — 18:59 — page 4 — #5 ii
ii
ii
MBE
linear multiples of these theoretical ei: ci=(1/m)ei
(or ei=mci) for 1 i20. An important fact is
that –under the linear relationship derived in the
previous section– not only is the relationship linear
for this other choice of unit c (i.e. for any other
computed energetic cost), with slope �m instead
of �1, but also the relative abundances pi are
invariant under this change of scale:
ln(pi)=�ei� ln(20X
j=1
e
�ej )=�mci� ln(20X
j=1
e
�mcj ),
or equivalently,
pi=e
�ei
P20j=1e
�ej=
e
�mci
P20j=1e
�mcj, 1 i20.
In particular, if we use energetic costs ci
measured in unit c, and the observed slope
in terms of this unit c is �m, then letting
e=(1/m)c we recover what we have called the
“correct" natural unit e. We note that 1/m is
analogous to the thermodynamic temperature
in statistical mechanics. When we only have
observed data, the slope of the best fitting
straight-line approximating the data may depend
on the scaling in some other way. That is if we
multiply ei by 1/m to get ci, 1 i20, the slope
of the best linear approximation may not multiply
by �m. If it does multiply by �m for all m we
say that the best straight-line approximation is
scale invariant. In this article, we use the reduced
major axis (RMA) regression, which is scale
invariant (Section Materials and Methods below).
As such, the predicted relative abundances are
independent of the scaling of the costs.
RESULTSAmino acid relative abundances in proteomes
We estimate amino acid relative abundances in
proteomes in two datasets. Dataset DS1 was
derived from 108 fully sequenced and annotated
genomes from the three domains of life (Tekaia and
Yeramian (2006)). We translated coding regions
into protein sequences and counted the frequency
of occurrence of each amino acid, assuming that all
proteins are equally abundant (Table S1). Dataset
DS2 was derived from the PaxDB database
for protein abundances (Wang et al. (2012)).
We considered 17 organisms for which protein
sequence and relative abundance data are available
for more than 50 per cent of the proteome. We
used integrated datasets for the whole organism
whenever possible (Table S2).
For both datasets, we tested several models for
amino acid relative abundances. The results are
shown in Table 1, Figure 1 and Figure S1 below
and described in detail in the next sections.
Correlation of amino acid relative abundances
with metabolic cost
We test two linear relationships between amino
acid relative abundances and the metabolic cost,
measured in ATP molecules per molecule of
amino acid. The first linear relationship correlates
(plain) relative abundances with costs, while the
second one correlates the logarithms of the relative
abundances with costs.
4
at Sistema de B
ibliotecas y de Información U
niversidad de Buenos A
ires on August 13, 2014
http://mbe.oxfordjournals.org/
Dow
nloaded from
ii
“NaiveIdea-MBE-25-06-14” — 2014/7/2 — 18:59 — page 5 — #6 ii
ii
ii
MBE
We used the cost estimation from (Akashi and
Gojobori (2002)), shown in Table 2. Amino acid
biosynthesis pathways are highly conserved across
organisms, as indicated by the high correlation
between published estimations of metabolic cost
(Supplementary material, Table S1 and (Barton
et al. (2010))). Differences in cost estimations
do exist, such as between aerobic and anaerobic
organisms (Supplementary material, Table S1).
However, the main conclusions of this work
are independent of the cost estimation used
(Supplementary material, Tables S2 and S3).
Some organisms in DS1 and DS2 lack the
biosynthetic pathways for some amino acids,
rendering them essential. If an amino acid is
essential, it is obtained from the environment
and may be then used for protein synthesis or
catabolized. Similarly, if an amino acid is not
essential, it may or may not be produced by a
cell. The amount of energy that can be obtained
from catabolizing an essential amino acid is similar
to the amount of energy that is needed for its
synthesis (Swire (2007)). Thus, the incorporation
of essential and non-essential amino acids in
proteins involves similar energy choices.
The plain amino acid relative abundances show
a statistically significant correlation with the
amino acid metabolic cost (in ATP units) for both
datasets, with Pearson coefficients of correlation r
of -0.46 and -0.58 (Table 1 and Figure S1, panels
A and C). The correlation is also observed for
individual organisms in DS1 and DS2 regardless
of genomic GC content (Figure 2, black lines in
panels A and B). These results are in agreement
with previous proposals (Heizer et al. (2011);
Seligmann (2003)).
However, the theoretical model we put forward
suggests that the correlation should improve if we
consider the logarithm of the amino acid relative
abundances instead of the relative abundances
themselves. This is indeed the case, as the r values
decrease to -0.52 and -0.62 for DS1 and DS2
(Table 1 and Figure 1, panels A and D). The
correlation r values decrease for most individual
organisms in DS1 and DS2 regardless of genomic
GC content (Figure 2, blue lines in panels A
and B). We conclude that the theoretical model
presented here describes the data better than the
previously reported empirical relationship between
amino acid costs and relative abundances.
Correlation of amino acid relative abundances
with metabolic cost corrected by amino acid
decay
Amino acids undergo spontaneous chemical
reactions in physiological conditions and degrade
over time. Therefore, the metabolic burden of
amino acids should consider amino acid decay
rates as well as production cost. Since the
experimental determination of the particular
amino acid degradation rate is an extremely
difficult task and we could not find a suitable
set of amino acid decay rates in the literature,
we have deduced a semi-quantitative reactivity
ranking from previous publications and common
knowledge of amino acid chemistry (described in
5
at Sistema de B
ibliotecas y de Información U
niversidad de Buenos A
ires on August 13, 2014
http://mbe.oxfordjournals.org/
Dow
nloaded from

ii
“NaiveIdea-MBE-25-06-14” — 2014/7/2 — 18:59 — page 6 — #7 ii
ii
ii
MBE
detail in the supplementary text). We have taken
into account nucleophilicity, redox reactivity and
other biologically relevant reactions (Creighton
(1983)) (Table 2). The physiological relevance
of this proposed ranking is supported by the
presence of energy-consuming enzymatic pathways
that protect proteins against chemical decay
(Moskovitz et al. (1997); Reissner and Aswad
(2003); Stadtman (2006); Ströher and Millar
(2012)). When a cell divides, the offspring cells
inherit the same amino acids as the parent cell
had. The descendant cells have to be energy
efficient on average for the descendant line to
survive. Thus, the average may be taken over very
long time intervals and the amino acid costs in
units of ATP/time should be evolutionary relevant
regardless of the proliferation rate of the cells
under consideration.
Amino acid production cost and decay rates can
be multiplied to yield the amino acid production
cost in units of ATP/time (Table 2). Plain amino
acid production cost can be understood as the
energy the cell spends in making a molecule of
a given amino acid. On the other hand, this new
quantity has units of power and can be understood
as the energy the cell spends per unit of time
in order to keep a constant concentration of a
given amino acid, i.e., the energy flux through the
metabolism of that amino acid (Lotka (1922)).
We reassess the relationship between amino
acid relative abundance and metabolic cost, as
measured by energy flux in units of ATP/time.
We observe a clearly improved correlation between
amino acid energy costs in units of ATP/time and
both amino acid relative abundances and their
logarithms (Table 1). In the case of the correlation
with amino acid relative abundances, the r values
increase to -0.72 and -0.79 for DS1 and DS2
(Figure S1, panels B and D), regardless of genomic
GC content (Figure 2, red lines in panels A and
B). For the correlation with the logarithm of amino
acid relative abundances, the r values further rise
to -0.86 and -0.91 for DS1 and DS2 (Figure 1,
panels B and E). The correlation is better for most
individual organisms in both datasets regardless
of genomic GC content (Figure 2, green lines in
panels A and B). Thus, taking into account the
simultaneous maximization of proteome entropy
and minimization of cost improves the correlation
also when amino acid costs are measured in units
of ATP/time.
The amino acid cysteine is very reactive, has a
low relative abundance (empty symbols in Figures
1 and 4), a low cost in ATP units and a high cost
in ATP/time units (Table 2). Consequently, its
relative abundance is much better predicted when
cost is considered in units of ATP/time (Table
1, Figure 1 and Figure 2). We have recalculated
the correlations for all models excluding cysteine
in order to determine whether the improvement
in the r values is due only to this singular,
very reactive amino acid (Table 1). The main
conclusions of this work are valid for the remaining
19 amino acids as well. As before, the r value
6
at Sistema de B
ibliotecas y de Información U
niversidad de Buenos A
ires on August 13, 2014
http://mbe.oxfordjournals.org/
Dow
nloaded from
ii
“NaiveIdea-MBE-25-06-14” — 2014/7/2 — 18:59 — page 7 — #8 ii
ii
ii
MBE
improves when we consider the logarithm of
the relative abundances instead of the relative
abundances. Also, the r value increases when we
consider amino acid costs in units of ATP/time.
We interpret that the proposed theoretical
model, together with the amino acid costs in units
of ATP/time, is a very good descriptor of amino
acid relative abundances in proteomes. Compared
with the initial proposal of a linear relationship
between amino acid relative abundances and
amino acid costs in units of ATP, the r value
improved from -0.46 to -0.86 (DS1) and from -0.58
to -0.91 (DS2).
Correlation of amino acid relative abundances
with the genetic code model
The genetic code model relates amino acid
relative abundance with the transcription and
translation of random DNA sequences of a given
GC content (Dyer (1971); Gupta (2005)). To
evaluate this model with DS1 and DS2 we
retrieved the genomic GC content for each genome
from (Kryukov et al. (2012)) and used it to
calculate the expected relative abundances for all
61 amino acid coding triplets. We then translated
the triplets into amino acids and obtained the
expected amino acid relative abundances in
each proteome. This metabolism-agnostic model
shows a good correlation between calculated
and observed amino acid relative abundances
(Table 1 and Figure 1, panels C and F). The
r values are 0.71 and 0.62 for DS1 and DS2.
The correlation is also observed for individual
organisms in the database regardless of genomic
GC content (Figure 2, dashed lines in panels
A and B). However, the r values are worse
than for the metabolic flux model when amino
acid costs are measured in units of ATP/time
(Table 1). This holds regardless of genomic GC
content (Figure 2). The r value closer to -1
for the metabolic flux model in 105 of the 108
organisms in DS1 (Figure 2, Panel A) and for the
17 organisms in DS2 (Figure 2, Panel B). This
conclusion is also valid if the amino acid cysteine
is excluded from the calculations (Table 1). We
interpret that amino acid relative abundances are
better explained when we take into account the
simultaneous maximization of proteome entropy
and minimization of cost.
The trade-off between amino acid metabolic
cost and protein sequence diversity in natural
proteomes
We postulate a model in which living organisms
maximize a target function f that equals the
entropy of the amino acid distribution in the
proteome h minus the average metabolic cost of
an amino acidP20
i=1pieim. This gives rise to a
trade-off between both terms. Figure 3 displays
this trade-off for all organisms in DS1 (white
symbols) and DS2 (black symbols). The figure also
shows the expectation for the genetic code model
(red symbols) Figure 3A shows that most natural
proteomes present lower metabolic costs than the
genetic code model. Similarly, the entropies of
natural proteomes are in the same order as the
genetic code model or higher (Figure 3B). Finally,
7
at Sistema de B
ibliotecas y de Información U
niversidad de Buenos A
ires on August 13, 2014
http://mbe.oxfordjournals.org/
Dow
nloaded from
ii
“NaiveIdea-MBE-25-06-14” — 2014/7/2 — 18:59 — page 8 — #9 ii
ii
ii
MBE
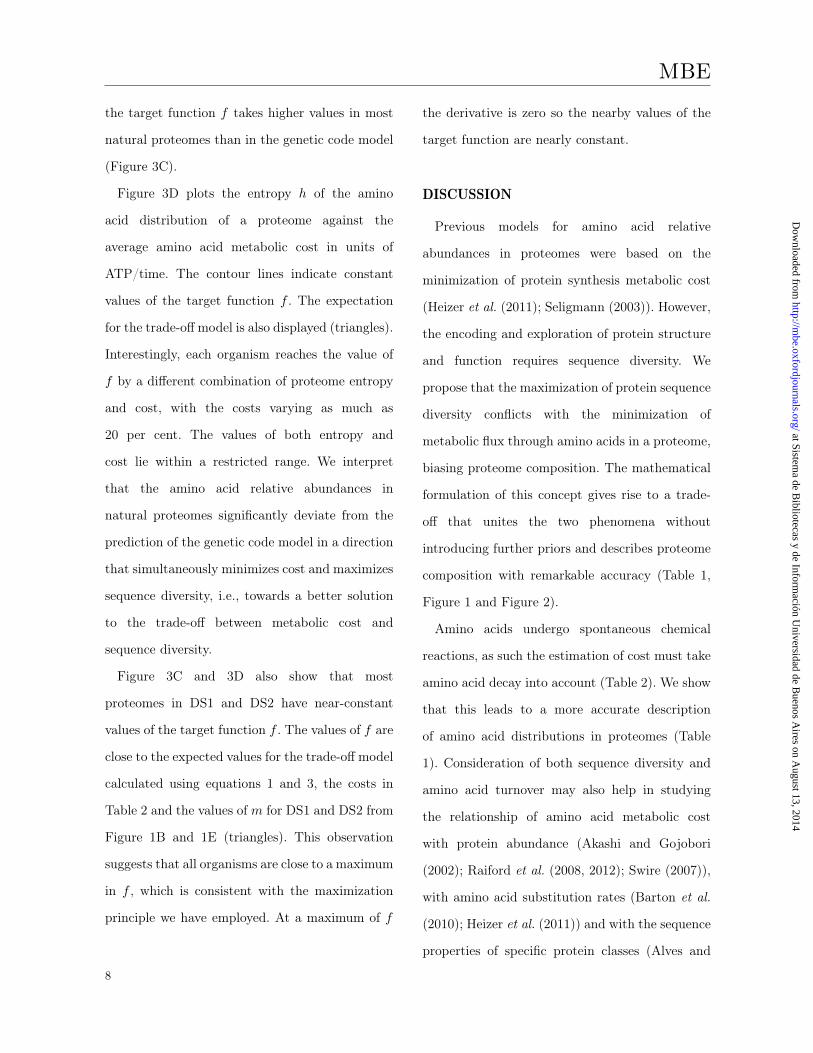
the target function f takes higher values in most
natural proteomes than in the genetic code model
(Figure 3C).
Figure 3D plots the entropy h of the amino
acid distribution of a proteome against the
average amino acid metabolic cost in units of
ATP/time. The contour lines indicate constant
values of the target function f . The expectation
for the trade-off model is also displayed (triangles).
Interestingly, each organism reaches the value of
f by a different combination of proteome entropy
and cost, with the costs varying as much as
20 per cent. The values of both entropy and
cost lie within a restricted range. We interpret
that the amino acid relative abundances in
natural proteomes significantly deviate from the
prediction of the genetic code model in a direction
that simultaneously minimizes cost and maximizes
sequence diversity, i.e., towards a better solution
to the trade-off between metabolic cost and
sequence diversity.
Figure 3C and 3D also show that most
proteomes in DS1 and DS2 have near-constant
values of the target function f . The values of f are
close to the expected values for the trade-off model
calculated using equations 1 and 3, the costs in
Table 2 and the values of m for DS1 and DS2 from
Figure 1B and 1E (triangles). This observation
suggests that all organisms are close to a maximum
in f , which is consistent with the maximization
principle we have employed. At a maximum of f
the derivative is zero so the nearby values of the
target function are nearly constant.
DISCUSSION
Previous models for amino acid relative
abundances in proteomes were based on the
minimization of protein synthesis metabolic cost
(Heizer et al. (2011); Seligmann (2003)). However,
the encoding and exploration of protein structure
and function requires sequence diversity. We
propose that the maximization of protein sequence
diversity conflicts with the minimization of
metabolic flux through amino acids in a proteome,
biasing proteome composition. The mathematical
formulation of this concept gives rise to a trade-
off that unites the two phenomena without
introducing further priors and describes proteome
composition with remarkable accuracy (Table 1,
Figure 1 and Figure 2).
Amino acids undergo spontaneous chemical
reactions, as such the estimation of cost must take
amino acid decay into account (Table 2). We show
that this leads to a more accurate description
of amino acid distributions in proteomes (Table
1). Consideration of both sequence diversity and
amino acid turnover may also help in studying
the relationship of amino acid metabolic cost
with protein abundance (Akashi and Gojobori
(2002); Raiford et al. (2008, 2012); Swire (2007)),
with amino acid substitution rates (Barton et al.
(2010); Heizer et al. (2011)) and with the sequence
properties of specific protein classes (Alves and
8
at Sistema de B
ibliotecas y de Información U
niversidad de Buenos A
ires on August 13, 2014
http://mbe.oxfordjournals.org/
Dow
nloaded from

ii
“NaiveIdea-MBE-25-06-14” — 2014/7/2 — 18:59 — page 9 — #10 ii
ii
ii
MBE
Savageau (2005); Perlstein et al. (2007); Smith and
Chapman (2010); Subramanyam et al. (2006)).
Amino acid abundances are fairly well conserved
across organisms, yet do show some variation
(Lightfield et al. (2011)) that is not accounted
for by the organism-independent metabolic flux
model. The unexplained variability in amino acid
abundances is largest for cysteine and lowest
for threonine, aspartic acid and leucine in both
dataset DS1 and dataset DS2 (Tables S4 and
S5). The performance of the model presented
here is slightly worse for extreme values of
genomic GC content (Figure 2). This, together
with the reasonable success of the genetic code
model in explaining amino acid abundances
(Figures 1 and 2), suggests that taking into
account both amino acid metabolic cost and the
genetic code may help future studies of proteome
composition. Other possible sources of across-
organism variability in amino acid abundances
are variations in the metabolic costs and decay
rates as a function of growth temperature and
oxygen tolerance. Regarding oxygen tolerance,
lowering the contribution of redox reactions to
amino acid decay does not improve the description
of proteomes from anaerobic organisms (data not
shown). In the case of cysteine, specific factors
such as sulfur availability and disulfide bond
formation (Beeby et al. (2005)) may play a role
as well. However, the low variability of the other
sulfur-containing amino acid, methionine (Tables
S4 and S5) does not support the importance of
sulfur availability.
The model we put forward allows for a direct
comparison between proteomes on a common
basis (Figure 3). All natural proteomes fall along
a line in the entropy-cost plane. This result
arises from the observed amino acid relative
abundances and the estimated metabolic costs and
is independent from the mathematical shape of the
relationship between abundances and costs. If the
metabolic costs are organism-independent, this
would indicate that there are multiple biological
solutions to the entropy-cost trade-off. Some
proteomes have a lower average per amino acid
cost and lower sequence diversity; while attaining
higher sequence diversity is accompanied by a
higher average per amino acid cost (Figure 3).
If the distribution of amino acids is
equiprobable, the average metabolic cost per
amino acid is 221 in units of ATP/time (Table 2).
For the average relative amino acid abundances
in datasets DS1 and DS2, the average metabolic
cost drops to 129 in units of ATP/time. In other
words, the metabolic cost of making a protein of
length 100 from equiprobable amino acids is the
same as the metabolic cost of making a protein
of length 170 from the amino acid abundances in
datasets DS1 and DS2.
How large is the reduction in proteome sequence
diversity associated to this reduction in proteome
cost? The number of probable proteins of length
100 is e
nh, where h is the entropy. In the case of
9
at Sistema de B
ibliotecas y de Información U
niversidad de Buenos A
ires on August 13, 2014
http://mbe.oxfordjournals.org/
Dow
nloaded from

ii
“NaiveIdea-MBE-25-06-14” — 2014/7/2 — 18:59 — page 10 — #11 ii
ii
ii
MBE
equally probable amino acids, h⇡3.00 nats and
the number of probable proteins of length 100
is ⇡10130. For the average relative amino acid
abundances in datasets DS1 and DS2, h⇡2.88
nats and the number of probable proteins of length
100 is ⇡10125. Thus, the number of probable
proteins of length 100 is reduced by a factor of 105
in natural proteomes relative to the equiprobable
case. In itself, this is a sharp restriction in sequence
space. However, it is interesting to compare the
10125 remaining possibilities with the number of
sequences explored by terrestrial life since its
origin (Dryden et al. (2008)). This number lies
between 1020 and 1050, implying that natural
proteomes are making use of only a small fraction
of the available sequence space. To sum up, we
suggest that the cost-diversity trade-off allows for
the efficient synthesis of large proteomes while not
severely restricting protein diversification.
MATERIALS AND METHODS
According to (Sokal and Rohlf (1995, Table
15.1)) and many other authors, we chose to use
here the reduced major axis (RMA) regression
(or least products regression) to fit the data,
which is symmetric in both variables, reflects
better the best line fitting the data when both
variables are subject to errors and is scale invariant
as mentioned in Theory. The RMA regression
computes the line y=mx+b for m,b minimizing
the function
f(m,b)=nX
i=1
⇣yi�(mxi+b)
⌘⇣xi�(
yi�b
m
)⌘.
Denoting x= 1n
Pxi, y= 1
n
Pyi for the means, it
is known that in our case
m=�⇣P
y
2i �ny
2
Px
2i �nx
2
⌘1/2
and b= y�mx.
As usual, the Pearson product-moment
correlation coefficient r, �1r1, given by the
formula
r=
P(xi�x)(yi� y)pPn
i=1(xi�x)2pPn
i=1(yi� y)2
(and satisfying that r
2 equals the usual R
2
coefficient of determination), is used to measure
how well the data fits the line: in our case of
negative slope, the closer r is to �1 the better it is.
Supplementary Material
Supplementary tables S1 and S2, Figure S1
and the supplementary text are available
at Molecular Biology and Evolution online
(http://www.mbe.oxfordjournals.org/).
Acknowledgments
This work was supported by CONICET (PIP
0801 2010-2012 to T.K. and M.S., postdoctoral
fellowship to N.V.) and ANPCyT (PICT 2010-
00681 to T.K. and M.S. and PICT 2010-1052
and PICT 2012-2550 to I.E.S.). We would like
to thank Shuai Cheng Li and Lu Zhang, from
Hong Kong City University, for their help and
10
at Sistema de B
ibliotecas y de Información U
niversidad de Buenos A
ires on August 13, 2014
http://mbe.oxfordjournals.org/
Dow
nloaded from

ii
“NaiveIdea-MBE-25-06-14” — 2014/7/2 — 18:59 — page 11 — #12 ii
ii
ii
MBE
Raik Gruenberg, Thierry Mora, Pedro Beltrao
and Jesus Tejero for discussion.
References
Akashi, H. and Gojobori, T. 2002. Metabolic efficiency and
amino acid composition in the proteomes of Escherichia
coli and Bacillus subtilis. Proceedings of the National
Academy of Sciences of the United States of America,
99(6): 3695–3700.
Alves, R. and Savageau, M. A. 2005. Evidence of
selection for low cognate amino acid bias in amino acid
biosynthetic enzymes. Molecular microbiology , 56(4):
1017–1034.
Barton, M. D., Delneri, D., Oliver, S. G., Rattray, M., and
Bergman, C. M. 2010. Evolutionary systems biology of
amino acid biosynthetic cost in yeast. PLoS ONE , 5(8).
Beeby, M., O Connor, B. D., Ryttersgaard, C., Boutz,
D. R., Perry, L. J., and Yeates, T. O. 2005. The
genomics of disulfide bonding and protein stabilization
in thermophiles. PLoS Biol., 3: e309.
Bryngelson, J. D. and Wolynes, P. G. 1987. Spin glasses and
the statistical mechanics of protein folding. Proceedings
of the National Academy of Sciences of the United States
of America, 84(21): 7524–7528.
Creighton, T. E. 1983. Proteins: Structures and molecular
properties. W. H. Freeman and Co.
Dryden, D. T. F., Thomson, A. R., and White, J. H. 2008.
How much of protein sequence space has been explored
by life on Earth? Journal of the Royal Society, Interface
/ the Royal Society , 5(25): 953–956.
Dyer, F. K. 1971. The Quiet Revolution: A New
Synthesis of Biological Knowledge. Journal of Biological
Education, 5: 15–24.
Gupta, P. K. 2005. Molecular Biology and Genetic
Engineering . Rastogi Publications.
Heizer, E. M., Raymer, M. L., and Krane, D. E. 2011.
Amino acid biosynthetic cost and protein conservation.
Journal of molecular evolution, 72(5-6): 466–473.
Kryukov, K., Sumiyama, K., Ikeo, K., Gojobori, T., and
Saitou, N. 2012. A new database (GCD) on genome
composition for eukaryote and prokaryote genome
sequences and their initial analyses. Genome biology
and evolution, 4(4): 501–12.
Lightfield, J., Fram, N. R., and Ely, B. 2011. Across
bacterial phyla, distantly-related genomes with similar
genomic GC content have similar patterns of amino acid
usage. PLoS One, 6: e17677.
Lotka, A. J. 1922. Contribution to the Energetics of
Evolution. Proceedings of the National Academy of
Sciences of the United States of America, 8(6): 147–151.
Moskovitz, J., Berlett, B. S., Poston, J. M., and
Stadtman, E. R. 1997. The yeast peptide-methionine
sulfoxide reductase functions as an antioxidant in vivo.
Proceedings of the National Academy of Sciences of the
United States of America, 94(18): 9585–9589.
Perlstein, E. O., de Bivort, B. L., Kunes, S., and Schreiber,
S. L. 2007. Evolutionarily conserved optimization of
amino acid biosynthesis. Journal of molecular evolution,
65(2): 186–196.
Raiford, D. W., Heizer, E. M., Miller, R. V., Akashi, H.,
Raymer, M. L., and Krane, D. E. 2008. Do amino
acid biosynthetic costs constrain protein evolution
in Saccharomyces cerevisiae? Journal of molecular
evolution, 67(6): 621–630.
Raiford, D. W., Heizer, E. M., Miller, R. V., Doom, T. E.,
Raymer, M. L., and Krane, D. E. 2012. Metabolic
and Translational Efficiency in Microbial Organisms.
Journal of Molecular Evolution, 74(3-4): 206–216.
Reissner, K. J. and Aswad, D. W. 2003. Deamidation and
isoaspartate formation in proteins: unwanted alterations
or surreptitious signals? Cell Mol Life Sci , 60(7): 1281–
1295.
Seligmann, H. 2003. Cost-minimization of amino acid
usage. Journal of molecular evolution, 56(2): 151–161.
Shakhnovich, E. I. 1998. Protein design: A perspective from
simple tractable models. Folding and Design, 3(3).
11
at Sistema de B
ibliotecas y de Información U
niversidad de Buenos A
ires on August 13, 2014
http://mbe.oxfordjournals.org/
Dow
nloaded from

ii
“NaiveIdea-MBE-25-06-14” — 2014/7/2 — 18:59 — page 12 — #13 ii
ii
ii
MBE
Shannon, C. 1948. A mathematical theory of
communication. ACM SIGMOBILE Mobile ComThe
Bell System Technical Journalputing and . . . , 27(July
1948): 379–423.
Shannon, C. E. and Weaver, W. 1949. The Mathematical
Theory of Communication, volume 27 of The
Mathematical Theory of Communication. University of
Illinois Press.
Smith, D. R. and Chapman, M. R. 2010. Economical
evolution: microbes reduce the synthetic cost of
extracellular proteins. mBio, 1(3).
Sokal, R. R. and Rohlf, F. J. 1995. Biometry: the principles
and practice of statistics in biological research. WH
Freeman.
Stadtman, E. R. 2006. Protein oxidation and aging. Free
radical research, 40(12): 1250–1258.
Ströher, E. and Millar, A. H. 2012. The biological roles of
glutaredoxins. Biochem J , 446(3): 333–348.
Subramanyam, M. B., Gnanamani, M., and
Ramachandran, S. 2006. Simple sequence proteins
in prokaryotic proteomes. BMC genomics, 7: 141.
Swire, J. 2007. Selection on synthesis cost affects
interprotein amino acid usage in all three domains of
life. Journal of molecular evolution, 64(5): 558–571.
Tekaia, F. and Yeramian, E. 2006. Evolution of proteomes:
fundamental signatures and global trends in amino acid
compositions. BMC genomics, 7: 307.
The UniProt Consortium 2013. Update on activities at the
Universal Protein Resource (UniProt) in 2013. Nucleic
acids research, 41(Database issue): D43–7.
Wang, M., Weiss, M., Simonovic, M., Haertinger, G.,
Schrimpf, S. P., Hengartner, M. O., and von Mering,
C. 2012. PaxDb, a Database of Protein Abundance
Averages Across All Three Domains of Life. Molecular
& Cellular Proteomics, 11(8): 492–500.
Weiss, O., Jiménez-Montaño, M. A., and Herzel, H. 2000.
Information content of protein sequences. Journal of
theoretical biology , 206(3): 379–386.
Wolynes, P. 1997. As simple as can be? Nature Structural
& Molecular Biology , 4: 871–874.
12
at Sistema de B
ibliotecas y de Información U
niversidad de Buenos A
ires on August 13, 2014
http://mbe.oxfordjournals.org/
Dow
nloaded from

ii
“NaiveIdea-MBE-25-06-14” — 2014/7/2 — 18:59 — page 13 — #14 ii
ii
ii
MBE
ln (
% a
bu
nd
an
ce, o
bse
rve
d)
0 20 40 60 80
–1
0
1
2
3
r −0.52
A
0 20 40 60 80
–1
0
1
2
3
r −0.62
D
Cost (ATP)
–1 0 1 2 3
–1
0
1
2
3
r 0.71
C
–1 0 1 2 3
–1
0
1
2
3
r 0.62
F
ln (% abundance, expected)
0 300 600 900
–1
0
1
2
3
r −0.86
B
0 300 600 900
–1
0
1
2
3
r −0.91
E
Cost (ATP/time)
FIG. 1. Correlation of the logarithm of amino acid relative abundances in proteomes with metabolic cost in units of ATPmolecules per amino acid molecule (panels A and D), with metabolic cost in units of ATP molecules per amino acid moleculecorrected by amino acid decay (panels B and E) and with the genetic code model (panels C and F). Panels A, B and Ccorrespond to Dataset DS1, panels D, E and F correspond to Dataset DS2. Data points for the amino acid cysteine areshown as empty symbols, the rest of the amino acids are shown as black symbols. The lines are RMA regressions to all datapoints.
0.2 0.3 0.4 0.5 0.6 0.7–1.0
–0.8
–0.6
–0.4
–0.2
rcost(ATP)linear
rcost(ATP)log
rcost(ATP/time)linear
rcost(ATP/time)log
−rgenetic code
0.2 0.3 0.4 0.5 0.6 0.7–1.0
–0.8
–0.6
–0.4
–0.2
Pears
on’s
corr
ela
tion c
oeffic
ient r
Genomic GC content
A
B
Model evaluated
FIG. 2. Correlation of amino acid relative abundances in proteomes with metabolic cost in units of ATP molecules peramino acid molecule (black line: plain abundances; blue line: logarithm of the abundances), with metabolic cost in units ofATP molecules per amino acid molecule corrected by amino acid decay (red line: plain abundances; green line: logarithm ofthe abundances) and with the genetic code model (dashed line). Panel A corresponds to Dataset DS1, panels B correspondsto Dataset DS2. The data are shown as a function of genomic GC content in the x axis.
13
at Sistema de B
ibliotecas y de Información U
niversidad de Buenos A
ires on August 13, 2014
http://mbe.oxfordjournals.org/
Dow
nloaded from
ii
“NaiveIdea-MBE-25-06-14” — 2014/7/2 — 18:59 — page 14 — #15 ii
ii
ii
MBE
0.2 0.4 0.6
0.30
0.35
0.40
0.45
Genomic GC content
Cos
t (∑
p ie i
m)
0.2 0.4 0.62.50
2.75
3.00
10110
10115
10120
10125
10130
Genomic GC content
Entro
py
Num
ber o
f pro
babl
e se
quen
ces
of le
ngth
100
0.2 0.4 0.62.00
2.20
2.40
2.60
Genomic GC content
Targ
et fu
nctio
n
Cost (∑pieim)
Entro
py
Num
ber o
f pro
babl
e se
quen
ces
of le
ngth
100
0.30 0.35 0.40 0.452.50
2.75
3.00
10110
10115
10120
10125
101302.7
2.12.2
2.3
2.4
2.5
2.6
A B
DC
FIG. 3. Trade-off between amino acid metabolic cost and proteome sequence diversity. (A) Genomic GC content dependenceof the average metabolic cost per amino acid. (B) Genomic GC content dependence of the proteome entropy. (C) GenomicGC content dependence of the target function f . (D) Trade-off between amino acid metabolic cost (x-axis) and proteomesequence diversity measured as entropy (y-axis). The contour lines indicate the value for the target function, and the trianglescorrespond to the trade-off model using the values of m for DS1 and DS2 from Figure 1B and 1E. All panels display the 107organisms in Dataset DS1 (white symbols), the 17 organisms in Dataset DS2 (black symbols) and the genetic code model(red symbols). Panel D includes genomic GC contents between 0.15 (lower right corner) and 0.75 (lower left corner). The
y-axis legend to the right of panels B and D illustrates the number of probable peptide chains of length 100 given by e100h,where h is the entropy (Shannon, 1948; Shannon and Weaver, 1949).
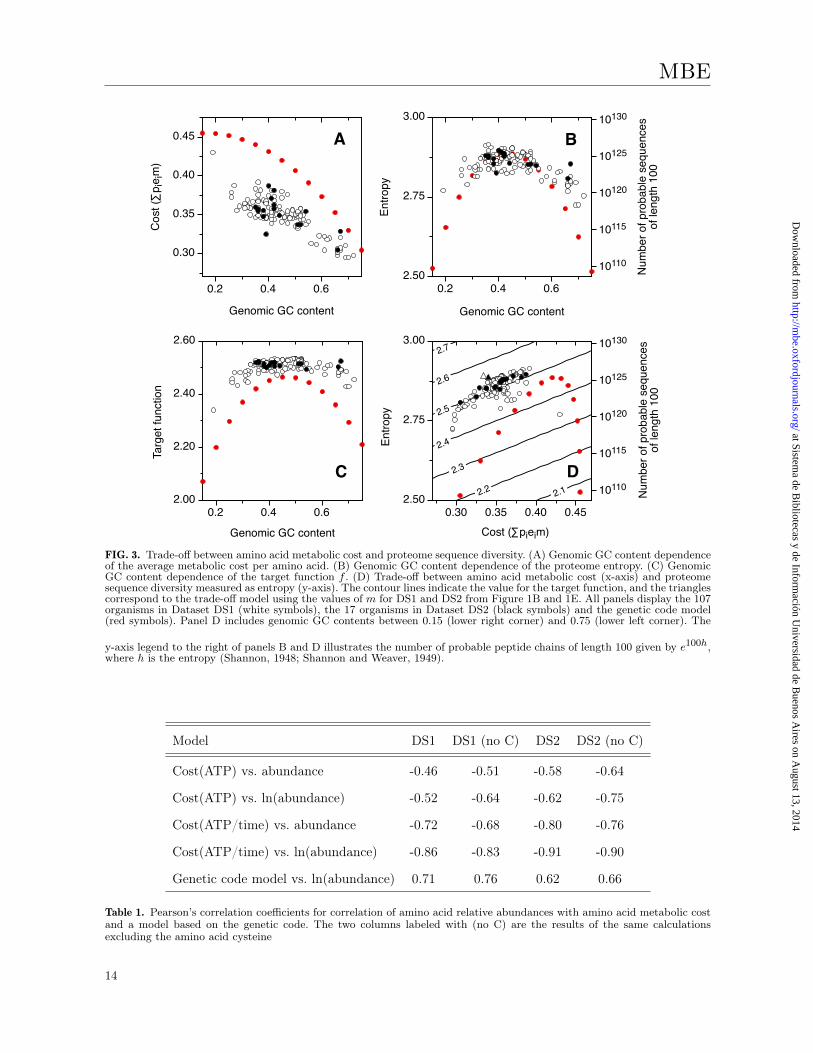
Model DS1 DS1 (no C) DS2 DS2 (no C)
Cost(ATP) vs. abundance -0.46 -0.51 -0.58 -0.64
Cost(ATP) vs. ln(abundance) -0.52 -0.64 -0.62 -0.75
Cost(ATP/time) vs. abundance -0.72 -0.68 -0.80 -0.76
Cost(ATP/time) vs. ln(abundance) -0.86 -0.83 -0.91 -0.90
Genetic code model vs. ln(abundance) 0.71 0.76 0.62 0.66
Table 1. Pearson’s correlation coefficients for correlation of amino acid relative abundances with amino acid metabolic costand a model based on the genetic code. The two columns labeled with (no C) are the results of the same calculationsexcluding the amino acid cysteine
14
at Sistema de B
ibliotecas y de Información U
niversidad de Buenos A
ires on August 13, 2014
http://mbe.oxfordjournals.org/
Dow
nloaded from

ii
“NaiveIdea-MBE-25-06-14” — 2014/7/2 — 18:59 — page 15 — #16 ii
ii
ii
MBE
Amino Cost Decay Cost
acid (ATP) (1/time) (ATP/time)
A 11.7 1 12
C 24.7 30 741
D 12.7 9 114
E 15.3 5 77
F 52 4 208
G 11.7 1 12
H 38.3 14 536
I 32.3 2 65
K 30.3 8 242
L 27.3 2 55
M 34.3 13 446
N 14.7 10 147
P 20.3 3 61
Q 16.3 8 130
R 27.3 4 109
S 11.7 6 70
T 18.7 6 112
V 23.3 2 47
W 74.3 12 892
Y 50 7 350
Table 2. Amino acid metabolic cost. Costs in units of ATP molecules per amino acid molecule are from (Akashi and Gojobori,2002), costs in units of ATP molecules per amino acid molecule corrected by amino acid decay are from this work. Theestimation of amino acid reactivity and decay rates (in relative units) is described in the supplementary material
15
at Sistema de B
ibliotecas y de Información U
niversidad de Buenos A
ires on August 13, 2014
http://mbe.oxfordjournals.org/
Dow
nloaded from