does democracy moderate resource-induced conflicts? · pdf filedoes democracy moderate...
TRANSCRIPT
Does Democracy Moderate Resource-inducedConflicts?
Thiemo Fetzer and Stephan Kyburz∗
August 18, 2017
Abstract
Can institutionalized transfers of natural resource rents to lower levels of
government be a source of civil conflict? Can democratic institutions limit
the link between resource rents and civil conflict? This paper brings together
these two questions by exploiting within country variation in disbursements
of oil revenue to subnational governments that are located far away from
the actual physical location of the natural resource. We combine novel rich
micro data on these exogenously determined transfers with novel data on
local democratic institutions in Nigeria to make three contributions. First,
we establish the existence of a strong relationship between institutionalized
resource rents and conflict. Second, we find that this conflict is highly institu-
tionalized centering around political militias. Third, we find that elections at
the local level significantly reduce the pass between positive shocks to natural
resource rents and civil conflict. These findings are confirmed using detailed
individual level micro-surveys.
Keywords: conflict, natural resource rents, political economy, commodity prices
JEL Codes: Q33, O13, N52, R11, L71
∗We would like to thank Ethan Bueno de Mesquita, Chris Blattman, Oeindrilla Dube, JamesFenske, Luis Martinez, Oliver Vanden Eynde, Austin Wright and seminar audience at ChicagoHarris School, University of Warwick and LSE for comments.
1
1 Introduction
Do large windfalls of oil revenue disrupt democratic institutions and lead politicalgroups to take up arms trying to cling to power forcibly? And can democraticallyelected governments moderate the risk of violent clashes between political fac-tions in the event of large oil revenue shocks? These are central questions in thestudy of the natural resource curse. Large oil shocks are believed to be detrimen-tal to democratic institutions as they may corrupt and potentially disrupt formalpolitical processes. The desire to control windfalls of resource revenues affectsthe contest for power and gives politicians incentives to employ thugs and formarmed militias to intimidate opposition forces and voters and secure their accessto the remunerative treasury. Although there is an extensive literature on theresource curse, our knowledge on how resource revenues affect government in-stitutions, in particular at the subnational level, is still limited. In this paper, westudy two related questions.
Is natural resource-induced conflict concentrated around the physical local ofthe natural resource? This is the maintained assumption implicit to many papersstudying how natural resources and their associated rents drive civil conflict (e.g.Lujala, 2010; Caselli et al., 2015; Berman et al., 2017). In this paper, we show thatan institutionally formalized sharing of natural resource rents to other levels ofgovernment is a major driver of civil conflict in Nigeria. Our findings suggestthat this institutionalized redistribution of natural resource rents may account fora significant share of civil conflict casualties in Nigeria. Our research design andcontext allows us to fully abstract from conflict that may be directly due to contestover the physical source of the natural resource wealth. This is an important distinc-tion as most of the existing literature focus on resource-induced civil conflict nearthe physical source of rents: Dube and Vargas (2013) focus on oil producing ver-sus coffee producing municipalities in Colombia, de la Sierra (2015) studies coltanand gold mining regions in Congo, while Berman et al. (2017) study conflict inAfrica at a fine spatial resolution around grid cells with mining activity.1 Our re-sults indicate that natural resource rents drive civil conflict in places far away fromthe physical location of the actual resource. We further show that the conflict is
1See Bazzi and Blattman (2014) for an overview of the literature exploiting commodity priceshocks and Blattman and Miguel (2010) for a review of the literature on civil war.
2
highly institutionalized involving political militia groups that fight over the dis-tribution of the resource rents. This has several important implications: first, wepoint to an important source of heterogeneity suggesting that resource-inducedcivil conflict can take quite a different form and structure, depending on the ex-tent to which natural resource rents may be institutionally shared. Second, it hasimplications for the wider literature that studies the relationship between naturalresources and conflict: the implicit spillovers that any form of institutionalizednatural resource revenue sharing creates is a threat to the non-interference identi-fying assumptions inherent to difference-in-difference estimation designs typicalin this literature. Nigeria’s institutionalized oil revenue sharing is – by far– notan exception: across Africa, twelve resource rich countries have formal revenuesharing schemes in place.2
Can institutions pacify the contest taking place over the natural resource rents?This is the second question that we study, focusing on a very specific institution:democratic elections of local governments. Our setting in Nigeria allows us to ex-ploit within-country variation in the extent to which local government councilsare run by democratically elected councils as opposed to being run by appointedcommittees. This setup allows us to contrast the extent to which natural resourceshocks are causing conflict under these different institutional settings. Our cen-tral finding suggests that, in locations with elected local governments, shocks tothe natural resource rents cease to be associated with conflict between differentpolitical militia groups. We confirm these findings studying individual level mi-cro data capturing perceptions of violence, actual victimization as well as actualparticipation in violent activities.
This paper speaks to two strands of literature. The first studies the relation-ship between natural resources and conflict. Natural resources have long beensuspected and found to be a cause of conflict and low development.3 Early cross-
2This is by no means limited to the Nigerian case that we study: natural resource revenuesharing schemes exists in twelve African countries alone, see http://www.undp.org/content/
undp/en/home/blog/2016/9/10/Making-natural-resource-revenue-sharing-work.html.3A large literature studies the natural resource curse in terms of economic growth and devel-
opment. Some of the seminal papers that substantiated this strand of the literature are Sachs andWarner (1995), Sachs and Warner (1999), and Acemoglu et al. (2014). An overview over the topicis provided in Arezki et al. (2011). Caselli and Cunningham (2009) explore theoretically a numberof channels through which resource rents may alter the incentives of a politician to either inducegreater investment in public goods that favour growth or increase rent-seeking activities.
3
country studies that find a negative effect of resource wealth on conflict events areCollier and Hoeffler (1998) who find a non-monotonic relationship. Wealth in nat-ural resources initially increase the risk and duration of civil war, but reduces itwhen there is plenty. Bazzi and Blattman (2014) perform a systematic analysis ina long cross-country panel, exploiting variation in commodity price shocks. Theyfind, however, no effect of price shocks on the outbreak of new conflict or coups,and that rising oil and mineral prices are actually associated with shorter, lessintense conflicts. Besley and Persson (2011) present in a theoretical frameworkthat exogenous income, such as natural resource revenues or aid, increases thelikelihood of an economy to be in a repressive state or civil war, unless politicalinstitutions are consensual. Lei and Michaels (2014) show that discoveries of largeoil-fields around the world since 1946 was a major driver of conflict.
The seminal paper by Dube and Vargas (2013) is the first to exploit within-country variation in the incidence of commodity price shocks to identify thecausal mechanisms driving the civil conflict in Colombia. In similar spirit ? ex-plore how minerals fuel conflict across Africa. Exploiting exogenous variations inworld prices, they find a positive impact of mining on conflict at the local level.de la Sierra (2015) finds that when groups in Eastern Congo gain access to naturalresources, they try to protect their gains by building up monopolies of violenceand fiscal administration, to actually build the essential functions of a state aroundthe resource. The focus of most studies is thus on conflict around the point of ex-traction of natural resources. At or near the point of extraction, a whole range ofmechanisms could be driving conflict: direct contest over the physical control ofthe natural resource; looting and extortion of rents along transport routes; civilunrest and conflict due to grievances brought about by environmental degrada-tion, exploitation of workers and increases in inequality; forced migration due toexpropriations to access minerals; or more general changes in the size and com-position of the local population in mining areas with respect to ethnicity, age andgender.
In our study, we can abstract from these sources of conflict to focus explicitlyon the role of natural resource rents. We focus on institutionalized rents that areaccruing to local governments far away from the actual point of extraction of theresource. Conflicts occurring in non-oil areas can thus be traced back to the re-source wealth in distant areas of extraction – they are detached resource conflicts.
4
Andersen et al. (2016), as most studies, emphasize the location of oil fields as adeterminant of conflict. Yet, relevant for our study, they find that offshore oilincome accrues to the government and hence strengthens its capacity to counterrebellion. Onshore oil shocks in contrast, strengthen active rebel groups. Whilewe also include Nigerian oil states, we are able to discriminate between the twomechanisms. Interestingly, while supporting the association between resourcerents and violence, we find only institutionalized rents to significantly increaseconflict. Our study is thus complementary to the bulk of studies in this strandof the literature. For the case of Nigeria, we find that institutionalized rents dis-tributed according to a allocation formula, play a much bigger role in causingviolence, than direct resource rents at the point of extraction. The institutions thatregulate the distribution of resource rents seem to literally shape conflict.4
The second strand of literature studies the relationship between natural re-sources and institutions.5 Leite and Weidmann (1999) presented early theoreticaland empirical evidence that natural resources abundance increases rent-seekingactivities, depending on government policies and the prevailing bureaucratic con-centration. Mehlum et al. (2006) confirm that the quality of institutions is deci-sive for whether a country becomes a winner or loser through natural resourcewealth. In line with that argument, we can confirm that local government areaswith elected local council can resolve contests for resources more peacefully. Dea-con and Rode (2015) confirms the finding in the literature that resource windfallscan alter political institutions. A consistent picture drawn is the corruptive effectof resource rents. Vicente (2010) explores the oil discovery announcements in SaoTome and Principe (1997-1999) to assess the role of natural resources in determin-
4Other examples on the role of institutions shaping rents are Fetzer and Marden (2017), whoshow that institutions shape conflict over land resources in the Brazilian Amazon, where theestablishment of protected areas caused a marked drop in conflicts over land resources, sinceprotected areas de-facto limit incentives for squatters to contest unused idle land in hope to beawarded a tradable legal title. Similarly in the case of institutionalized rents, the political partieswho occupy the local governments can use these funds to finance their strategies to fend offopponents. In a similar vain, Vanden Eynde (2015) analyses the introduction of a 10% ad valoremtax on iron that substantially increased the royalty collection by affected states in India. He findsthat the royalty hike was followed by a significant intensification of state violence in those districtsthat contain deposits of iron ore, as the government tries to counter any insurgent movements.
5The institutional aspect of the natural resource curse has been reviewed extensively in Ross(2015), usually referred to as political resource curse. The main conclusion of his review is thatnatural resources make authoritarian regimes more durable, increase certain types of corruption,and help trigger violent conflict in low- and middle-income countries.
5
ing corruption. They find evidence of corruption in sectors vital to the country’spolitical elite, such as increased vote buying, and the handing out of scholarshipsto specific groups. Knutsen et al. (2016) investigates how mining affects local levelcorruption using a large collection of Afrobarometer surveys. They find that inmining regions, additional income due to mining incentivizes and enables localofficials to request more bribes. Brollo et al. (2013) study a form of institutionalrents similar to the rents implied by the oil revenue sharing principle in Nigeria.Using a regression discontinuity design based on distinct population cutoffs ina federal transfer schedule, they show (similar to Carreri and Dube, 2017 ), thatincreased rents increase observed corruption and reduce the quality of candidatesfor political office. Asher and Novosad (2016) confirm this finding by presentingevidence for India that local mineral wealth shocks lead to the election of crimi-nal politicians, and that politicians commit more crimes and accumulate greaterwealth during their term in office.
We contribute to that literature by showing local elected governments mod-erate the adverse effects of large resource shocks by reducing grievances and therisk of conflict. Most closely related to our paper is Carreri and Dube (2017).They study how how oil price shocks shocks affect who is gaining power inoil-producing municipalities in Colombia. Their central finding is that positiveoil price shocks increase the likelihood that politicians affiliated with paramili-tary groups win office in oil-producing municipalities. They indirectly argue thatthese politicians are using force to gain power, as evidenced by rising paramilitaryviolence, and reduce electoral competition.
Our study differs in several central aspects from the existing literature. First,by exploiting variation in the type of political regime, we are able to shed light onwhether natural resource rents contribute to conflict under different institutionalregimes (democratically elected vs appointed local administrators). Gaining elec-toral victory in Carreri and Dube (2017) implies the control of both: the under-lying point resource as well as gaining control over the (allocation of) accruingrents. If gaining control over the natural resource has distinct effects on conflictdynamics, as for example argued in Andersen et al. (2016), then it seems impor-tant to separate out the (potential) differential effects. Due to the concentration ofthe oil wealth in only a few states (and to some extent offshore), we are able toconcentrate on the distinct channels through which natural resource rents affect
6
conflict dynamics in parts of the country that are far away from the actual loca-tion of the natural resources. This has implications for the nature and structureof conflict as political groups that attempt to use violence to gain access to thenatural resource rents have limited incentives to encourage secession, as this mayentail loosing any access to the natural resource wealth that is located elsewhere.
We analyse the impacts of resource revenues and local democratic institutionson conflict in Nigeria. Although Nigeria is often mentioned as disastrous examplein the resource curse literature, there are few convincing studies that disentanglethe underlying mechanisms.6 Our study is one of the first to comprehensiblyanalyse local democratic institutions and its role in managing resource revenues,and increasing or reducing violence. As local governments are democraticallyelected only in a fraction of Nigerian states, and appointed as so-called caretakercommittees in many other cases, we use a within country de-facto variation inlocal democratic institutions, to examine its effect on conflict in cases of smalland large oil revenue shocks.7 As secession is not an option for non oil-producingstates, we can also rule out secessionist conflicts, and focus on the localized contestfor institutionalized resource rents.
We harness novel data on oil revenue allocations and local government councilelections in Nigeria in order to analyse the local political resource curse. We usemonthly data on tax revenue disbursements from the Federation Account to mea-sure oil revenue shocks. Our data on local democratic institutions is assembledby conducting a media content analysis of major Nigerian newspaper articles.8
By extracting information on local council elections and the appointment of care-
6A few paper analyze the natural resource curse in Nigeria, which is often referred to as a primeexample. Sala-i Martin and Subramanian (2013) suggest that Nigeria’s the quality of institutionsare negatively affected by the oil wealth, having a detrimental effect on long-run growth. WorldBank (2014) describes a similar line of argument. Collier et al. (2008) provides policy advice onhow Nigeria could escape the resource curse. A more historic account of oil wealth and violenceis given by Azam (2009). Collier and Vicente (2014) examined how voter intimidation is effectivein reducing voter turnout. Fenske and Zurimendi (2015) provides further evidence on the long-run effects the oil resources. Oil prices experienced in early childhood affect ethnic groups in thenorth differently from the south, such as reduced fertility, delayed marriage, higher probabilitiesof working and having a skilled occupation, and greater schooling.
7Most of the existing literature either focuses on cross-country variation in democratic institu-tions (see Ross, 2015 for a review of the literature) or on the effect of local resource rents on thequality of institutions (references).
8The data on local government council elections and appointment of caretaker committee wasfirst employed and presented in Kyburz (2017).
7
taker committees, we can measure some degree of local democratic institutions ineach of the 774 local government areas over the whole study period 1999 to 2014.We combine this data with geo-referenced conflict data provided by the ACLEDproject to have an accurate measure of political violence, oil revenue shocks, andlocal democratic institutions at a fine-grained geographic level.
We present two main sets of results using a two-stage instrumental variablesdifference-in-differences estimation. First, since the tax revenue allocations followa strict rule, we can demonstrate that almost all of the variation of allocationsover time are caused by exogenous changes in global oil prices. We then showthat these changes in global oil prices and subsequent revenue windfalls to localgovernments significantly causes the contest for the resources to intensify, leadingto more local violence. Importantly, we highlight that the civil conflict is primar-ily happening in areas that do not see any natural resource extraction. Rather,violence can be attributed to the sharing of natural resource rents due to Nige-ria’s system of fiscal federalism. A 1 standard deviation increase in the allocatedresources increases conflict incidence by up to 100%. The results are not drivenby the choice of the temporal resolution of the data, the functional form or thespecific dependent variable capturing the extent of conflict. Besides civil conflictbeing highly institutionalized, it involves mainly the military and in particular,political militias, that mobilize citizens to contest for the natural resource rents.
Second, we study whether local elections can reduce the natural resource rentsinduced civil conflict. The question is whether by having elected local council im-proves accountability to the citizens, which again may decrease grievances due tothe redistribution of rents.9 If people feel better represented, this possibly easestensions among constituencies about the large windfalls of revenue allocations.Focusing on the interaction between oil revenue shocks and elected local gov-ernments, we present novel evidence suggesting that local democratic institutions
9A number of studies explore the effects of local democratic institutions on accountability andresponsiveness. Ayee (2008) investigate how decentralization affects governance, in particular howit may improve public accountability, reduce political instability, and impose incentive-compatiblelimit on government power. Bratton (2012) adds to that subject by focusing on political relation-ships between citizens and local governments in sub-Saharan Africa. Resorting to survey data ofthe Afrobarometer data, he finds that citizens regard local councils as weak institutions. Martinez-Bravo (2014) find that the introduction of local village elections in China increased public goodsexpenditure financed by villagers, caused a moderate decline in income inequality, and likelyreduced corruption.
8
indeed have a pacifying effect when oil shocks hit. The analysis suggests that elec-tions significantly weaken the relationship between resource rents and conflict. Itsupports the notion that democratic accountability, achieved through elections,reduces the ability of local politicians to misappropriate funds and use them touse force to repress political opposition.
Interestingly, positive oil revenue shocks affect communities with elected coun-cils differently than those with (autocratically) appointed committees. Our esti-mation of non-linear effects of oil revenue shocks suggest that with an appointedcaretaker committee, negative shocks are associated with less conflict, yet posi-tive shocks in resource rents increase conflict. With an elected local governmentin contrast, negative shocks also seem to reduce conflict, while positive shocksdo not lead to more conflict. These results are remarkable and strongly supportthe argument that elected councils are able to reduce tensions between politicalgroups fighting over the distribution of excess spoils.
Our main results are stable across a series of robustness tests. In case, militiaswould anticipate oil revenue allocations, they could act strategically by armingthemselves, which would bias our estimate. Therefore, we also we provide re-sults for hard to predict extraordinary allocations from the Excess Crude Account(ECA). We also remove local election related violence to abstract from violencethat is staged between political groups right before and after a local elections takeplace. Results also remain the same when using difference specifications, func-tional forms, and timing. Besides some further robustness exercises, we also showthat results are unchanged when using alternative conflict data.
We then proceed to strengthen our arguments using micro-level data from theAfrobarometer on public attitudes on democracy and governance. We are able tocorroborate our main findings by showing that shocks to natural resource rentsincrease respondents fear of being a victim of political violence, increase actualvictimization as well as increase the self-reported propensity of respondents to en-gage in violent acts. Most interestingly, having elected local government councilsweakens these associations.
If people’s grievances are resembled in distrust in democratic institutions andtheir governments and increase with resource rents in should be resembled in sur-vey responses. We do indeed find – although with slightly less statistical power– that higher resource rents flowing into local governments deteriorate approval
9
of local government councils, and also that the perceived levels of corruption in-crease with the availability of contestable rents. Furthermore, higher resourcerents also lower the trust in local government councils. More democratic regimesare to some extent able to moderate the negative influence of oil shocks on peo-ple’s perception of local democratic institutions.
The remainder of the paper is organized as follows. Section 2 provides back-ground information on the institutional setup in Nigeria and discusses the datasources used. Section 3 presents both the empirical strategy and the main results.Section 4 discusses the underlying mechanisms and supports our arguments andfindings using micro-data. Finally, section sec:conclusion concludes.
2 Context and a First Look at the Data
In this section, we describe the institutional context and present the main dataused in this paper. First, we explain what the main characteristics of Nigerian fis-cal federalism are and how local and state governments are mainly funded by oilrevenues. Second, we describe the role of local government council elections andhow we use Nigerian news media to collect data on the conduct of local electionsor appointment of caretaker committees by state governors. Third, we describethe geo-referenced data employed to measure violent events and how differentlocal political regimes may be associated with conflict. The data is assembled intoa balanced monthly-level panel at the local authority level for the whole of Nige-ria covering the time period between 1999 to 2014, more details are available inAppendix A.
2.1 Fiscal Federalism, Oil Revenues and Local Government Fi-
nance
Nigeria exhibits a system of fiscal federalism with rules defined in the NigerianConstitution (Federal Republic of Nigeria, 1999). The largest part of tax revenuesare paid into a centrally managed Consolidated Revenue Fund of the Federation.This federation account is mostly alimented from tax revenue on oil and value-added tax (VAT). Oil revenues comprised about 75% of of budgetary revenues inthe year 2013 and thus are highly influential for public finances at all government
10
levels (World Bank, 2013). The centrally collected tax revenues are then allocatedto the 3 tiers of government, the federal government, the states and the localgovernment councils according to a specific allocation formula by the FederationAccount Allocation Committee (FAAC) under the auspices of the Revenue Mo-bilisation Allocation and Fiscal Commission according to the Constitution of theFederal Republic of Nigeria (1999).10
Under the 1999 constitution, at least 13% percent of oil revenues must directlyflow back to the oil-producing states to account for their status. This rule is knownas the derivation principle (Federal Republic of Nigeria, 1999). Subsequently, thecollected tax revenues are divided by a vertical and horizontal allocation formula.The vertical allocation formula states that 52.68 percent of revenue allocationsare disbursed to the federal government, 26.72 percent to the state governmentsand the FCT (Abuja), and 20.60 percent to the local governments. The share ofrevenues that accrues to the state and local government councils, is then fur-ther divided according to a horizontal allocation formula that makes allowancefor geographic and socio-economic characteristics of the respective administra-tive unit. These geographic and socio-economic indicators of the formula are (i)equality 40%; (ii) population 30%; (iii) internal revenue generation Effort 10%; (iv)landmass and terrain 10%; (v) education 4%; (vi) health 3% (primary school enrol-ment); (vii) water supply 3% (rainfall).11 Figure 1 presents a map representing therevenue allocation index weight for each of the 774 local government areas. Table1 presents descriptive statistics for the various demographic and socio-economiccharacteristics comprising the allocation index weights calculated for each local
10The Revenue Mobilisation Allocation and Fiscal Commission is comprised of a chairman andone member from each state and the Federal Capital Territory, Abuja. The Federation AccountAllocation Committee is comprised of Federal Minister of Finance, representatives of each state(usually the states’ commissioners of Finance and their accountants-general), and representativesfrom fiscal and monetary related federal agencies such as the Central Bank, and the Customs andFederal Inland Revenue Services (Maystadt and Salihu, 2015).
11The landmass and terrain factor is further equally divided into one constant part for all localgovernment areas according to terrain conditions in the state (50% of 10%), and a second partmeasuring the size of the landmass of each local government area (50% of 10%). The internalrevenue generation effort is further divided into one part applying to each local governmentcouncil in each state equally (75% of 10%), and one part depending on the individual revenueeffort of each local government council (25% of 10%). The water supply factor is further equallydivided into an equality part applying to all local government councils equally in each state (50%of 3%), and territorial spread of rainfall depending on each local government area’s rainfall (50%of 3%).
11
government by the FAAC. Population and landmass are by far the most impor-tant factors when it comes to explaining the cross sectional variation in the overallindex. On the other hand, factors such as Equality, Terrain and Rainfall share donot vary across the country.
Data on monthly allocations and the index weights are published by the FAACof the Federal Ministry of Finance. We assemble the monthly allocation data to abalanced panel including all 774 local government areas for the period June 1999to July 2014.12 The information on the monthly allocations is communicated bythe Accountant-General of the Federation in Abuja each month.
Oil revenues that aliment the Federation Account depend both on the priceof crude oil and the magnitude of oil production. We obtain data on the crudeoil price from Thomson Reuters13 and data on the location of oil and gas fieldsfrom the Nigerian National Petroleum Corporation (NNPC) across Nigeria. Weconstruct a dummy that is equal to 1 in case a local government area is intersectingan oil field. This measure includes not only producing oil fields, but also fieldsthat are under exploration. In total 63 local government areas do have an oil orgas field.
The relevant variable to drive the variation behind changes in monthly allo-cations to local government areas appears to be the oil price. Table A3 in theappendix highlights that the amount of variation in the monthly levels of oil pro-duction is significantly smaller compared to the variation in monthly oil prices.Monthly Nigerian crude oil production varies around a mean of 2.32 million bar-rels with a standard deviation of 0.17 million barrels, while monthly oil pricesvary around a mean monthly price of USD 64.21 with a standard deviation ofUSD 34.97, suggesting that the bulk of the variation in allocations is due to pricevariation (as opposed to changes in quantity). This is relevant to the extent thatprevailing world oil prices are unaffected by Nigerian oil production.
Statutory and extraordinary allocations Federal allocations of oil revenues canbe roughly divided into two categories of disbursements. Statutory allocations arecalculated based on a benchmark price of oil determined for each year and are reg-
12The data was available on www.faac.gov.ng in April 2015. The website is currently not online(August 2017).
13We use the Brent Crude Oil Price extracted from Thomson Reuters Datastream.
12
ularly disbursed each month. In contrast, extraordinary allocations are disbursedirregularly and are based on idiosyncratic political decisions. Such augmentedallocations originate in most cases from the Excess Crude Account (ECA). TheECA, described in further detail in section A.1 in the appendix, is alimented byresource revenues that accrue due to the difference between the yearly benchmarkoil price and the actual crude oil market price. Table A1 in the appendix presentsa decomposition of within and between LGA variation for these different typesof allocations (overall, statutory, and extraordinary allocations). The within-LGAvariation clearly accounts for the major part of the overall variation for all threetypes.
States and local governments can raise internally generated revenues as well.Their ability and the extent to which they do is very limited. Almost 90 % of grossrevenues at local level is due to disbursements from the federation account in theperiod 2001–2005. Overall they raised less than 5% of gross revenues throughinternally generated means (average 2001–2005) (Eboh et al., 2006). This is notsurprising as tax powers available to local governments are limited to minor sub-jects, such as property tax and market and trading licences.14 The fiscal situationin particular for local governments is at the mercy of global oil prices (WorldBank, 2013).
Local government responsibilities According to the constitution (Federal Re-public of Nigeria, 1999), economic planning and development is in joint respon-sibility of state and local government councils. The constitution instructs localgovernments to form an economic planning board. While the local governmentsappear to be a tier of government that are an executing body for the state gov-ernments, they have indeed substantial autonomy. Most important, they are re-sponsible to provide primary education and primary health care services.15 Local
14A full list of tax powers is provided in Ekpo and Englama (2008).15According to Khemani (2006), the real responsibility of providing education and health care
services is indeed delegated to local governments, although the constitution puts the task inthe joint responsibility of state and local governments. An informative account of how localgovernment are de-facto responsible for providing education and health care services is given in(Albin-Lackey, 2007), in 5 case studies of local governments (Etche, Khana, Tai, Akuku/Toru, andObio/Akpor). A World Bank report describes in an insightful way how local governments canoutperform other local government areas if the local government council is active and willing toimplement progressive policies (see World Bank, 2002, p. 46).
13
governments should build and maintain the physical infrastructure of primaryhealth centres, payment of all staff salaries and ensuring the centres sufficientstock of medicines and other resources. With regard to education, local govern-ments bear the responsibility to execute government education policies and torun primary schools on a daily basis (for further details see Albin-Lackey, 2007).Further responsibilities include such diverse tasks as the provision of adult andvocational education, and the development of agriculture and natural resources(other than the exploitation).16 Overall, the local governments play a prominentrole in providing public goods that are important in the citizens everyday life.The absence of a functioning local government may thus create grievances amongthe local population and lower its trust in institutions.
Local government finance management With the transition to democratic rulein 1999, the Nigerian fiscal system was decentralized rapidly. According to aWorld Bank report, the share of sub-national budget spending in the consolidatedbudget increased from 23% in 1999 to 46% in 2005 (World Bank, 2007). The sub-national budget expenditure already was almost four times higher in 2005 thanin 1999 in real terms, while the expenditure at the local level in fact grew evenfaster than at the state level, so that sub-national budget systems have becomemore decentralized. This followed a stricter implementation of federal allocationsthan in the 1990s.
Various reports and newspaper articles describe the mismanagement of publicfinances at the local level. Human Rights Watch conducted a detailed analysis oflocal government finances and how they are managed with a specific focus onexpenditures for education and health care (Albin-Lackey, 2007). According tothe report, the local government councils (LGCs) treat the budgets and financialreports as closely guarded secrets. To keep local politicians accountable on budgetissues may, therefore, be a difficult task.
While citizens at the local level observe that local government council mem-
16The local government council further makes recommendations to the State commission oneconomic planning on diverse issues such as the construction and maintenance of roads, streets,street lightings, drains, the provision and maintenance of public conveniences, sewage and refusedisposal, the control and regulation of shops, kiosks, restaurants, bakeries, and other places forthe sale of food, and the licensing, regulation, and control of the sale of liquor (Federal Republicof Nigeria, 1999).
14
bers enrich themselves, the provision of health care and education is miserable.According to a civil society organization in Port Harcourt17, the local governmentchairs have no objectives other than getting paid to do nothing. Except for pay-ing salaries, the local governments have ceased to perform any duties assignedto them. Some local government chairmen apparently do not even reside in theirlocal governments, but only come back to pay out salaries and to distribute theremainder of the monthly allocations as patronage. While there are few positiveaccounts of local finance management, the overall assessment is usually ratherdevastating. An official of the Federal Economic and Financial Crimes Commis-sion stated: “To say that [local government] everywhere is a disaster is not a fairassessment, but it is not far from the truth.” (Albin-Lackey, 2007, p.25).18
By Rivers State law, the legislative body in each local government is to approveor vote down annual budgets presented by the chairperson of the LGC. Legisla-tive councils are also entitled to review the end-of-year expenditure reports thatare submitted by the chair. This check on the chairperson’s handling of local bud-gets – although theoretically important – ended up being an opportunity for localcouncils members to ask for bribes, as a device for self-enrichment, in return forpassing the budget. Many local councillors see the budget process as the best op-portunity to claim their share of the allocated revenues. Once the councillors gottheir requested share of the pie, the chairmen are left free and unconstrained tospend the remaining allocations according to their preferences and not accountedin the budget process (Albin-Lackey, 2007).
Substantial revenues are declared in the local budget process for projects thatare never properly implemented or are even non-existent. One local governmentchairman in Rivers State spent huge sums on e.g. a “demonstration fish pond”that was never operational and payment of more than 100 “functional commit-tee/protocol officers” whose responsibilities were entirely unclear (Albin-Lackey,2007). According to the newspaper Daily Champion, in Oshimili local governmentarea, N 2 million were apparently spent on erosion control, yet there was no visi-
17Port Harcourt is the capital and largest city in Rivers State.18A positive example in the use of increased local public finances is Tai LGC. According to
Human Rights Watch, Tai LGC used the allocated revenues to implement numerous projects suchas renovating schools, building new classroom blocks, and constructed 7 new health care centres.The Tai LGC compiled a list of all projects undertaken and also made it public. Many of theprojects were undertaken at the request of the communities within the local government (Albin-Lackey, 2007, p.27).
15
ble sign of such a project. Another example of very poor budget implementationis Warri South local government, where millions of Naira have been allocatedto landscaping the chairman’s house, construction/renovation of market stalls,the purchase of generator transformers, the provision of a solar water scheme,the construction of drains/culverts, the maintenance of parks and gardens, theconstruction of motor parks in selected towns, and the construction of televisionviewing centres. Yet, none of these projects were actually implemented.19 Theseexamples of the local public finance management provide both an insight into thevariety of projects that are budgeted and the poor implementation in many cases.Although these are just examples, they represent larger inefficiencies of publicfinance management at the local level, as described in detail in (Albin-Lackey,2007).
Since local government councils failed to pay out teachers’ salaries, the fed-eral government has stripped local governments of their responsibility for payingprimary school teachers salaries by deducting the money to pay their salaries atsource. This failure to pay salaries, is another example of the poor public financemanagement at the local level (Albin-Lackey, 2007, p. 13). It is also reportedthat in LGCs in Rivers State, salaries for public sector workers are routinely with-held while the funds that were set aside to pay them disappear. In other localgovernments, it is alleged that non existent workers are on the payroll of localgovernments (Albin-Lackey, 2007, p. 34).
It becomes clear that local governments public finance management is poor,yet differs in capacity across LGAs. Because of the high volatility in oil prices, theflow of allocations into local accounts is both hard to predict and opens the flood-gates to misappropriate public funds. This brings us back to the main variationwe use in our empirical framework. As mentioned above and shown in Table A1,the within-LGA variation in allocations is considerable and driven by global oilprices (see Table A3). This high volatility makes the processes in public financemanagement, such as paying public servants’ salaries or providing public goods,difficult and non-transparent and calls for strong political factions to appropriateits share, using force if necessary.
19These accounts of poor public finance management can be in found in the newspaper TheDaily Champion, 22 June, 2007.
16
2.2 Violent Contest for Institutionalized Rents
The poor local governance and mismanagement or outright embezzlement ofpublic funds possibly creates grievances within the local population. Even moredisastrous, it may lead political groups to use force in order to contest for theirshare of the oil revenue pie. The contest for these institutionalized rents thatflow through local and state governments is a possible cause of low-intensity con-flict throughout Nigeria since all governments are benefitting from the allocationsfrom the Federation Account. The variation in conflict events across Nigeria thatwe use in our empirical analysis is displayed in Figure 3, indicating the numberof violent events for each of the 774 local government areas over the period 1999to 2014.
Data on civil conflict over the entire sample period are drawn from the PRIO /Uppsala Armed Conflict Location and Event Data Project (ACLED).20 The ACLEDproject provides details of geographic locations of conflict events, in terms of lati-tude and longitude, dates, and additional information on the actors involved. Inparticular, it codes the actions of rebels, governments, and militias within unsta-ble states, allowing an analysis of the local level factors and the dynamics of civiland communal conflict.
Nigeria is in a state of low-intensity conflict. Generally small scale violentevents cause numerous casualties each year. We propose that these kinds con-flicts are – to a large extent – contests between political factions for the controlover local governments. The control of local government councils brings withit the perks of the allocations from the Federation Account. While in some lo-cal government areas, the political contest for the institutionalized resource rentsmay work through peaceful means, in other cases the contest is likely to be foughtwith physical intimidation and force. Below we provide anecdotal evidence forthese low-intensity conflicts across Nigeria.
A case of such low-intensity conflict is reported in the newspaper This Dayabout violent incidences in Afikpo and Ivo Local Governments, Ebonyi State. Sev-eral cases of gross misconduct and abuse of local government officers triggeredoff protest, lead to the destruction of property and the murders of a prominent
20The ACLED conflict events data is available at https://www.acleddata.com/. Raleigh andDowd (2015) provide a detailed description of variables and coding methodology.
17
businessman, the Divisional Police Officer (DPO) in charge of Ivo local govern-ment and the vice principal of a secondary school. It finally developed into a“full-blown” conflict. The newspaper article also suggests that governing politi-cians should stop to use state resources and machinery to hound and intimidateperceived opponents (This Day, 18 September, 2001). The communal conflicts inEbonyi state continued, as reported by the newspaper Vanguard in October 2008.The newspaper described how the upsurge in violence between communities inthe state can be traced to the monthly allocations from the Federation Account(Vanguard, 28 October, 2008).
Further evidence of violence related to public misuse of funds is reportedby Human Rights Watch (2007) for Khana and Etche local governments, RiversState. In Khana, political opponents tried to remove the chairman from office, yetfailed, which again created an increased level of violence and insecurity. In 2006,opposition forces burnt down a part of the new local government secretariat in anight-time attack. The very public revolt has helped to cast light on the rampantgovernment malfeasance and its impact on the health and education sectors. Thechairman was accused of having channelled large sums of money into dubious ornon-existent projects and that he also passed some of that money on to thugs toenforce his will in Khana (Albin-Lackey, 2007).
In Etche local government, chairman Nwuzi was elected into office in 2004.By the end of 2005, local government councilor members charged him of mis-appropriating a large portion of what they called “huge monthly allocations tothe council”. Their grievances were also triggered by the alleged failure to paysalaries and other allowances that were due to them. Councillors also accused thechairman of using “thugs equipped with dangerous weapons” to intimidate theminto abandoning their request to get their share of the allocations paid into to localgovernments account in the first 18 months of the chairman’s office (Albin-Lackey,2007, p. 64).21
Even the Boko Haram conflict is reported to be related to local government
21According to the report by Human Rights Watch (Albin-Lackey, 2007), local councilors wereeven forced by thugs, also known as the chairman’s “boys”, to sign loyalty oaths to stop asking fortheir share of the accounts. Apparently, the local government chairman Nwuzi had to pay largeamounts of the monthly allocations to his political “godfather”, the Rivers State Commissioner forSport who helped him to win office. When the chairman had to flee after a heated confrontationwith local residents over the replacement of an electrical transformer, he apparently shot wildlyinto the crowd killing one person (Albin-Lackey, 2007, p. 65).
18
mismanagement by local observers. In an opinion article in the Daily Trust, KakaBolori writes how the Boko Haram violence is related to government mismanage-ment:
If one is to summarize the entire Boko Haram conflict, I can simply sayit is an organized crime between few aggrieved original Boko Harammembers and those who are in the helm of affairs of government. Inother words, the conflict is all about fraud, theft and embezzlementoccurring within or against the state, local governments’ finances andpeople of Borno. (Daily Trust, 15 December, 2015)
Overall, there is plenty of anecdotal evidence of violence related to the contestover resource rents disbursed to local governments as monthly allocations fromthe Federation Account. Violence is reported to be associated with the miscon-duct of local government chairmen and their failure to provide education andhealth services, mismanagement of local public finances such as omission of pay-ing salaries, or the embezzlement of public funds. The acts of fraud provokesviolent reactions by opposing political groups who want to claim their share ofthe pie.
2.3 The Role of Local Government Elections
Civil violence and riots are often related to elections, be they general elections orlocal government elections. Figure A3 in the appendix depicts a surge in violencearound local government council elections. The role of local elections with regardto civil violence is a priori unclear. Local elections may be a trigger event forviolence, when opposition parties feel that elections are not held in a free and fairmanner and fight for level playing field. The event of a local election may in thiscase be an opportunity for political factions to show their strength and supportby the people, using violent means if necessary.22 In this paper we mainly focus
22One of the worst violent outbreaks around a local government council election, reportedaround the World, was the clash between members of People’s Democratic Party (PDP) and mem-bers of the All Nigerian Peoples Party (ANPP) over a local election result in Jos city, Plateaustate. 761 people were killed, schools, churches and mosques burnt to the grounds in the post-election violence, as the PDP claimed their victory. The opposition probably realised that a defeatwould cut them off from the allocations for years to come. For further details, see BBC News, 29November 2008.
19
on the systematic violence that is not specifically related to elections, but happensthroughout the term periods of local politicians. As described earlier, we aimat determining whether having elected local government councils may reducethis low-intensity violence as citizens feel better represented and able to holdpoliticians accountable, so that grievances of constituencies are reduced.
The Nigerian Constitution of 1999 stipulates that local government councilsmust be elected by the people (Federal Republic of Nigeria, 1999). Even thoughthe federal structure of governance includes three tiers of government, the con-stitution gives the state governments considerable influence over the organisationand regulation of local government councils and holding local elections. The mainproblem with the constitutional provision guaranteeing local elected governmentsis that it treats them not enough rigorously as an independent tier of government.
In contrast to general elections which are conducted under the surveillanceof the Independent National Electoral Commission, State Independent ElectoralCommissions are appointed by the state government, a body to organise, under-take, and supervise local government elections. It consists of a chairman and noless than five but not more than seven other members (Federal Republic of Nige-ria, 1999). Furthermore, the state governor has to provide the financing for theconduct of local council elections so that local officials hinge on her intentionsand decisions.
After the first term of the initially elected local councils ended in May 2002,confusion emerged as the voter register was not updated to possibly hold anotherlocal election.23 In June 2002, most state governors appointed so-called caretakeror transition committees to (temporarily) run the local governments. Ever sincethat decisive moment in 2002 when caretaker committees were appointed, theelection of local governments became a political controversy.24 In the followingyears, the local government councils were in many cases not elected bodies ofgovernment anymore, but appointed bodies in many instances. This created de-facto variation in local political institutions across Nigeria. While some states,like Cross River or Enugu, local government council elections have been held
23The first local government elections were held in November/December 1998 as a test andpreparation for the presidential elections held in February 1999 that marked the transition fromthe military autocratic regime to a civil democratic regime.
24See Kyburz (2017) for a more detailed description of the controversy surrounding local gov-ernment council elections and the appointment of caretaker committees.
20
(almost) consistently throughout the period from 2004 to 2014, and hence weremore democratic in that sense, other states like Ondo or Yobe state had appointedcaretaker committees for the larger part of that same period. Figure 2 presents amap that presents the share of months with elected local government council inthe period 1999 to 2014.
We draw data on the conduct of local government council elections or ap-pointment of caretaker committees from a media content analysis using NigerianNewspapers, presented in more detail in Kyburz (2017). Since official informationon local councils is not available, we have to resort on media outlets, to gather aconsistent picture about local governance in the 774 local government areas. Thenewspaper articles are collected in the FACTIVA media data base.25 From localNigerian newspaper articles, we extract information on local government councilelections.26 By using a series of keywords, it is possible to determine for each ofthe 774 local government areas the date when local elections were held, the tenureof elected councils, and the periods when caretaker committees were appointed.
We use the de-facto variation in the ‘state of democracy’ at the local levelto analyze whether local elections have a pacifying effect on civil violence. Wecreate a dummy variable that measures for each month the election status of alocal government, hence whether a local council is elected by the people (Elected= 1) or appointed as caretaker committee by the state governor (Elected = 0).
Table A2 in the appendix presents a decomposition of the variance in theelection status dummy variable after controlling for different levels of fixed effects.The table shows clearly that once we control for state-by-time fixed effects, weabsorb most of the variation. So controlling for state-by-time fixed effects in ourmain regressions eliminates the independent level effect of elections as we controlfor it, and focus on the its interaction with the allocations. Table A3 presents adecomposition of the variation in the allocation variable, which suggests that theallocation rule is tightly followed. Since we are mainly concerned with electedlocal councils having a pacifying effect when local governments receive a large
25The FACTIVA media data base is a product by Dow Jones and contains news articles andinformation from over 9’000 international, national and regional news publications out of 152countries, including several Nigerian newspapers.
26Most information is extracted from Nigerian newspapers This Day/All Africa Global Media,Daily Champion/All Africa Global Media, Vanguard/All Africa Global Media, Daily Trust/All Africa GlobalMedia, and Daily Independent/All Africa Global Media.
21
shock in oil revenue allocations, we are most of all interested in the interaction ofthose variables (see our main specification in section 3.2).
3 Empirical Strategy and Results
This section presents the empirical strategy and the main results. We subdividethis section into two parts. First, we show that (institutionalized) natural-resourcerents are robustly associated with conflict. Second, we examine whether localgovernment council elections reduce resource-induced conflict.
3.1 Do natural-resource rents induce conflict?
We first study to what extent natural-resource rents induce conflict and providea full characterization of the nature of conflict, presenting the empirical strategyand the results for this part.
3.1.1 Empirical strategy
Our estimation strategy follows an instrumental variables estimation approachon a balanced (monthly) panel stretching from 1999 to 2014.27 Equation 1 isthe first stage equation that we estimate to explain the contestable rents that areflowing into a local government area. The central inputs to this formula is thevariable Index Weightj,2006, which captures a local authority area’s share in theoverall revenue allocation and is decomposed as presented in Table 1. The secondingredient is a measure of the Oil pricet. The oil price, as noted before, capturesthe bulk of the variation in overall oil revenues (as variation in the total quantityof oil produced is second order in comparison to the variation in the oil prices).As will become evident, instrumentation is not really needed as the first stage isextremely strong throughout.
27Appendix Table A4 highlights that the choice of the temporal resolution of the data does nothave a significant effect on the results. We prefer the monthly resolution as this allows us tozoom in with regard to the timing to address concerns that our estimates are affected by increasedconflict intensity around elections.
22
Allocjst = αj + π × Index Weightj,2006 ×Oil pricet + δst + x′jstβ + ε jst (1)
The second stage takes the instrumented allocations Allocationsjst as regres-sors, with a conflict measure yjst as dependent variable. In particular, the esti-mated specification becomes:
yjst = αj + γ× Allocjst + δst + x′jstβ + ε jst (2)
Throughout, we control for LGA-specific fixed effects, αj, and more impor-tantly state-by-time fixed effects, δst. The inclusion of state-by-time fixed effects isappealing for a range of reasons. First of all, states themselves participate in therevenue sharing and thus, controlling for state by time fixed effects flexibly con-trols for the extent to which resources flow into the state (as opposed to LGA’s).Secondly, they remove any state-specific non-linear trends in conflict.
Appendix Table A5 highlights that our results are robust to alternative modelspecification, in particular using models appropriate for count data (which makessense to do once the data is collapsed at the annual level).
The underlying identifying assumption for γ in specification 2 to representthe causal effect of natural resource rents on conflict is, that there is no other in-direct way by which the interaction between Index Weightj,2006 ×Oil pricet affectconflict directly by not going through the allocations. This would be a concern ifthere were other transfers or government schemes that are linked to the specificIndex Weightj,2006 used for the FAAC allocations. Alternatively, a concern wouldbe if oil price shocks had a further differential effect on, e.g. economic activity,in different locations that is not captured through the interaction with the FAACweight.
3.1.2 Results
The main results from this analysis are presented in Table 2. The table presents theOLS, the reduced form as well as the instrumental variable estimation exercise.As becomes clear from comparing the OLS and the IV results (Panel A and Crespectively), there is limited need for instrumenting in the first place since the
23
gross statutory allocations are nearly fully explained by the interaction term. Theweak-IV test statistic is far from any levels that would merit concern about theweakness of the instrument. This is not surprising as in Appendix Table A3, wesee that the R2 of the de-facto first stage reaches 98%. The specification withouttime and location fixed effects reaches an R2 of 86%, suggesting that the allocationrule is very closely followed.28
It also suggests that increasing more controls to this basic specification bearsthe risk of eliminating any residual variation in the allocation variable that wecan attribute to. Hence, in order to keep the presentation of the results suffi-ciently dense, in the remainder of the paper, we will concentrate on the simple IVspecifications without presenting the additional OLS and reduced forms.
The results suggest that the relationship between natural resource rents andconflict is large: a 1 standard deviation increase in the allocated resources in-creases conflict incidence by up to 100%. Appendix Tables A4, A5 and A6 high-light that the results are not driven by the choice of the temporal resolution of thedata, the functional form or the transformation of the dependent variable.
It is further important to highlight that the results are robust across differ-ent dependent variables, types of events and involved groups: civil conflict re-sponds strongly to the underlying contestable rents that flow into a LGA. Themain conflict-pair groups that are involved is conflict between the military andpolitical militia groups, as well as conflict between political militia and civilians.The suggested conflict dynamic is one whereby political militia groups find them-selves in conflict, targeting both civilians as well as the military.
No differential effect in oil producing areas We show that there are no hetero-geneous effects of natural resource rents on conflict in places that are producingoil vis-a-vis non oil producing areas. The results from this analysis are presentedin Table 3. There is only limited evidence of a slightly weaker relationship be-tween the natural resource rents and conflict in the actual areas that produce oil.Whether an area produces oil is measured either through a dummy indicatingthat an LGA is located in an oil producing state (Panel B) or by a dummy vari-able indicating whether an LGA has an actual oil field. This suggests that, if
28Panel B of Appendix Table A3 further highlights that quantity variation is second order com-pared to price variation.
24
anything, the relationship between natural resource rents and conflict, is strongerin areas that do not actually have any oil resources. This suggests that the con-flict we study is over the institutionally distributed natural resource rents and notprimarily a conflict over the control of the actual source of the natural resourcewealth.
3.2 Do Elections reduce natural resource rents-induced conflict?
We next turn to study the question whether elections can reduce the natural re-source rents induced civil conflict. For the purpose of our analysis, we are mostlyinterested in whether elections (and the associated democratic accountability) re-duces conflict that is associated with the natural resource rents. The focus thus isnot on whether elections themselves trigger conflict. In Appendix Table A2, wedecompose the variation in the elected status dummy that we use in our analysis.It becomes evident that the bulk of the variation (99.1%) is accounted for locationfixed effects and state-by-time fixed effects are included.
Thus we are effectively controlling for any (homogeneous) level effect thatelections can have on conflict. Our main estimating equation thus becomes
yjst = αj + δst + ν× Allocjst × Electedjst + γAllocjst + η × Electedjst + ε jst (3)
where we are particularly interested in the estimates of the coefficients γ rel-ative to the estimated coefficients ν. Our previous analysis suggested that γ > 0,indicating that positive shocks to the natural resource rents (in places far awayfrom the actual source of the rents), are positively associated with conflict. Ifdemocratic accountability, achieved through elections, reduces the ability of localpoliticians to misappropriate funds and use them to repress political opposition,then we would expect to see that the estimate ν is negative, i.e. ν < 0.
As before, we can estimate a version of the above specification using our in-strumental variables setup. The results from this analysis are presented in Table4. The analysis suggests that elections significantly weaken the relationship be-tween resource rents and conflict. Throughout, the estimated effect of the inter-action term between the natural resource rents and conflict, ν, is negative. This
25
suggests that the relationship between natural resource rents and civil conflictis significantly weaker in LGA’s with an elected (as opposed to appointed) localgovernment.
Non-linear effects What type of shocks are associated with increases in con-flict? Figure 4 highlights how elections moderate the relationship between re-source rents and various conflict measures, using quintiles of the allocations asmeasure of resource shock intensity for the subset of periods in which an LGA hasan elected vis-a-vis appointed local government.29 The results are striking: theleft column suggests that, with an appointed local government, there is a clearrelationship suggesting that negative shocks to resource rents are associated withless conflict, while positive shocks to the resource rents trigger conflict. The rightcolumn displays the same picture constructed based on the subset of LGA withelected local council. While negative shocks also seem to reduce conflict, positiverevenue shocks are not associated with more conflict. This results suggests thatelected local governments are indeed able to ease tensions around distributionaldisputes, and hence to reduce violence.
3.3 Robustness
Decomposing allocations variable Given the nature of the formula, rebel groupsmay form expectations over the expected allocations. This is particularly true withregard to the statutory allocations which are based on a crude oil benchmark thatis set out in the Nigerian budget at the beginning of the year. Naturally, thisbenchmark price is correlated with the actual oil price, but tends to be signifi-cantly lower compared to the spot price on the day the budget was passed. Thisputs a specific emphasis on the extraordinary allocations, which more clearlycome as surprise shocks to the available contestable rents in a local authorityarea. Appendix Tables A7 versus A13 show that we obtain very similar resultsfocusing only on the extraordinary allocations, while Appendix Tables A8 versus
29To be more precise. The figures are constructed by demeaning the conflict outcome as wellas the Gross Statutory allocations by the location and time fixed effects, subsetting the sampleinto two parts: one with elected and one with appointed local governments. The residuals of theallocations are subdivided into quintiles and we then estimate a simple specification using thequintiles as categorical right hand side measures. The resulting point estimates per quintile areplotted out.
26
A14 highlight that we obtain nevertheless fairly similar results when studyingexplicitly only the statutory allocations.
Removing election related conflict Elections may be associated with civil con-flict independent from the contest over the natural resource rents. The type ofconflict we study in this paper aims to separate the structural level of conflict thatis unrelated to elections as a method to transfer power, but due to the improve-ments in democratic accountability and civil society participation.
Appendix Figure A3 suggests that conflict is indeed happening right aroundelections. In order to remove any distorting effects that this type of conflict mayhave (which may or may not be related to the natural resource rents), we canremove the observations from the period right around the election dates and seewhether the results change in any systematic manner. We restrict the sampleusing symmetric time windows to only include observations that lie at least one,three and six months (Panel A - C respectively) before and after an election month.The results from this analysis are presented in Table 6.
If anything, the analysis suggests that our results on how elections transformthe relationship between resource rents and conflict become even sharper.
Alternative specifications, functional form sensitivity and timing AppendixTables highlight that our results are robust to alternative functional forms and al-ternative specifications. In particular, we show in Table A9 that we obtain similarresults focusing on coarser temporal resolution, Appendix Table A10 highlightsthat we obtain very similar results on different transformations of our dependentvariable, in particular using the counts, log value of counts per capita or levelsper capita as dependent variable, while Appendix Table A11 highlights that theresults are robust to different empirical models if we were to estimate the modelusing the count data nature.
Randomisation inference Throughout we cluster standard errors two-way byLGA and by time. An alternative approach to inference is to perform randomi-sation inference. We perform two types of randomisation inference. Figure A1presents the results of a permutation test, whereby the sequences of elected vs.
27
appointed local governments has been shuffled randomly across LGAs. The ker-nel density plots out the point estimate on the estimated interactions betweenthe (shuffled) election dummy and the gross statutory allocations. The red linecorresponds to the point estimate obtained using the true (non shuffled) electionstatus variable for the interaction term. It becomes evident that the point estimateon the interaction for the true election status variable is clearly outside the otherobserved realisations for the shuffled variable.
Figure A2 presents results from shuffling the election status variable at thestate level as opposed to the LGA level. This requires us to assign binary valuesin case there is variation within state with not all LGA’s within the state holdingthe same status. This affects 1,328 state by time observations out of the total 7,104observations. We assign election status as being 1, in case more than 50% of theLGAs in a state have an elected LGA at a point in time, while we assign a valueof zero otherwise. Despite this coarse treatment, which eliminates quite a bit ofvariation, we are able to reject the null of no effect at around the 5% level.
Controlling for governor specific LGA fixed effects As noted, state governorsplay a central role in the decision on whether to hold elections or not. Since stategovernors are also controlling significant fiscal resources, they may use these re-sources to affect political outcomes or conflict outcomes in way that is biasedtowards certain LGAs (Hodler and Raschky, 2014). We can control for this mech-anism by controlling for state governor specific LGA fixed effects. On average,every state has at least three governors over the whole sample period from 1999to 2014. This implies that we control for three separate LGA fixed effects that arespecific to each state governor in addition to controlling for state-by-time fixed ef-fects. It goes without saying that this is an extremely demanding specification asit absorbs a lot of the conflict variation on the left hand side, but more importantly,it leaves very little residual variation in the allocations variable to identify its ef-fect on conflict. As evidenced in Table 7, we loose quite some precision (whichis not surprising since some of the additional LGA fixed effects are likely to beirrelevant control variables, thus inflating standard errors), but nevertheless thesign pattern remains broadly consistent and some estimates retain their statisticalsignificance.
28
Controlling flexibly for FAAC formula weights The FAAC allocations are basedon a formula which define an LGA’s share of the mostly oil revenues accruingto the Nigerian federation. Conflict may be evolving distinctly in a way that iscorrelated with the different components of the overall index weight. We definedeciles of the individual components feeding into the overall formula and flexiblycontrol for the most important formula ingredients by interacting the respectivedecile with the simple time fixed effect.
We focus on the most important ingredients that drive the cross sectional vari-ation in the overall formula index weight (see the respective standard deviationsreported in Table 1): population, landmass and education. Note that includingthese decile fixed effects further eliminates a significant share of the residual vari-ation in the oil rents. A fully flexibly version that controls for each of the indexweight ingredients flexibly would de-facto leave no more residual variation in theallocation variable to be attributed to changes in conflict. It is worth highlight-ing that the population weight explains 88% of the variation in the total index,while landmass, the indicator with the highest absolute cross sectional standarddeviation to follow only explains 3%.
The results controlling for index weight decile specific time fixed effects forthe different index components in turn are presented in Table 5. It is reassuringthat throughout the coefficient, sign pattern and – in most part – the statisticalsignificance of the results remains unaffected.
Alternative conflict data The last set of robustness checks to perform is whetherwe obtain similar results when studying alternative conflict data. ACLED is themost comprehensive data source available covering civil conflict in Nigeria. Yet,there are (at least) two alternatives conflict datasets available that provide spatial-and temporal disaggregated conflict data: the Uppsala Conflict Data ProgramEvents Database (GED) and the Global Terrorism Database (GTD). In additionto not being as finely coded, the latter two databases contain significantly fewerevents compared to ACLED for Nigeria. Hence we prefer to work with ACLEDfor the main conflict results. Nevertheless, Appendix Table A12 presents the re-sults using the any event dummy and for the count number of events: throughout,we obtain very similar results, suggesting that the results are not specific to theunderlying source of data we use for our dependent variables measuring conflict.
29
4 Mechanisms
How do (democratic) elections reduce the link between natural resource rents andconflict? In order to shed light on this question, we draw on some survey datato build corroborating evidence. We proceed by showing that with individuallevel survey data we corroborate our findings from the previous sections: shocksto natural resource rents increase respondents fear of being a victim of politicalviolence, increase actual victimization as well increase the self-reported propen-sity of respondents to engage in violent acts. Elections in local government areasweaken these associations.
We then turn to further survey items to understand how elected councils mayreduce the grievances associated with (the distribution of) resource rents in alocal government area: democracy improves the perceived quality of local gover-nance. We proceed by briefly presenting the data construction and the empiricalapproach.
4.1 Data and Empirical Approach
Our analysis follows closely the one from the previous analysis, but needs tobe adapted in certain parts to account for the nature of the data. The data weuse comes from the Afrobarometer surveys, which have been carried out in fiverounds since 1999 across a total of 22 African countries. The survey modulescontain overarching survey questions that are asked across all countries. Respon-dents are sampled at a subnational level, though in the case of Nigeria, samplingis not representative at the LGA level. In total we have assembled the micro datafrom all the five rounds for Nigeria and matched the geocodes of respondents tothe respective LGAs to produce pseudo panels. In total we have survey data for17,618 respondents across the five rounds, though unfortunately not all questionsare consistently asked throughout.
We map survey questions that have sufficient balance across rounds in order tostudy the evolution of attitudes towards conflict over time, relative to the underly-ing election status of an LGA. The underlying survey is carried out in a respectivemonth and, in order to compute the size of the local natural resource rent shock,we compute the total rents accruing to a local government area in the last 6, 12
30
and 18 months respectively. In a similar fashion, we compute the average crudeoil price in over the last 6, 12 and 18 months to construct the reduced form andthe instrument.
We then estimate the following specification
yijst = αj + δt + ν× Allocjt × Electedjt + γAllocjt + εijt (4)
where now in addition the subindex i indicates an individual response and theAllocation variables are constructed as described above. The instrumental vari-ables specification follows the approach for instrumenting outlined in the previ-ous section, except that we use the average oil price over the time window priorto the respondents being surveyed.
4.2 Results
We first highlight that we obtain very similar results studying how electionschange the way natural resource rents translate into individual level actual aswell as fear of victimization, in addition to studying propensity to engage in vio-lence. We then aim to shed light on how democracy may address the underlyinggrievances that are manifested in the latent level of conflict.
Individual level violence The results are presented in Table 8 and a consis-tent image emerges: locally accruing natural resource rents increase individualfear of being a victim of political violence (columns 1 and 2), increase the actualvictimization (columns 3 and 4) and importantly, indicate that they increase thepropensity of individuals to engage in violent acts (columns 5 and 6). Once anLGA has an elected government, these associations are significantly weaker. Whatis a plausible mechanism by which natural resource rents, once administered bya democratically elected local government, cease to produce the types of socialtensions that translate into conflict? We explore a range of other survey questionsto shed light on this.
Grievances We first study grievances that the electorate may have, in partic-ular, we study to what extent citizens perceive the quality of local governance
31
and how resource rents affect the perceptions thereof. We focus on a range ofsurvey questions asking about the (perceived) quality of local government. Theresults are presented in Table 9. In particular, columns (1) and (2) highlight thatnatural resource rents are associated with a deterioration in the approval of localgovernment councils, while columns (3) and (4) indicate that perceived levels ofcorruption are increasing in the availability of contestable rents. Mirroring thatimage, there is a weak association between natural resource rents and distrust inthe LGC as an institution (columns 5 and 6).
While the sign pattern is consistent throughout, we do not always have enoughstatistical power for precise estimates. Yet, the overarching pattern suggests thatelections reduce the extent to which natural resource rents are associated withcorruption, suggesting that quality of governance over the natural resource rentsimproves.
In Appendix Table A17 we present a form of placebo test. Improvements ingovernance over natural resource rents in LGAs could be masking wider changesor improvements in political accountability and governance that go beyond thelocal institutions. In order to rule this out, we present the results when studyingrespondents perceptions of the perceived performance of a local area’s memberof parliament in the National Assembly. As expected, there are no associationsstanding out.
5 Conclusion
This paper provides empirical evidence of the effects of a plausibly exogenouschanges in locally accruing natural resource rents on civil conflict. We show thatinstitutionally warranted natural resource rents encourage civil conflict betweenpolitical groups and militias; we posit that contest is used as a method to putforth grievances and foster the agenda of social groups that are disenfranchisedfrom the political control over these rents. Transitions towards elected local gov-ernments significantly weakens the association between resource rents and civilconflict, suggesting that democratic elections can vastly reduce the grievances as-sociated with the distribution of natural resource rents.
32
References
Acemoglu, D., S. Naidu, P. Restrepo, and J. Robinson (2014). Democracy DoesCause Growth. MIT Department of Economics Working Paper 14-09, 80.
Albin-Lackey, C. (2007). Chop Fine: The Human Rights Impact of Local GovernmentCorruption and Mismanagement in Rivers State, Nigeria, Volume 19. Human RightsWatch.
Andersen, J. J., F. M. Nordvik, and A. Tesei (2016). Fighting Capacity and CivilConflict : Onshore versus Offshore Oil . pp. 1–30.
Arezki, R., T. Gylfason, and A. Sy (2011). Beyond the curse: policies to harness thepower of natural resources (1 ed.). Washington, DC: International Monetary Fund.
Asher, S. and P. Novosad (2016). Dirty Politics: Mining Booms and PoliticianBehavior in India. mimeo.
Ayee, J. R. A. (2008). Decentralization and governance in Ghana. Regional Devel-opment Dialogue 29(2), 34–52.
Azam, J. (2009). Betting on displacement: Oil, violence, and the switch to civilianrule in Nigeria. TSE Working Paper.
Bazzi, S. and C. Blattman (2014). Economic Shocks and Conflict: Evidence fromCommodity Prices. American Economic Journal: Macroeconomics 6(4), 1–38.
Berman, N., M. Couttenier, D. Rohner, and M. Thoenig (2017). This Mine is Mine!How Minerals Fuel Conflicts in Africa. American Economic Review 107(6), 1564–1610.
Besley, T. and T. Persson (2011). The Logic of Political Violence. The QuarterlyJournal of Economics 126(3), 1411–1445.
Blattman, C. and E. Miguel (2010). Civil War. Journal of Economic Literature 48(1),3–57.
Bratton, M. (2012). Citizen Perceptions of Local Government Responsiveness inSub-Saharan Africa. World Development 40(3), 516–527.
33
Brollo, F., T. Nannicini, R. Perotti, and G. Tabellini (2013, aug). The PoliticalResource Curse. American Economic Review 103(5), 1759–1796.
Carreri, M. and O. Dube (2017). Do Natural Resources Influence Who Comes toPower, and How? The Journal of Politics 79(2), 502–518.
Caselli, F. and T. Cunningham (2009). Leader behaviour and the natural resourcecurse. Oxford Economic Papers 61(4), 628–650.
Caselli, F., M. Morelli, and D. Rohner (2015, feb). The Geography of InterstateResource Wars. The Quarterly Journal of Economics 130(1), 267–315.
Central Bank of Nigeria (2012). The Sovereign Wealth Fund. UnderstandingMonetary Policy Series 18.
Collier, P. and A. Hoeffler (1998). On economic causes of civil war. Oxford EconomicPapers 50(4), 563–573.
Collier, P., C. Soludo, and C. Pattillo (2008). Economic policy options for a prosperousNigeria (1 ed.). Palgrave Macmillan.
Collier, P. and P. C. Vicente (2014). Votes and violence: Evidence from a fieldexperiment in Nigeria. Economic Journal 124(574), 327–355.
de la Sierra, R. S. (2015). On the Origin of States: Stationary Bandits and Taxationin Eastern Congo. mimeo, 1–74.
Deacon, R. T. and A. Rode (2015). Rent seeking and the resource curse. Companionto the Political Economy of Rent Seeking, 227–247.
Dube, O. and J. F. Vargas (2013). Commodity Price Shocks and Civil Conflict:Evidence from Colombia. The Review of Economic Studies 80(4), 1384–1421.
Eboh, E. C., U. Amakom, and M. Oduh (2006). Budget and public expenditureacross Nigerian states. Working Paper.
Ekpo, A. H. and A. Englama (2008). Fiscal federalism in Nigeria: Issues, chal-lenges and agenda for reform. In P. Collier, C. C. Soludo, and C. A. Pattillo(Eds.), Economic Policy Options for a Prosperous Nigeria, pp. 221–243. Springer.
34
Federal Republic of Nigeria (1999). The Constitution of the Federal Republic ofNigeria.
Fenske, J. and I. Zurimendi (2015). Oil and ethnic inequality in Nigeria. CSAEWorking Paper, 1–43.
Fetzer, T. and S. Marden (2017). Take what you can: property rights, contestabilityand conflict. The Economic Journal 127(601), 757–783.
Hodler, R. and P. A. Raschky (2014, mar). Regional Favoritism. The QuarterlyJournal of Economics 129(2), 995–1033.
Khemani, S. (2006). Local government accountability for health service deliveryin Nigeria. Journal of African Economies 15(2), 285–312.
Knutsen, C. H., A. Kotsadam, E. H. Olsen, and T. Wig (2016). Mining and LocalCorruption in Africa. American Journal of Political Science 00(0), 1–15.
Kyburz, S. (2017). Local Elections, State Capture, and Development in Nigeria: IsManna from Heaven Devilish?
Lei, Y. H. and G. Michaels (2014). Do giant oilfield discoveries fuel internal armedconflicts? Journal of Development Economics 110, 139–157.
Leite, C. A. and J. Weidmann (1999). Does Mother Nature Corrupt? NaturalResources, Corruption, and Economic Growth. IMF Working Paper 99/85.
Lujala, P. (2010, jan). The spoils of nature: Armed civil conflict and rebel accessto natural resources. Journal of Peace Research 47(1), 15–28.
Martinez-Bravo, M. (2014). The role of local officials in new democracies: Evi-dence from Indonesia. The American Economic Review 104(4), 1244–1287.
Maystadt, J.-F. and M. K. Salihu (2015). National or Political Cake? The PoliticalEconomy of Intergovernmental Transfers in Nigeria. Economics Working PaperSeries 2015/030, Lancaster University Management School.
Mehlum, H., K. Moene, and R. Torvik (2006). Institutions and the Resource Curse.The Economic Journal 116(2001), 1–20.
35
Nigeria Sovereign Investment Autority (2015). Annual Report 2015. Abuja, Nige-ria.
Raleigh, C. and C. Dowd (2015). Armed conflict location and event data project(ACLED) codebook.
Ross, M. L. (2015). What Have We Learned about the Resource Curse? AnnualReview of Political Science 18(1), 239–259.
Sachs, J. and A. Warner (1995). Natural resource abundance and economic growth.European Economic Review 3.
Sachs, J. D. and A. M. Warner (1999, jun). The big push, natural resource boomsand growth. Journal of Development Economics 59(1), 43–76.
Sala-i Martin, X. and A. Subramanian (2013). Addressing the natural resourcecurse: An illustration from Nigeria. Journal of African Economies 22(4), 570–615.
Vanden Eynde, O. (2015). Mining Royalties and Incentives for Security Opera-tions: Evidence from India’s Red Corridor. PSE Working Papers, 1–33.
Vicente, P. (2010). Does Oil Corrupt? Evidence from a Natural Experiment inWest Africa. Journal of Development Economics 92(1), 28–38.
World Bank (2002). State and Local Governance in Nigeria.
World Bank (2007). Nigeria – A Fiscal Agenda for Change. Public ExpenditureManagement and Financial Accountability Review (PEMFAR) Volume 2, 1–22.
World Bank (2013). Nigeria Economic Report. pp. 1–38.
World Bank (2014). Nigeria Economic report. World Bank 2(2), 1–23.
36
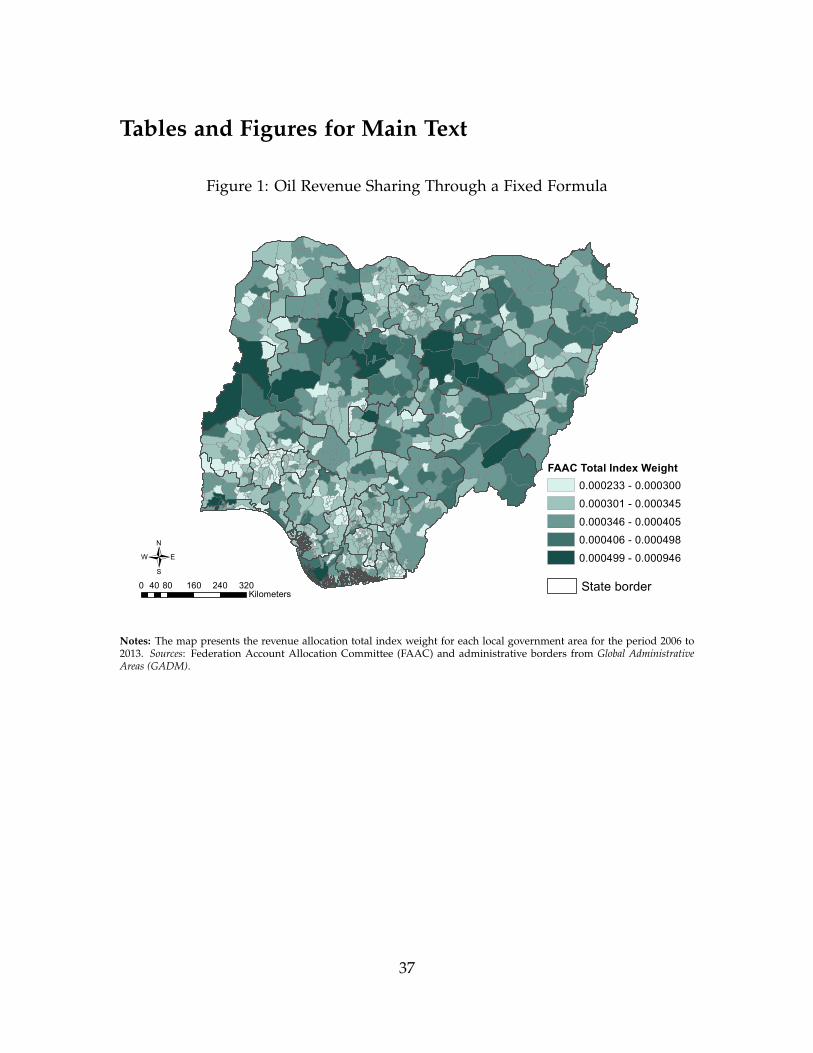
Tables and Figures for Main Text
Figure 1: Oil Revenue Sharing Through a Fixed Formula
FAAC Total Index Weight0.000233 - 0.0003000.000301 - 0.0003450.000346 - 0.0004050.000406 - 0.0004980.000499 - 0.000946
0 80 160 240 32040Kilometers
/State border
Notes: The map presents the revenue allocation total index weight for each local government area for the period 2006 to2013. Sources: Federation Account Allocation Committee (FAAC) and administrative borders from Global AdministrativeAreas (GADM).
37
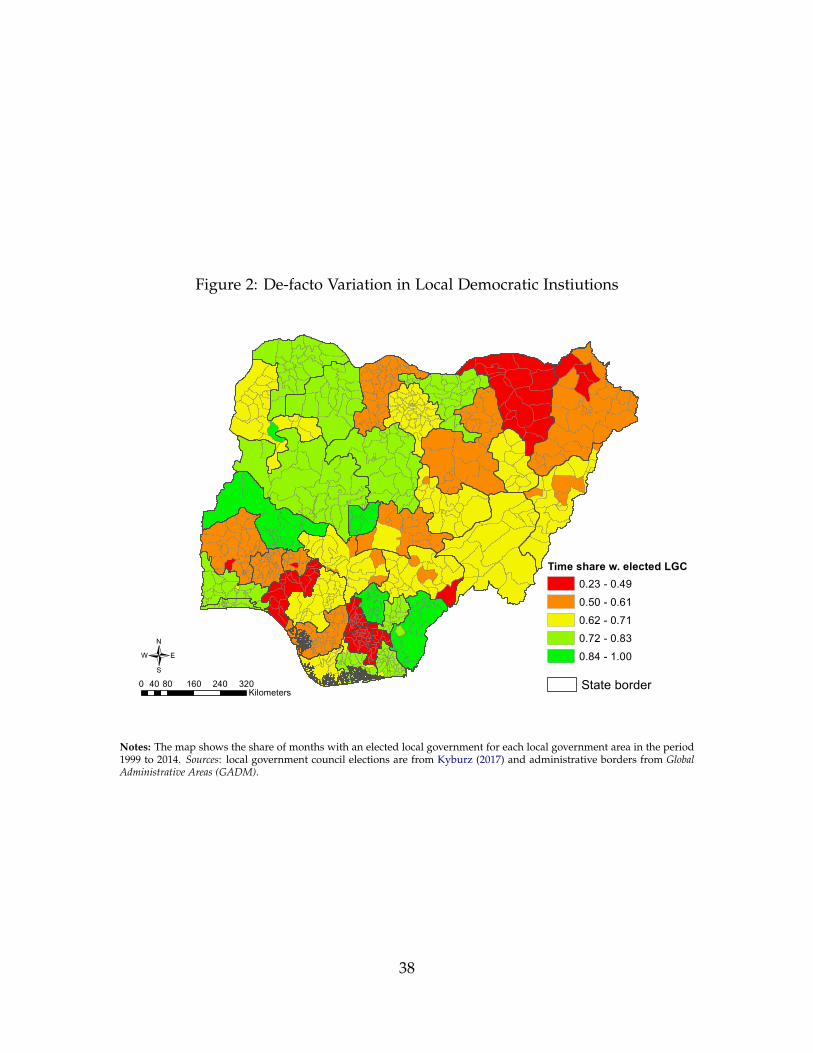
Figure 2: De-facto Variation in Local Democratic Instiutions
Time share w. elected LGC0.23 - 0.490.50 - 0.610.62 - 0.710.72 - 0.830.84 - 1.00
0 80 160 240 32040Kilometers
/State border
Notes: The map shows the share of months with an elected local government for each local government area in the period1999 to 2014. Sources: local government council elections are from Kyburz (2017) and administrative borders from GlobalAdministrative Areas (GADM).
38

Figure 3: Conflict intensity across Nigeria
0 80 160 240 32040Kilometers
/
Any conflict event01 - 23 - 78 - 128
State border
Notes: The map shows the distribution of conflict across local government areas in the period 1999 to 2014. Sources:conflict data is from ACLED and administrative borders are from Global Administrative Areas (GADM) .
39
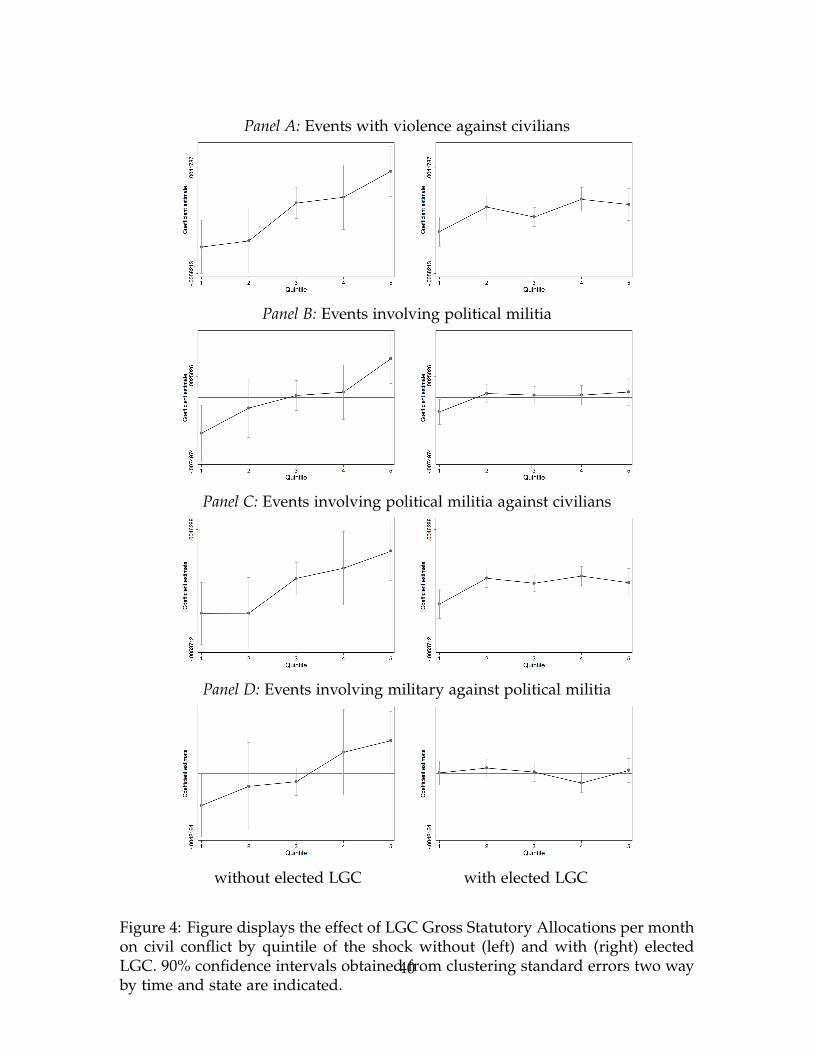
Panel A: Events with violence against civilians
Panel B: Events involving political militia
Panel C: Events involving political militia against civilians
Panel D: Events involving military against political militia
without elected LGC with elected LGC
Figure 4: Figure displays the effect of LGC Gross Statutory Allocations per monthon civil conflict by quintile of the shock without (left) and with (right) electedLGC. 90% confidence intervals obtained from clustering standard errors two wayby time and state are indicated.
40

Table 1: Revenue Allocation Formula
Variable Mean Std. Dev.Equality 0.138 0Population 0.104 0.058Internal Revenue Generation effort 0.009 0.004Landmass 0.017 0.021Terrain 0.017 0Health - Hospital Beds 0.01 0.005Education - Primary enrollment 0.014 0.008Rain - Water supply spread 0.005 0.006Rain - Rainfall share 0.005 0Total index 0.345 0.068
N 774
Notes: Mean and Standard deviation of the different ingredientsthat feed into the overall index used to allocate revenues to localgovernment area’s.
41
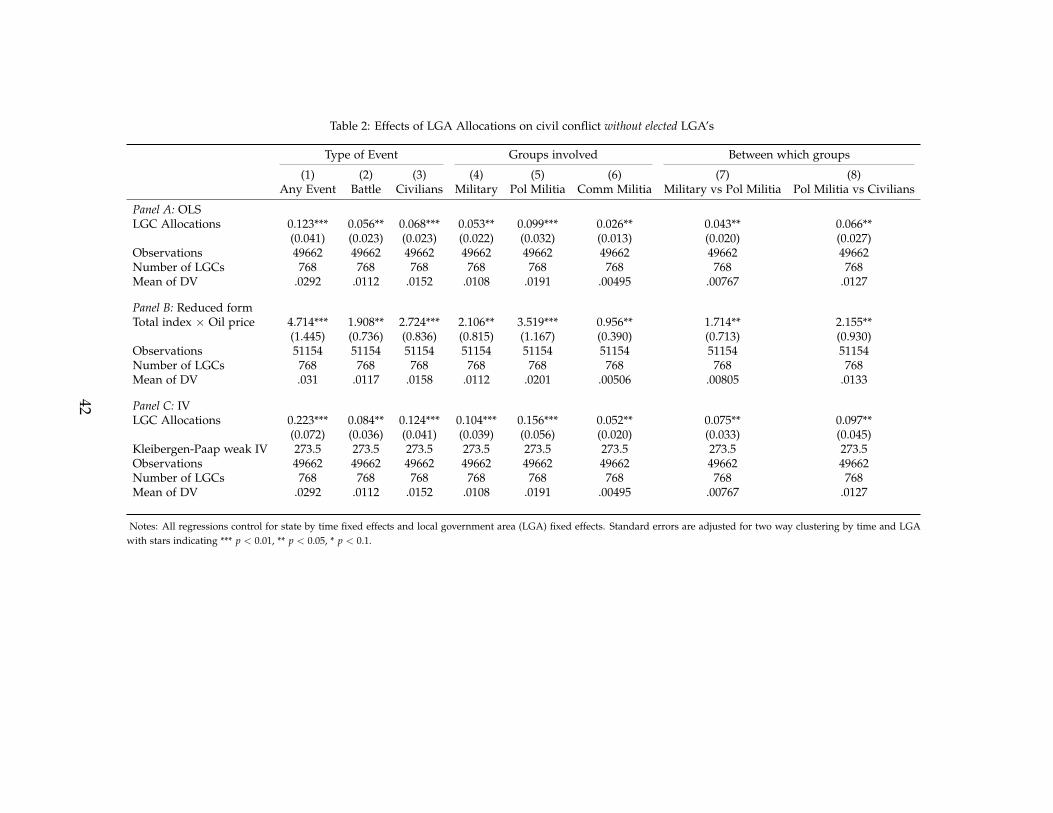
Table 2: Effects of LGA Allocations on civil conflict without elected LGA’s
Type of Event Groups involved Between which groups
(1) (2) (3) (4) (5) (6) (7) (8)Any Event Battle Civilians Military Pol Militia Comm Militia Military vs Pol Militia Pol Militia vs Civilians
Panel A: OLSLGC Allocations 0.123*** 0.056** 0.068*** 0.053** 0.099*** 0.026** 0.043** 0.066**
(0.041) (0.023) (0.023) (0.022) (0.032) (0.013) (0.020) (0.027)Observations 49662 49662 49662 49662 49662 49662 49662 49662Number of LGCs 768 768 768 768 768 768 768 768Mean of DV .0292 .0112 .0152 .0108 .0191 .00495 .00767 .0127
Panel B: Reduced formTotal index × Oil price 4.714*** 1.908** 2.724*** 2.106** 3.519*** 0.956** 1.714** 2.155**
(1.445) (0.736) (0.836) (0.815) (1.167) (0.390) (0.713) (0.930)Observations 51154 51154 51154 51154 51154 51154 51154 51154Number of LGCs 768 768 768 768 768 768 768 768Mean of DV .031 .0117 .0158 .0112 .0201 .00506 .00805 .0133
Panel C: IVLGC Allocations 0.223*** 0.084** 0.124*** 0.104*** 0.156*** 0.052** 0.075** 0.097**
(0.072) (0.036) (0.041) (0.039) (0.056) (0.020) (0.033) (0.045)Kleibergen-Paap weak IV 273.5 273.5 273.5 273.5 273.5 273.5 273.5 273.5Observations 49662 49662 49662 49662 49662 49662 49662 49662Number of LGCs 768 768 768 768 768 768 768 768Mean of DV .0292 .0112 .0152 .0108 .0191 .00495 .00767 .0127
Notes: All regressions control for state by time fixed effects and local government area (LGA) fixed effects. Standard errors are adjusted for two way clustering by time and LGAwith stars indicating *** p < 0.01, ** p < 0.05, * p < 0.1.
42
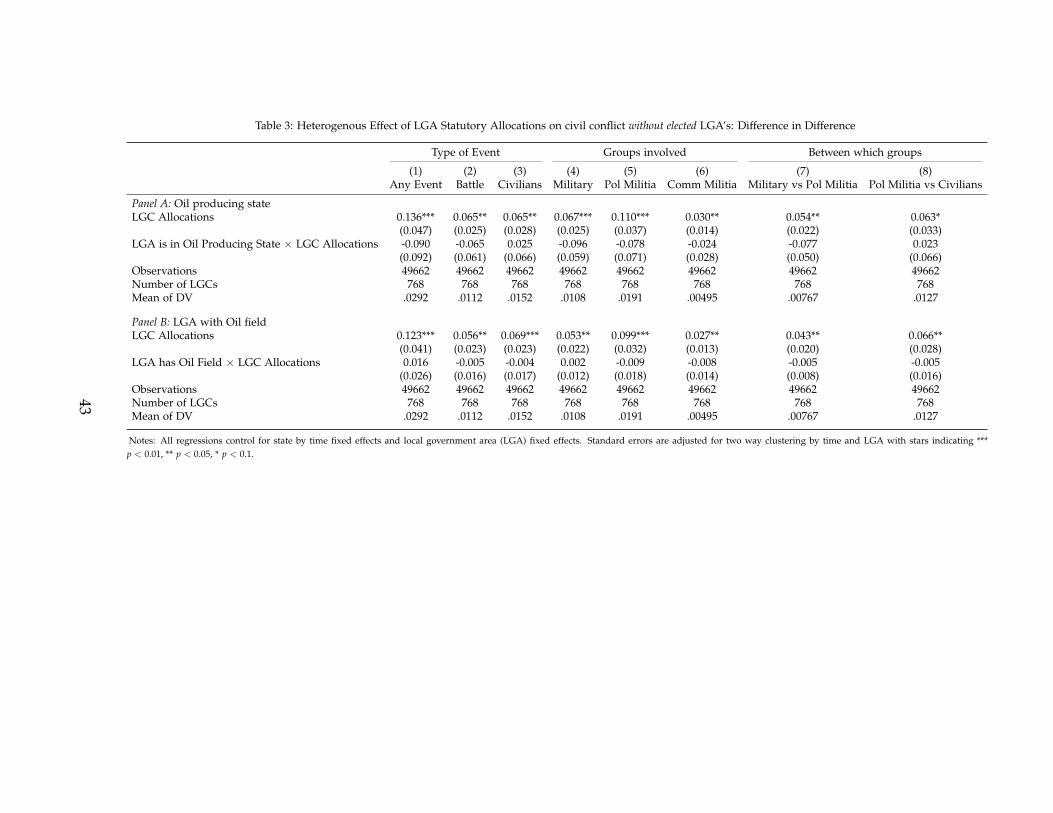
Table 3: Heterogenous Effect of LGA Statutory Allocations on civil conflict without elected LGA’s: Difference in Difference
Type of Event Groups involved Between which groups
(1) (2) (3) (4) (5) (6) (7) (8)Any Event Battle Civilians Military Pol Militia Comm Militia Military vs Pol Militia Pol Militia vs Civilians
Panel A: Oil producing stateLGC Allocations 0.136*** 0.065** 0.065** 0.067*** 0.110*** 0.030** 0.054** 0.063*
(0.047) (0.025) (0.028) (0.025) (0.037) (0.014) (0.022) (0.033)LGA is in Oil Producing State × LGC Allocations -0.090 -0.065 0.025 -0.096 -0.078 -0.024 -0.077 0.023
(0.092) (0.061) (0.066) (0.059) (0.071) (0.028) (0.050) (0.066)Observations 49662 49662 49662 49662 49662 49662 49662 49662Number of LGCs 768 768 768 768 768 768 768 768Mean of DV .0292 .0112 .0152 .0108 .0191 .00495 .00767 .0127
Panel B: LGA with Oil fieldLGC Allocations 0.123*** 0.056** 0.069*** 0.053** 0.099*** 0.027** 0.043** 0.066**
(0.041) (0.023) (0.023) (0.022) (0.032) (0.013) (0.020) (0.028)LGA has Oil Field × LGC Allocations 0.016 -0.005 -0.004 0.002 -0.009 -0.008 -0.005 -0.005
(0.026) (0.016) (0.017) (0.012) (0.018) (0.014) (0.008) (0.016)Observations 49662 49662 49662 49662 49662 49662 49662 49662Number of LGCs 768 768 768 768 768 768 768 768Mean of DV .0292 .0112 .0152 .0108 .0191 .00495 .00767 .0127
Notes: All regressions control for state by time fixed effects and local government area (LGA) fixed effects. Standard errors are adjusted for two way clustering by time and LGA with stars indicating ***p < 0.01, ** p < 0.05, * p < 0.1.
43
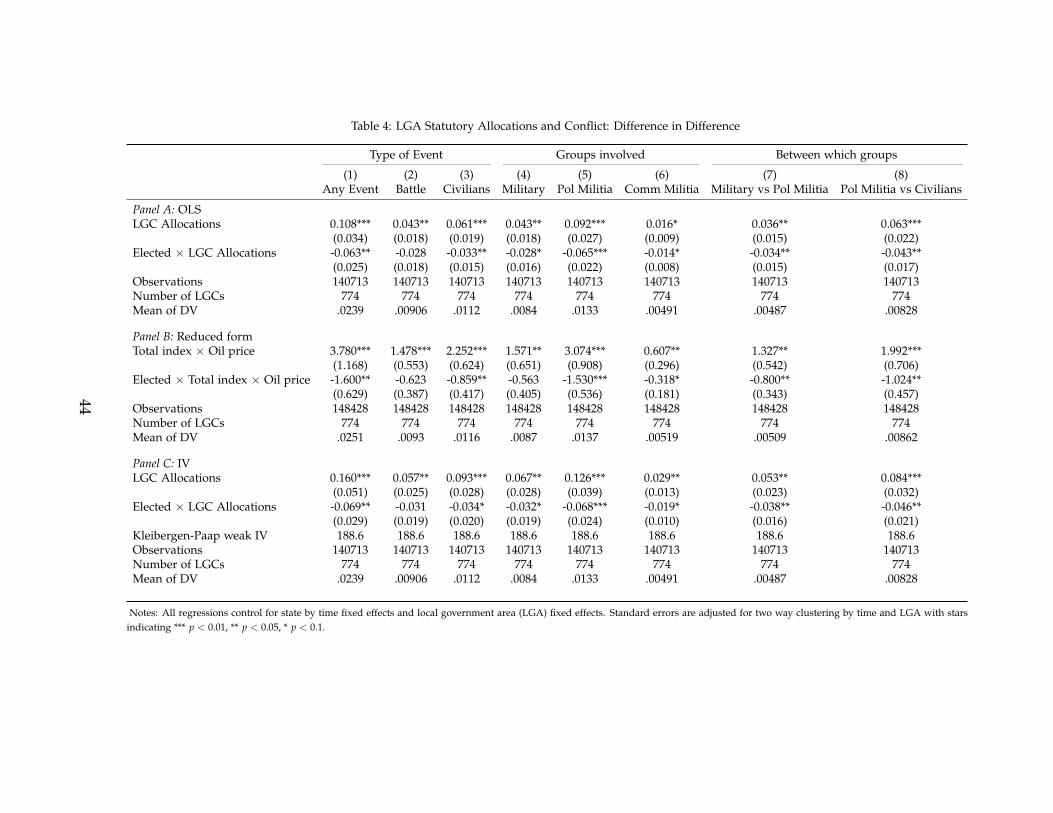
Table 4: LGA Statutory Allocations and Conflict: Difference in Difference
Type of Event Groups involved Between which groups
(1) (2) (3) (4) (5) (6) (7) (8)Any Event Battle Civilians Military Pol Militia Comm Militia Military vs Pol Militia Pol Militia vs Civilians
Panel A: OLSLGC Allocations 0.108*** 0.043** 0.061*** 0.043** 0.092*** 0.016* 0.036** 0.063***
(0.034) (0.018) (0.019) (0.018) (0.027) (0.009) (0.015) (0.022)Elected × LGC Allocations -0.063** -0.028 -0.033** -0.028* -0.065*** -0.014* -0.034** -0.043**
(0.025) (0.018) (0.015) (0.016) (0.022) (0.008) (0.015) (0.017)Observations 140713 140713 140713 140713 140713 140713 140713 140713Number of LGCs 774 774 774 774 774 774 774 774Mean of DV .0239 .00906 .0112 .0084 .0133 .00491 .00487 .00828
Panel B: Reduced formTotal index × Oil price 3.780*** 1.478*** 2.252*** 1.571** 3.074*** 0.607** 1.327** 1.992***
(1.168) (0.553) (0.624) (0.651) (0.908) (0.296) (0.542) (0.706)Elected × Total index × Oil price -1.600** -0.623 -0.859** -0.563 -1.530*** -0.318* -0.800** -1.024**
(0.629) (0.387) (0.417) (0.405) (0.536) (0.181) (0.343) (0.457)Observations 148428 148428 148428 148428 148428 148428 148428 148428Number of LGCs 774 774 774 774 774 774 774 774Mean of DV .0251 .0093 .0116 .0087 .0137 .00519 .00509 .00862
Panel C: IVLGC Allocations 0.160*** 0.057** 0.093*** 0.067** 0.126*** 0.029** 0.053** 0.084***
(0.051) (0.025) (0.028) (0.028) (0.039) (0.013) (0.023) (0.032)Elected × LGC Allocations -0.069** -0.031 -0.034* -0.032* -0.068*** -0.019* -0.038** -0.046**
(0.029) (0.019) (0.020) (0.019) (0.024) (0.010) (0.016) (0.021)Kleibergen-Paap weak IV 188.6 188.6 188.6 188.6 188.6 188.6 188.6 188.6Observations 140713 140713 140713 140713 140713 140713 140713 140713Number of LGCs 774 774 774 774 774 774 774 774Mean of DV .0239 .00906 .0112 .0084 .0133 .00491 .00487 .00828
Notes: All regressions control for state by time fixed effects and local government area (LGA) fixed effects. Standard errors are adjusted for two way clustering by time and LGA with starsindicating *** p < 0.01, ** p < 0.05, * p < 0.1.
44
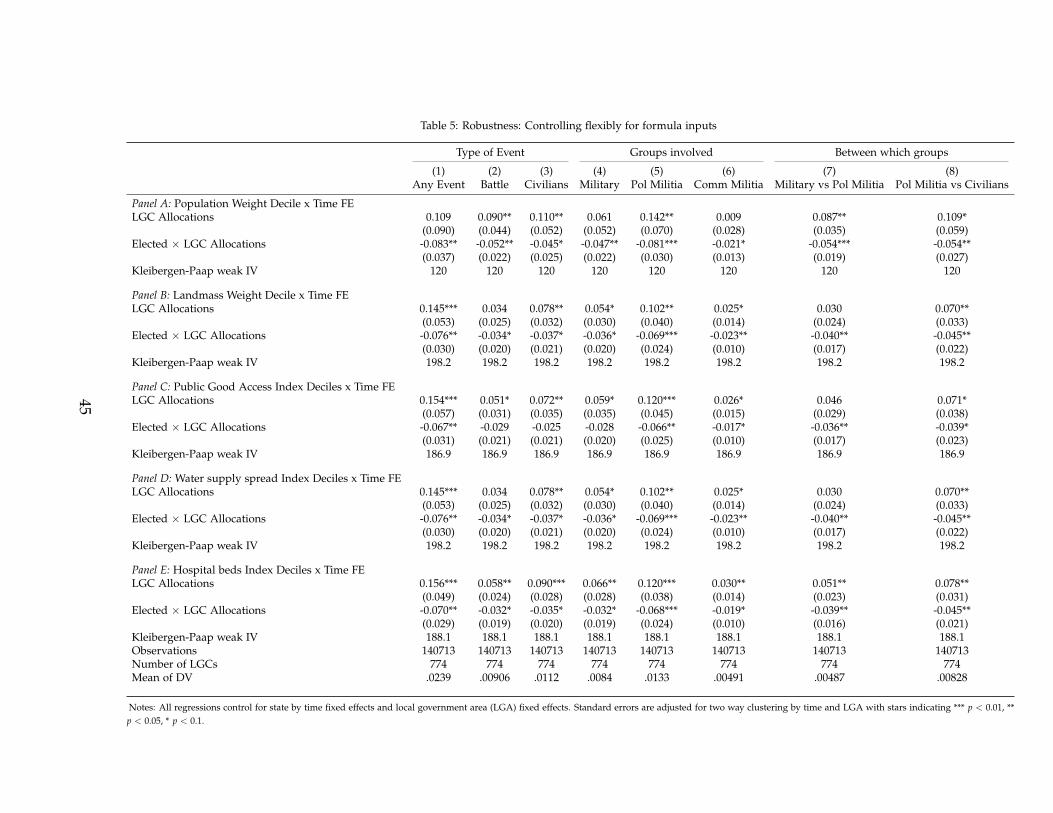
Table 5: Robustness: Controlling flexibly for formula inputs
Type of Event Groups involved Between which groups
(1) (2) (3) (4) (5) (6) (7) (8)Any Event Battle Civilians Military Pol Militia Comm Militia Military vs Pol Militia Pol Militia vs Civilians
Panel A: Population Weight Decile x Time FELGC Allocations 0.109 0.090** 0.110** 0.061 0.142** 0.009 0.087** 0.109*
(0.090) (0.044) (0.052) (0.052) (0.070) (0.028) (0.035) (0.059)Elected × LGC Allocations -0.083** -0.052** -0.045* -0.047** -0.081*** -0.021* -0.054*** -0.054**
(0.037) (0.022) (0.025) (0.022) (0.030) (0.013) (0.019) (0.027)Kleibergen-Paap weak IV 120 120 120 120 120 120 120 120
Panel B: Landmass Weight Decile x Time FELGC Allocations 0.145*** 0.034 0.078** 0.054* 0.102** 0.025* 0.030 0.070**
(0.053) (0.025) (0.032) (0.030) (0.040) (0.014) (0.024) (0.033)Elected × LGC Allocations -0.076** -0.034* -0.037* -0.036* -0.069*** -0.023** -0.040** -0.045**
(0.030) (0.020) (0.021) (0.020) (0.024) (0.010) (0.017) (0.022)Kleibergen-Paap weak IV 198.2 198.2 198.2 198.2 198.2 198.2 198.2 198.2
Panel C: Public Good Access Index Deciles x Time FELGC Allocations 0.154*** 0.051* 0.072** 0.059* 0.120*** 0.026* 0.046 0.071*
(0.057) (0.031) (0.035) (0.035) (0.045) (0.015) (0.029) (0.038)Elected × LGC Allocations -0.067** -0.029 -0.025 -0.028 -0.066** -0.017* -0.036** -0.039*
(0.031) (0.021) (0.021) (0.020) (0.025) (0.010) (0.017) (0.023)Kleibergen-Paap weak IV 186.9 186.9 186.9 186.9 186.9 186.9 186.9 186.9
Panel D: Water supply spread Index Deciles x Time FELGC Allocations 0.145*** 0.034 0.078** 0.054* 0.102** 0.025* 0.030 0.070**
(0.053) (0.025) (0.032) (0.030) (0.040) (0.014) (0.024) (0.033)Elected × LGC Allocations -0.076** -0.034* -0.037* -0.036* -0.069*** -0.023** -0.040** -0.045**
(0.030) (0.020) (0.021) (0.020) (0.024) (0.010) (0.017) (0.022)Kleibergen-Paap weak IV 198.2 198.2 198.2 198.2 198.2 198.2 198.2 198.2
Panel E: Hospital beds Index Deciles x Time FELGC Allocations 0.156*** 0.058** 0.090*** 0.066** 0.120*** 0.030** 0.051** 0.078**
(0.049) (0.024) (0.028) (0.028) (0.038) (0.014) (0.023) (0.031)Elected × LGC Allocations -0.070** -0.032* -0.035* -0.032* -0.068*** -0.019* -0.039** -0.045**
(0.029) (0.019) (0.020) (0.019) (0.024) (0.010) (0.016) (0.021)Kleibergen-Paap weak IV 188.1 188.1 188.1 188.1 188.1 188.1 188.1 188.1Observations 140713 140713 140713 140713 140713 140713 140713 140713Number of LGCs 774 774 774 774 774 774 774 774Mean of DV .0239 .00906 .0112 .0084 .0133 .00491 .00487 .00828
Notes: All regressions control for state by time fixed effects and local government area (LGA) fixed effects. Standard errors are adjusted for two way clustering by time and LGA with stars indicating *** p < 0.01, **p < 0.05, * p < 0.1.
45
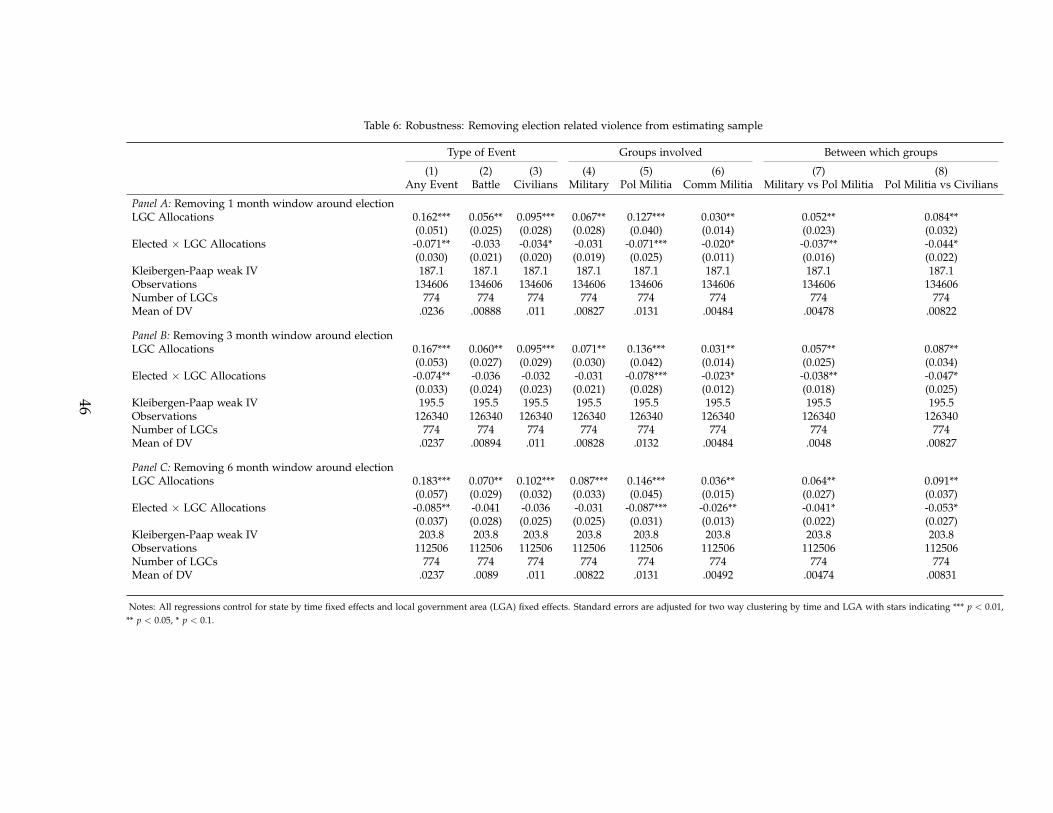
Table 6: Robustness: Removing election related violence from estimating sample
Type of Event Groups involved Between which groups
(1) (2) (3) (4) (5) (6) (7) (8)Any Event Battle Civilians Military Pol Militia Comm Militia Military vs Pol Militia Pol Militia vs Civilians
Panel A: Removing 1 month window around electionLGC Allocations 0.162*** 0.056** 0.095*** 0.067** 0.127*** 0.030** 0.052** 0.084**
(0.051) (0.025) (0.028) (0.028) (0.040) (0.014) (0.023) (0.032)Elected × LGC Allocations -0.071** -0.033 -0.034* -0.031 -0.071*** -0.020* -0.037** -0.044*
(0.030) (0.021) (0.020) (0.019) (0.025) (0.011) (0.016) (0.022)Kleibergen-Paap weak IV 187.1 187.1 187.1 187.1 187.1 187.1 187.1 187.1Observations 134606 134606 134606 134606 134606 134606 134606 134606Number of LGCs 774 774 774 774 774 774 774 774Mean of DV .0236 .00888 .011 .00827 .0131 .00484 .00478 .00822
Panel B: Removing 3 month window around electionLGC Allocations 0.167*** 0.060** 0.095*** 0.071** 0.136*** 0.031** 0.057** 0.087**
(0.053) (0.027) (0.029) (0.030) (0.042) (0.014) (0.025) (0.034)Elected × LGC Allocations -0.074** -0.036 -0.032 -0.031 -0.078*** -0.023* -0.038** -0.047*
(0.033) (0.024) (0.023) (0.021) (0.028) (0.012) (0.018) (0.025)Kleibergen-Paap weak IV 195.5 195.5 195.5 195.5 195.5 195.5 195.5 195.5Observations 126340 126340 126340 126340 126340 126340 126340 126340Number of LGCs 774 774 774 774 774 774 774 774Mean of DV .0237 .00894 .011 .00828 .0132 .00484 .0048 .00827
Panel C: Removing 6 month window around electionLGC Allocations 0.183*** 0.070** 0.102*** 0.087*** 0.146*** 0.036** 0.064** 0.091**
(0.057) (0.029) (0.032) (0.033) (0.045) (0.015) (0.027) (0.037)Elected × LGC Allocations -0.085** -0.041 -0.036 -0.031 -0.087*** -0.026** -0.041* -0.053*
(0.037) (0.028) (0.025) (0.025) (0.031) (0.013) (0.022) (0.027)Kleibergen-Paap weak IV 203.8 203.8 203.8 203.8 203.8 203.8 203.8 203.8Observations 112506 112506 112506 112506 112506 112506 112506 112506Number of LGCs 774 774 774 774 774 774 774 774Mean of DV .0237 .0089 .011 .00822 .0131 .00492 .00474 .00831
Notes: All regressions control for state by time fixed effects and local government area (LGA) fixed effects. Standard errors are adjusted for two way clustering by time and LGA with stars indicating *** p < 0.01,** p < 0.05, * p < 0.1.
46
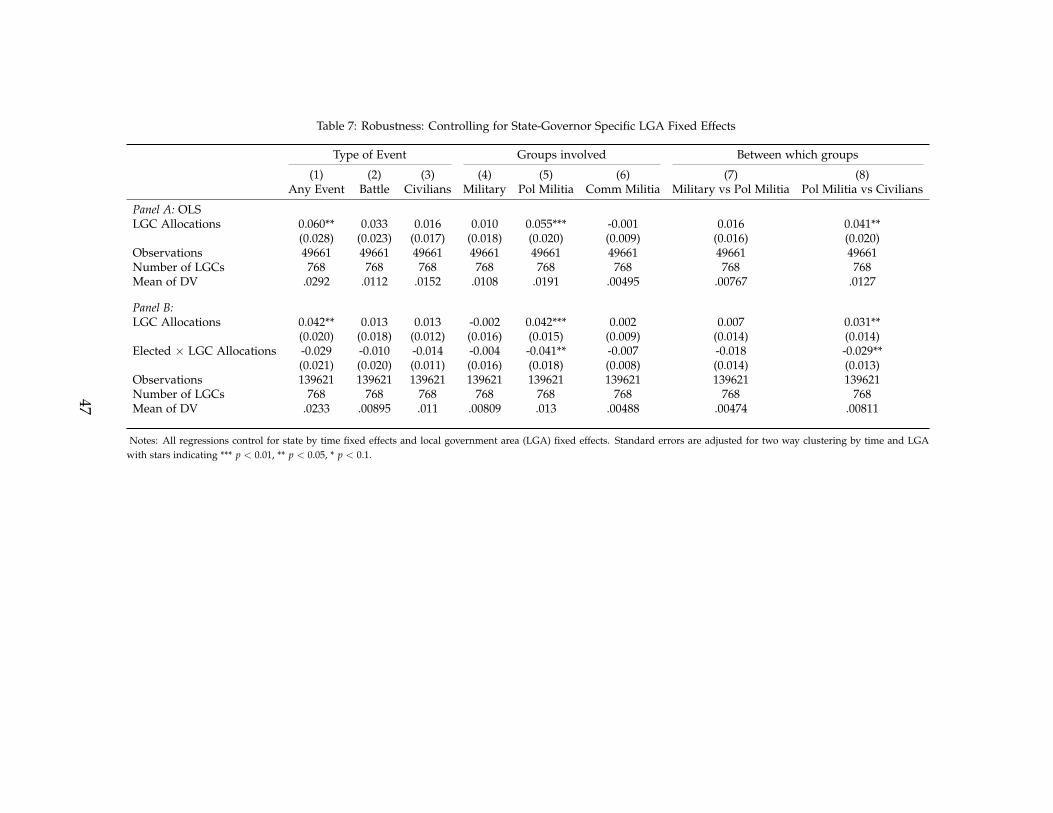
Table 7: Robustness: Controlling for State-Governor Specific LGA Fixed Effects
Type of Event Groups involved Between which groups
(1) (2) (3) (4) (5) (6) (7) (8)Any Event Battle Civilians Military Pol Militia Comm Militia Military vs Pol Militia Pol Militia vs Civilians
Panel A: OLSLGC Allocations 0.060** 0.033 0.016 0.010 0.055*** -0.001 0.016 0.041**
(0.028) (0.023) (0.017) (0.018) (0.020) (0.009) (0.016) (0.020)Observations 49661 49661 49661 49661 49661 49661 49661 49661Number of LGCs 768 768 768 768 768 768 768 768Mean of DV .0292 .0112 .0152 .0108 .0191 .00495 .00767 .0127
Panel B:LGC Allocations 0.042** 0.013 0.013 -0.002 0.042*** 0.002 0.007 0.031**
(0.020) (0.018) (0.012) (0.016) (0.015) (0.009) (0.014) (0.014)Elected × LGC Allocations -0.029 -0.010 -0.014 -0.004 -0.041** -0.007 -0.018 -0.029**
(0.021) (0.020) (0.011) (0.016) (0.018) (0.008) (0.014) (0.013)Observations 139621 139621 139621 139621 139621 139621 139621 139621Number of LGCs 768 768 768 768 768 768 768 768Mean of DV .0233 .00895 .011 .00809 .013 .00488 .00474 .00811
Notes: All regressions control for state by time fixed effects and local government area (LGA) fixed effects. Standard errors are adjusted for two way clustering by time and LGAwith stars indicating *** p < 0.01, ** p < 0.05, * p < 0.1.
47
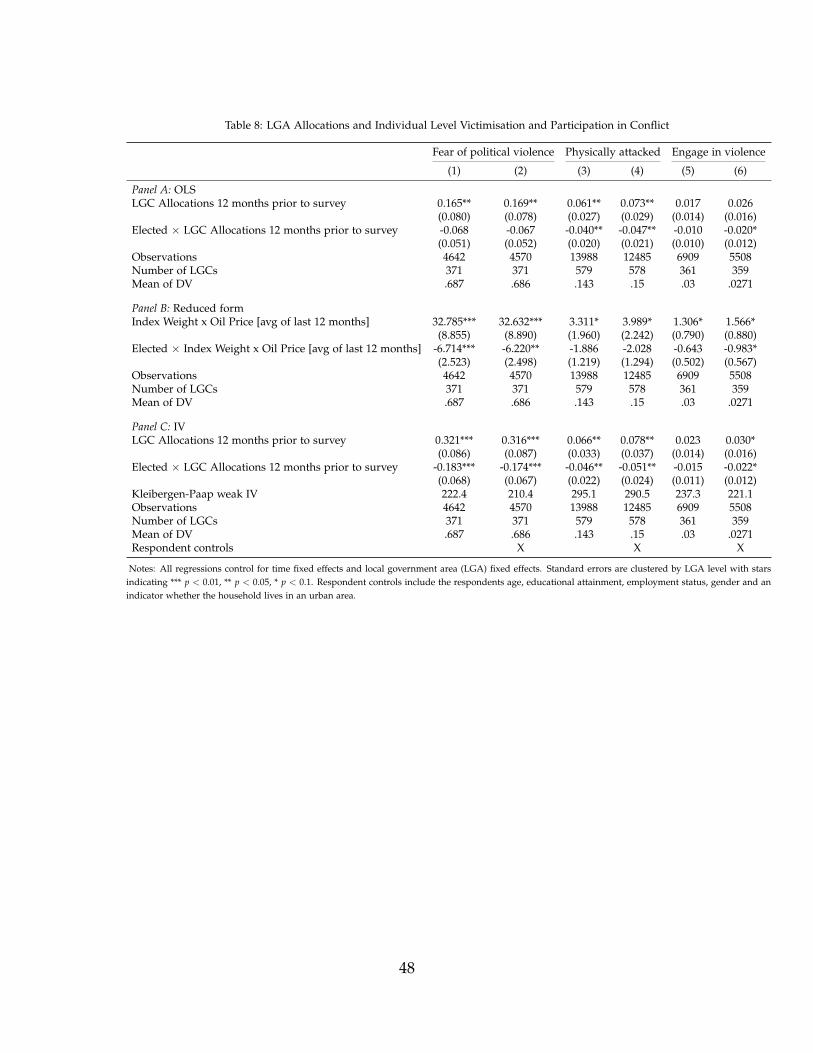
Table 8: LGA Allocations and Individual Level Victimisation and Participation in Conflict
Fear of political violence Physically attacked Engage in violence
(1) (2) (3) (4) (5) (6)
Panel A: OLSLGC Allocations 12 months prior to survey 0.165** 0.169** 0.061** 0.073** 0.017 0.026
(0.080) (0.078) (0.027) (0.029) (0.014) (0.016)Elected × LGC Allocations 12 months prior to survey -0.068 -0.067 -0.040** -0.047** -0.010 -0.020*
(0.051) (0.052) (0.020) (0.021) (0.010) (0.012)Observations 4642 4570 13988 12485 6909 5508Number of LGCs 371 371 579 578 361 359Mean of DV .687 .686 .143 .15 .03 .0271
Panel B: Reduced formIndex Weight x Oil Price [avg of last 12 months] 32.785*** 32.632*** 3.311* 3.989* 1.306* 1.566*
(8.855) (8.890) (1.960) (2.242) (0.790) (0.880)Elected × Index Weight x Oil Price [avg of last 12 months] -6.714*** -6.220** -1.886 -2.028 -0.643 -0.983*
(2.523) (2.498) (1.219) (1.294) (0.502) (0.567)Observations 4642 4570 13988 12485 6909 5508Number of LGCs 371 371 579 578 361 359Mean of DV .687 .686 .143 .15 .03 .0271
Panel C: IVLGC Allocations 12 months prior to survey 0.321*** 0.316*** 0.066** 0.078** 0.023 0.030*
(0.086) (0.087) (0.033) (0.037) (0.014) (0.016)Elected × LGC Allocations 12 months prior to survey -0.183*** -0.174*** -0.046** -0.051** -0.015 -0.022*
(0.068) (0.067) (0.022) (0.024) (0.011) (0.012)Kleibergen-Paap weak IV 222.4 210.4 295.1 290.5 237.3 221.1Observations 4642 4570 13988 12485 6909 5508Number of LGCs 371 371 579 578 361 359Mean of DV .687 .686 .143 .15 .03 .0271Respondent controls X X X
Notes: All regressions control for time fixed effects and local government area (LGA) fixed effects. Standard errors are clustered by LGA level with starsindicating *** p < 0.01, ** p < 0.05, * p < 0.1. Respondent controls include the respondents age, educational attainment, employment status, gender and anindicator whether the household lives in an urban area.
48
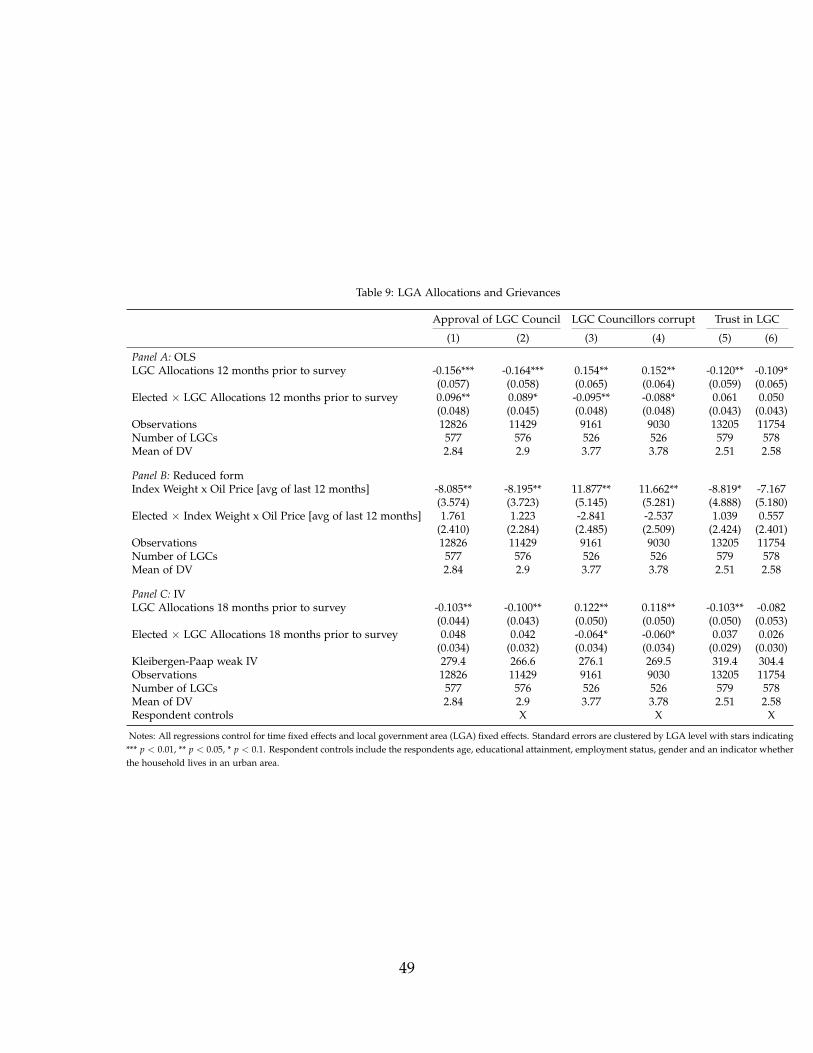
Table 9: LGA Allocations and Grievances
Approval of LGC Council LGC Councillors corrupt Trust in LGC
(1) (2) (3) (4) (5) (6)
Panel A: OLSLGC Allocations 12 months prior to survey -0.156*** -0.164*** 0.154** 0.152** -0.120** -0.109*
(0.057) (0.058) (0.065) (0.064) (0.059) (0.065)Elected × LGC Allocations 12 months prior to survey 0.096** 0.089* -0.095** -0.088* 0.061 0.050
(0.048) (0.045) (0.048) (0.048) (0.043) (0.043)Observations 12826 11429 9161 9030 13205 11754Number of LGCs 577 576 526 526 579 578Mean of DV 2.84 2.9 3.77 3.78 2.51 2.58
Panel B: Reduced formIndex Weight x Oil Price [avg of last 12 months] -8.085** -8.195** 11.877** 11.662** -8.819* -7.167
(3.574) (3.723) (5.145) (5.281) (4.888) (5.180)Elected × Index Weight x Oil Price [avg of last 12 months] 1.761 1.223 -2.841 -2.537 1.039 0.557
(2.410) (2.284) (2.485) (2.509) (2.424) (2.401)Observations 12826 11429 9161 9030 13205 11754Number of LGCs 577 576 526 526 579 578Mean of DV 2.84 2.9 3.77 3.78 2.51 2.58
Panel C: IVLGC Allocations 18 months prior to survey -0.103** -0.100** 0.122** 0.118** -0.103** -0.082
(0.044) (0.043) (0.050) (0.050) (0.050) (0.053)Elected × LGC Allocations 18 months prior to survey 0.048 0.042 -0.064* -0.060* 0.037 0.026
(0.034) (0.032) (0.034) (0.034) (0.029) (0.030)Kleibergen-Paap weak IV 279.4 266.6 276.1 269.5 319.4 304.4Observations 12826 11429 9161 9030 13205 11754Number of LGCs 577 576 526 526 579 578Mean of DV 2.84 2.9 3.77 3.78 2.51 2.58Respondent controls X X X
Notes: All regressions control for time fixed effects and local government area (LGA) fixed effects. Standard errors are clustered by LGA level with stars indicating*** p < 0.01, ** p < 0.05, * p < 0.1. Respondent controls include the respondents age, educational attainment, employment status, gender and an indicator whetherthe household lives in an urban area.
49
Appendix to “Does Democracy ModerateResource-induced Conflicts?”
For Online Publication
Thiemo Fetzer Stephan Kyburz
August 18, 2017
A Data Appendix
This section provides further details on the underlying data used in the empiricalexercises.
A.1 The Excess Crude Account
The Excess Crude Account (ECA) was established 2004 in order to collect resourcerevenues that accrue due to the difference between the yearly benchmark oil priceand the actual market price. Its objective was to account for the volatility in crudeoil prices to protect planned budgets (Central Bank of Nigeria, 2012). Essentially,it was set up as a rainy day fund. In 2010, Nigeria’s National Economic Councilapproved the creation of a national sovereign wealth fund to replace the ExcessCrude Account. The establishment of the Nigeria Sovereign Investment Authoritywas signed into law on 25 May, 2011 (Nigeria Sovereign Investment Autority,2015). The wealth fund operates three separate funds, the Stabilisation Fund (SF),the Future Generations Fund (FGF), and the Nigeria Infrastructure Fund (NIF).
The Excess Crude Account was surrounded by controversies throughout itsexistence (Central Bank of Nigeria, 2012). The ECA was subject to the whims ofpolitical leaders, which raised serious concerns about transparency and account-ability. It was meant to delink government expenditure from oil revenues in orderto insulate the Nigerian economy from external shocks. Due to surging oil prices,the funds collected in the ECA increased almost fourfold from $ 5.1 billion to over$ 20 billion by November 2008. Due to budget deficits at all government level asa consequence of the financial crisis and falling oil prices, the ECA decreased to
1
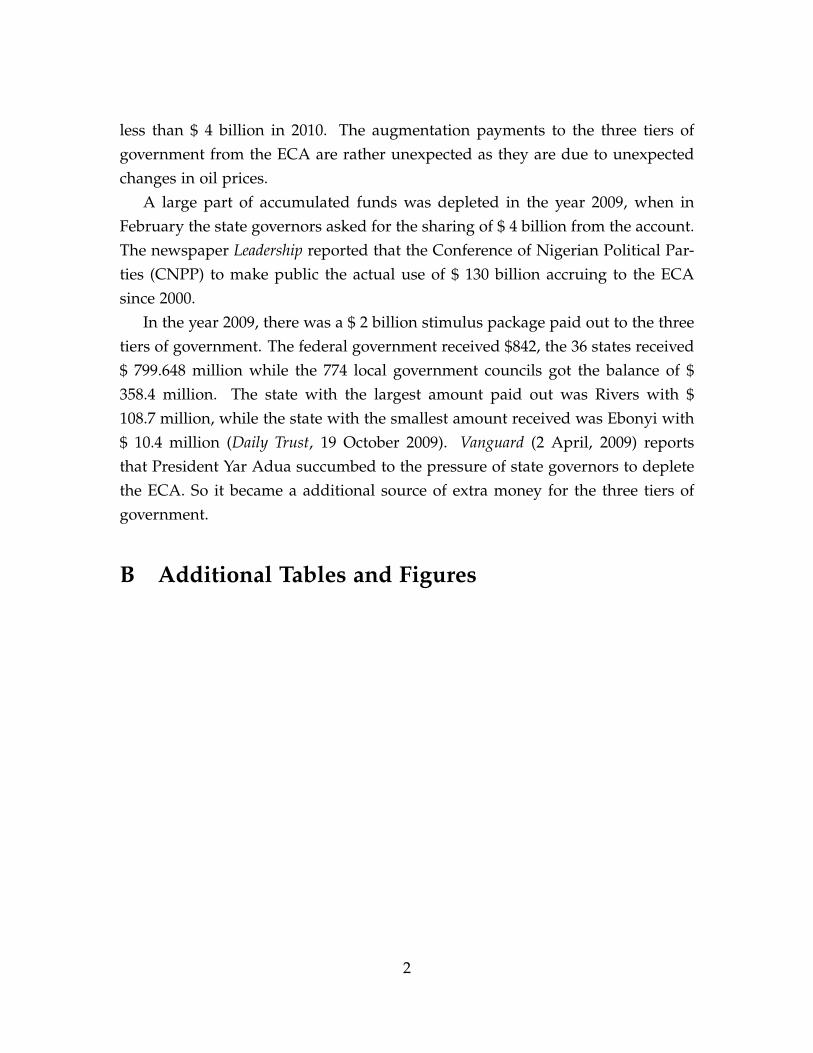
less than $ 4 billion in 2010. The augmentation payments to the three tiers ofgovernment from the ECA are rather unexpected as they are due to unexpectedchanges in oil prices.
A large part of accumulated funds was depleted in the year 2009, when inFebruary the state governors asked for the sharing of $ 4 billion from the account.The newspaper Leadership reported that the Conference of Nigerian Political Par-ties (CNPP) to make public the actual use of $ 130 billion accruing to the ECAsince 2000.
In the year 2009, there was a $ 2 billion stimulus package paid out to the threetiers of government. The federal government received $842, the 36 states received$ 799.648 million while the 774 local government councils got the balance of $358.4 million. The state with the largest amount paid out was Rivers with $108.7 million, while the state with the smallest amount received was Ebonyi with$ 10.4 million (Daily Trust, 19 October 2009). Vanguard (2 April, 2009) reportsthat President Yar Adua succumbed to the pressure of state governors to depletethe ECA. So it became a additional source of extra money for the three tiers ofgovernment.
B Additional Tables and Figures
2
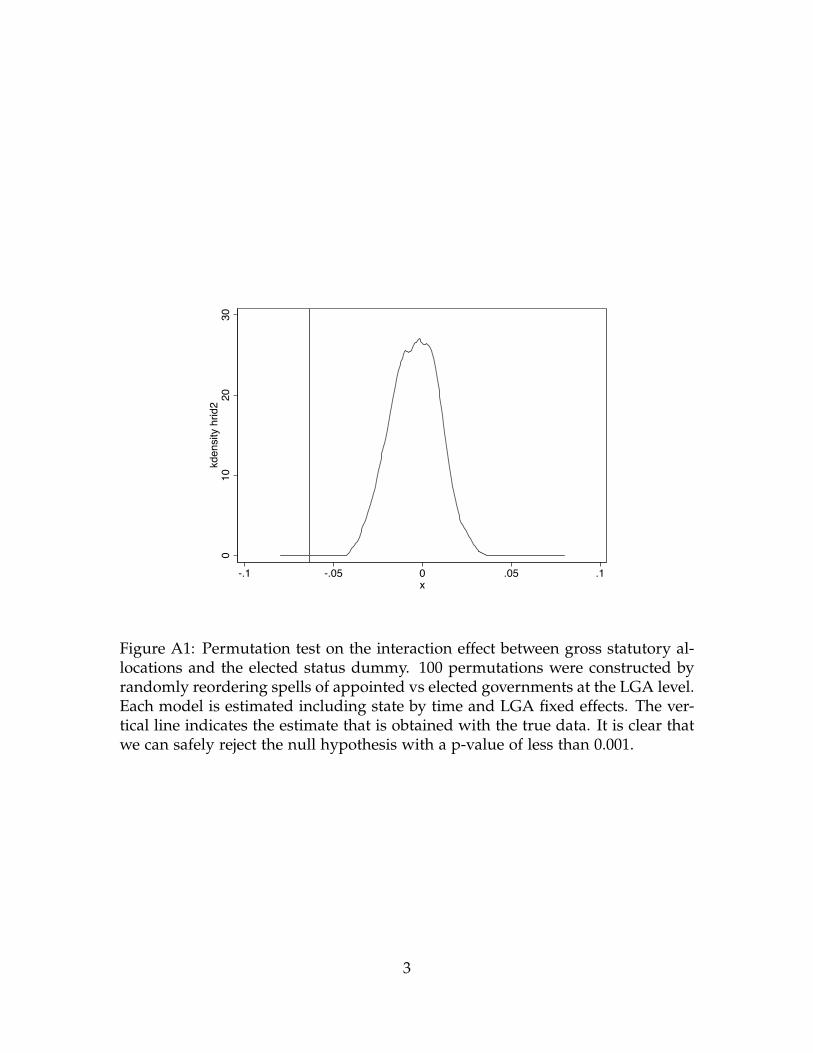
010
2030
kden
sity
hrid
2
-.1 -.05 0 .05 .1x
Figure A1: Permutation test on the interaction effect between gross statutory al-locations and the elected status dummy. 100 permutations were constructed byrandomly reordering spells of appointed vs elected governments at the LGA level.Each model is estimated including state by time and LGA fixed effects. The ver-tical line indicates the estimate that is obtained with the true data. It is clear thatwe can safely reject the null hypothesis with a p-value of less than 0.001.
3
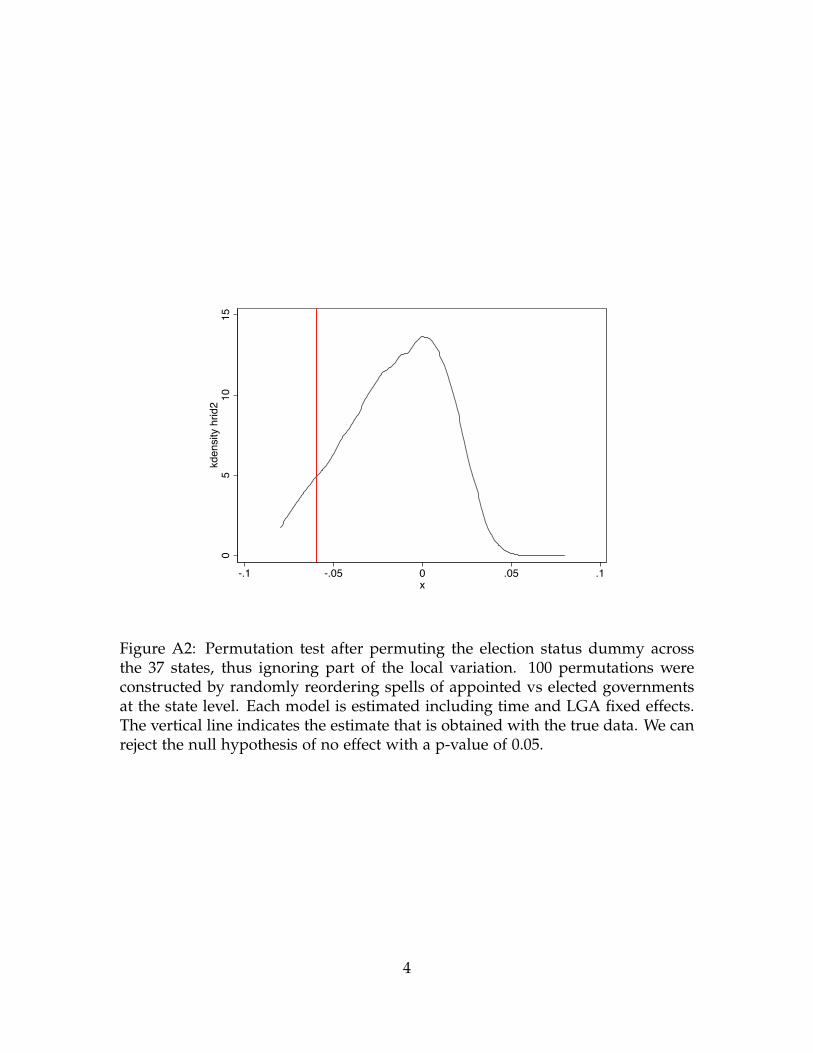
05
1015
kden
sity
hrid
2
-.1 -.05 0 .05 .1x
Figure A2: Permutation test after permuting the election status dummy acrossthe 37 states, thus ignoring part of the local variation. 100 permutations wereconstructed by randomly reordering spells of appointed vs elected governmentsat the state level. Each model is estimated including time and LGA fixed effects.The vertical line indicates the estimate that is obtained with the true data. We canreject the null hypothesis of no effect with a p-value of 0.05.
4

Figure A3: Conflict around election months. Figure presents estimated coeffi-cients from a regression with the left hand side being a dummy variable indicat-ing whether there was any conflict event in an LGA and month. The regressionremoves LGA fixed effects and time fixed effects prior and then regresses theresidualized dependent variable on a set of dummies capturing the time to theelection date. Standard errors are clustered at the LGA level and 10% confidencebands are indicated.
5
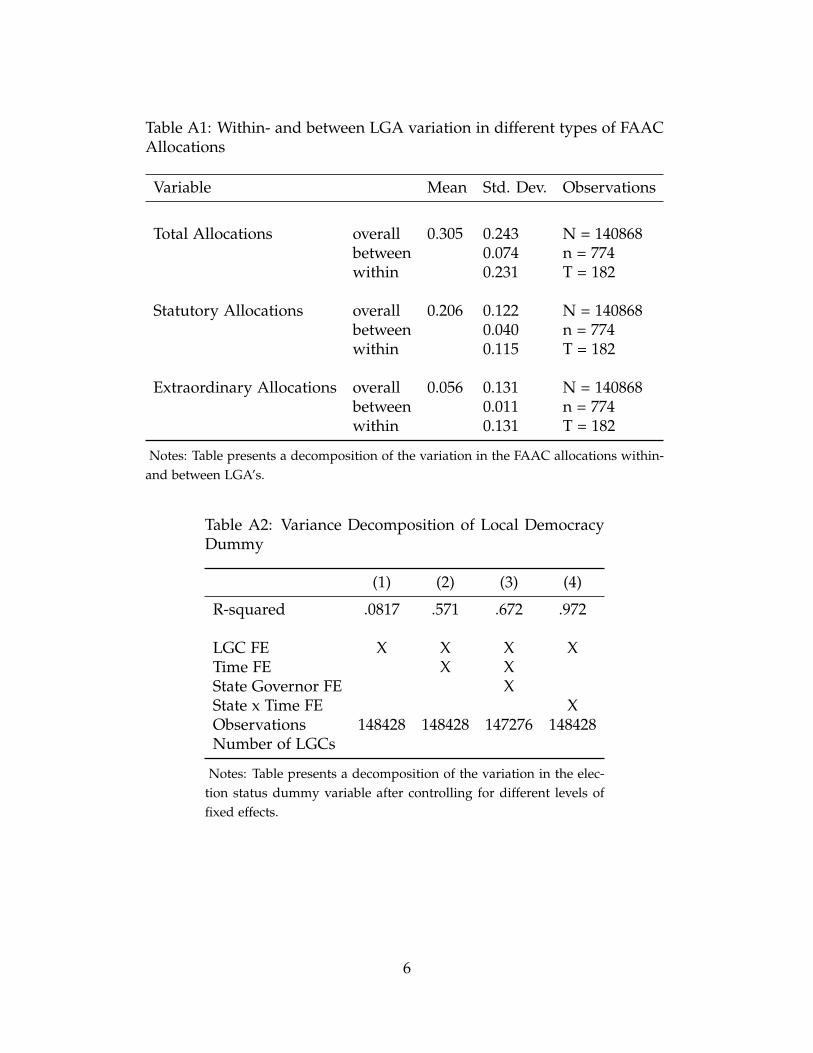
Table A1: Within- and between LGA variation in different types of FAACAllocations
Variable Mean Std. Dev. Observations
Total Allocations overall 0.305 0.243 N = 140868between 0.074 n = 774within 0.231 T = 182
Statutory Allocations overall 0.206 0.122 N = 140868between 0.040 n = 774within 0.115 T = 182
Extraordinary Allocations overall 0.056 0.131 N = 140868between 0.011 n = 774within 0.131 T = 182
Notes: Table presents a decomposition of the variation in the FAAC allocations within-and between LGA’s.
Table A2: Variance Decomposition of Local DemocracyDummy
(1) (2) (3) (4)
R-squared .0817 .571 .672 .972
LGC FE X X X XTime FE X XState Governor FE XState x Time FE XObservations 148428 148428 147276 148428Number of LGCs
Notes: Table presents a decomposition of the variation in the elec-tion status dummy variable after controlling for different levels offixed effects.
6
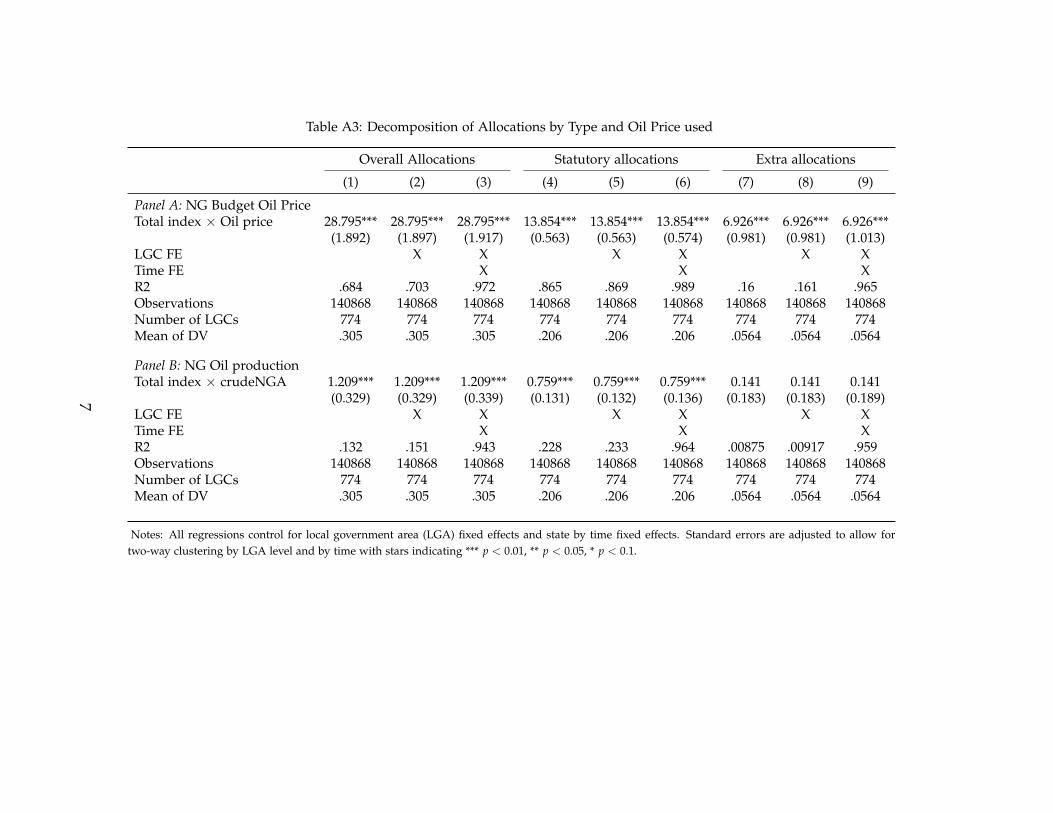
Table A3: Decomposition of Allocations by Type and Oil Price used
Overall Allocations Statutory allocations Extra allocations
(1) (2) (3) (4) (5) (6) (7) (8) (9)
Panel A: NG Budget Oil PriceTotal index × Oil price 28.795*** 28.795*** 28.795*** 13.854*** 13.854*** 13.854*** 6.926*** 6.926*** 6.926***
(1.892) (1.897) (1.917) (0.563) (0.563) (0.574) (0.981) (0.981) (1.013)LGC FE X X X X X XTime FE X X XR2 .684 .703 .972 .865 .869 .989 .16 .161 .965Observations 140868 140868 140868 140868 140868 140868 140868 140868 140868Number of LGCs 774 774 774 774 774 774 774 774 774Mean of DV .305 .305 .305 .206 .206 .206 .0564 .0564 .0564
Panel B: NG Oil productionTotal index × crudeNGA 1.209*** 1.209*** 1.209*** 0.759*** 0.759*** 0.759*** 0.141 0.141 0.141
(0.329) (0.329) (0.339) (0.131) (0.132) (0.136) (0.183) (0.183) (0.189)LGC FE X X X X X XTime FE X X XR2 .132 .151 .943 .228 .233 .964 .00875 .00917 .959Observations 140868 140868 140868 140868 140868 140868 140868 140868 140868Number of LGCs 774 774 774 774 774 774 774 774 774Mean of DV .305 .305 .305 .206 .206 .206 .0564 .0564 .0564
Notes: All regressions control for local government area (LGA) fixed effects and state by time fixed effects. Standard errors are adjusted to allow fortwo-way clustering by LGA level and by time with stars indicating *** p < 0.01, ** p < 0.05, * p < 0.1.
7
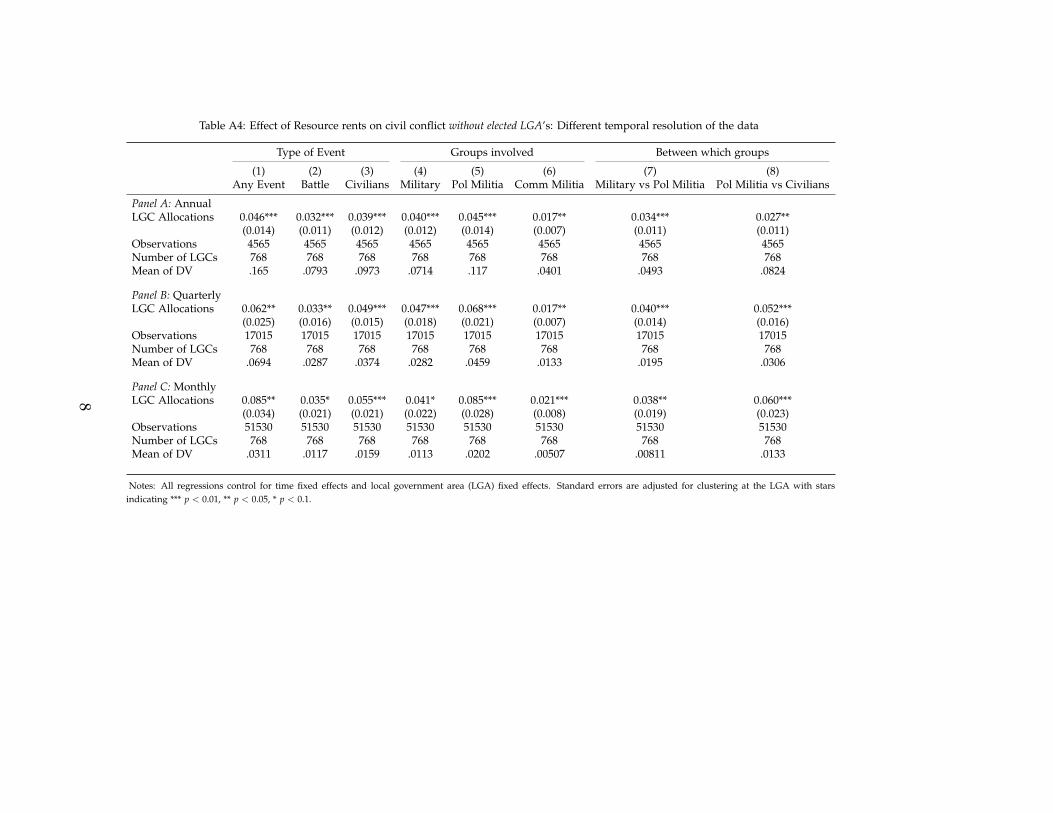
Table A4: Effect of Resource rents on civil conflict without elected LGA’s: Different temporal resolution of the data
Type of Event Groups involved Between which groups
(1) (2) (3) (4) (5) (6) (7) (8)Any Event Battle Civilians Military Pol Militia Comm Militia Military vs Pol Militia Pol Militia vs Civilians
Panel A: AnnualLGC Allocations 0.046*** 0.032*** 0.039*** 0.040*** 0.045*** 0.017** 0.034*** 0.027**
(0.014) (0.011) (0.012) (0.012) (0.014) (0.007) (0.011) (0.011)Observations 4565 4565 4565 4565 4565 4565 4565 4565Number of LGCs 768 768 768 768 768 768 768 768Mean of DV .165 .0793 .0973 .0714 .117 .0401 .0493 .0824
Panel B: QuarterlyLGC Allocations 0.062** 0.033** 0.049*** 0.047*** 0.068*** 0.017** 0.040*** 0.052***
(0.025) (0.016) (0.015) (0.018) (0.021) (0.007) (0.014) (0.016)Observations 17015 17015 17015 17015 17015 17015 17015 17015Number of LGCs 768 768 768 768 768 768 768 768Mean of DV .0694 .0287 .0374 .0282 .0459 .0133 .0195 .0306
Panel C: MonthlyLGC Allocations 0.085** 0.035* 0.055*** 0.041* 0.085*** 0.021*** 0.038** 0.060***
(0.034) (0.021) (0.021) (0.022) (0.028) (0.008) (0.019) (0.023)Observations 51530 51530 51530 51530 51530 51530 51530 51530Number of LGCs 768 768 768 768 768 768 768 768Mean of DV .0311 .0117 .0159 .0113 .0202 .00507 .00811 .0133
Notes: All regressions control for time fixed effects and local government area (LGA) fixed effects. Standard errors are adjusted for clustering at the LGA with starsindicating *** p < 0.01, ** p < 0.05, * p < 0.1.
8
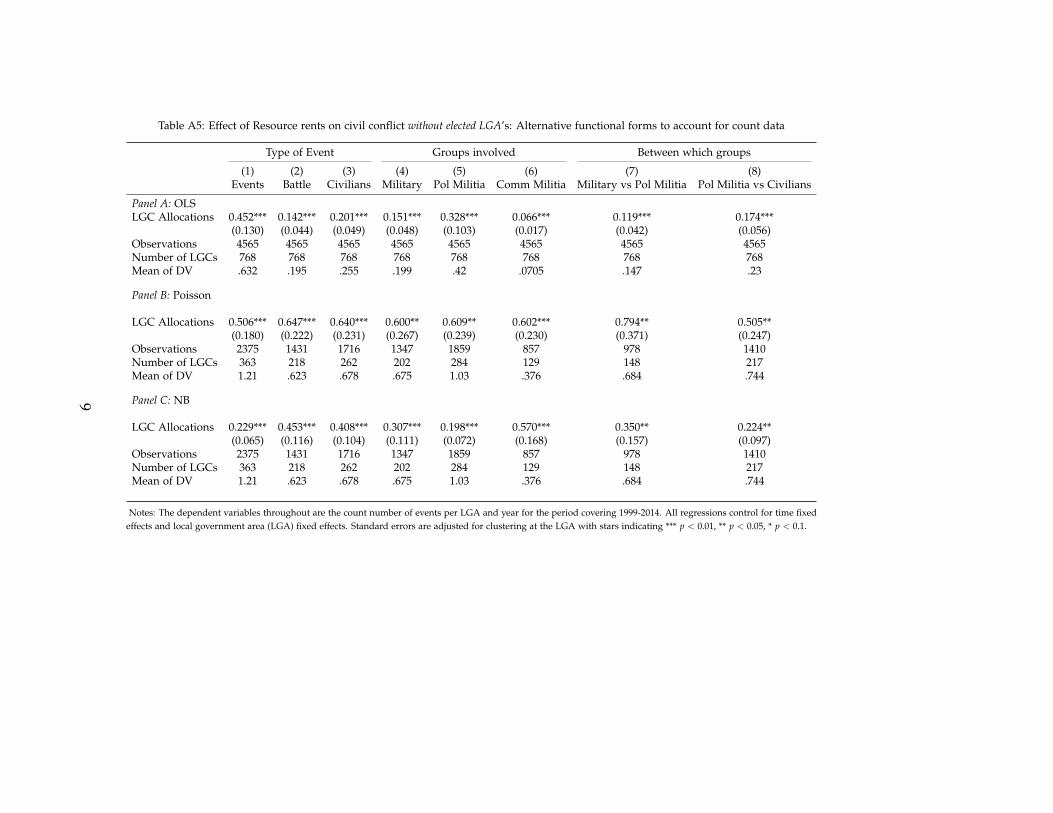
Table A5: Effect of Resource rents on civil conflict without elected LGA’s: Alternative functional forms to account for count data
Type of Event Groups involved Between which groups
(1) (2) (3) (4) (5) (6) (7) (8)Events Battle Civilians Military Pol Militia Comm Militia Military vs Pol Militia Pol Militia vs Civilians
Panel A: OLSLGC Allocations 0.452*** 0.142*** 0.201*** 0.151*** 0.328*** 0.066*** 0.119*** 0.174***
(0.130) (0.044) (0.049) (0.048) (0.103) (0.017) (0.042) (0.056)Observations 4565 4565 4565 4565 4565 4565 4565 4565Number of LGCs 768 768 768 768 768 768 768 768Mean of DV .632 .195 .255 .199 .42 .0705 .147 .23
Panel B: Poisson
LGC Allocations 0.506*** 0.647*** 0.640*** 0.600** 0.609** 0.602*** 0.794** 0.505**(0.180) (0.222) (0.231) (0.267) (0.239) (0.230) (0.371) (0.247)
Observations 2375 1431 1716 1347 1859 857 978 1410Number of LGCs 363 218 262 202 284 129 148 217Mean of DV 1.21 .623 .678 .675 1.03 .376 .684 .744
Panel C: NB
LGC Allocations 0.229*** 0.453*** 0.408*** 0.307*** 0.198*** 0.570*** 0.350** 0.224**(0.065) (0.116) (0.104) (0.111) (0.072) (0.168) (0.157) (0.097)
Observations 2375 1431 1716 1347 1859 857 978 1410Number of LGCs 363 218 262 202 284 129 148 217Mean of DV 1.21 .623 .678 .675 1.03 .376 .684 .744
Notes: The dependent variables throughout are the count number of events per LGA and year for the period covering 1999-2014. All regressions control for time fixedeffects and local government area (LGA) fixed effects. Standard errors are adjusted for clustering at the LGA with stars indicating *** p < 0.01, ** p < 0.05, * p < 0.1.
9
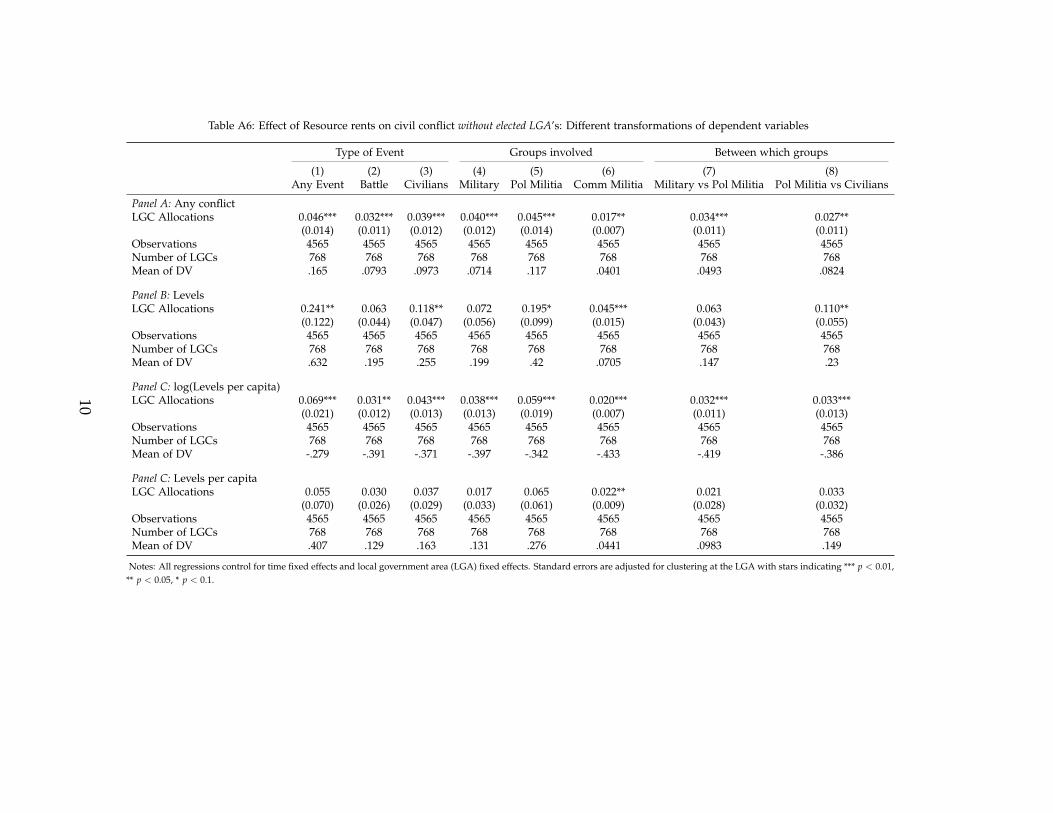
Table A6: Effect of Resource rents on civil conflict without elected LGA’s: Different transformations of dependent variables
Type of Event Groups involved Between which groups
(1) (2) (3) (4) (5) (6) (7) (8)Any Event Battle Civilians Military Pol Militia Comm Militia Military vs Pol Militia Pol Militia vs Civilians
Panel A: Any conflictLGC Allocations 0.046*** 0.032*** 0.039*** 0.040*** 0.045*** 0.017** 0.034*** 0.027**
(0.014) (0.011) (0.012) (0.012) (0.014) (0.007) (0.011) (0.011)Observations 4565 4565 4565 4565 4565 4565 4565 4565Number of LGCs 768 768 768 768 768 768 768 768Mean of DV .165 .0793 .0973 .0714 .117 .0401 .0493 .0824
Panel B: LevelsLGC Allocations 0.241** 0.063 0.118** 0.072 0.195* 0.045*** 0.063 0.110**
(0.122) (0.044) (0.047) (0.056) (0.099) (0.015) (0.043) (0.055)Observations 4565 4565 4565 4565 4565 4565 4565 4565Number of LGCs 768 768 768 768 768 768 768 768Mean of DV .632 .195 .255 .199 .42 .0705 .147 .23
Panel C: log(Levels per capita)LGC Allocations 0.069*** 0.031** 0.043*** 0.038*** 0.059*** 0.020*** 0.032*** 0.033***
(0.021) (0.012) (0.013) (0.013) (0.019) (0.007) (0.011) (0.013)Observations 4565 4565 4565 4565 4565 4565 4565 4565Number of LGCs 768 768 768 768 768 768 768 768Mean of DV -.279 -.391 -.371 -.397 -.342 -.433 -.419 -.386
Panel C: Levels per capitaLGC Allocations 0.055 0.030 0.037 0.017 0.065 0.022** 0.021 0.033
(0.070) (0.026) (0.029) (0.033) (0.061) (0.009) (0.028) (0.032)Observations 4565 4565 4565 4565 4565 4565 4565 4565Number of LGCs 768 768 768 768 768 768 768 768Mean of DV .407 .129 .163 .131 .276 .0441 .0983 .149
Notes: All regressions control for time fixed effects and local government area (LGA) fixed effects. Standard errors are adjusted for clustering at the LGA with stars indicating *** p < 0.01,** p < 0.05, * p < 0.1.
10

Table A7: LGA Extra Allocations and Conflict: Difference in Difference
Type of Event Groups involved Between which groups
(1) (2) (3) (4) (5) (6) (7) (8)Any Event Battle Civilians Military Pol Militia Comm Militia Military vs Pol Militia Pol Militia vs Civilians
Panel A: OLSLGC Extra Allocations 0.108** 0.048 0.042** 0.032 0.086*** 0.009 0.027 0.055**
(0.045) (0.030) (0.020) (0.022) (0.029) (0.013) (0.020) (0.024)Observations 49662 49662 49662 49662 49662 49662 49662 49662Number of LGCs 768 768 768 768 768 768 768 768Mean of DV .0292 .0112 .0152 .0108 .0191 .00495 .00767 .0127
Panel B: Reduced formTotal index × Oil price 4.714*** 1.908** 2.724*** 2.106** 3.519*** 0.956** 1.714** 2.155**
(1.445) (0.736) (0.836) (0.815) (1.167) (0.390) (0.713) (0.930)Observations 51154 51154 51154 51154 51154 51154 51154 51154Number of LGCs 768 768 768 768 768 768 768 768Mean of DV .031 .0117 .0158 .0112 .0201 .00506 .00805 .0133
Panel C: IVLGC Extra Allocations 0.843*** 0.319** 0.471** 0.395** 0.592** 0.196** 0.283** 0.367*
(0.317) (0.150) (0.183) (0.167) (0.241) (0.085) (0.137) (0.187)Kleibergen-Paap weak IV 22.69 22.69 22.69 22.69 22.69 22.69 22.69 22.69Observations 49662 49662 49662 49662 49662 49662 49662 49662Number of LGCs 768 768 768 768 768 768 768 768Mean of DV .0292 .0112 .0152 .0108 .0191 .00495 .00767 .0127
Notes: All regressions control for local government area (LGA) fixed effects and state by time fixed effects. Standard errors are adjusted for two way clustering by time and LGAwith stars indicating *** p < 0.01, ** p < 0.05, * p < 0.1.
11
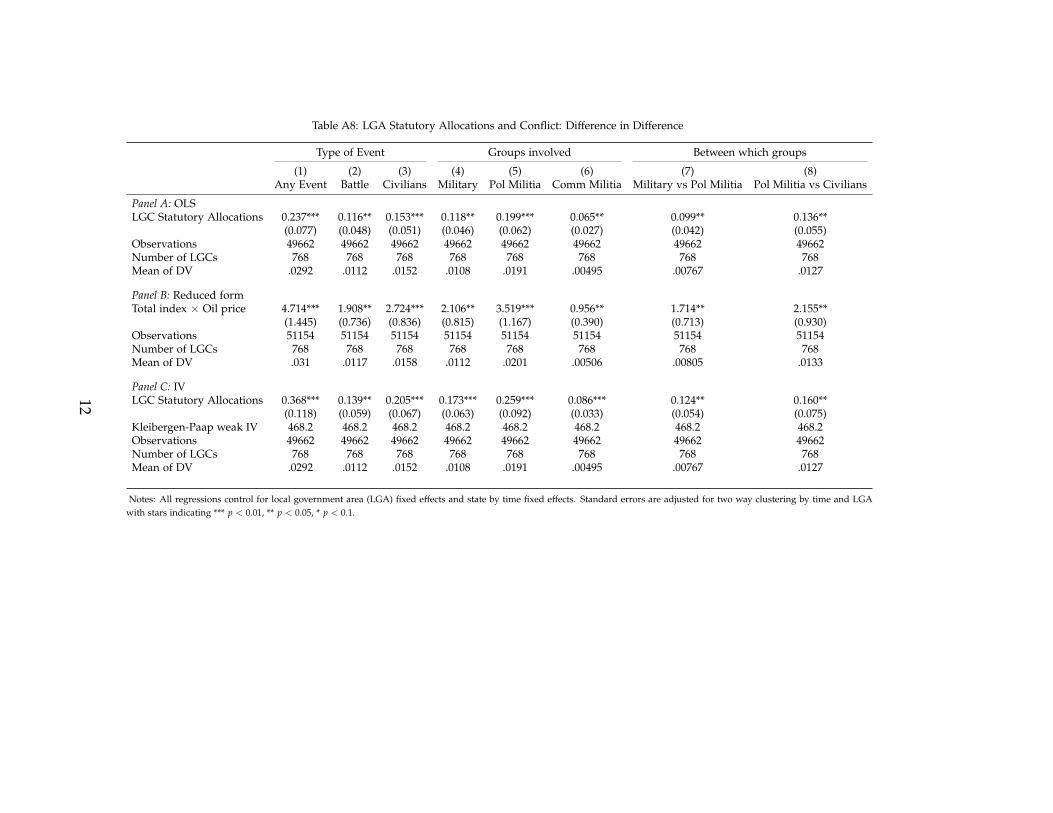
Table A8: LGA Statutory Allocations and Conflict: Difference in Difference
Type of Event Groups involved Between which groups
(1) (2) (3) (4) (5) (6) (7) (8)Any Event Battle Civilians Military Pol Militia Comm Militia Military vs Pol Militia Pol Militia vs Civilians
Panel A: OLSLGC Statutory Allocations 0.237*** 0.116** 0.153*** 0.118** 0.199*** 0.065** 0.099** 0.136**
(0.077) (0.048) (0.051) (0.046) (0.062) (0.027) (0.042) (0.055)Observations 49662 49662 49662 49662 49662 49662 49662 49662Number of LGCs 768 768 768 768 768 768 768 768Mean of DV .0292 .0112 .0152 .0108 .0191 .00495 .00767 .0127
Panel B: Reduced formTotal index × Oil price 4.714*** 1.908** 2.724*** 2.106** 3.519*** 0.956** 1.714** 2.155**
(1.445) (0.736) (0.836) (0.815) (1.167) (0.390) (0.713) (0.930)Observations 51154 51154 51154 51154 51154 51154 51154 51154Number of LGCs 768 768 768 768 768 768 768 768Mean of DV .031 .0117 .0158 .0112 .0201 .00506 .00805 .0133
Panel C: IVLGC Statutory Allocations 0.368*** 0.139** 0.205*** 0.173*** 0.259*** 0.086*** 0.124** 0.160**
(0.118) (0.059) (0.067) (0.063) (0.092) (0.033) (0.054) (0.075)Kleibergen-Paap weak IV 468.2 468.2 468.2 468.2 468.2 468.2 468.2 468.2Observations 49662 49662 49662 49662 49662 49662 49662 49662Number of LGCs 768 768 768 768 768 768 768 768Mean of DV .0292 .0112 .0152 .0108 .0191 .00495 .00767 .0127
Notes: All regressions control for local government area (LGA) fixed effects and state by time fixed effects. Standard errors are adjusted for two way clustering by time and LGAwith stars indicating *** p < 0.01, ** p < 0.05, * p < 0.1.
12

Table A9: Different temporal resolution of the data
Type of Event Groups involved Between which groups
(1) (2) (3) (4) (5) (6) (7) (8)Any Event Battle Civilians Military Pol Militia Comm Militia Military vs Pol Militia Pol Militia vs Civilians
Panel A: AnnualLGC Allocations 0.022*** 0.010* 0.024*** 0.025*** 0.021*** 0.001 0.018*** 0.017***
(0.007) (0.006) (0.006) (0.007) (0.007) (0.005) (0.006) (0.006)Elected × LGC Allocations -0.013*** -0.007** -0.013*** -0.013*** -0.015*** 0.002 -0.013*** -0.013***
(0.004) (0.003) (0.003) (0.003) (0.004) (0.003) (0.003) (0.003)Observations 12369 12369 12369 12369 12369 12369 12369 12369Number of LGCs 774 774 774 774 774 774 774 774Mean of DV .139 .0689 .079 .0599 .0889 .0415 .0366 .0614
Panel B: QuarterlyLGC Allocations 0.051*** 0.019** 0.034*** 0.039*** 0.050*** 0.005 0.029*** 0.034***
(0.014) (0.009) (0.010) (0.011) (0.013) (0.006) (0.008) (0.011)Elected × LGC Allocations -0.018** -0.014*** -0.019*** -0.017*** -0.030*** 0.001 -0.019*** -0.022***
(0.007) (0.005) (0.005) (0.006) (0.006) (0.003) (0.005) (0.005)Observations 49476 49476 49476 49476 49476 49476 49476 49476Number of LGCs 774 774 774 774 774 774 774 774Mean of DV .0566 .0236 .0287 .0218 .0327 .0134 .0127 .0212
Panel C: MonthlyLGC Allocations 0.082*** 0.018 0.040*** 0.042*** 0.056*** 0.006 0.026*** 0.038***
(0.023) (0.012) (0.013) (0.015) (0.018) (0.007) (0.009) (0.015)Elected × LGC Allocations -0.019** -0.013** -0.022*** -0.012** -0.032*** -0.001 -0.017*** -0.025***
(0.009) (0.006) (0.006) (0.006) (0.007) (0.003) (0.005) (0.006)Observations 148428 148428 148428 148428 148428 148428 148428 148428Number of LGCs 774 774 774 774 774 774 774 774Mean of DV .0251 .0093 .0116 .0087 .0137 .00519 .00509 .00862
Notes: All regressions control for time fixed effects and local government area (LGA) fixed effects. Standard errors are adjusted for clustering at the LGA with stars indicating ***p < 0.01, ** p < 0.05, * p < 0.1.
13
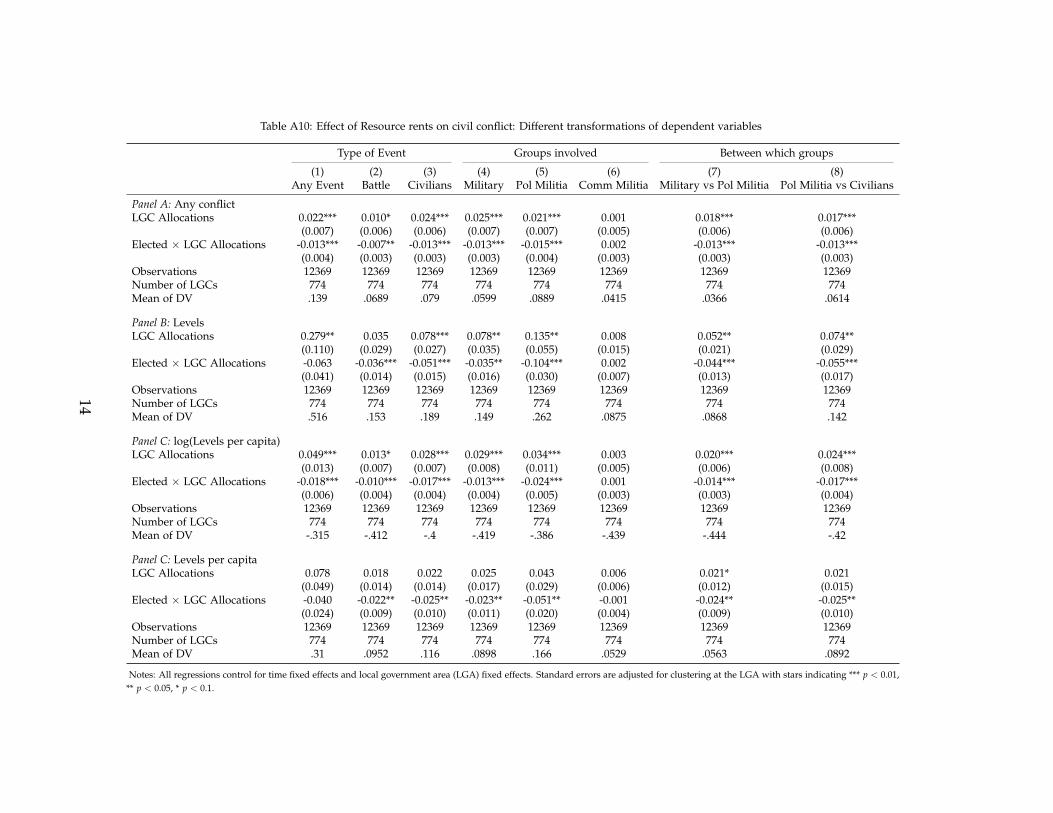
Table A10: Effect of Resource rents on civil conflict: Different transformations of dependent variables
Type of Event Groups involved Between which groups
(1) (2) (3) (4) (5) (6) (7) (8)Any Event Battle Civilians Military Pol Militia Comm Militia Military vs Pol Militia Pol Militia vs Civilians
Panel A: Any conflictLGC Allocations 0.022*** 0.010* 0.024*** 0.025*** 0.021*** 0.001 0.018*** 0.017***
(0.007) (0.006) (0.006) (0.007) (0.007) (0.005) (0.006) (0.006)Elected × LGC Allocations -0.013*** -0.007** -0.013*** -0.013*** -0.015*** 0.002 -0.013*** -0.013***
(0.004) (0.003) (0.003) (0.003) (0.004) (0.003) (0.003) (0.003)Observations 12369 12369 12369 12369 12369 12369 12369 12369Number of LGCs 774 774 774 774 774 774 774 774Mean of DV .139 .0689 .079 .0599 .0889 .0415 .0366 .0614
Panel B: LevelsLGC Allocations 0.279** 0.035 0.078*** 0.078** 0.135** 0.008 0.052** 0.074**
(0.110) (0.029) (0.027) (0.035) (0.055) (0.015) (0.021) (0.029)Elected × LGC Allocations -0.063 -0.036*** -0.051*** -0.035** -0.104*** 0.002 -0.044*** -0.055***
(0.041) (0.014) (0.015) (0.016) (0.030) (0.007) (0.013) (0.017)Observations 12369 12369 12369 12369 12369 12369 12369 12369Number of LGCs 774 774 774 774 774 774 774 774Mean of DV .516 .153 .189 .149 .262 .0875 .0868 .142
Panel C: log(Levels per capita)LGC Allocations 0.049*** 0.013* 0.028*** 0.029*** 0.034*** 0.003 0.020*** 0.024***
(0.013) (0.007) (0.007) (0.008) (0.011) (0.005) (0.006) (0.008)Elected × LGC Allocations -0.018*** -0.010*** -0.017*** -0.013*** -0.024*** 0.001 -0.014*** -0.017***
(0.006) (0.004) (0.004) (0.004) (0.005) (0.003) (0.003) (0.004)Observations 12369 12369 12369 12369 12369 12369 12369 12369Number of LGCs 774 774 774 774 774 774 774 774Mean of DV -.315 -.412 -.4 -.419 -.386 -.439 -.444 -.42
Panel C: Levels per capitaLGC Allocations 0.078 0.018 0.022 0.025 0.043 0.006 0.021* 0.021
(0.049) (0.014) (0.014) (0.017) (0.029) (0.006) (0.012) (0.015)Elected × LGC Allocations -0.040 -0.022** -0.025** -0.023** -0.051** -0.001 -0.024** -0.025**
(0.024) (0.009) (0.010) (0.011) (0.020) (0.004) (0.009) (0.010)Observations 12369 12369 12369 12369 12369 12369 12369 12369Number of LGCs 774 774 774 774 774 774 774 774Mean of DV .31 .0952 .116 .0898 .166 .0529 .0563 .0892
Notes: All regressions control for time fixed effects and local government area (LGA) fixed effects. Standard errors are adjusted for clustering at the LGA with stars indicating *** p < 0.01,** p < 0.05, * p < 0.1.
14
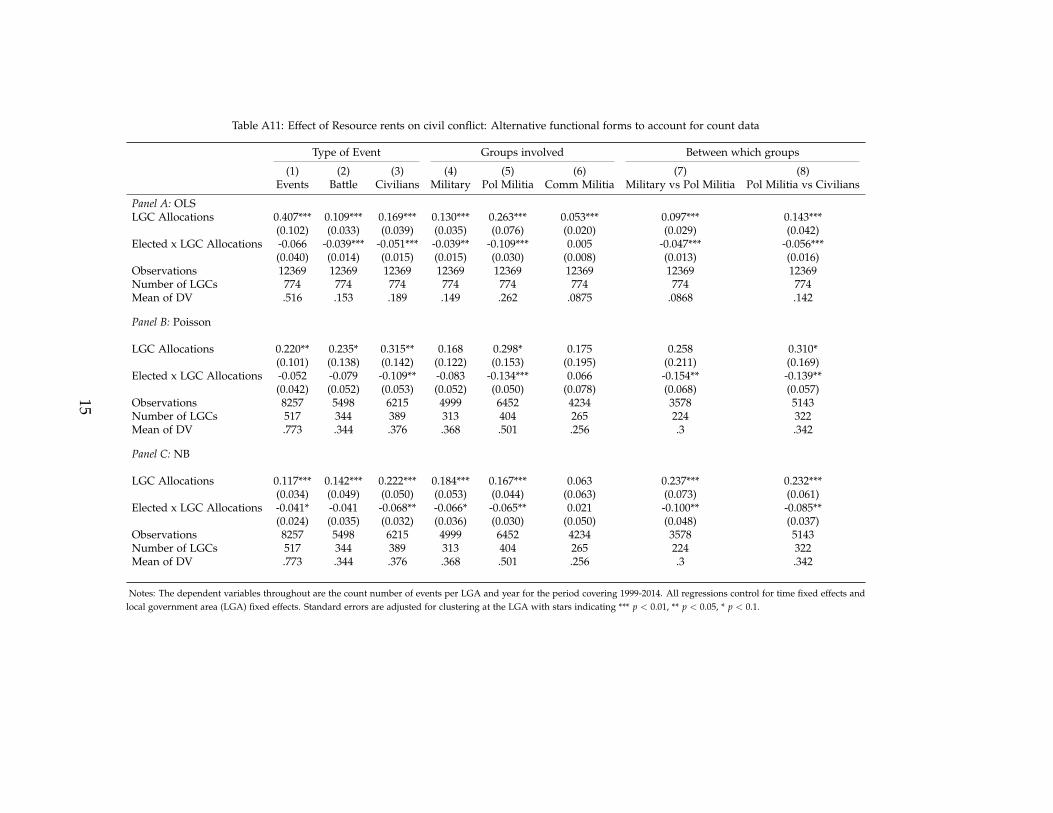
Table A11: Effect of Resource rents on civil conflict: Alternative functional forms to account for count data
Type of Event Groups involved Between which groups
(1) (2) (3) (4) (5) (6) (7) (8)Events Battle Civilians Military Pol Militia Comm Militia Military vs Pol Militia Pol Militia vs Civilians
Panel A: OLSLGC Allocations 0.407*** 0.109*** 0.169*** 0.130*** 0.263*** 0.053*** 0.097*** 0.143***
(0.102) (0.033) (0.039) (0.035) (0.076) (0.020) (0.029) (0.042)Elected x LGC Allocations -0.066 -0.039*** -0.051*** -0.039** -0.109*** 0.005 -0.047*** -0.056***
(0.040) (0.014) (0.015) (0.015) (0.030) (0.008) (0.013) (0.016)Observations 12369 12369 12369 12369 12369 12369 12369 12369Number of LGCs 774 774 774 774 774 774 774 774Mean of DV .516 .153 .189 .149 .262 .0875 .0868 .142
Panel B: Poisson
LGC Allocations 0.220** 0.235* 0.315** 0.168 0.298* 0.175 0.258 0.310*(0.101) (0.138) (0.142) (0.122) (0.153) (0.195) (0.211) (0.169)
Elected x LGC Allocations -0.052 -0.079 -0.109** -0.083 -0.134*** 0.066 -0.154** -0.139**(0.042) (0.052) (0.053) (0.052) (0.050) (0.078) (0.068) (0.057)
Observations 8257 5498 6215 4999 6452 4234 3578 5143Number of LGCs 517 344 389 313 404 265 224 322Mean of DV .773 .344 .376 .368 .501 .256 .3 .342
Panel C: NB
LGC Allocations 0.117*** 0.142*** 0.222*** 0.184*** 0.167*** 0.063 0.237*** 0.232***(0.034) (0.049) (0.050) (0.053) (0.044) (0.063) (0.073) (0.061)
Elected x LGC Allocations -0.041* -0.041 -0.068** -0.066* -0.065** 0.021 -0.100** -0.085**(0.024) (0.035) (0.032) (0.036) (0.030) (0.050) (0.048) (0.037)
Observations 8257 5498 6215 4999 6452 4234 3578 5143Number of LGCs 517 344 389 313 404 265 224 322Mean of DV .773 .344 .376 .368 .501 .256 .3 .342
Notes: The dependent variables throughout are the count number of events per LGA and year for the period covering 1999-2014. All regressions control for time fixed effects andlocal government area (LGA) fixed effects. Standard errors are adjusted for clustering at the LGA with stars indicating *** p < 0.01, ** p < 0.05, * p < 0.1.
15
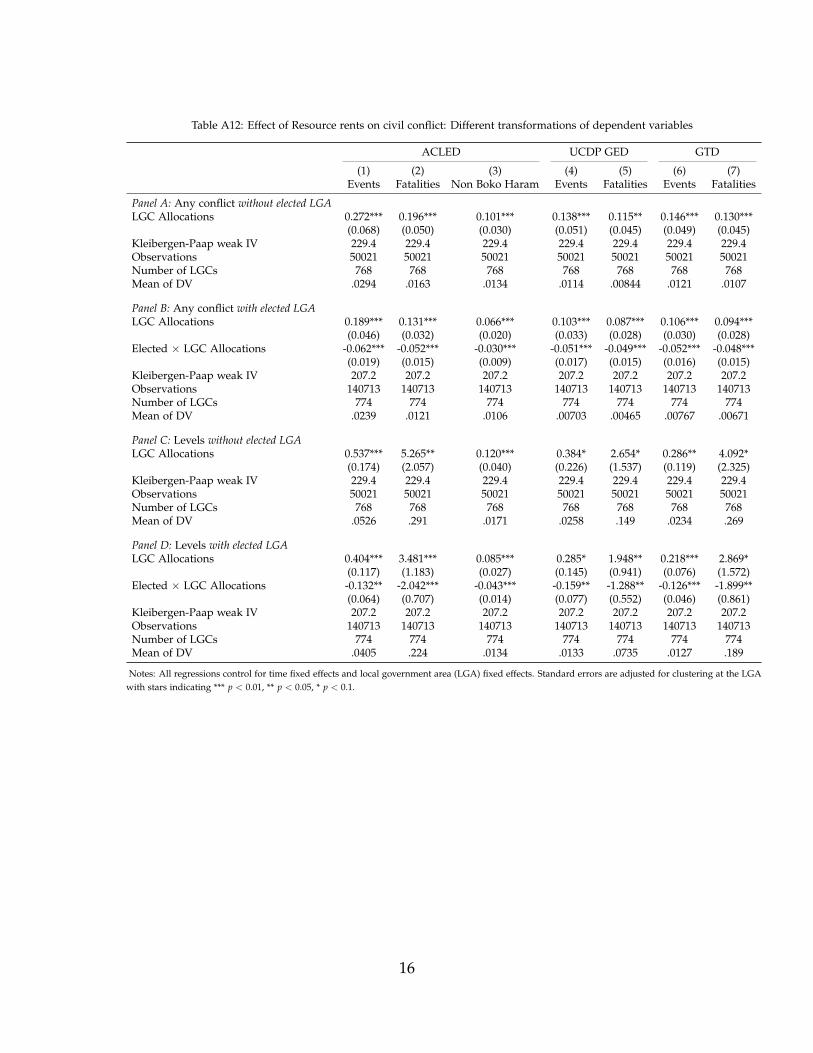
Table A12: Effect of Resource rents on civil conflict: Different transformations of dependent variables
ACLED UCDP GED GTD
(1) (2) (3) (4) (5) (6) (7)Events Fatalities Non Boko Haram Events Fatalities Events Fatalities
Panel A: Any conflict without elected LGALGC Allocations 0.272*** 0.196*** 0.101*** 0.138*** 0.115** 0.146*** 0.130***
(0.068) (0.050) (0.030) (0.051) (0.045) (0.049) (0.045)Kleibergen-Paap weak IV 229.4 229.4 229.4 229.4 229.4 229.4 229.4Observations 50021 50021 50021 50021 50021 50021 50021Number of LGCs 768 768 768 768 768 768 768Mean of DV .0294 .0163 .0134 .0114 .00844 .0121 .0107
Panel B: Any conflict with elected LGALGC Allocations 0.189*** 0.131*** 0.066*** 0.103*** 0.087*** 0.106*** 0.094***
(0.046) (0.032) (0.020) (0.033) (0.028) (0.030) (0.028)Elected × LGC Allocations -0.062*** -0.052*** -0.030*** -0.051*** -0.049*** -0.052*** -0.048***
(0.019) (0.015) (0.009) (0.017) (0.015) (0.016) (0.015)Kleibergen-Paap weak IV 207.2 207.2 207.2 207.2 207.2 207.2 207.2Observations 140713 140713 140713 140713 140713 140713 140713Number of LGCs 774 774 774 774 774 774 774Mean of DV .0239 .0121 .0106 .00703 .00465 .00767 .00671
Panel C: Levels without elected LGALGC Allocations 0.537*** 5.265** 0.120*** 0.384* 2.654* 0.286** 4.092*
(0.174) (2.057) (0.040) (0.226) (1.537) (0.119) (2.325)Kleibergen-Paap weak IV 229.4 229.4 229.4 229.4 229.4 229.4 229.4Observations 50021 50021 50021 50021 50021 50021 50021Number of LGCs 768 768 768 768 768 768 768Mean of DV .0526 .291 .0171 .0258 .149 .0234 .269
Panel D: Levels with elected LGALGC Allocations 0.404*** 3.481*** 0.085*** 0.285* 1.948** 0.218*** 2.869*
(0.117) (1.183) (0.027) (0.145) (0.941) (0.076) (1.572)Elected × LGC Allocations -0.132** -2.042*** -0.043*** -0.159** -1.288** -0.126*** -1.899**
(0.064) (0.707) (0.014) (0.077) (0.552) (0.046) (0.861)Kleibergen-Paap weak IV 207.2 207.2 207.2 207.2 207.2 207.2 207.2Observations 140713 140713 140713 140713 140713 140713 140713Number of LGCs 774 774 774 774 774 774 774Mean of DV .0405 .224 .0134 .0133 .0735 .0127 .189
Notes: All regressions control for time fixed effects and local government area (LGA) fixed effects. Standard errors are adjusted for clustering at the LGAwith stars indicating *** p < 0.01, ** p < 0.05, * p < 0.1.
16

Table A13: LGA Extra Allocations and Conflict: Difference in Difference
Type of Event Groups involved Between which groups
(1) (2) (3) (4) (5) (6) (7) (8)Any Event Battle Civilians Military Pol Militia Comm Militia Military vs Pol Militia Pol Militia vs Civilians
Panel A: OLSLGC Extra Allocations 0.119** 0.058** 0.053** 0.045** 0.109*** 0.000 0.041** 0.064**
(0.046) (0.025) (0.022) (0.022) (0.034) (0.009) (0.020) (0.028)Elected × LGC Extra Allocations -0.089** -0.056 -0.040** -0.050* -0.102*** -0.006 -0.058** -0.051**
(0.038) (0.034) (0.017) (0.027) (0.036) (0.010) (0.024) (0.023)Observations 140713 140713 140713 140713 140713 140713 140713 140713Number of LGCs 774 774 774 774 774 774 774 774Mean of DV .0239 .00906 .0112 .0084 .0133 .00491 .00487 .00828
Panel B: Reduced formTotal index × Oil price 3.780*** 1.478*** 2.252*** 1.571** 3.074*** 0.607** 1.327** 1.992***
(1.168) (0.553) (0.624) (0.651) (0.908) (0.296) (0.542) (0.706)Elected × Total index × Oil price -1.600** -0.623 -0.859** -0.563 -1.530*** -0.318* -0.800** -1.024**
(0.629) (0.387) (0.417) (0.405) (0.536) (0.181) (0.343) (0.457)Observations 148428 148428 148428 148428 148428 148428 148428 148428Number of LGCs 774 774 774 774 774 774 774 774Mean of DV .0251 .0093 .0116 .0087 .0137 .00519 .00509 .00862
Panel C: IVLGC Extra Allocations 0.620*** 0.226** 0.357*** 0.262** 0.501*** 0.118** 0.218** 0.334**
(0.212) (0.104) (0.122) (0.115) (0.170) (0.056) (0.096) (0.136)Elected × LGC Extra Allocations -0.323** -0.142 -0.163* -0.148* -0.314*** -0.086* -0.174** -0.211**
(0.139) (0.088) (0.093) (0.087) (0.117) (0.046) (0.074) (0.102)Kleibergen-Paap weak IV 23.95 23.95 23.95 23.95 23.95 23.95 23.95 23.95Observations 140713 140713 140713 140713 140713 140713 140713 140713Number of LGCs 774 774 774 774 774 774 774 774Mean of DV .0239 .00906 .0112 .0084 .0133 .00491 .00487 .00828
Notes: All regressions control for local government area (LGA) fixed effects and state by time fixed effects. Standard errors are adjusted for two way clustering by time and LGA with starsindicating *** p < 0.01, ** p < 0.05, * p < 0.1.
17
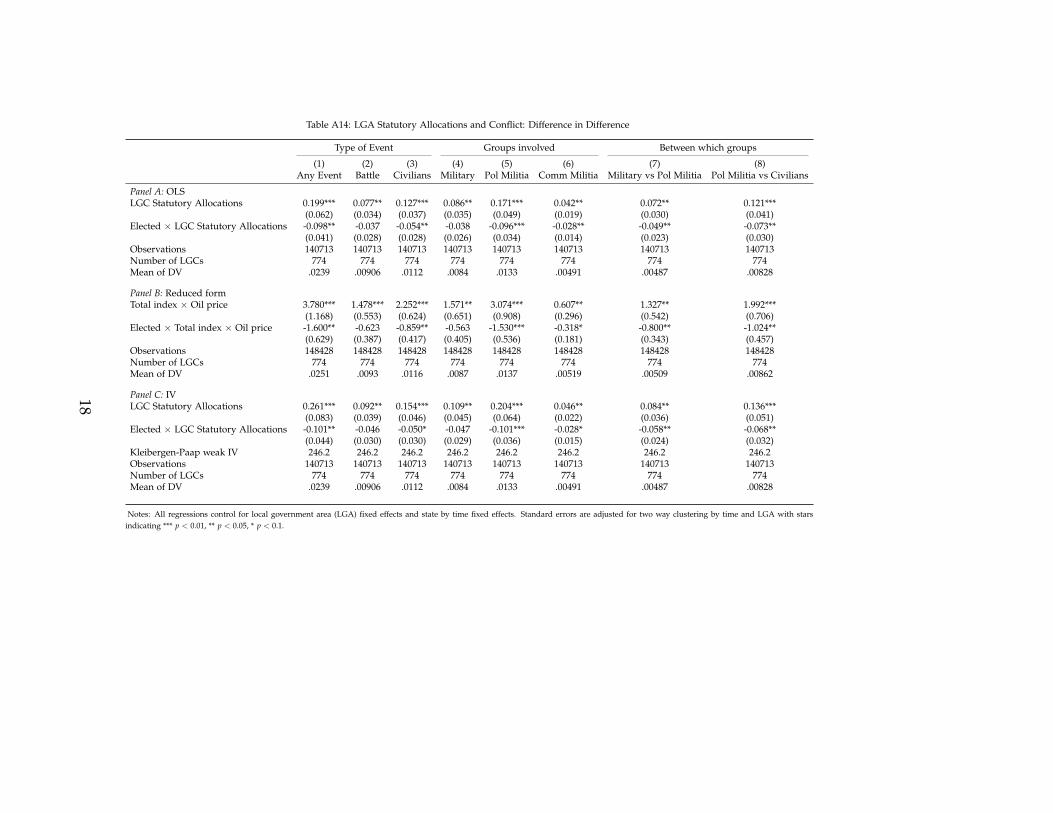
Table A14: LGA Statutory Allocations and Conflict: Difference in Difference
Type of Event Groups involved Between which groups
(1) (2) (3) (4) (5) (6) (7) (8)Any Event Battle Civilians Military Pol Militia Comm Militia Military vs Pol Militia Pol Militia vs Civilians
Panel A: OLSLGC Statutory Allocations 0.199*** 0.077** 0.127*** 0.086** 0.171*** 0.042** 0.072** 0.121***
(0.062) (0.034) (0.037) (0.035) (0.049) (0.019) (0.030) (0.041)Elected × LGC Statutory Allocations -0.098** -0.037 -0.054** -0.038 -0.096*** -0.028** -0.049** -0.073**
(0.041) (0.028) (0.028) (0.026) (0.034) (0.014) (0.023) (0.030)Observations 140713 140713 140713 140713 140713 140713 140713 140713Number of LGCs 774 774 774 774 774 774 774 774Mean of DV .0239 .00906 .0112 .0084 .0133 .00491 .00487 .00828
Panel B: Reduced formTotal index × Oil price 3.780*** 1.478*** 2.252*** 1.571** 3.074*** 0.607** 1.327** 1.992***
(1.168) (0.553) (0.624) (0.651) (0.908) (0.296) (0.542) (0.706)Elected × Total index × Oil price -1.600** -0.623 -0.859** -0.563 -1.530*** -0.318* -0.800** -1.024**
(0.629) (0.387) (0.417) (0.405) (0.536) (0.181) (0.343) (0.457)Observations 148428 148428 148428 148428 148428 148428 148428 148428Number of LGCs 774 774 774 774 774 774 774 774Mean of DV .0251 .0093 .0116 .0087 .0137 .00519 .00509 .00862
Panel C: IVLGC Statutory Allocations 0.261*** 0.092** 0.154*** 0.109** 0.204*** 0.046** 0.084** 0.136***
(0.083) (0.039) (0.046) (0.045) (0.064) (0.022) (0.036) (0.051)Elected × LGC Statutory Allocations -0.101** -0.046 -0.050* -0.047 -0.101*** -0.028* -0.058** -0.068**
(0.044) (0.030) (0.030) (0.029) (0.036) (0.015) (0.024) (0.032)Kleibergen-Paap weak IV 246.2 246.2 246.2 246.2 246.2 246.2 246.2 246.2Observations 140713 140713 140713 140713 140713 140713 140713 140713Number of LGCs 774 774 774 774 774 774 774 774Mean of DV .0239 .00906 .0112 .0084 .0133 .00491 .00487 .00828
Notes: All regressions control for local government area (LGA) fixed effects and state by time fixed effects. Standard errors are adjusted for two way clustering by time and LGA with starsindicating *** p < 0.01, ** p < 0.05, * p < 0.1.
18
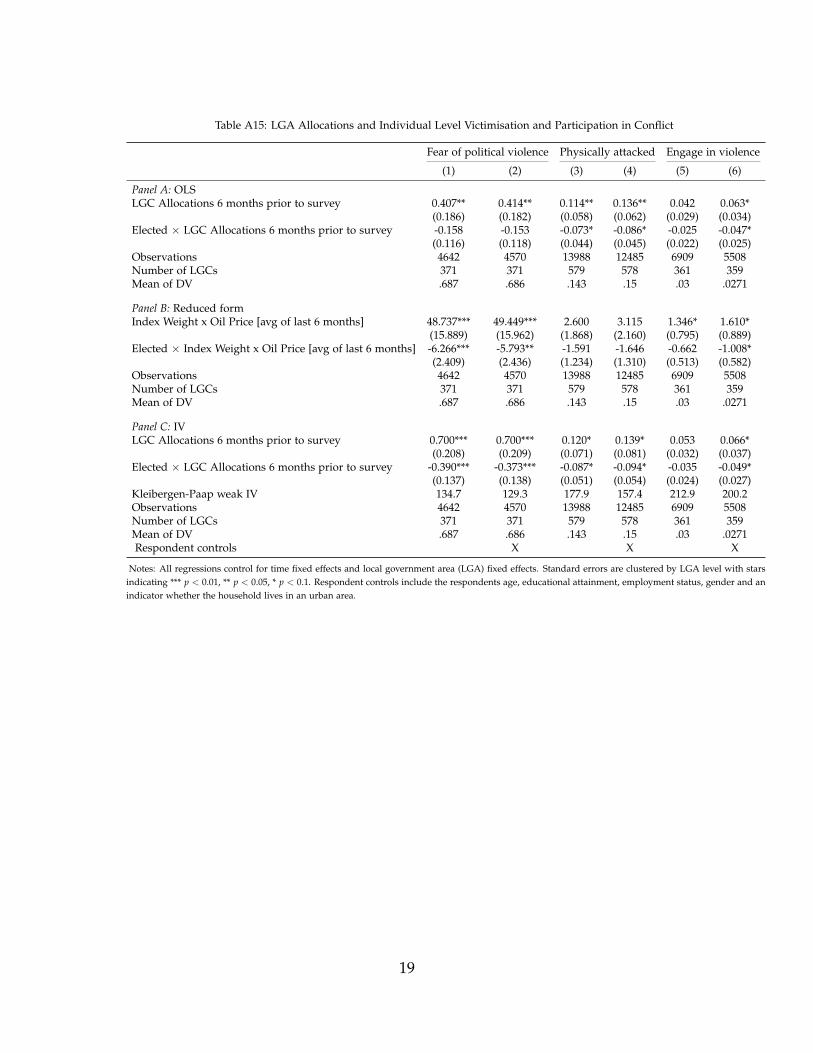
Table A15: LGA Allocations and Individual Level Victimisation and Participation in Conflict
Fear of political violence Physically attacked Engage in violence
(1) (2) (3) (4) (5) (6)
Panel A: OLSLGC Allocations 6 months prior to survey 0.407** 0.414** 0.114** 0.136** 0.042 0.063*
(0.186) (0.182) (0.058) (0.062) (0.029) (0.034)Elected × LGC Allocations 6 months prior to survey -0.158 -0.153 -0.073* -0.086* -0.025 -0.047*
(0.116) (0.118) (0.044) (0.045) (0.022) (0.025)Observations 4642 4570 13988 12485 6909 5508Number of LGCs 371 371 579 578 361 359Mean of DV .687 .686 .143 .15 .03 .0271
Panel B: Reduced formIndex Weight x Oil Price [avg of last 6 months] 48.737*** 49.449*** 2.600 3.115 1.346* 1.610*
(15.889) (15.962) (1.868) (2.160) (0.795) (0.889)Elected × Index Weight x Oil Price [avg of last 6 months] -6.266*** -5.793** -1.591 -1.646 -0.662 -1.008*
(2.409) (2.436) (1.234) (1.310) (0.513) (0.582)Observations 4642 4570 13988 12485 6909 5508Number of LGCs 371 371 579 578 361 359Mean of DV .687 .686 .143 .15 .03 .0271
Panel C: IVLGC Allocations 6 months prior to survey 0.700*** 0.700*** 0.120* 0.139* 0.053 0.066*
(0.208) (0.209) (0.071) (0.081) (0.032) (0.037)Elected × LGC Allocations 6 months prior to survey -0.390*** -0.373*** -0.087* -0.094* -0.035 -0.049*
(0.137) (0.138) (0.051) (0.054) (0.024) (0.027)Kleibergen-Paap weak IV 134.7 129.3 177.9 157.4 212.9 200.2Observations 4642 4570 13988 12485 6909 5508Number of LGCs 371 371 579 578 361 359Mean of DV .687 .686 .143 .15 .03 .0271Respondent controls X X X
Notes: All regressions control for time fixed effects and local government area (LGA) fixed effects. Standard errors are clustered by LGA level with starsindicating *** p < 0.01, ** p < 0.05, * p < 0.1. Respondent controls include the respondents age, educational attainment, employment status, gender and anindicator whether the household lives in an urban area.
19
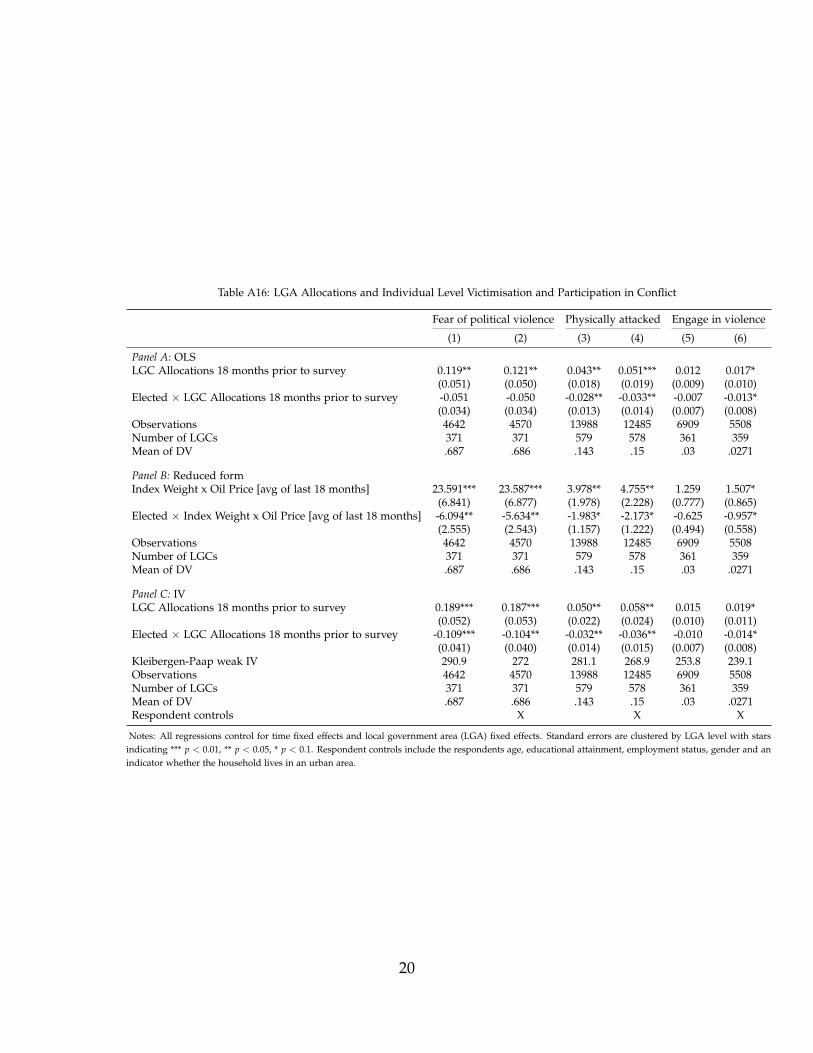
Table A16: LGA Allocations and Individual Level Victimisation and Participation in Conflict
Fear of political violence Physically attacked Engage in violence
(1) (2) (3) (4) (5) (6)
Panel A: OLSLGC Allocations 18 months prior to survey 0.119** 0.121** 0.043** 0.051*** 0.012 0.017*
(0.051) (0.050) (0.018) (0.019) (0.009) (0.010)Elected × LGC Allocations 18 months prior to survey -0.051 -0.050 -0.028** -0.033** -0.007 -0.013*
(0.034) (0.034) (0.013) (0.014) (0.007) (0.008)Observations 4642 4570 13988 12485 6909 5508Number of LGCs 371 371 579 578 361 359Mean of DV .687 .686 .143 .15 .03 .0271
Panel B: Reduced formIndex Weight x Oil Price [avg of last 18 months] 23.591*** 23.587*** 3.978** 4.755** 1.259 1.507*
(6.841) (6.877) (1.978) (2.228) (0.777) (0.865)Elected × Index Weight x Oil Price [avg of last 18 months] -6.094** -5.634** -1.983* -2.173* -0.625 -0.957*
(2.555) (2.543) (1.157) (1.222) (0.494) (0.558)Observations 4642 4570 13988 12485 6909 5508Number of LGCs 371 371 579 578 361 359Mean of DV .687 .686 .143 .15 .03 .0271
Panel C: IVLGC Allocations 18 months prior to survey 0.189*** 0.187*** 0.050** 0.058** 0.015 0.019*
(0.052) (0.053) (0.022) (0.024) (0.010) (0.011)Elected × LGC Allocations 18 months prior to survey -0.109*** -0.104** -0.032** -0.036** -0.010 -0.014*
(0.041) (0.040) (0.014) (0.015) (0.007) (0.008)Kleibergen-Paap weak IV 290.9 272 281.1 268.9 253.8 239.1Observations 4642 4570 13988 12485 6909 5508Number of LGCs 371 371 579 578 361 359Mean of DV .687 .686 .143 .15 .03 .0271Respondent controls X X X
Notes: All regressions control for time fixed effects and local government area (LGA) fixed effects. Standard errors are clustered by LGA level with starsindicating *** p < 0.01, ** p < 0.05, * p < 0.1. Respondent controls include the respondents age, educational attainment, employment status, gender and anindicator whether the household lives in an urban area.
20
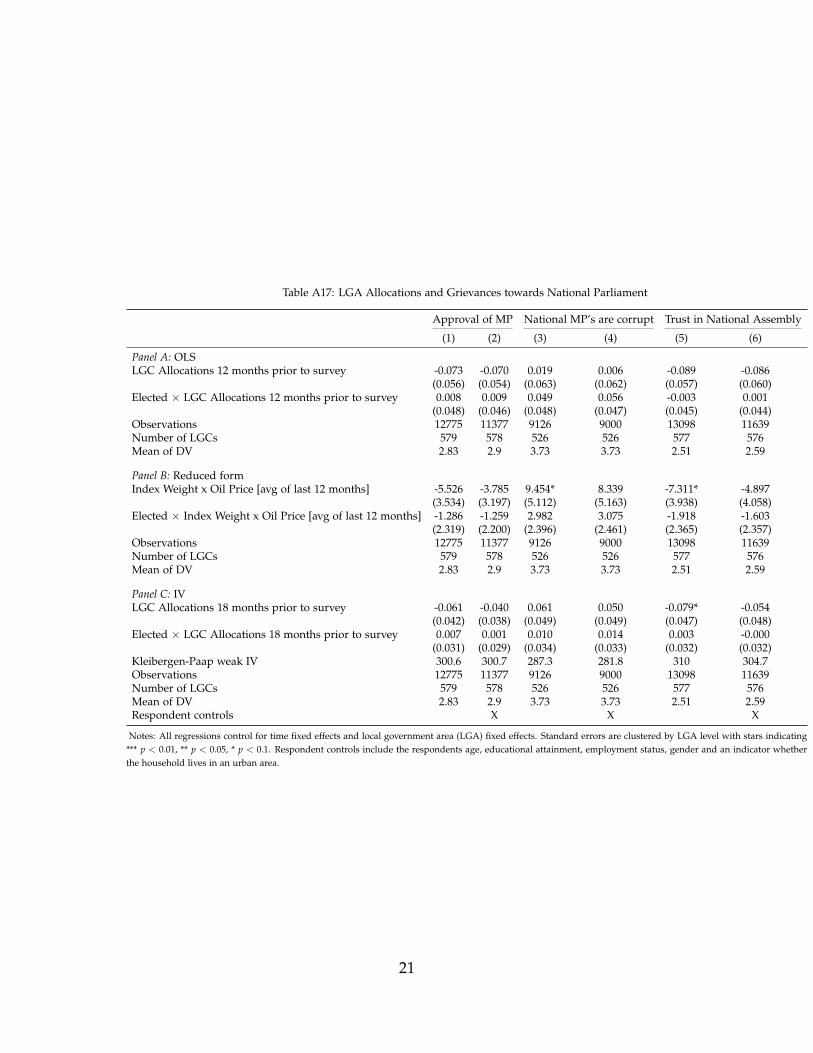
Table A17: LGA Allocations and Grievances towards National Parliament
Approval of MP National MP’s are corrupt Trust in National Assembly
(1) (2) (3) (4) (5) (6)
Panel A: OLSLGC Allocations 12 months prior to survey -0.073 -0.070 0.019 0.006 -0.089 -0.086
(0.056) (0.054) (0.063) (0.062) (0.057) (0.060)Elected × LGC Allocations 12 months prior to survey 0.008 0.009 0.049 0.056 -0.003 0.001
(0.048) (0.046) (0.048) (0.047) (0.045) (0.044)Observations 12775 11377 9126 9000 13098 11639Number of LGCs 579 578 526 526 577 576Mean of DV 2.83 2.9 3.73 3.73 2.51 2.59
Panel B: Reduced formIndex Weight x Oil Price [avg of last 12 months] -5.526 -3.785 9.454* 8.339 -7.311* -4.897
(3.534) (3.197) (5.112) (5.163) (3.938) (4.058)Elected × Index Weight x Oil Price [avg of last 12 months] -1.286 -1.259 2.982 3.075 -1.918 -1.603
(2.319) (2.200) (2.396) (2.461) (2.365) (2.357)Observations 12775 11377 9126 9000 13098 11639Number of LGCs 579 578 526 526 577 576Mean of DV 2.83 2.9 3.73 3.73 2.51 2.59
Panel C: IVLGC Allocations 18 months prior to survey -0.061 -0.040 0.061 0.050 -0.079* -0.054
(0.042) (0.038) (0.049) (0.049) (0.047) (0.048)Elected × LGC Allocations 18 months prior to survey 0.007 0.001 0.010 0.014 0.003 -0.000
(0.031) (0.029) (0.034) (0.033) (0.032) (0.032)Kleibergen-Paap weak IV 300.6 300.7 287.3 281.8 310 304.7Observations 12775 11377 9126 9000 13098 11639Number of LGCs 579 578 526 526 577 576Mean of DV 2.83 2.9 3.73 3.73 2.51 2.59Respondent controls X X X
Notes: All regressions control for time fixed effects and local government area (LGA) fixed effects. Standard errors are clustered by LGA level with stars indicating*** p < 0.01, ** p < 0.05, * p < 0.1. Respondent controls include the respondents age, educational attainment, employment status, gender and an indicator whetherthe household lives in an urban area.
21