ambition of renewable energy targets for the eu … · 1 / ©ecofys, a navigant company. all rights...
TRANSCRIPT
/ ©ECOFYS, A NAVIGANT COMPANY. ALL RIGHTS RESERVED1
CONCLUSIONS FROM THE REPORT
“BENCHMARKS FOR A MORE AMBITIOUS
EU 2030 RENEWABLES TARGET”
COMMISSIONED BY EREF
AMBITION OF RENEWABLE
ENERGY TARGETS FOR THE
EU IN 2030
CORINNA KLESSMANN
17 OCTOBER 2017

/ ©ECOFYS, A NAVIGANT COMPANY. ALL RIGHTS RESERVED2 / ©2016 NAVIGANT CONSULTING, INC. ALL RIGHTS RESERVED22 / ©ECOFYS, A NAVIGANT COMPANY. ALL RIGHTS RESERVED
AIM OF THE REPORT: INFORM DEBATE ABOUT
EUROPEAN RES TARGETS FOR 2030
Two main points of criticism have been raised regarding the proposed EU
2030 energy efficiency and renewable energy target (30% EE / 27% RES):
1. Targets are considered too low to achieve EU long-term targets, i.e. cutting GHG
emissions by 80-95% below 1990 levels by 2050. EP rapporteurs propose higher
targets (governance: 40%EE / 45 %RES; RED: 35% RES)
2. Governance of EU-level RES target: EU-level target achievement depends on
Member State actions. National targets would make the EU target more reliable.
Pledge approach requires benchmarks to assess whether contributions are adequate.
/ ©ECOFYS, A NAVIGANT COMPANY. ALL RIGHTS RESERVED3 / ©2016 NAVIGANT CONSULTING, INC. ALL RIGHTS RESERVED33 / ©ECOFYS, A NAVIGANT COMPANY. ALL RIGHTS RESERVED
AIM OF THE REPORT: INFORM DEBATE ABOUT
EUROPEAN RES-TARGETS FOR 2030
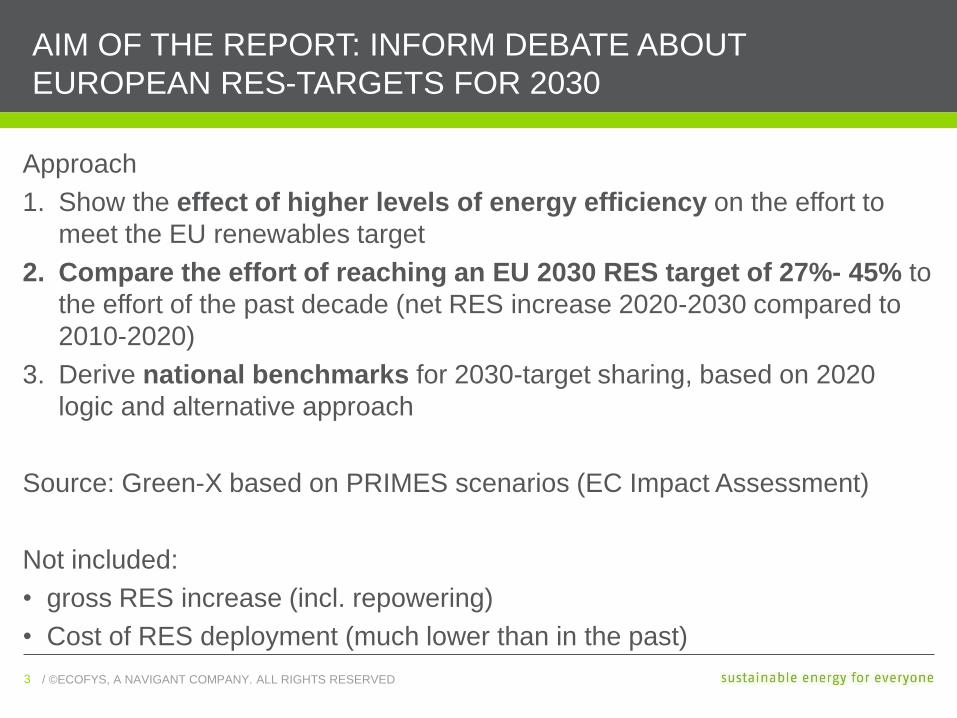
Approach
1. Show the effect of higher levels of energy efficiency on the effort to
meet the EU renewables target
2. Compare the effort of reaching an EU 2030 RES target of 27%- 45% to
the effort of the past decade (net RES increase 2020-2030 compared to
2010-2020)
3. Derive national benchmarks for 2030-target sharing, based on 2020
logic and alternative approach
Source: Green-X based on PRIMES scenarios (EC Impact Assessment)
Not included:
• gross RES increase (incl. repowering)
• Cost of RES deployment (much lower than in the past)

/ ©ECOFYS, A NAVIGANT COMPANY. ALL RIGHTS RESERVED4 / ©2016 NAVIGANT CONSULTING, INC. ALL RIGHTS RESERVED44 / ©ECOFYS, A NAVIGANT COMPANY. ALL RIGHTS RESERVED
HIGHER ENERGY EFFICIENCY FACILITATES MORE
AMBITIOUS RENEWABLES TARGETS
Energy efficiency has a direct impact on
the RES deployment levels required to
achieve the RES targets:
• Aggregated RES deployment needs for all
RES targets would be reduced by nearly 15%
if the EU energy efficiency target is raised from
30% to 40%.
• A 40% energy efficiency target combined with
a 27% RES target in 2030 would not require
any net increase in renewables.
• To incentivize a net increase in RES
deployment, the 2030 RES target would need
to be increased above 27%.
Diagram: Required 2030 RES deployment levels per RES
target for different levels of energy efficiency ambition
279
309
361
464
259
287
335
431
239
265
309
398
0
50
100
150
200
250
300
350
400
450
500
27%
RES
by
2030
30%
RES
by
2030
35%
RES
by
2030
45%
RES
by
2030
RES
dep
loym
ent
[Mto
e]
30% Energy Efficiency
35% Energy Efficiency
40% Energy Efficiency
Status Quo (2015)
2020 RES target
Required 2030 RES deployment - impact of Energy Efficiency:

/ ©ECOFYS, A NAVIGANT COMPANY. ALL RIGHTS RESERVED5 / ©2016 NAVIGANT CONSULTING, INC. ALL RIGHTS RESERVED55 / ©ECOFYS, A NAVIGANT COMPANY. ALL RIGHTS RESERVED
HIGHER ENERGY EFFICIENCY FACILITATES MORE
AMBITIOUS RENEWABLES TARGETS
Required net-increase in RES
deployment in 2020-2030 compared to
2010-2020:
• Currently proposed 2030-targets of 30% for
EE and 27% for RES could drastically slow
down current levels of renewables expansion
in the EU-28.
• To maintain current levels of RES growth, the
2030 RES-target must be at least 30%.
• In the case of a 30% RES target, net increase
in RES deployment in the EU-28 would be
reduced from 75 to 30 Mtoe (nearly 60%) if EE
target is raised from 30% to 40%.
Diagram: Required net additional RES deployment from
2020 to 2030 per RES target for different levels of energy
efficiency ambition
44
75
126
229
24
53
100
196
4
30
75
163
0
50
100
150
200
250
27%
RES
by
2030
30%
RES
by
2030
35%
RES
by
2030
45%
RES
by
2030
Net
incr
ease
in R
ES d
eplo
ymen
t [M
toe]
30% Energy Efficiency
35% Energy Efficiency
40% Energy Efficiency
Increase 2010-2020
Required increase in RES deployment 2020-2030- impact of Energy Efficiency:
/ ©ECOFYS, A NAVIGANT COMPANY. ALL RIGHTS RESERVED6 / ©2016 NAVIGANT CONSULTING, INC. ALL RIGHTS RESERVED66 / ©ECOFYS, A NAVIGANT COMPANY. ALL RIGHTS RESERVED
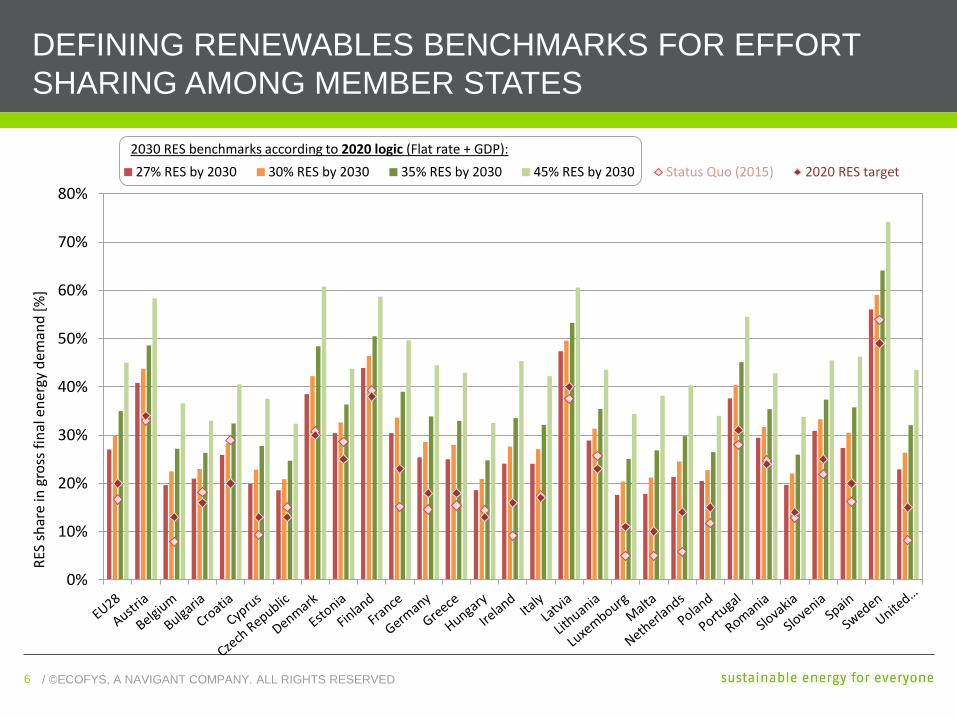
DEFINING RENEWABLES BENCHMARKS FOR EFFORT
SHARING AMONG MEMBER STATES
0%
10%
20%
30%
40%
50%
60%
70%
80%
RES
sh
are
in g
ross
fin
al e
ner
gy d
eman
d [
%]
27% RES by 2030 30% RES by 2030 35% RES by 2030 45% RES by 2030 Status Quo (2015) 2020 RES target
2030 RES benchmarks according to 2020 logic (Flat rate + GDP):
/ ©ECOFYS, A NAVIGANT COMPANY. ALL RIGHTS RESERVED7 / ©2016 NAVIGANT CONSULTING, INC. ALL RIGHTS RESERVED77 / ©ECOFYS, A NAVIGANT COMPANY. ALL RIGHTS RESERVED
KEY FINDINGS
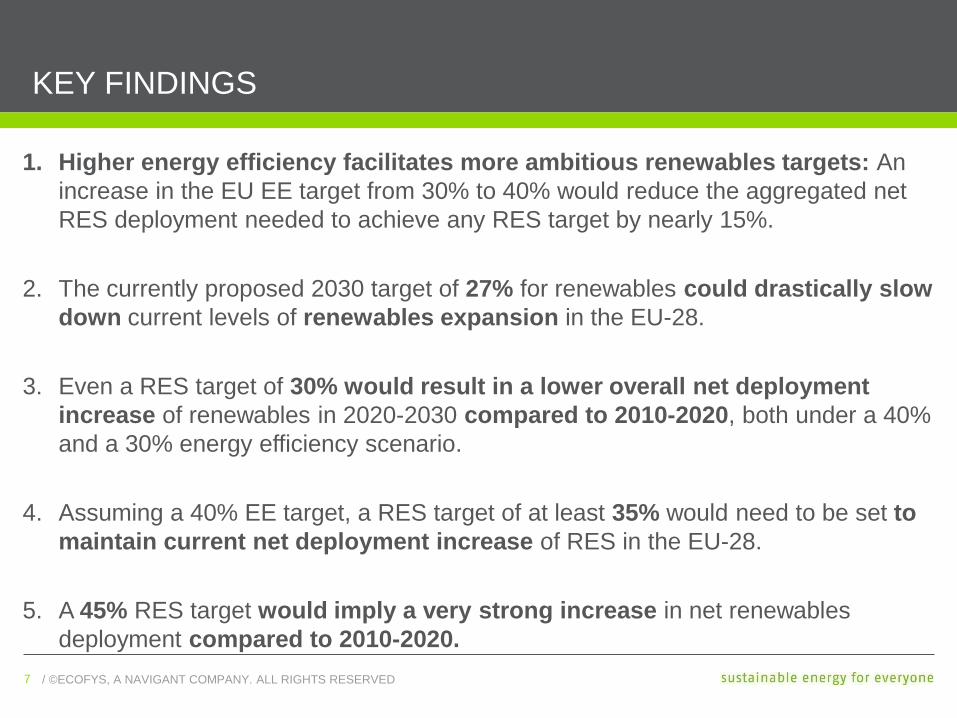
1. Higher energy efficiency facilitates more ambitious renewables targets: An
increase in the EU EE target from 30% to 40% would reduce the aggregated net
RES deployment needed to achieve any RES target by nearly 15%.
2. The currently proposed 2030 target of 27% for renewables could drastically slow
down current levels of renewables expansion in the EU-28.
3. Even a RES target of 30% would result in a lower overall net deployment
increase of renewables in 2020-2030 compared to 2010-2020, both under a 40%
and a 30% energy efficiency scenario.
4. Assuming a 40% EE target, a RES target of at least 35% would need to be set to
maintain current net deployment increase of RES in the EU-28.
5. A 45% RES target would imply a very strong increase in net renewables
deployment compared to 2010-2020.

/ ©ECOFYS, A NAVIGANT COMPANY. ALL RIGHTS RESERVED8
CONTACT US
OFFICE
Albrechtstraße 10c
10117 Berlin
Germany
T: +49 (0)30 297 735 79-0
WORLDWIDE OFFICES
United States: Boulder, Colorado
Chicago, Illinois
San Francisco,
California
Washington, DC
Europe: Brussels,
Berlin,
Cologne,
Copenhagen,
Denmark
London,
United Kingdom
Asia Pacific: Seoul, South Korea
GENERAL [email protected]
WWW.ECOFYS.COM

/ ©ECOFYS, A NAVIGANT COMPANY. ALL RIGHTS RESERVED9 / ©2016 NAVIGANT CONSULTING, INC. ALL RIGHTS RESERVED99 / ©ECOFYS, A NAVIGANT COMPANY. ALL RIGHTS RESERVED
BACK-UP SLIDES

/ ©ECOFYS, A NAVIGANT COMPANY. ALL RIGHTS RESERVED10 / ©2016 NAVIGANT CONSULTING, INC. ALL RIGHTS RESERVED1010 / ©ECOFYS, A NAVIGANT COMPANY. ALL RIGHTS RESERVED
METHODOLOGY AND DATA BASIS
Starting point for our calculations of national targets:
• Method used for the allocation of the 2020 RES targets (“2020-logic”)
• Assumption that national 2020 RES targets are met in time by Member States
Ensuring consistency with existing EU works:
• Key data source was recent PRIMES modelling done on behalf of the EC (Impact
Assessment of the RED II)
• Scenarios used:
- PRIMES reference scenario to calculate MS-specific 2030 RES targets (in %)
- „PRIMES euco30“ (builds on targeted use of energy efficiency (30%)): to translate RES
shares (%) into absolute values
- For more ambitious energy efficiency targets, a relative increase of energy efficiency across
all MS was assumed
/ ©ECOFYS, A NAVIGANT COMPANY. ALL RIGHTS RESERVED11 / ©2016 NAVIGANT CONSULTING, INC. ALL RIGHTS RESERVED1111 / ©ECOFYS, A NAVIGANT COMPANY. ALL RIGHTS RESERVED
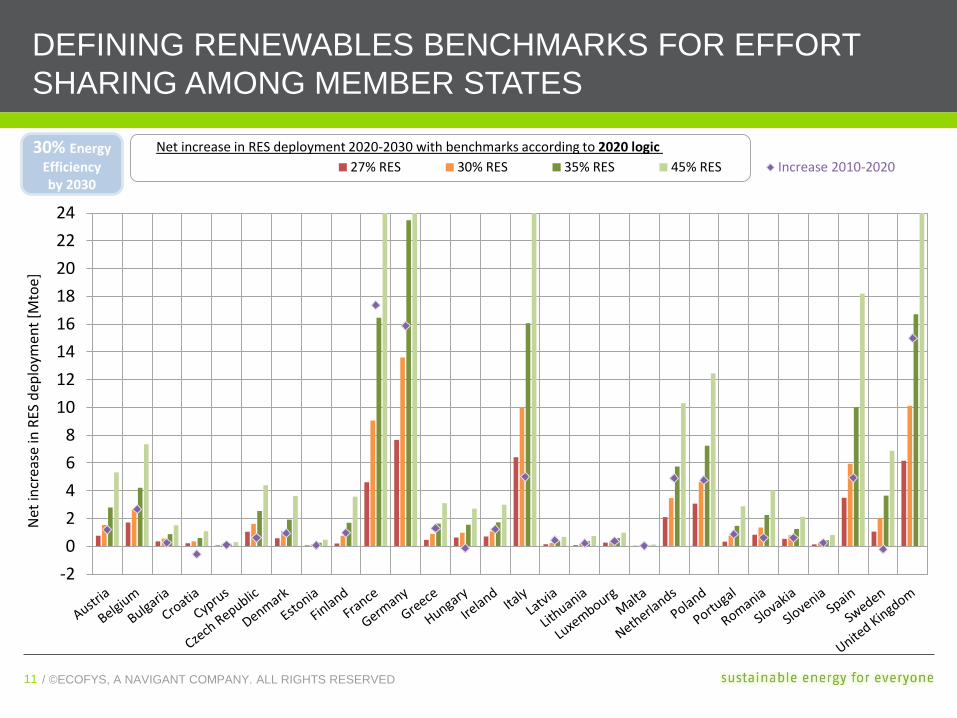
DEFINING RENEWABLES BENCHMARKS FOR EFFORT
SHARING AMONG MEMBER STATES
-2
0
2
4
6
8
10
12
14
16
18
20
22
24
Net
incr
ease
in R
ES d
eplo
ymen
t [M
toe
]
27% RES 30% RES 35% RES 45% RES Increase 2010-2020
Net increase in RES deployment 2020-2030 with benchmarks according to 2020 logic 30% Energy
Efficiencyby 2030
/ ©ECOFYS, A NAVIGANT COMPANY. ALL RIGHTS RESERVED12 / ©2016 NAVIGANT CONSULTING, INC. ALL RIGHTS RESERVED1212 / ©ECOFYS, A NAVIGANT COMPANY. ALL RIGHTS RESERVED
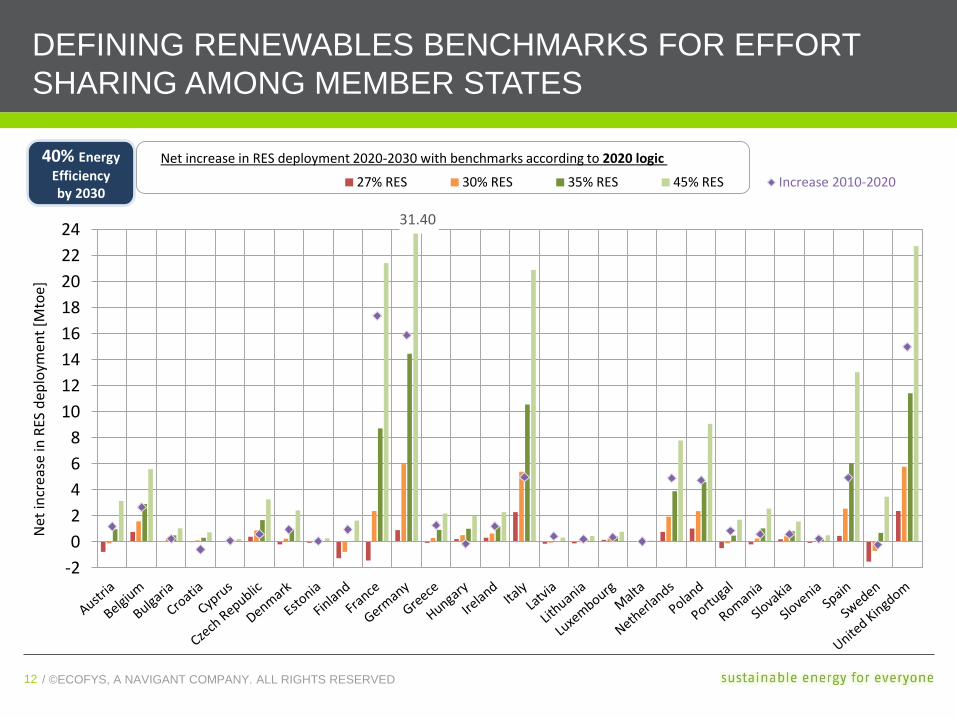
DEFINING RENEWABLES BENCHMARKS FOR EFFORT
SHARING AMONG MEMBER STATES
-2
0
2
4
6
8
10
12
14
16
18
20
22
24
Net
incr
ease
in R
ES d
eplo
ymen
t [M
toe
]
27% RES 30% RES 35% RES 45% RES Increase 2010-2020
Net increase in RES deployment 2020-2030 with benchmarks according to 2020 logic 40% Energy
Efficiencyby 2030
31.40
/ ©ECOFYS, A NAVIGANT COMPANY. ALL RIGHTS RESERVED13 / ©2016 NAVIGANT CONSULTING, INC. ALL RIGHTS RESERVED1313 / ©ECOFYS, A NAVIGANT COMPANY. ALL RIGHTS RESERVED
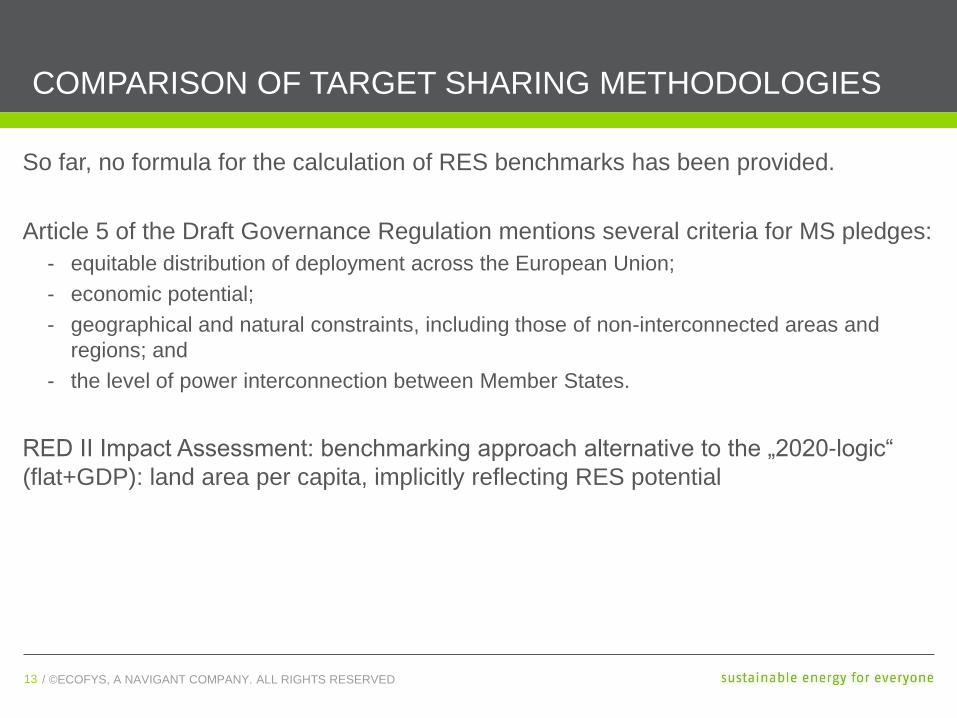
COMPARISON OF TARGET SHARING METHODOLOGIES
So far, no formula for the calculation of RES benchmarks has been provided.
Article 5 of the Draft Governance Regulation mentions several criteria for MS pledges:
- equitable distribution of deployment across the European Union;
- economic potential;
- geographical and natural constraints, including those of non-interconnected areas and
regions; and
- the level of power interconnection between Member States.
RED II Impact Assessment: benchmarking approach alternative to the „2020-logic“
(flat+GDP): land area per capita, implicitly reflecting RES potential

/ ©ECOFYS, A NAVIGANT COMPANY. ALL RIGHTS RESERVED14 / ©2016 NAVIGANT CONSULTING, INC. ALL RIGHTS RESERVED1414 / ©ECOFYS, A NAVIGANT COMPANY. ALL RIGHTS RESERVED
COMPARISON OF TARGET SHARING METHODOLOGIES3
0.0
0%
43
.76
5%
22
.46
6%
22
.97
8%
28
.32
7%
22
.84
3%
20
.88
1%
42
.21
4%
32
.64
0%
46
.38
3%
33
.63
9%
28
.57
9%
27
.98
0%
20
.93
0% 2
7.6
52
%
27
.09
6%
49
.58
1%
31
.33
3%
20
.40
3%
21
.20
9%
24
.52
2%
22
.74
3%
40
.44
4%
31
.67
6%
22
.03
7%
33
.31
3%
30
.48
9%
59
.08
0%
26
.34
1%
30
.00
%
43
.34
4%
20
.94
6% 2
8.4
40
%
32
.08
2%
24
.25
4%
21
.42
1%
40
.49
8%
39
.54
3%
53
.16
5%
33
.13
4%
27
.03
3%
30
.48
9%
22
.95
1%
28
.02
3%
26
.15
5%
57
.12
0%
37
.68
4%
18
.75
3%
18
.69
4%
22
.50
7%
24
.08
8%
41
.69
5%
35
.95
6%
23
.10
1%
34
.23
1%
31
.46
6%
64
.46
2%
24
.51
1%
0%
5%
10%
15%
20%
25%
30%
35%
40%
45%
50%
55%
60%
65%
70%
EU2
8
Au
stri
a
Bel
giu
m
Bu
lgar
ia
Cro
atia
Cyp
rus
Czech…
Den
mar
k
Esto
nia
Fin
lan
d
Fran
ce
Ger
man
y
Gre
ece
Hu
nga
ry
Irel
and
Ital
y
Latv
ia
Lith
uan
ia
Luxembo…
Mal
ta
Netherlan…
Po
lan
d
Po
rtu
gal
Ro
man
ia
Slo
vaki
a
Slo
ven
ia
Spai
n
Swed
en
United
…
RES
sh
are
in g
ross
fin
al e
ner
gy d
eman
d [
%]
2020 logic (Flat rate + GDP) Alternative approach (incl. land area) Status Quo (2015) 2020 RES target2030 RES benchmarks:30% RES
by 2030