aluminum bridge rail systems: test report no. 2
TRANSCRIPT

TEST REPORT No. 2
ALUMINUM BRIDGE RAIL SYSTEMS
Prepared for
The Aluminum Association Inc. 818 Connecticut Avenue
Washington, D.C. 20006
by
C. E. Buth Research Engineer
G. G. Hayes Assoc. Research Physicist
and
Tim Dolf Research Assistant
Texas A&M Research Foundation
Texas Transportation Institute
Texas A&M University
March 1980

Test Railing Installation
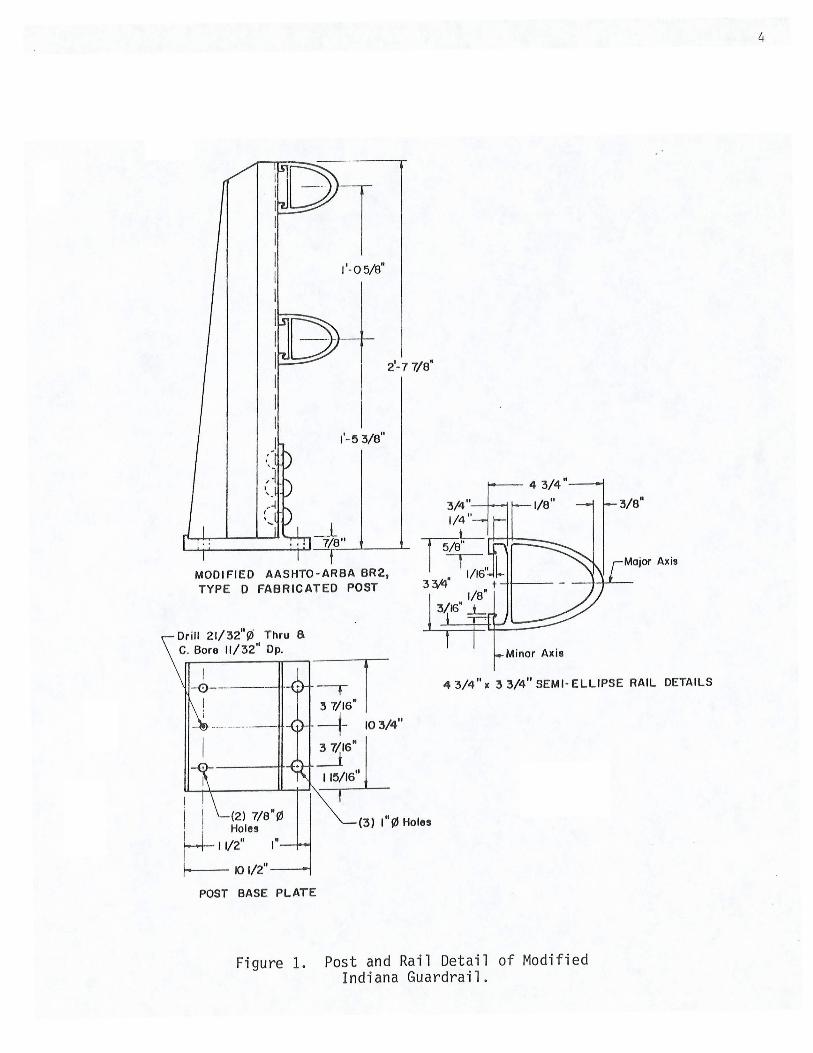
The test railing installed was a variation of the Indiana Type SA 2- bar
aluminum bridge rail. The variable- thickness base plate used in the previous
test was replaced with one of greater and constant thickness . In this test
the aluminum nuts were replaced by steel ones . In all other respects, the
test conditions were essentially identical to Test 4182- 1 . Figure 1 shows the
details of the modification. As before, approximately 28 m (93 ft) of railing
was installed on a massive foundation with no curb. An anchor was provided on
the downstream end to simulate a continuous rail as shown in Figure 2. Hardware
for the installation was fabricated by Magnode Products, Inc . , Trenton, Ohio .
The bridge rail hardware conforms dimensionally with ARBA Technical Bulletin
No. 268-A, July 1973, with the exception of the modification as noted. The
interior rail sections were in 8 m (26 ft) lengths.
Instrumentation
The vehicle was equipped with triaxial accelerometers mounted near the
center of gravity . Roll, pitch , and yaw were sensed by on- board gyroscopic
instruments. The analog signals were telemetered to a base station for
recording on magnetic tape and display on real- time strip chart . Provision was
made for transmission of calibration signals before and after the test, and
an accurate time reference signal was simultaneously recorded with the data .
Tape switches near the impact area were actuated by the vehicle to indicate
elapsed time over a known distance to provide a quick check of impact speed,
and the initial contact also produces an "event" mark on the data recording to
establish time zero .
High- speed motion pictures were obtained from various locations, including
overhead, to document the events and provide a time- displacement history. Film

and electronic data were synchronized through a visual event signal at initial
contact that coincides with the electronic contact signal .
Test Description
A 1974 Plymouth Fury weighing 2043 kg (4500 lbs) was directed into the
r ail at an angle of 25 degrees and 100 . 8 km/h (62 . 6 mph). The impact point
was . 73 m (2 . 4 ft) past post 6 . No anthropomorphic dummies were used in this
test . The vehicle was free- wheeling and unrestrained at impact .
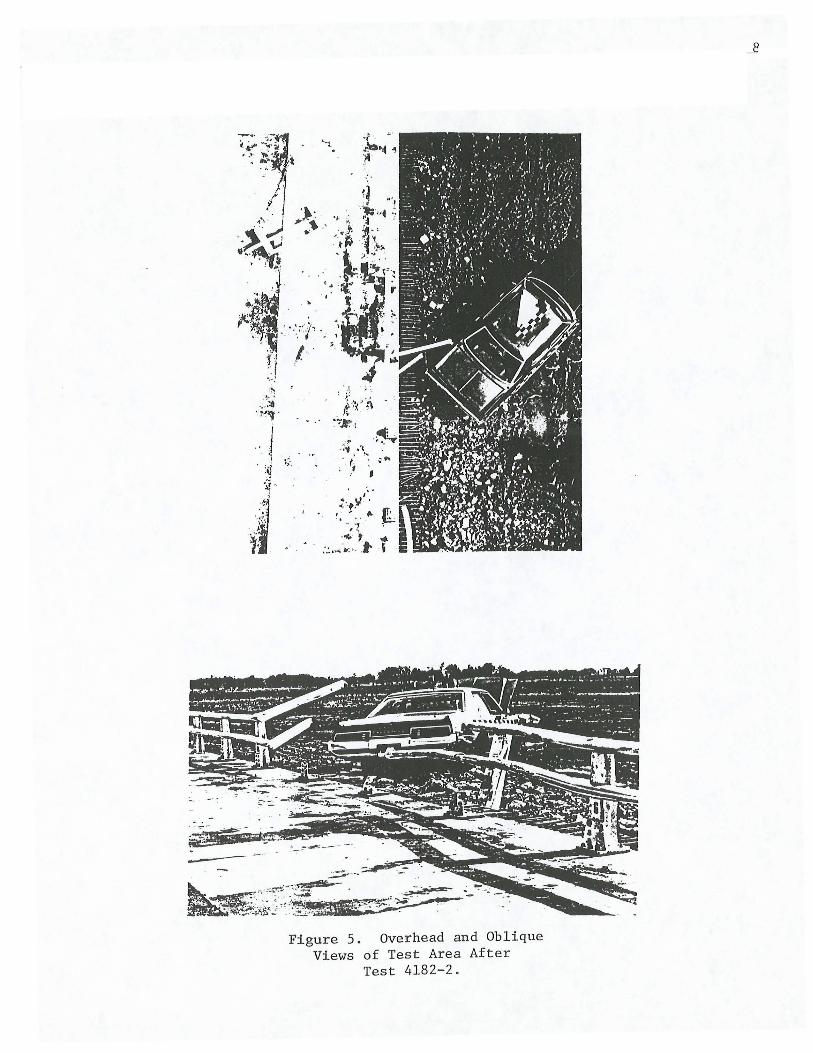
Figures 3 and 4 depict the vehicle and test area before and after the
impact . Figure 5 includes overhead and oblique views of the impact area . It
can be seen that posts 7 , 8 and 9 were separated from their base- plate flanges .
The overhead view shows a detached section of rail from posts 8 and 9 . A section
of the top rail from posts 7 and 8 was thro\vn about 46 m (150 ft) from the
point of impact approximately in the direction of initial vehicle travel .
The posts separated from the base- plates through shearing of the rivets
as shown in Figure 6 . The vehicle was not significantly redirected or contained,
and t r aveled approximately 6 . 1 m (20 ft) from the rail before plowing to a stop
in the soft earth behind the rail installation .
Results
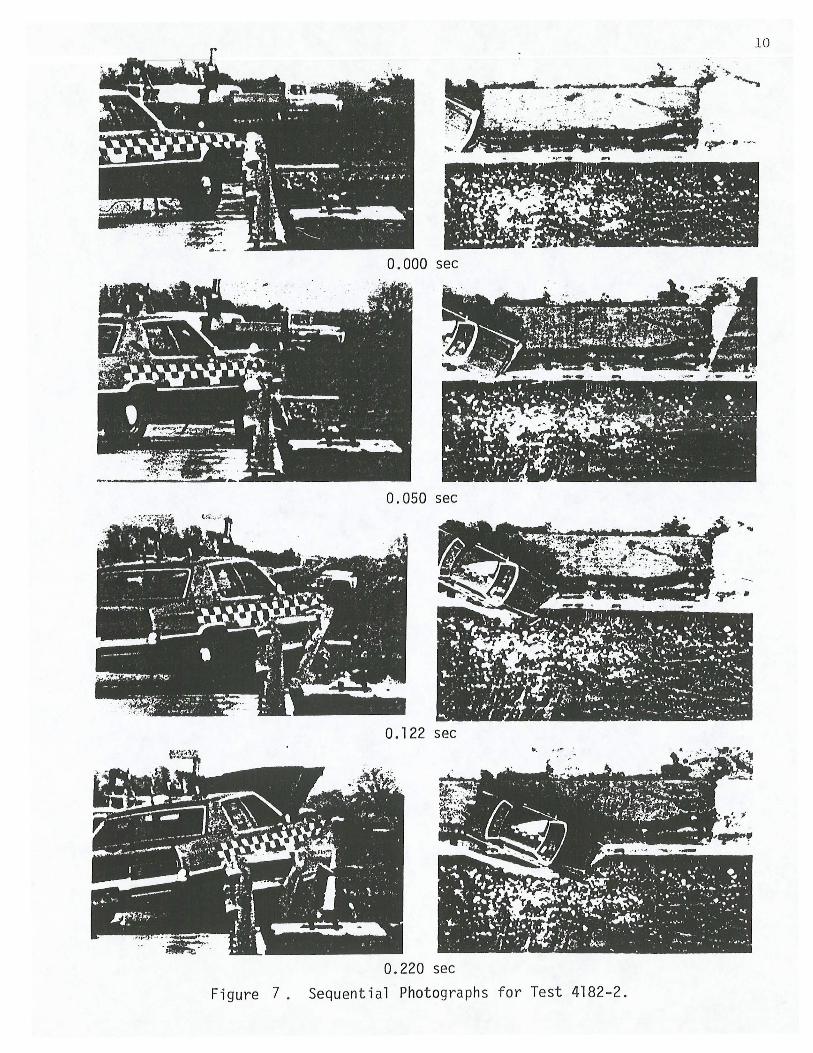
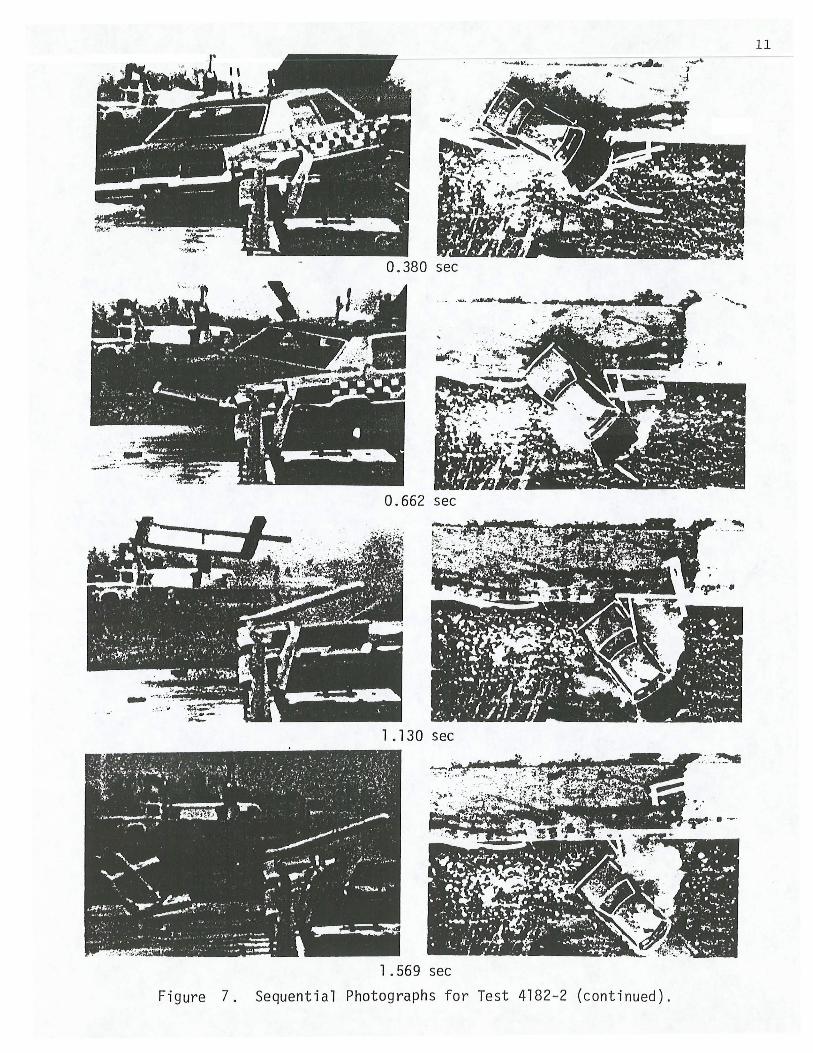
Sequential photographs and a summary of test data are shown in Figures 7
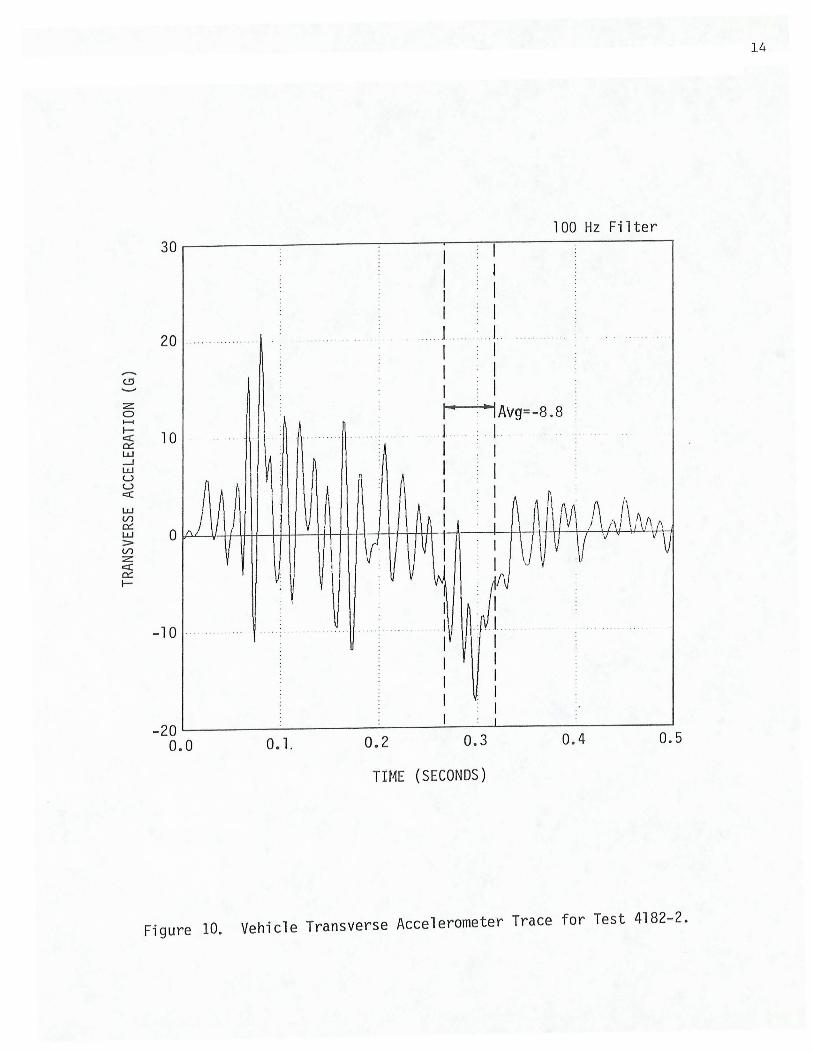
and 8 . Figures 9, 10 and 11 are analog reproductions of the vehicle triaxial
accelerations as a function of t i me .
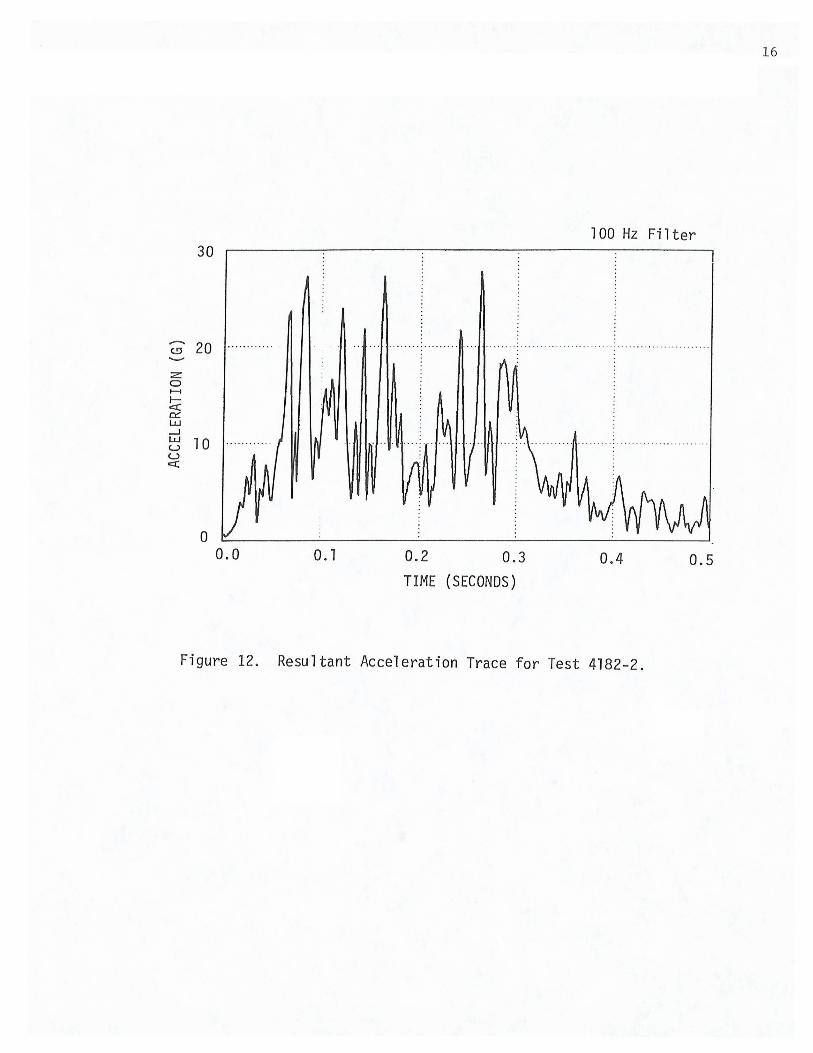
Figure 12 represents the resultant absolute acceleration which had a
maximum 50- millisecond- interval average of 11 . 91 g's . The triaxial acceleration
traces indicate the indi vidual maximum 50- millisecond- interval values.
Figures 13, 14 and 15 represent vehicle roll, pitch and yaw angles,
respectively, as a function of time from impact .
2
The installation did not meet the relevant performance criteria promulgated
in "Recommended Procedures for Vehicle Crash Testing of Highway Appurtenances",
February, 1978 .
3
1'-05/8"
2'-7 7/8"
1'-5 3/ 8"
_ _L 7/8" -f~L____L
MOD I Fl ED AASHTO-ARBA BR2, TYPE 0 FABRICATED POST
Drill 21/32"¢ Thru 8 C. Bore 11/32" Dp.
Major Axis
3 7;, •. ] 43/4"x 33/4" SEMI-ELLIPSE RAIL DETAILS
POST BASE PLATE
4 103/4"
3 7/16" _l
115/16"
(3) 1" ¢ Holes
Figure 1. Post and Rail Detai l of Modified Indiana Guardrail .
4

14 13 12 II 10 9 8 7 6 5 4 3 Post No.
2 I
mm ~ ~ ~ ~ ~ ~ ~ ~ ~ ~ ~ ~ ~ ~ I I I I I
13 Spaces @ 6'-s" = 84'-s" ,._ 2 1/2.
----~r
Figure 2. Test Insta llation of Modifi ed Indiana Guardrail.
Ln

Figure 3 . Vehicle Before and After Test 4182- 2.
6

Figure 4 . Railing Before and After Test 4182- 2 .
7
-.~
.. :'.:6 .. ,~,-
... ~~ ,'( . " ' f. .
; , ·, . ,·. ~
~·-t.\1 . ~ : , .. ,.._
.. j
~.c: ) ::_ .. , .. , ...•
Figure 5. Overhead and Oblique Views of Test Area After
Test 4182-2.

- ~ · ..
~
:~~··· . ... .~~~ .....
4 iii'.
... !f).i
Figure 6. Sheared Rivets on Post Mountings After Test 4182- 2 .
9
10
0 . 000 sec
0.050 sec
0.122 sec
0.220 sec
Figure 7. Sequential Photographs for Test 4182 - 2.
11
0.380 sec
0. 662 sec
1. 130 sec ... :.~.~
1 . 569 sec
Figure 7 . Sequential Photographs for Test 4182 -2 (continued) .

Modified Indiana Rail
Test No. Date Rail
Post
Post Spacing . . Post to Anchor Length of Installation Rail Deflection
Max. Dynamic . .
Max. Permanent
.......
!----~ 25° j.
L _ -L--J 1 1 I I I l' I I -.. I, I I I ' I I
\0'Z 4182-2 2/13/80
. . 210.6 mm x 95.3 mm (4-3/4 11
X 3-3/4 11)
semi-ellipse Alum. Rail AASHTO BR2 Alum., TypeD with modified base
2.0 m ( 6.5 ft) 2.6 m ( 8.5 ft)
28.5 m (93.6 ft)
1 . 0 m ( 3 . 0 ft ) fat rail failure) ( Ra i 1 fa i 1 ed)
Vehicle .. Vehicle Weight Impact Speed Impact Angle Exit Speed Exit Angle .... Vehicle Acceleration
(Max. 0.050 sec avg) Longitudinal Transverse Vertical
Vehicle Damage TAD -- 1-FR-6 SAE -- 02RFEW2 12FZEW4
Figure 8. Sequential Photographs and Data Summary for Test 4182-2.
··· ·~~-- :il I ';·· · . ;, . •. •.
(..'1"· . , ... .,tt. .. ~ l
"- Jit~ "":~ ·~~-:· ,yo¢ '
'.AL. .
1974 Plymouth Fury 2043 kg (4500 lbs) 100.8 km/hr (62.~ mph) 25° (car stopped beyond rail -38°
-10.6 g - 8.8 g
4.2 g
12FYEW3 03RBMWI
1-' N

z: 0 ,_. 1-c::( 0:: w .....J w u u c::(
.....J c::( z: ,_. 0 :::::> 1-,_. ~ z: 0 .....J
13
1 00 Hz Filter 0 ~----------------~--~------------------~
I 1 ~ • IAvg::;-10.6 I ii 11
o~~~~**~'~! __ l~=~r~~~~A~~A~A~A~A \ ' j I I] : A ;J Ill \f/ v v y v \J
w .~ ' v I II\ I 'J ~ ~ -10
I - 20 I I I . ~ . . I . . . . . . . .
I I I I I I I ~ -3 0~------~------~~--~~~------~------~
0.0 0. 1 0.2 0.3 0. 4 0.5
TH1E (SECONDS)
Figure 9 . Vehicle Longitudinal Accelerometer Trace for Test 4182-2 .
z 0 ,_. 1-c:x:: 0::: I..LJ _J I..LJ u u c:x:: I..LJ (/)
0::: I..LJ > (/) z c:x:: 0::: I-
14
1 00 Hz Filter 30r-------:-------~--~--~------~--~~
I I I l I I I I
J .. l ... . .. .. .. . . . .. I I
20 ·· ······· .... . . .
I I I I 1· .. IAvg= -8. 8 J .. I I 1
" I : : : .
. I ~ 11. I -M~~V'~/Jh"A. ~~ II II 1J I · : V V . . V
~ V V WI 1/\j .
· · · ·· .... --· I · I .. .. ... .. .... .. .. .. . .. ..... .
I I - 10
. ~
I I I I I I
I - 20 ~------~------~--~~--~IL_ ____ L_ ____ __j
0. 0 0. 1. 0. 2 0.3 0. 4 0. 5
TmE (SECONDS)
Figure 10. Vehicle Transverse Accelerometer Trace for Test 4182-2.

z: 0 1-f
~ ~ L.W .....J L.W w w c::(
.....J
30 I
I I r-~ --~-~. Avg=4.2
I .1 20 ·· ... · 1 · · :I ·
I I I I :1 I
1 o ..... ... ·· I . I ·.. ..... . . . . . . . . . . .
I
1 00 Hz Filter
5 0 1-f
te::: L.W >
- 10 .. .
-20 0. 0
I I I . I . . . . I I I I
0.1 0.2 0.3 0.4 0.5
TIME (SECONDS)
Figure 11. Vehicle Vertical Accelerometer Trace for Test 4182- 2.
15
30
~ 20 ... .. ...... . -z: 0 ....... !;: 0::. LW _J
t5 l 0 ..... ... . . u c::r::
0 0.0
l 00 Hz Filter
0 . l 0.2 0.3 0.4 0.5 TIME (SECONDS)
Figure 12. Resultant Acceleration Trace for Test 4182-2.
16

0 0 . <.D
0 0
(Y)
c.no TIME wdl. 00 w~ 0: (_'J
w Do '--'o . _j(Y)
I _j
0 0:
0 0
<.D I
C) 0
U)
I
\ \ ~
I (SECONDSl
0.20 0.4 _j
\
Figure 13. Vehicle Roll Angle for Test 4182-2.
17

0 0
~l 8: 0!
\~ 1 I
Ul0
TIME (SECOND S:' wco.oo 0.20 0.40 w •-t-- ----- -_j__ ___ _j
ceo CJ w 0 ~o
0
Im U' f-
0 0
1'£)
I
0 0
m I
Figure 14 . Vehicle Pitch Angle for Test 4182- 2.
18

0 0
c.o
0 0
(Y)
~0 T I E cnctl.OO , LU ·~=-------~--------~ LUo a= C)
LU oo ~o
(Y)
3: ' a: >-
0 0
c.o I
0 0
()) _
I
Figure 15 . Vehicle Yaw Angle for Test 4182- 2.
19