alternative & renewable energy - banktrack · alternative & renewable energy the choice of...
TRANSCRIPT

Alternative & Renewable Energy
The Choice of a New Generation
Equity Research Industry Report August 2008
Ben Isaacson, MBA, CFA – (416) 945-5310
Utilities –
Alternative & Renewable Energy
For Reg AC Certification and important disclosures see Appendix A of this report.
Alternatives_Cover_2008:Layout 1 8/22/2008 11:13 AM Page 1

The Choice of a New Generation August 2008
1
The Choice of a New Generation Alternative and renewable energy is not a fad. Nor is it like the dot-com bubble of the early 2000s. It will not disappear if oil and natural gas prices suddenly drop, or if a long-awaited peace deal throughout the Middle East lessens the need for energy security and independence.
Rather, alternative and renewable energy is real. It is here to stay, forever. We believe there is no other option for energy-dependent societies and global economies to develop prosperously over the long term. Alternative and renewable energy has become big business, with billions of investment dollars pouring into the sector. In 2007, almost US$150 billion was invested in the sector, and we expect the acceleration to continue, likely surpassing US$175 billion this year alone.
In this report, we focus specifically on renewable power generation (and not renewable fuels such as ethanol, biodiesel, or clean syngas). We think it is critical that investors are aware of the drivers impacting the phenomenal growth we expect the renewable power space to realize. We see these drivers of sector growth as strengthening, not weakening. We present outlooks as well as reviews of the market, investment, and technology trends for various renewable power generation fuel sources, including wind, solar, geothermal, run-of-river hydro, biomass, wave, tidal, and ocean power.
The carbon challenge has arrived, even if federal, regional, and local carbon legislation has not been finalized. Many companies, including the five Canadian independent power producers on which we have transferred or initiated coverage, are attempting to provide profitable business solutions to this challenge. Not all will succeed. Globally, there are hundreds of emerging renewable power companies, both public and private. As an investor looking to play the theme, the thought of filtering through these companies can be daunting.
Since the start of 2008, stock prices within our coverage universe are down over 30%, on average. In our opinion, these equities are mostly oversold, as investors have temporarily stepped back from high-growth/speculative names. On a company-specific level, we believe little has happened to even partially justify such a sell-off. While several renewable project cost-overruns and time delays have occurred, this should be expected, and is a normal part of project development. On a macro level, the global credit crunch has clearly increased future costs of capital for renewable power projects, but, in our opinion, not enough to justify the steep sector sell-off. Were stock prices too high to begin with? Maybe a little, but it appears the euphoria over brag-a-watts is now over. Our coverage universe is, for the most part, unaffected by economic cycles, and therein lies the current opportunity.
In most industries, easily comparable financial metrics are both readily available as well as reliable. We find this not to be the case in the renewable power space, and understandably so. Many companies that we have observed in the sector are barely a few years old, typically with negative earnings for the next several years. Some companies won’t even receive one dollar of revenue for at least two to three years out.
In this report, we offer clients both time-tested valuation methods as well as a more unique approach to valuing renewable power companies. In addition to providing our outlooks and specific stock recommendations, we trust this introductory report also presents the underlying knowledge, logic, and rationale to support our investment views.
Alternative & Renewable Energy August 2008
2
Contents
The Choice of a New Generation 1
Launching Alternative & Renewable Energy Coverage 7 Investment Highlights 7 Short Term Market Weight; Long Term Overweight 8 Valuation Approach 9 Renewable Power Growth Drivers All Strengthening 10 Three Catalysts That Move IPP Stock Prices 10 Execution Is the Largest Risk Facing Independent Power Producers 11 Four “Must Knows” per Renewable Technology 11
Our Top Picks 13 Canadian Hydro Developers Inc. – 1-Sector Outperform, $7 One-Year Target 13 Boralex Inc. – 1-Sector Outperform, $18 One-Year Target 14
Our Top Sector Ideas – And How to Play Them 17 Get in on the BC Hydro Call for Power 17 The Alberta Merchant Power Market Is a Fairly Safe Bet 18 Two Small Hydro-Quebec Wind RFPs 18 Connecticut REC Prices Are Attractive 19 Pay for a Management Team’s Successful Track Record 19 Consider Geothermal Equity Exposure 20 Marine Technologies Are Still Speculative, For Now 20 Keep Solar Equity Exposure Upstream 20
Valuation Methodology 22 We Cannot Justify Using Current Multiples or Metrics to Value Our Coverage Universe 22 Our Approach to Valuing the Sector 22 Discounted Cash Flow (DCF) Analysis – Sum of the Projects 23 Net Asset Value (NAV) Calculation – Our Unique Approach 23 We Don’t Rely on Relative Valuation Metrics, But Here They Are 24
Renewable Energy Demand Drivers Suggest Industry Growth Acceleration Ahead 29
Equity Performance to Date 32
Cap-and-Trade or Carbon Tax? 35
Our Call on the B.C. Call 38
Follow Feed-In Tariff Legislation 42
We Are Bullish on Renewable Energy Certificates 43
Canadian Federal Incentives Support Renewable Growth 44

The Choice of a New Generation August 2008
3
Provinces Also Encourage Renewable Power Investment 45
North American Initiatives Highlight Growing Acceptance of Climate Change Action 51
Europe Leads the World in Renewable Energy Targets 55
Global Investment Trends Support Our Bullish View 59
Boralex Inc. – A Lean, Green, Cash Flow Machine 67 Summary & Investment Recommendation 68 Capital Markets Profile 69 When Will Boralex Need New Equity? 70 We Like Boralex’s Geographic, Technology, and Seasonal Diversification 71 Production Profile & Outlook 73 Getting to 1,000 MW by 2012 77 We’re Bullish on Connecticut’s REC Market 78 A Small Hedge to High French Natural Gas Costs 81 ISO-NE’s Forward Capacity Markets 82 Key Investment Risks 83 French Wind Power Is Booming 85 Upcoming Stock Catalysts & Events 86 Cascades Likely Won’t Divest Its 34% Stake in Boralex 88 What About the Fund? 88 Valuation & Sensitivity Analysis 89 Financial Forecast 92 Management & Directors 99
Canadian Hydro Developers Inc. – The Best Bang for Your Renewable Buck 101 Summary & Investment Recommendation 102 Capital Markets Profile 103 When Will Canadian Hydro Developers Need New Equity? 104 Production Profile & Outlook 106 Alberta Spot Power Price Volatility Increasing… 108 …But KHD’s Proportionate Exposure Should Decline 108 Mixed Reactions on KHD’s Recent Acquisitions 109 Key Investment Risks 110 Upcoming Stock Catalysts & Events 112 Construction Projects & Development Prospects 113 The Value of KHD’s RECs 115 Warming Up to Dunvegan 116 Valuation & Sensitivity Analyses 117 Financial Forecast 120 Management & Directors 126

Alternative & Renewable Energy August 2008
4
EarthFirst Canada Inc. – At Risk: Everything 127 Summary & Investment Recommendation 128 Capital Markets Profile 129 When Will EarthFirst Need More Equity? 130 Key Investment Risks 132 Upcoming Stock Catalysts & Events 135 EarthFirst’s Flagship 144 MW Dokie I Wind Farm 136 Grand Valley 140 EarthFirst’s Other Wind Projects 142 Valuation & Sensitivity Analyses 145 Financial Forecast 147 Management & Directors 152
Innergex Renewable Energy Inc. – PPAs in Hand – Now Execute! 155 Summary & Investment Recommendation 156 Capital Markets Profile 157 When Will Innergex Need New Equity? 158 Production Profile & Outlook 159 Innergex Power Income Fund 160 A Big Day for a Small Company 161 Overview of Projects 162 Key Investment Risks 166 Upcoming Stock Catalysts & Events 168 Our Best Guess on Innergex’s Future PPA Bids 169 Valuation & Sensitivity Analyses 170 Financial Forecast 172 Management & Directors 178
Plutonic Power Corporation – One Goal: Winning Its Next BC Hydro Bids 181 Summary & Investment Recommendation 182 Capital Markets Profile 184 When Will Plutonic Need More Equity? 187 Key Investment Risks 188 The Fall of Europa 189 Share Price Observations – A News-Driven Story 190 Upcoming Stock Catalysts & Events 192 Plutonic’s Flagship 196 MW Toba/Montrose Project 194 Plutonic’s Likely BC Hydro Clean Power Call Bids 196 Valuation & Sensitivity Analyses 198 Financial Forecast 201 Management & Directors 207
Wind Power – An Established & Mainstream Power Source 209 Overview 209 Investment Positives & Negatives 210 Wind Power Market Trends 210

The Choice of a New Generation August 2008
5
Project Economics to Improve, in a Couple of Years 213 Modelling & Sensitivity Analyses of a Wind Project 213 Canada – A Review and Outlook 217 Catalysts for the Canadian Wind Power Market 220 The European Union Is Far More Advanced in Wind Power Development Than North America 221 Wind M&A Activity and Capital Markets Trends 223 Emerging Wind Technologies 226 Offshore Wind Capital Costs Have Not Peaked Yet 228 The Turbine Manufacturer Oligopoly 229 Select Canadian Wind Developer Equities 231
Solar Photovoltaic Power – Shining Bright Post-2013 236 Overview 236 What We Like About the Potential for Utility-Scale Solar PV 238 PV’s Challenges: Cost Reductions Needed in Many Areas 239 Solar Equities: The Rise … 240 … And Fall 240 Testing Ontario’s Standard Offer Contract: Modelling & Sensitivity Analyses of a Solar Project 242 Canadian Content 245 Expect Solar PV Grid Parity in Five to Seven Years 246 Solar PV Trends & Observations 247 Solar Supply/Demand Outlook: Too Many (Silicon) Cooks Spoil the (Investment) Broth 248 Photovoltaics Science & Technology 101 249 Emerging Photovoltaic Technologies & Concepts 253 Select Canadian Solar Manufacturers 254
Run-of-River – Focus on B.C. 261 Overview 261 Terrific Outlook for B.C. Run-of-River Projects 262 Run-of-River Project Economics: Distinguishing the Good from the Not So Good 262 Run-of-River Equity Returns Are Quite Strong: Modelling & Sensitivity Analyses of a Run-of-River Project 263 Run-of-River Capital Costs per MWh Are Among the Least Expensive 266 Investment Positives 266 Investment Risks & Challenges 267 How Quickly a Great Project Can Fall Apart 268 Run-of-River Science & Technology 101 268 Run-of-River Capacity Development Process & Timeline 269 Select Canadian Run-of-River Developers 270
Geothermal Power – Mining for Heat 273 Overview 273 Canadian Geothermal Development Disappointing to Date 274 Project Equity Returns Are Reasonable: Modelling & Sensitivity Analyses of a Geothermal Power Project 275 Geothermal Capital Costs per MWh Are Materially Cheaper Than Wind 278 Investment Positives 279 Investment Risks & Challenges 279

Alternative & Renewable Energy August 2008
6
Geothermal Power Science & Technology 101 280 Emerging Geothermal Technologies 282 Outlook 282 Strong Geothermal Showing at the 2008 PDAC 282 Select Canadian Geothermal Power Developers 283
Wood-Residue Biomass – Losing Value on High Fuel Costs 289 Overview 289 Consider Investing Biomass Dollars in REC Markets 289 Profiting from the Mountain Pine Beetle – The B.C. Bioenergy Call 290 Capital Costs Are Reasonable, But O&M Costs Are Soaring 291 Investment Positives 291 Investment Risks 291 Unexciting Equity Returns: Modelling & Sensitivity Analyses of a Wood-Residue Biomass Project 292 Wood-Residue Biomass Science & Technology 101 296 Coal-to-Wood Biomass Plant Conversion 296 Select Canadian Wood-Residue Biomass Projects 300
Tidal Power – The Next Renewable Play? 301 Overview 301 Tidal Power Potential in Canada Is Huge 301 Quality Equity Returns Likely 5+ Years Away: Modelling & Sensitivity Analyses of a Tidal Power Project 302 Tidal Power Science & Technology 101 305 Passing the Bay of Fundy Test 306 Select Global Tidal Power Projects 308
Wave Energy – Not the Wave of the Future, For Now 309 Overview 309 Limited Development in Canada, But the Potential Is Promising 310 Wave Power Science & Technology 101 311 Select Global Wave Power Projects 311
Ocean Thermal Energy Conversion – Using Earth’s Largest Solar Panel 315 Overview 315 OTEC Science & Technology 101 315
Appendix 1 317
Appendix 2 318
Appendix 3 319
Note: All prices are as at August 15, 2008.

The Choice of a New Generation August 2008
7
Exhibit 1.1: Summary Table of Targets, Ratings, and Relative Valuation Metrics
Last SC 1-Year 1-Year MarketCompany Ticker Price Rating Target ROR DCF NAV Cap 2008E 2009E 2010E
8/15/2008 ($M) (x) (x) (x)
Boralex BLX $14.80 1-SO $18.00 22% $18.33 $17.03 $560 9.9x 8.6x 7.6xCanadian Hydro Developers KHD $4.38 1-SO $7.00 60% $7.04 $6.95 $628 20.3x 9.9x 7.6xEarthfirst Canada EF $0.27 3-SU $0.40 48% $0.35 $0.60 $28 n.m. -5.5x -0.9xInnergex Renew able Energy INE $8.25 3-SU $9.50 15% $9.44 $9.55 $194 n.m. 18.4x 7.8xPlutonic Pow er PCC $7.04 2-SP $9.00 28% $9.03 $8.75 $297 n.m. n.m. n.m.Average 35% $341 15.1x 7.8x 5.5x
Enterprise Value to EBITDA
Source: Bloomberg; Scotia Capital estimates.
Launching Alternative & Renewable Energy Coverage We have initiated or transferred coverage on five Canadian equities within the Alternative & Renewable Energy space: Boralex Inc.; Canadian Hydro Developers Inc.; EarthFirst Canada Inc.; Innergex Renewable Energy Inc.; and Plutonic Power Corporation.
Our top stock picks, both rated 1-Sector Outperform, are Boralex and Canadian Hydro Developers.
Exhibit 1.1 highlights our one-year target prices, ratings, and implied relative valuation multiples; Exhibit 1.2 shows our alternative and renewable energy comparative valuation analysis.
I N V E S T M E N T H I G H L I G H T S
While we anticipate sector volatility to continue over the short term due to shaky equity markets in general, we expect our top stock picks, Canadian Hydro Developers and Boralex, both rated 1-Sector Outperform, to perform exceptionally well over the next 12 months, as follows:
• Canadian Hydro Developers oversold. We believe the recent sell-off of Canadian Hydro Developers presents a compelling buying opportunity. Following several permitting-related project timing setbacks and associated cost overruns, we think KHD’s current share price now reflects too much of an execution risk discount. Our DCF and NAV analyses are supportive of a $7/share price and a 50%+ ROR one year out.
• Boralex is a bargain, in our opinion, and is one of the few renewable power development companies that offers investors healthy cash flow generation, coupled with a well-funded and achievable growth plan. Strong spot northeastern U.S. power prices coupled with easing diesel prices and our long-term bullish outlook for a tight Connecticut REC market are the basis for our positive thesis. Our DCF and NAV support a price in the $18/share area, suggesting a 20%+ one-year return.
On balance, we have a positive outlook for all five of the companies that we have assumed coverage on, backed by our average one-year rate of return of 35%.
• Plutonic Power – neutral on the name (2-Sector Perform; one-year target of $9.00/share). Plutonic is currently 100% dependent on the B.C. government choosing its renewable projects over others. We assume 1,047 MW of Plutonic projects get submitted into the current BC Hydro Clean Power Call. If no more of its projects are chosen, its stock price could drop to $3 per share. If the company wins all 1,047 MW in the Call, and maintains a 40%+ economic interest in the projects, the stock could be worth close to $15.

Alternative & Renewable Energy August 2008
8
• Innergex – a “show me” story (3-Sector Underperform; one-year target of $9.50/share). INE recently lost its bid in the 2,000 MW Hydro-Quebec wind request for proposal (RFP), while all other companies within our coverage universe that bid into the RFP won at least two projects. Innergex is sitting on over 290 MW of PPAs, spread over nine projects, most of which it has yet to execute. Execution and construction risk is high, and two of its three current construction projects have faced timing setbacks. We think investors should focus more on the successful commissioning of its PPA-signed projects than on winning new PPAs.
• EarthFirst – highly speculative (3-Sector Underperform; one-year target of $0.40/share). Following $35 million of cost overruns at its only construction project and a $200+ million debt financing deal that expired prior to funding, EF is now uncertain whether it will remain a going concern. The company desperately needs $50 million of equity/sub debt as well as a reworked debt financing agreement to complete construction of its 144 MW Dokie I project. We see one of four scenarios playing out over the short term: (1) bankruptcy; (2) a takeout; (3) financial partner; or (4) a successful refinancing. On August 21, the company announced that it had formally initiated a review of its strategic alternatives.
S H O R T T E R M M A R K E T W E I G H T ; L O N G T E R M O V E R W E I G H T
This year has been a rough year for most alternative and renewable energy equities. What makes it seem worse is the phenomenal year these equities had in 2007. Year-to-date, our universe of coverage is now down over 30% compared with the S&P/TSX Composite Index, which is down only 5.3% (note that all of our stocks have betas of less than one). The majority of these stocks are not (or should not be) materially impacted by economic downturns. On the top line, revenue (i.e., price x volume) is fairly predictable, as power prices are, for the most part, contractually locked in. On volume, Mother Nature certainly doesn’t stop working during a recession. The wind still blows, the sun still shines, and rivers still flow. Operating and maintenance costs are also quite predictable, as are future project capital expenditures (albeit with some cost overrun and credit risks).
In our minds, nothing really has changed much over the past several months other than the market’s sentiment towards renewable energy equities has turned somewhat sour. It is true that credit spreads have widened, increasing financing risks for future renewable projects. In our opinion, this increased risk is certainly not enough to warrant the massive sell-off we have seen. As a result, we are quite bullish on the sector as a whole (i.e., long-term overweight), although less so than some of our competitors. Our average one-year ROR is 35%, while the consensus average for our coverage universe is about 60%. Our long-term bullish/overweight outlook comes with one short-term caution.
Clearly, renewable energy stocks have temporarily fallen out of favour (-34% YTD), as investors steer clear of high-growth and somewhat speculative names during this down cycle in favour of info tech (+9.6% YTD) and blue-chip energy (+4.2% YTD) stocks. While we think there are currently excellent bargains within our coverage universe, we suggest a cautious short-term trading approach until equity markets have reached trough levels.

The Choice of a New Generation August 2008
9
Exhibit 1.2: Alternative and Renewable Energy Comparative Valuation Analysis
Company Boralex Canadian Hydro Developers
EarthFirst Canada
Innergex Renewable
EnergyPlutonic Power
Coverage Universe Average
Canadian IPP Average
Ticker BLX KHD EF INE PCC
Last Price (Aug 15, 2008) (C$) $14.80 $4.38 $0.27 $8.25 $7.04Rating1 1-SO 1-SO 3-SU 3-SU 2-SP1 Yr Target (C$) $18.00 $7.00 $0.40 $9.50 $9.00ROR (1 Yr) (%) 21.6% 59.8% 48.1% 15.2% 27.8% 34.5%Dividend Yield (%) 0.0% 0.0% 0.0% 0.0% 0.0% 0.0%Total Assets (C$M) $558 $1,139 $207 $343 $167Book Value per Share (C$) $7.79 $3.45 $1.65 $9.71 $1.40P/BV (x) 1.9x 1.3x 0.2x 0.9x 5.0x 1.8x 3.0x
Market DataShares O/S (M) 37.8 143.5 103.3 23.5 42.2Market Cap. (C$M) $560 $628 $28 $194 $297 $342 $141Ent. Value (C$M) $667 $1,109 -$24 $263 $291Beta 0.7 0.5 - - 0.9 0.7 1.0ROR 1m (%) 4.9% -12.4% -73.0% 18.7% 17.3% -8.9% -10.7%ROR 3m (%) -12.1% -27.0% -84.0% -14.7% -7.0% -29.0% -20.3%ROR 6m (%) -6.6% -22.2% -86.5% -27.0% -7.1% -29.9% -24.1%ROR YTD (%) -14.2% -31.6% -85.0% -33.8% -6.8% -34.3% -32.1%52-Week Low (C$) $13.00 $4.05 $0.22 $6.76 $5.8152-Week High (C$) $19.39 $8.01 $2.60 $14.00 $9.29
Debt MetricsLTD/(LTD + Equity) (%) 38.5% 52.8% n.m. 28.2% 39.4% 39.7% 35.5%Debt/Assets (%) 33.0% 48.7% n.m. 26.1% 23.4% 32.8% 27.7%
ForecastSales (C$M) 2008E $214.4 $87.5 $0.0 $7.0 $0.0
2009E $228.2 $159.4 $5.1 $23.3 $0.02010E $243.3 $202.4 $31.5 $46.4 $1.8
EBITDA (C$M) 2008E $67.4 $54.7 $0.0 $0.3 -$14.52009E $77.9 $112.3 $4.3 $14.3 -$10.82010E $87.9 $146.5 $27.0 $33.9 -$8.4
Earnings (C$/share) 2008E $0.51 $0.08 -$0.02 -$0.19 -$0.322009E $0.73 $0.19 -$0.04 $0.03 -$0.242010E $0.79 $0.25 -$0.03 $0.32 -$0.21
Cash Flow (C$/share) 2008E $1.43 $0.27 -$0.03 -$0.03 -$0.162009E $1.69 $0.49 -$0.02 $0.25 -$0.162010E $1.93 $0.67 $0.05 $0.81 -$0.17
Book Value (C$/share) 2008E $8.03 $3.51 $1.64 $9.68 $1.242009E $8.78 $3.71 $1.60 $9.71 $1.012010E $9.58 $3.98 $1.64 $10.61 $2.12
ValuationNAV (C$/share) $17.03 $6.95 $0.60 $9.55 $8.75DCF2 (C$/share) $18.33 $7.04 $0.35 $9.44 $9.03P/NAV (x) 0.9x 0.6x 0.4x 0.9x 0.8x 0.7xP/DCF (x) 0.8x 0.6x 0.8x 0.9x 0.8x 0.8xDiscount Rate (%) 10.0% 9.5% 11.5% 11.0% 10.5% 10.5% 10.7%EV per Risked MW3 (C$000s per MW) $1,388 $1,718 ($113) $1,353 $808 $1,031EV per Risked GWh/y3 (C$000s per GWh/y) $327 $561 ($47) $338 $392 $314
P/E (x) 2008E 28.8x 54.6x n.m. n.m. n.m. 41.7x 28.4x2009E 20.2x 23.4x n.m. n.m. n.m. 21.8x 29.7x2010E 18.6x 17.3x n.m. 25.5x n.m. 20.5x 27.5x
EV/EBITDA (x) 2008E 9.9x 20.3x n.m. n.m. n.m. 15.1x 10.3x2009E 8.6x 9.9x -5.5x 18.4x n.m. 7.8x 6.9x2010E 7.6x 7.6x -0.9x 7.8x n.m. 5.5x 5.1x
P/S (x) 2008E 2.6x 7.2x n.m. 27.5x n.m. 12.4x 22.0x2009E 2.5x 3.9x 5.5x 8.3x n.m. 5.1x 6.8x2010E 2.3x 3.1x 0.9x 4.2x n.m. 2.6x 4.7x
P/CF (x) 2008E 10.4x 16.0x n.m. n.m. n.m. 13.2x 9.0x2009E 8.7x 9.0x n.m. 33.6x n.m. 17.1x 28.7x2010E 7.7x 6.6x 5.6x 10.2x n.m. 7.5x 7.5x
P/BV (x) 2008E 1.8x 1.2x 0.2x 0.9x 5.7x 2.0x 2.0x2009E 1.7x 1.2x 0.2x 0.8x 7.0x 2.2x 2.2x2010E 1.5x 1.1x 0.2x 0.8x 3.3x 1.4x 1.4x
Company MetricsCapacity (net) (MW) Operating 364 MW 364 MW 0 MW 8 MW 0 MW 147 MW
Near Term4 176 MW 359 MW 174 MW 103 MW 78 MW 178 MWPipeline5 160 MW 1,721 MW 2,476 MW 2,487 MW 1,637 MW 1,696 MW
Generation (net) (GWh/y) Operating 1,700 GWh/y 1,136 GWh/y 0 GWh/y 42 GWh/y 0 GWh/y 575 GWh/yNear Term 534 GWh/y 1,050 GWh/y 404 GWh/y 448 GWh/y 298 GWh/y 547 GWh/yPipeline 434 GWh/y 5,254 GWh/y 6,118 GWh/y 8,016 GWh/y 3,399 GWh/y 4,644 GWh/y
1. SO - Sector Outperform, SP - Sector Perform, SU - Sector Underperform.2. DCF for EarthFirst is based on four equally-weighted scenarios: (1) refinancing; (2) bankruptcy; (3) takeover; and (4) financial partner.3. Capacity and generation are risk-adjusted as follows: (1) Operating - 100%; (2) Under Construction - 90%; (3) PPA & Permitted - 50%; (4) PPA or Permitted - 25%; (5) Some Development - 10%; and (6) Pipeline - 0%.4. Near Term: sum of (2) Under Construction; and (3) PPA & Permitted.5. Pipeline: sum of (4) PPA or Permitted; (5) Some Development; and (6) Pipeline.
Source: Reuters; Bloomberg; Company reports; Scotia Capital estimates.

Alternative & Renewable Energy August 2008
10
V A L U A T I O N A P P R O A C H
We are hesitant to give any weight to current trading multiples or other valuation metrics using current financial data, simply because the numbers are, in our opinion, somewhat meaningless. Why? Many companies in the sector that we have observed are barely a few years old, typically with negative earnings for the next several years. Some companies won’t even receive one dollar of revenue for at least two to three years out. Our universe of coverage is primarily an event-driven basket of stocks.
We believe that a prudent valuation approach must take into account the following factors: (1) the unique characteristics and economics of each and every renewable power project; (2) corporate synergies/efficiencies from a multiple-project portfolio; (3) corporate level specifics; (4) rule-of-thumb metrics upon which some investors trade; and (5) forward relative valuation metrics.
We use a sum-of-the-projects discounted cash flow analysis, and a somewhat unique net asset value approach in setting our one-year targets. As a reality check, we calculate the implied forward EV multiples on 2009 through 2011 EBITDA estimates.
R E N E W A B L E P O W E R G R O W T H D R I V E R S A L L S T R E N G T H E N I N G
We see three overall themes that have caused the phenomenal growth of renewable power generation. Our long-term overweight and bullish stance is predicated on each of these renewable power demand drivers strengthening.
1. Renewable portfolio standards. Regulatory policies that mandate the use of renewable energy is the number one key driver for the industry’s growth. There are four primary reasons for accelerated growth in the number and the intensity of renewable portfolio standards around the world:
• rising energy prices;
• the increased need for energy security and independence;
• greater environmental awareness and fear of climate change; and
• compliance with the Kyoto Protocol or its successor.
2. The implementation of carbon emissions cap-and-trade programs or carbon taxes. Numerous proposals exist throughout the world to penalize industrial carbon emitters. Placing a price on carbon emissions increases the cost of fossil fuel power generation, making renewable energy options that much more attractive.
3. Renewable technology economics continue to improve. Real cost curves for most renewable energy technologies continue to decline. While there have been some setbacks, we view these as short term in nature.
T H R E E C A T A L Y S T S T H A T M O V E I P P S T O C K P R I C E S
1. Bidding for and being awarded new long-term, fixed-price power purchase agreements;
2. Material progress or setback updates on a company’s development pipeline, ranging from construction cost overruns to the announcement of new projects; and
3. The advancement of favourable renewable power policies, initiatives, or RFPs that support continued industry growth.

The Choice of a New Generation August 2008
11
E X E C U T I O N I S T H E L A R G E S T R I S K F A C I N G I N D E P E N D E N T P O W E R P R O D U C E R S
Poor project execution is the biggest threat to stock prices within our coverage universe. Timing setbacks and cost overruns can destroy equity IRRs. To mitigate this risk, some companies enter into 100% fixed-price EPC contracts, but typically at a higher overall cost, and therefore at a lower relative project return.
F O U R “ M U S T K N O W S ” P E R R E N E W A B L E T E C H N O L O G Y
Wind. (1) Wind power is now an established, mainstream power source in a rapidly growing number of countries, including Canada; (2) we think capital costs will continue to rise until the end of 2009, at which point a surge in Chinese turbine exports as well as growth of European manufacturer facilities in the United States will ease supply challenges; (3) by 2015, we could see up to 15,000 MW of wind capacity in Canada; and (4) our generic wind economic model returned an equity IRR of 12.8%.
Solar PV. (1) Grid-connected solar power is the fastest growing renewable power source on the planet, with capacity installations having increased about 50% per year since 2002; (2) the primary challenge facing the PV industry is the high cost to produce and install a PV system; (3) we see thin-film technologies quickly taking market share from traditional crystalline-based PV technologies, although solar PV could reach grid parity in about five years; and (4) our generic solar PV economic model returned an equity IRR of 6.2%.
Run-of-river. (1) BC Hydro estimates there are more than 8,200 commercially viable run-of-river hydro sites in British Columbia, of which about 121 would have levelized costs of less than $100/MWh; (2) in our opinion, capital costs per MWh for run-of-river projects are among the least expensive for all renewable power technologies, and between 10% and 30% cheaper than wind; (3) we like the low technology risk of run-of-river assets as well as their 75+ year useful lives, if properly maintained; and (4) our generic run-of-river economic model returned a strong equity IRR of 14.9%.
Geothermal. (1) The global geothermal energy potential is enormous, and we see the cost of providing geothermal dropping over the long term; (2) the Canadian Geothermal Energy Association believes geothermal projects in British Columbia alone could amount to between 3,000 MW and 5,000 MW – currently there is nothing active; (3) project risk is high, and accordingly so are returns; and (4) we estimate an 18.8% average equity return for utility-scale geothermal projects in the United States.
Biomass. (1) Wood-residue biomass power projects suffer from high operating costs, mainly feedstock and transportation-related diesel prices; (2) in our opinion, stronger returns can be found in coal-to-biomass plant conversion than in greenfield wood-residue project development; (3) we expect significant development of biomass power in British Columbia through the use of mountain pine beetle-infected wood; and (4) our generic open-loop wood-residue biomass economic model yielded an equity IRR of 7.5%.
Tidal/wave/ocean thermal. (1) In our view, marine technologies are at least several years behind wind, run-of-river, and even solar power development; (2) capital costs remain high; (3) we think tidal power will emerge as the first mainstream marine power technology; and (4) our generic tidal power economic model returned a sub-5% equity IRR.
Exhibit 1.3 summarizes our findings on the renewable power technology economics. In later sections, we provide our model assumptions and equity return sensitivity analyses on six of the eight renewable technologies. We found both wave and ocean thermal project economic models too speculative to derive meaningful results.

Alternative & Renewable Energy August 2008
12
Exhibit 1.3: Summary Economics of Renewable Technologies
Capital Costs per MW
$0
$2
$4
$6
$8
$10
Coal CCGT Nuclear Large Hydro OnshoreWind
OffshoreWind
Run-of-River
Solar PV Geothermal Biomass(w ood-residue)
Tidal Wave
$M p
er In
stal
led
MW
Capital Costs per GWh/y
$0
$2
$4
$6
$8
$10
Coal CCGT Nuclear Large Hydro OnshoreWind
OffshoreWind
Run-of-River
Solar PV Geothermal Biomass(w ood-residue)
Tidal Wave
$M p
er G
Wh/
y
Capacity Factors
0%
20%
40%
60%
80%
100%
Coal CCGT Nuclear LargeHydro
OnshoreWind
OffshoreWind
Run-of-River
Solar PV Geothermal Biomass(w ood-residue)
Tidal Wave
Operating Costs per MWh
$0
$20
$40
$60
$80
$100
Coal CCGT Nuclear Large Hydro OnshoreWind
OffshoreWind
Run-of-River
Solar PV Geothermal Biomass(w ood-residue)
Tidal Wave
$ pe
r MW
h
Levelized Costs per MWh
$0
$100
$200
$300
$400
$500
$600
Coal CCGT Nuclear Large Hydro OnshoreWind
OffshoreWind
Run-of-River
Solar PV Geothermal Biomass(w ood-residue)
Tidal Wave
$ pe
r MW
h
Source: Scotia Capital estimates.
We see installed capital costs for wind farms peaking in late 2009 to early 2010, and then dropping slowly.
Levelized costs for solar PV power could hit grid parity in five to seven years.

The Choice of a New Generation August 2008
13
Exhibit 1.4: Canadian Hydro Developers – Stock Price Performance
$4.00
$5.00
$6.00
$7.00
$8.00
$9.00
$10.00
Dec-07 Feb-08 Apr-08 Jun-08
Pric
e
0
500
1,000
1,500
2,000
2,500
3,000
3,500
4,000
Daily
Vol
ume
(000
s)
KHD (Volume) KHD (Price) STUTIL (rebased) SPTSX (rebased)
$628.5M
KHD$4.38
$8.01$4.05
143.5M
Ticker:Last Price:Market Cap:52 Wk High:52 Wk Low :Shares O/S:
Source: Bloomberg; Scotia Capital.
Our Top Picks C A N A D I A N H Y D R O D E V E L O P E R S I N C . – 1 - S E C T O R O U T P E R F O R M , $ 7 O N E - Y E A R T A R G E T
• Strong management track record. With 19 years of experience, Canadian Hydro Developers’ (KHD) management has successfully executed on the development or acquisition of numerous projects within its portfolio.
• Production and EBITDA set to soar. We anticipate the commissioning of over 400 MW (2.1x current capacity) of mostly contracted wind capacity over the next several years, which we believe will result in a 2011 EBITDA increase of 4x over 2007.
• Execution hiccups present an opportunity. A few permitting holdups have forced the delay of several of KHD’s projects, resulting in slight cost overruns. However, we believe KHD’s current share price reflects too much of an execution risk discount, and is therefore undervalued.
• Stock catalysts over the coming 12 to 18 months are plentiful. We expect to see near-perfect execution on the commissioning of several new KHD facilities in 2008 and 2009. We also look for KHD to bid up to 55 MW in the 2008 BC Hydro Clean Power Call and up to 70 MW in the Ontario RES III RFP. Dunvegan could be approved by Q1/09.
• Relative valuation attractive. KHD is currently trading at 9.9x EV/2009E EBITDA and 7.6x EV/2010E EBITDA, quite low in our opinion. Our target EV/EBITDA multiples are 13.2x on 2009E EBITDA that drops to 10.1x on 2010E. We think these multiples are justified by the high growth we expect KHD to realize over the coming years. KHD is also trading at 0.6x our NAV, relative to our group average of 0.8x.

Alternative & Renewable Energy August 2008
14
Exhibit 1.5: Boralex – Stock Price Performance
$12.00
$14.00
$16.00
$18.00
$20.00
$22.00
$24.00
Dec-07 Feb-08 Apr-08 Jun-08
Pric
e
050100150200250300350400450500
Dai
ly V
olum
e (0
00s)
BLX (Volume) BLX (Price) STUTIL (rebased) SPTSX (rebased)
$560.0M
BLX$14.80
$19.39$13.0037.8M
Ticker:Last Price:Market Cap:52 Wk High:52 Wk Low :Shares O/S:
Source: Bloomberg; Scotia Capital.
B O R A L E X I N C . – 1 - S E C T O R O U T P E R F O R M , $ 1 8 O N E - Y E A R T A R G E T
• 1,000 MW by 2012 achievable. In our minds, Boralex’s plan to nearly triple its capacity by 2012 from ~350 MW is not fully discounted in its share price. Its growth target is based on hydro growth in B.C., an entrance into the solar market, and new wind farm capacity in both Canada and Europe.
• A New England call option on natural gas. Boralex’s exposure to merchant power markets in the northeastern United States is high, as marginal power prices there are typically set by natural-gas-fired generators. We see natural gas prices rising over the long term.
• Upside potential. Strong spot northeastern U.S. power prices, our long-term outlook for a tight Connecticut REC market, and easing diesel prices coupled with improving burn rates at its wood-residue facilities are the basis for our positive outlook.
• Stock catalysts. We believe an extension of the U.S. Production Tax Credit will boost Boralex’s share price, as will higher Renewable Energy Certificate (REC) prices and Boralex being awarded power purchase agreements (PPAs) from several renewable request for proposals (RFPs). Reducing its relative commodity price exposure should occur naturally through the addition of free-fuel wind and hydro assets.
• Relative valuation attractive. While we don’t rely on relative valuation metrics to set our target prices, on a forward P/E, EV/EBITDA, P/S, and P/CF basis, Boralex is trading at a material discount to both its peer group and its closest comparable company, Canadian Hydro Developers. In our opinion, this discount is unwarranted and presents investors with an attractive entry point into the name.
Exhibits 1.6 and 1.7 on the following pages show current capacity and generation status for our coverage universe.

15
The Choice of a N
ew G
eneration A
ugust 2008
Exhibit 1.6: Coverage Universe – Capacity Status
Operating Capacity
0
50
100
150
200
250
300
350
400
450
Boralex Canadian Hydro EarthFirst Innergex Plutonic
Cap
acity
(MW
)
Intermediate IPPs
Junior IPPs
Pipeline Capacity
0
500
1,000
1,500
2,000
2,500
3,000
Boralex CanadianHydro
EarthFirst Innergex Plutonic
Cap
acity
(MW
)
PPA or Permitted Some Development Pipeline
About 400 MW of Boralex's 1,000 MW target by 2013
yet to be announced.
Near-Term Capacity
0
50
100
150
200
250
300
350
400
450
Boralex CanadianHydro
EarthFirst Innergex Plutonic
Cap
acity
(MW
)
Construction PPA & Permitted
In our opinion, successfully commisioning a project on-time and within budget is key to maintaining investor confidence in an IPP stock.
Total Capacity
0
500
1,000
1,500
2,000
2,500
3,000
Boralex CanadianHydro
EarthFirst Innergex Plutonic
Cap
acity
(MW
) Most companies within our coverage universe have an extensive project portfolio, not all of which will be realized.
Source: Company reports; Scotia Capital estimates.

Alternative &
Renew
able Energy A
ugust 2008
16 Exhibit 1.7: Coverage Universe – Generation Status
Pipeline Generation
0
1,000 2,000 3,000 4,000 5,000 6,000 7,000 8,000 9,000
Boralex Canadian Hydro EarthFirst Innergex Plutonic
Gen
erat
ion
(GW
h/y)
PPA or Permitted Some Development Pipeline
Near-Term Generation
0
200
400
600
800
1,000
1,200
Boralex CanadianHydro
EarthFirst Innergex Plutonic
Gen
erat
ion
(GW
h/y)
Construction PPA & Permitted
Total Generation
0
1,000
2,000
3,000
4,000
5,000
6,000
7,000
8,000
9,000
Boralex CanadianHydro
EarthFirst Innergex Plutonic
Gen
erat
ion
(GW
h/y)
Operating Generation
0 200 400 600 800
1,000 1,200 1,400 1,600 1,800
Boralex Canadian Hydro EarthFirst Innergex Plutonic
Gen
erat
ion
(GW
h/y)
IntermediateIPPs
Junior IPPs
No brag-a-watts in Boralex's portfolio.
Little-to-no execution risk.
Source: Company reports; Scotia Capital estimates.

The Choice of a New Generation August 2008
17
Exhibit 1.8: Our Top Sector Ideas
Sector Plays BoralexCanadian Hydro
Developers EarthFirst InnergexPlutonic Power Other
B.C. Clean Power Call ♦ ♦ ♦ ♦ ♦ ♦Quebec 2 x 250 MW wind RFPs ♦ ♦ ?Alberta merchant power ♦ ♦Connecticut RECs ♦Unrealized management value ♦ ♦ ?Geothermal ♦Solar Power n.m. n.m. ♦Marine Technologies ♦
Source: Scotia Capital.
Our Top Sector Ideas – And How to Play Them
G E T I N O N T H E B C H Y D R O C A L L F O R P O W E R
BC Hydro seeks 5,000 GWh/y of clean and renewable energy following the issuance of its Clean Power Call RFP earlier this year. The deadline for bid submissions is November 25, 2008, and we expect Electricity Purchase Agreements (EPAs or PPAs) to be awarded following the provincial government election in May 2009. Given a historical project attrition rate at about 50% and BC Hydro’s RFP guideline changes to address this, we estimate that approximately 7,000 GWh/y of renewable power projects will be awarded.
How to Play
Plutonic Power has announced that it intends to submit its 133 MW Upper Toba Valley project (three sites) and all of its 914 MW Bute Inlet project (18 run-of-river sites) into the call. Plutonic was the overall winner in BC Hydro’s 2006 Call for Power. If Plutonic’s Bute Inlet project won EPAs, it would almost certainly lock the company in for top spot again. While this may not happen, Plutonic did take a giant leap forward recently by wrapping up financing arrangements for its bid, through a unit of GE, where GE would provide up to 100% of the equity. We believe Plutonic’s current share price reflects about $4/share for its Bute Inlet project.
EarthFirst currently has the only fully permitted wind power projects (we know of) that will be entered into the Clean Power Call. Fully permitted projects partially reduce the risk to BC Hydro of project attrition, although financing issues stand out as the primary reason for attrition. Financing risk for EarthFirst remains extremely high as uncertainty continues as to whether EarthFirst will remain a going concern. We do not suggest using EarthFirst shares to play the Clean Power Call until there is more certainty regarding its future.
Boralex, Canadian Hydro Developers, and Innergex will likely all submit something into the Clean Power Call as well. Please refer to page 38 for our detailed analysis on the BC Hydro Clean Power Call.

Alternative & Renewable Energy August 2008
18
Exhibit 1.9: Alberta Spot Power Price Volatility Has Doubled Since 2002/03
$0
$100
$200
$300
$400
$500
$600
Dec-01 Dec-02 Dec-03 Dec-04 Dec-05 Dec-06 Dec-07
Dai
ly A
vera
ge P
ool P
rice
($/M
Wh) Standard Deviation
2002/03 - $34/MWh2004/05 - $37/MWh2006/07 - $68/MWh
Quarterly average pool
Daily average pool price
Source: AESO; Bloomberg; Scotia Capital.
T H E A L B E R T A M E R C H A N T P O W E R M A R K E T I S A F A I R L Y S A F E B E T
Alberta power prices are forecast by most to keep rising in the short to mid-term, providing potential upside to those companies with Alberta merchant power exposure. We note that volatility has increased considerably over the past several years, doubling since 2002/03 (Exhibit 1.9).
How to Play
Canadian Hydro Developers has good merchant power exposure at about 20% to 25% of its portfolio (depending on the season). We believe the best entry point to capitalize on KHD’s merchant exposure is now. Why? (1) We forecast that KHD will increase the contracted portion of its power portfolio to 88% by 2011, and to 92% by 2015, as 400 MW to 500 MW of new and fully contracted capacity should be online by then; and (2) In our opinion, KHD’s share price is deeply undervalued. We estimate that a $10/MWh increase in the Alberta spot price, sustained for a year, will increase KHD’s annual earnings by 1.8¢ per share based on current production levels.
T W O S M A L L H Y D R O - Q U E B E C W I N D R F P S
Hydro-Quebec has announced, but not formally launched, two 250 MW Quebec wind RFPs. We expect the RFPs to be launched simultaneously in Q4/08. The PPA prices for the First Nations and Municipal wind RFPs have been set at $95/MWh ($2008).
How to Play
In our opinion, Innergex has the best shot at being awarded PPAs in the 250 MW Quebec Municipal wind RFP. Innergex’s exclusive arrangement with Federation Quebecoise des Municipalites (FQM) essentially designates Innergex as the preferred partner for the development of all wind farm projects where municipalities choose to go through FQM.

The Choice of a New Generation August 2008
19
Exhibit 1.10: Connecticut REC Prices Are Down, But Far from Out
$0
$5
$10
$15
$20
$25
$30
$35
$40
$45
$50
$55
Sep-07 Nov-07 Jan-08 Mar-08 May-08 Jul-08
Con
nect
icut
Cla
ss I
REC
Pric
es (U
S$/R
EC o
r US$
/MW
h)
Artificial price cap
Short- to M id-Term ForecastIn our opinion, the prim ary reason for the se ll-off is due to an em ergency m otion for interim re lie f filed at FERC on July 11, to im m ediate ly increase
transfer capability at the New England – New Brunsw ick interface.
We note that the m ajority of transactions are private bilateral agreem ents . Data provided is for
publicly available transactions only.
Source: Bloomberg; Scotia Capital.
C O N N E C T I C U T R E C P R I C E S A R E A T T R A C T I V E
Renewable energy credit (REC) prices in Connecticut have dropped to the US$30/MWh area recently from the US$45/MWh to US$50/MWh range. We believe that a main reason for the sell-off is due to an emergency motion for interim relief filed at FERC to immediately increase transfer capability at the New England–New Brunswick interface (Exhibit 1.10).
According to the Integrated Resource Plan for Connecticut, growing Connecticut renewable portfolio standards (RPS) requirements “will likely be met with high REC prices … and substantial reliance on alternative compliance payments.” We agree. We estimate that at least 800+ MW of new wind capacity would have to come online each year in the northeastern U.S. power markets just to keep REC prices from rising.
How to Play
Boralex offers the only Connecticut REC price exposure within our coverage universe, and is likely the largest REC seller in the Connecticut market. While we believe that Boralex is finished REC-qualifying facilities for now (unless a new transmission line is constructed from northern Maine to NEPOOL), we estimate that about half of its EBITDA is generated through the sale of Connecticut Class I RECs. Currently, Boralex has sold forward US$45 million of RECs through 2012, or 34% of our forecast REC sales through 2012.
P A Y F O R A M A N A G E M E N T T E A M ’ S S U C C E S S F U L T R A C K R E C O R D
How to Play
Most management teams bring to the table significant past project experience. In our opinion, the depth and quality of Boralex’s and Canadian Hydro Developers’ management teams are not realized in their current share prices. For a possible management turnaround story, focus on EarthFirst (caution warranted) that recently brought Linda Chambers (an ex-TransAlta executive) on as its CEO. We do not envy her challenge at all – to bring EarthFirst away from the brink of bankruptcy.

Alternative & Renewable Energy August 2008
20
Exhibit 1.11: Geothermal Equities – Market Cap per Risked MW
$0.0
$0.5
$1.0
$1.5
$2.0
$2.5
$3.0
SierraGeothermal
PolarisGeothermal
NevadaGeothermal
WesternGeoPow er
U.S.Geothermal
Mar
ket C
apita
lizat
ion
per R
iske
d M
W ($
M)
Average
Source: Bloomberg; Scotia Capital estimates.
C O N S I D E R G E O T H E R M A L E Q U I T Y E X P O S U R E
Geothermal development projects offer investors the following: baseload power via high utilization rates (90% to 98%), strong equity IRRs in the high teens, falling capital and O&M costs over the next several years, low political risk as most projects are located in the western United States, long-term fixed price
power contracts, and government-supported financial incentives such as the U.S. PTC and RECs (Exhibit 1.11).
How to Play
There are five publicly traded geothermal power development companies in Canada: Sierra Geothermal, Polaris Geothermal, Nevada Geothermal Power, Western GeoPower, and U.S. Geothermal. We currently do not provide research coverage on any of these names, but offer company and project details at the end of the geothermal section of this report.
M A R I N E T E C H N O L O G I E S A R E S T I L L S P E C U L A T I V E , F O R N O W
Tidal, wave, and ocean thermal power sources are slowly emerging as the next generation of renewable technologies. However, they are far from being deployed on a scale comparable to wind, run-of-river, or even solar power. Consensus has not been reached on which specific technologies will prevail and most of them remain in prototype or pilot phases. We see tidal power evolving the fastest of the three, followed by wave power and ocean thermal.
How to Play
The only Canadian equity that offers material exposure to marine technologies is Finavera Renewables (not research covered). In addition to Finavera’s wind farm development projects, the company has three wave projects under development in North America, a signed PPA for a 2 MW wave farm to be located off the coast of northern California, and an early-stage wave project in South Africa.
K E E P S O L A R E Q U I T Y E X P O S U R E U P S T R E A M
Solar-grade silicon suppliers currently enjoy the highest gross margins within the solar PV supply chain at 50% to 60%. Soaring demand for crystalline-based solar panels caused silicon prices to skyrocket to the US$500/kg area from about US$30/kg in 2004. Given the significant silicon capacity that we expect will be commissioned over the next 18 months, in our opinion, current silicon prices are clearly not sustainable. However, we believe that margin compression for silicon producers will be less than for other players within the solar value chain.

The Choice of a New Generation August 2008
21
Exhibit 1.12: Solar Supply Chain Capital Costs
$1.25
$0.80
$1.25
$0.40
$2.75
$0
$1
$2
$3
$4
$5
$6
$7
Silicon Ingot & Wafer Cell Production Module Production System &Installation
Cap
ital C
ost (
$M/M
W)
Upstream Midstream Downstream
Source: Company reports; Scotia Capital estimates.
Exhibit 1.13: Solar Supply Chain Margins
55%
30%
17%
6%
18%
0%
10%
20%
30%
40%
50%
60%
70%
Silicon Ingot & Wafer Cell Production Module Production System &Installation
Gro
ss M
argi
n (%
)
Source: Company reports; Scotia Capital estimates.
How to Play
We recommend focusing on silicon producers that are able to lock in long-term silicon supply contracts at these currently high and unsustainable prices. Solar equities, the darlings of Wall Street in 2007, have fallen out of favour since the start of the year, down about 20% on average, with many stocks down over 30%. We currently do not provide research coverage for any solar names but suggest reviewing our comps table within the solar PV section of this report for investment opportunities. We also provide brief descriptions of most publicly traded companies involved in the solar space, such as 5N Plus, Arise Technologies, ATS Automation, Carmanah Technologies, Day4 Energy, Opel International, and Timminco.

Alternative & Renewable Energy August 2008
22
Valuation Methodology
W E C A N N O T J U S T I F Y U S I N G C U R R E N T M U L T I P L E S O R M E T R I C S T O V A L U E O U R C O V E R A G E U N I V E R S E
We are hesitant to give any weight to current trading multiples or other valuation metrics using current financial data, simply because the numbers are, in our opinion, near meaningless with little to no comparative value. Why: the companies within our coverage universe are mostly in their infancy – Plutonic Power and EarthFirst have no operating assets, and Innergex has 8 MW operating out of a 2,000+ MW pipeline. Boralex and Canadian Hydro Developers are the more mature companies in our universe, and are each no more than one-third built.
While we don’t focus on earnings for now, future earnings power is critical. As these companies continue to mature, P/E and EV/EBITDA multiples will become more meaningful as a comparative tool.
Our universe of coverage is primarily an event-driven basket of stocks. These stocks seem to move based on project progress, new project announcements, changing federal and regional renewable power initiatives and incentives, and movement on carbon and emissions trading policies. On a macro level and over the long term, changes in various alternative and renewable energy indices have been directly related to changes in energy prices such as oil and gas.
O U R A P P R O A C H T O V A L U I N G T H E S E C T O R
We believe that a prudent valuation approach for companies within the renewable power space must take into account several factors:
• The unique characteristics and economics of each and every renewable project, on a stand-alone basis, including: type and quality of the renewable fuel source, contract terms and pricing (if any), capital costs and costs of capital, operating and maintenance costs, management experience in project development and operations, location of the project, ownership interest, estimated project cash flow, specific financial incentives from various government levels as well as the sustainability of these incentives, agreements with key stakeholders, permitting progress, equipment warranties, EPC construction contracts, and overall project status.
• Corporate synergies/efficiencies from a multiple project portfolio, including: regional, seasonal, and resource diversification, volatility of expected quarterly cash flows, tax regimes, and shared overhead and other fixed costs.
• Corporate-level specifics such as management quality, access to capital markets, credit ratings, quality of the company’s project pipeline, and capital structure.
• Rule-of-thumb metrics that some investors use (and trade upon) as a back-of-the-envelope tool to identify good projects and/or power portfolios.
• Forward relative valuation metrics that enable the investor to more meaningfully compare the trading range of (more mature) companies relative to one another.
To accomplish our goal of considering each of these factors into our valuation approach, we chose three valuation approaches, two of which we use in setting our target prices and one as a comparative check. We use discounted cash flow analysis (DCF) and net asset value (NAV) per share to set our one-year and two-year target prices and, as a reality check, we calculate implied forward EV multiples on both 2010E and 2011E EBITDA. We explain our DCF and NAV methodologies next.

The Choice of a New Generation August 2008
23
Exhibit 1.14: Renewable Power Project Valuation Drivers
Value Drivers Considerations
Project status - operational, construction, developmentProject cash flow - contracted vs. merchant, taxes, incentivesQuality of resource - P50, P75, P90, P95, P99Contracts - PPA, w arranties, EPC contract, permits, land leasesFinanceabilityRECs - sustainabilityLocationOwnership interest - operating vs. non-operating, majority vs. minority, partner rightsManagement
Source: Scotia Capital.
D I S C O U N T E D C A S H F L O W ( D C F ) A N A L Y S I S – S U M O F T H E P R O J E C T S
In our minds, and simply stated, a renewable power project should not be worth more than the present value of the expected future cash flows of that project, discounted at a rate that reflects the project’s riskiness.
Accordingly, our target prices are heavily influenced (i.e., 75% weighted) by a sum-of-the-projects DCF approach. Every project DCF takes into account each of the factors mentioned in the first bullet above, where quantitatively possible. Exhibit 1.14 summarizes renewable power project valuation drivers.
We apply a firm-wide discount rate that reflects the cost of financing these assets, which we adjust slightly for qualitative factors such as management experience and non-project-specific corporate synergies. We also adjust our discount rate for various market-based risks (e.g., liquidity).
Most importantly, we then apply a probability of success to each project ranging from 100% for a fully commissioned, operating project to 0% for a “brag-a-watt.” In most cases, we give 90% credit for construction projects, 50% value for fully permitted projects with signed PPAs, 25% for projects with either a PPA in hand or permitting completion, and 10% credit for some material project progress. There are some exceptions to this. For example, a construction project with a 100% fixed-price construction contract deserves a higher probability of successful on-time and on-budget completion than a project that has not locked in its construction costs.
The sum of these projects plus other company-specific items such as investments are then added together to arrive at a one-year-out DCF value. One of the benefits of this valuation approach is the ability to easily identify what the market should be willing to pay for various project-related events, such as the awarding of a specific project PPA.
N E T A S S E T V A L U E ( N A V ) C A L C U L A T I O N – O U R U N I Q U E A P P R O A C H
We continuously see companies, consultants, investors, and other industry players discussing the “value” of a renewable project on a dollar per MW basis. While we find this approach to be almost too high level, we recognize and accept that it is relied upon by many market participants as a reality check for value, and therefore we should consider its use as a tool in determining what investors may be willing to pay for a stock (i.e., a compilation of projects).

Alternative & Renewable Energy August 2008
24
In our opinion, there are several limitations to placing a value per MW on a project as timing and project-specific economics are completely ignored. Our sum-of-the projects DCF approach considers each project’s specific economic characteristics, allowing us room to explore reality check value further.
Rather than assign a value per MW, we chose to place a value per GWh, which eliminates differences in the quality of an asset’s resource (i.e., various capacity factors) and allows for a somewhat more meaningful comparison. We researched corporate and project transactions, as well as the average economics of the projects in our universe of coverage to determine rule-of-thumb values for different renewable technologies, and on a per GWh basis.
We assign a rule-of-thumb value of $0.82 million per GWh for wind projects and a value of $1 million per GWh for run-of-river projects. However, expected fixed and variable costs per GWh must also be considered, for which we have assigned $0.65 million per GWh for wind and $0.8 million per GWh for small hydro. Please refer to our wind and run-of-river sections of this report for further details. Assuming all else being equal, and that capacity utilization differences are irrelevant due to a production (GWh) consideration rather than a capacity (MW) consideration, the primary difference between wind and run-of-river assets is the length of the asset’s expected life.
We finance every project using the company’s stated or targeted project capital structure, issuing new equity (and increasing the share count) at our DCF price to avoid a circular reference. Identical to our sum-of-the-projects DCF approach, we identify each project’s development stage, and multiply our standard NAV values by a probability of success (see above for details). Finally, we add and subtract (consistently across all companies) the value of unique items such as investments, management agreements, renewable energy certificates, and potential carbon credits.
We give a 25% weight to our NAV calculation in setting our target price.
W E D O N ’ T R E L Y O N R E L A T I V E V A L U A T I O N M E T R I C S , B U T H E R E T H E Y A R E
Multiples reflect the valuation sentiment of the market, and therefore relative valuation multiples may be too high if the market is overvaluing comparable firms. In our opinion, the lower transparency of a relative valuation approach versus, say, a discounted cash flow approach is compounded for junior, volatile, and highly speculative firms that will have little to no operating assets over the coming two to three years, such as EarthFirst and Plutonic Power. For well-established IPPs with proven track records of successfully operating power assets, such as TransAlta, Boralex, and Canadian Hydro Developers, we find greater comfort in applying relative valuation techniques.
While we don’t use forward EV/EBITDA and P/E multiples to set our one-year targets, we do consider them as a useful reality check. Exhibit 1.15 shows EV multiples on our 2009 and 2010 EBITDA estimates, as well as price multiples on our 2009 and 2010 earnings forecast. Exhibit 1.16 shows market capitalization and enterprise value per development stage of MW, while Exhibit 1.17 shows the same, but per development stage of expected generation (GWh/y). In Exhibit 1.18, we risk-adjusted capacities and production, which in our opinion, provides a much more meaningful comparison.

25
The Choice of a N
ew G
eneration A
ugust 2008
Exhibit 1.15: Forward Multiples
EV/EBITDA (2009E)
0.0x
2.0x
4.0x
6.0x
8.0x
10.0x
12.0x
14.0x
16.0x
18.0x
20.0x
Boralex Canadian Hydro EarthFirst Innergex Plutonic
Scotia Capital Consensus
Negative to nil EBITDA
anticipated
EV/EBITDA (2010E)
0.0x
2.0x
4.0x
6.0x
8.0x
10.0x
12.0x
14.0x
16.0x
18.0x
20.0x
Boralex Canadian Hydro EarthFirst Innergex Plutonic
Scotia Capital Consensus
Negative EV, but $4.3 million of 2010E EBITDA
We forecast negative EBITDA in 2010,
while the consensus estimate is for
minimal positive EBITDA, and an
EV/EBITDA >100x
P/E (2009E)
0.0x
10.0x
20.0x
30.0x
40.0x
50.0x
60.0x
Boralex Canadian Hydro EarthFirst Innergex Plutonic
Scotia Capital Consensus
Negative EPS anticipated
P/E (2010E)
0.0x
5.0x
10.0x
15.0x
20.0x
25.0x
30.0x
Boralex Canadian Hydro EarthFirst Innergex Plutonic
Scotia Capital Consensus
Negative EPS anticipated
Value gap
Source: Reuters; Scotia Capital estimates.

Alternative &
Renew
able Energy A
ugust 2008
26 Exhibit 1.16: Market Capitalization and Enterprise Value per Capacity Status
Total Capacity
-$200
$0
$200
$400
$600
$800
$1,000
$1,200
Boralex CanadianHydro
EarthFirst Innergex Plutonic
($00
0s p
er M
W)
Market Cap. Enterprise Value
Boralex is not overvalued if unannounced capacity
additions are considered
Operating Capacity
$0
$5,000
$10,000
$15,000
$20,000
$25,000
$30,000
$35,000
Boralex CanadianHydro
EarthFirst Innergex Plutonic
($00
0s p
er M
W)
Market Cap. Enterprise Value
High execution
risk
Will drop by 7x to 8x by the end of Q4/08, when new INE
capacity comes online
Pipeline Capacity
-$500
$0$500
$1,000
$1,500$2,000
$2,500
$3,000
$3,500$4,000
$4,500
Boralex CanadianHydro
EarthFirst Innergex Plutonic
($00
0s p
er M
W)
Market Cap. Enterprise Value
We think Boralex's stock has the mostupside leverage to new capacity
announcements, as relatively little new capacity has been announced
Near-Term Capacity
-$500
$0
$500
$1,000
$1,500
$2,000
$2,500
$3,000
$3,500
$4,000
Boralex CanadianHydro
EarthFirst Innergex Plutonic
($00
0s p
er M
W)
Market Cap. Enterprise ValueAll EarthFirst
capacity at risk
Almost no construction risk on PCC's flagship construction project
Source: Reuters; Scotia Capital estimates.

27
The Choice of a N
ew G
eneration A
ugust 2008
Exhibit 1.17: Market Capitalization and Enterprise Value per Generation Status
Near-Term Generation
-$200
$0
$200
$400
$600
$800
$1,000
$1,200
$1,400
Boralex CanadianHydro
EarthFirst Innergex Plutonic
($00
0s p
er G
Wh/
y)
Market Cap. Enterprise Value
Why execution risk is high for INE
The market has placed a higher near-term execution risk discount on KHD due to
several hiccups since 2006
Operating Generation
$0
$1,000
$2,000
$3,000
$4,000
$5,000
$6,000
$7,000
Boralex CanadianHydro
EarthFirst Innergex Plutonic
($00
0s p
er G
Wh/
y)
Market Cap. Enterprise Value
Only 8 MW of operating capacity
No operating capacity
Total Generation
-$50
$0
$50
$100
$150
$200
$250
$300
Boralex Canadian Hydro EarthFirst Innergex Plutonic
($00
0s p
er G
Wh/
y)
Market Cap. Enterprise Value
Large undeveloped pipeline that the market
has given too much credit to
Pipeline Generation
-$200$0
$200$400$600$800
$1,000$1,200$1,400$1,600$1,800
Boralex CanadianHydro
EarthFirst Innergex Plutonic
($00
0s p
er G
Wh/
y)
Market Cap. Enterprise Value
Development pipelines are not always realized, but it is critical to have a
portfolio of projects at various stages of development
Boralex appears over valued, but it has no
brag-a-watts, and has not announced many projects
for its 2012 goal.
Source: Reuters; Scotia Capital estimates.

Alternative &
Renew
able Energy A
ugust 2008
28 Exhibit 1.18: Other Comparable Metrics
Discounted Cash Flow
0.0x
0.2x
0.4x
0.6x
0.8x
1.0x
1.2x
1.4x
1.6x
1.8x
Boralex CanadianHydro
EarthFirst Innergex Plutonic
P/DCF Target/DCF
Relatively overvalued
Large opportunity
Premium multiples warranted
Net Asset Value
0.0x
0.2x
0.4x
0.6x
0.8x
1.0x
1.2x
Boralex CanadianHydro
EarthFirst Innergex Plutonic
P/NAV Target/NAV
INE should trade at a discount to KHD
& BLX
About rightShort-term
upside potential
Value per Risked MW
-$500
$0
$500
$1,000
$1,500
$2,000
Boralex CanadianHydro
EarthFirst Innergex Plutonic
($00
0s p
er M
W)
Market Cap. Enterprise Value
Going concern risk high
BLX more undervalued if lower announced pipeline
considered
INE should be at least in
line w ith PCC
Value per Risked GWh/y
-$100
$0
$100
$200
$300
$400
$500
$600
Boralex CanadianHydro
EarthFirst Innergex Plutonic
($00
0s p
er G
Wh/
y)
Market Cap. Enterprise Value
Going concern risk high
Value gap
Source: Reuters; Scotia Capital estimates.

The Choice of a New Generation August 2008
29
Exhibit 1.19: Countries Continue to Implement Renewable Portfolio Standards
69
12 13 1518 19
3438 39
44
52
1997 1998 1999 2000 2001 2002 2003 2004 2005 2006 2007 2008E
Source: REN21; Scotia Capital.
Renewable Energy Demand Drivers Suggest Industry Growth Acceleration Ahead R E N E W A B L E P O R T F O L I O S T A N D A R D S
Regulatory policies that mandate the use of renewable energy is the number one key driver for the industry’s growth. Once implemented, renewable portfolio standards (RPS) obligate utilities to produce or purchase specific amounts of renewable power, including wind, solar, biomass, hydro, geothermal, and others. Typically RPS targets range between 5% and 25% to be achieved at some point in the future, generally between 2012 and 2020.
To achieve an RPS, financial support mechanisms must be adopted to ensure providers of renewable power earn reasonable economic returns, as the levelized cost of renewable power generation is typically higher than the levelized cost of traditional power generation sources such as coal. Later in this report, we outline and discuss the status of renewable portfolio standards and financial incentives in Canada, the U.S., and the rest of the world.
We believe there are four primary reasons for the growth in the number and the intensity of renewable portfolio standards around the world: (1) rising energy prices; (2) the increased need for energy security and independence; (3) greater environmental awareness and fear of climate change; and (4) the implementation of the Kyoto Protocol. We discuss each of these below.
1. Rising Energy Prices
Over the past four years, crude oil prices have increased by almost 200%, making non-fossil fuel power sources more attractive on a relative cost basis. Growth (population, GDP, real income per capita) in China, India, and other emerging economies is booming. The result: a surge in demand for fossil fuels, while supply has not been able to respond as quickly. Additionally, we believe that financial players such as hedge funds may have been pushing commodity prices higher through their speculative bets. Exhibit 1.20 shows a clear and strong correlation (>90%) between the change in prices of oil and the Wilderhill New Energy Global Innovation Index (NEX), a widely used tracking index for alternative & renewable energy stocks.

Alternative & Renewable Energy August 2008
30
Exhibit 1.21: Climate Change Concerns
Human health impacts25%
Droughts, w ater shortages
17%
Loss of plant/animal species
14%
Extreme w eather patterns
13%
Economic costs6%
Rising sea levels6%
Combination, all, other16%
None3%
Source: GlobeScan; Scotia Capital.
Exhibit 1.20: Alternative Energy Indices Have Historically Tracked Oil Prices
0
50
100
150
200
250
300
350
400
450
500
Dec-02 Dec-03 Dec-04 Dec-05 Dec-06 Dec-07
Inde
x =
100
@ D
ec 3
1, 2
002
WilderHill New Energy Global
Innovation Index
WTI Oil (rebased)
R2 = 0.9188
Source: Bloomberg; Scotia Capital.
2. Need for Energy Security & Independence
The uneven distribution by country of fossil-fuel based energy supplies, coupled with the need for all nations to ensure their rising energy requirements are always fulfilled, have led to vulnerabilities. Threats to global energy security include: (1) political instability of energy-producing nations; (2) manipulation of energy supplies; (3) competition over energy sources; (4) attacks on supply infrastructure; and (5) accidents and natural disasters. Renewable power can diversify energy portfolio mixes, reduce the need for energy imports, and introduce greater flexibility for deployment of fossil fuels.
3. Greater Environmental Awareness and Fear of Climate Change
Two-thirds of Canadians rate climate change as a “very serious problem,” according to Environment Monitor. Around the world, people are sharing a similar concern. Exhibit 1.21 shows specifically what
people fear most about climate change: the potential impact to human health, as well as possible water shortages.
The debate as to whether climate change is real; how much it has been accelerated by industrialization; and whether it can be controlled is well beyond the scope of this report. From an investment point of view, we believe it is important to recognize that the awareness and fears of climate change are real, and that politicians have picked up on this. These politicians are now taking steps to implement climate change-related policies that they believe will be viewed favourably by their constituents. The result: renewable portfolio standards.

The Choice of a New Generation August 2008
31
Exhibit 1.22: Change in GHG Emissions
74.4%
53.3%
42.8%
26.6%
26.3%
25.6%
25.3%
24.7%
18.0%
17.4%
16.3%
12.1%
10.5%
8.8%
6.9%
1.7%
0.4%
0.4%
-0.4%
-1.3%
-1.5%
-1.6%
-2.5%
-3.1%
-5.4%
-7.0%
-7.3%
-14.8%
-18.4%
-25.8%
-28.7%
-30.7%
-32.0%
-33.6%
-40.6%
-45.6%
-47.2%
-50.9%
-54.1%
-54.7%
-58.9%
-100% -75% -50% -25% 0% 25% 50% 75% 100%
Turkey
Spain
Portugal
Greece
Ireland
Australia
Canada
New Zealand
Austria
Liechtenstein
United States
Italy
Iceland
Norw ay
Japan
Sw itzerland
Luxembourg
Slovenia
Netherlands
Belgium
EU
France
Finland
Monaco
Croatia
Denmark
Sw eden
United Kingdom
Germany
Czech Republic
Russian Federation
Hungary
Poland
Slovakia
Belarus
Romania
Bulgaria
Estonia
Lithuania
Ukraine
Latvia
Source: UNFCCC.
4. Kyoto Protocol
In 1997, the United Nations Framework Convention on Climate Change (UNFCCC) enacted the Kyoto Protocol, a protocol designed to reduce greenhouse gas (GHG) emissions for the purpose of preventing anthropogenic climate change. As of May 2008, 182 countries had ratified the Kyoto Protocol, including Canada. The United States has not ratified the treaty. Between 2008 and 2012, Annex I countries (i.e., developed nations) must reduce their collective GHGs by 5.2% below a 1990 baseline level by 2012. Canada’s goal is for a 6% reduction. Exhibit 1.22 shows the change in GHG emissions to date.
I M P L E M E N T A T I O N O F C A P - A N D -T R A D E P R O G R A M S O R C A R B O N T A X E S
Numerous proposals exist throughout the world to provide economic incentives to curb greenhouse gas emissions, the two most popular being a cap-and-trade system or a carbon tax, which are highlighted later in this report.
Regardless of the type of program implemented to achieve a reduction in carbon emissions, one thing is clear: placing a price on carbon increases the cost per MWh to produce conventional fossil fuel-fired power plants, making renewable energy options that much more attractive to governments, utilities, and consumers.
F A L L I N G C O S T S O F R E N E W A B L E P O W E R
On an absolute basis, the real cost curves for renewable energy technologies continue to decline. While there have been some setbacks such as a wind turbine component supply
bottleneck and a supply/demand imbalance for solar-grade silicon, we view these as short-term trends. Government and corporate R&D programs will continue to bring down the costs of new renewable power technologies.
On a relative basis, rising costs to build conventional power plants, such as the introduction of carbon costs, higher labour and material costs, and the sometimes arduous regulatory approval process (i.e., nuclear) have led to an increased demand for renewable power.

Alternative & Renewable Energy August 2008
32
Exhibit 1.23: WilderHill New Energy Global Innovation Index (NEX)
0
50
100
150
200
250
Dec-06 Mar-07 Jun-07 Sep-07 Dec-07 Mar-08 Jun-08
Inde
x =
100
@ D
ec 3
1, 2
006
WinderHill Index (rebased) S&P/TSX Index (rebased) MSCI World Index (rebased) Oil (rebased)
Source: Bloomberg; Scotia Capital.
Equity Performance to Date The WilderHill New Energy Global Innovation Index (NEX), our preferred tracking index for global alternative energy equities, increased almost 58% in 2007 (Exhibit 1.23). Why: (1) soaring energy prices; (2) solar stock euphoria; (3) numerous alternative energy funds and ETFs were launched; and (4) climate change fears increased. While wind-related equities rose sharply in 2007, up 65.8%, solar players were clearly preferred. On average, solar stocks increased by more than 150% as investors paid for exposure to soaring silicon prices. Despite record oil prices, ethanol and other biofuel companies went out of favour in 2007 (down 19.1%). Soaring corn prices led to almost zero ethanol cash margins, hurting U.S. ethanol producers, while soaring food-based biodiesel inputs did the same to biodiesel producers.
Alternative energy stocks fell 17.9% in Q1/08, led by solar equities that plummeted 31.6%. Solar equity investors learned their lessons from the dot-com bubble, and stopped chasing unreasonable expectations and valuations. Additionally, Q1/08 saw real (and an increased fear of further) tightening credit conditions that forced wind developers to sell off projects to finance others. The five worst performers in the NEX were all U.S.-based companies. The only gaining sector during Q1/08 in the NEX was power storage, up 10% in value. Our coverage universe of Canadian junior and intermediate IPPs was down 0.1% on average.
Q2/08 saw the NEX gain 6.2% compared to the S&P 500 and the MSCI World Index that were down 3.2% and 2.5%, respectively. Soaring oil prices seemed to keep renewable equities above water, while the credit crunch, coupled with fears of a global economic slowdown, weighed on the broader indices. Solar stocks bounced back, as did most other renewable power sectors. Biofuel-related stocks continued to fall, ending the quarter down another 1.3%. Almost all equities in our coverage universe were hit hard in Q2/08, falling between 17% and 27%. The only exception was Plutonic Power that slid a nominal 1.1% in the second quarter, likely due to positive press releases that included the addition of 11 projects to its development portfolio.
Canadian equities within the NEX include Boralex, Canadian Hydro Developers, 5N Plus, and Ballard Power. On the following page (Exhibit 1.24), we offer company-specific reasons for stock performance within our coverage universe during the first two quarters of the year. Exhibits 1.25, 1.26, and 1.27 show sub-sector performance of solar, wind, and geothermal equities over the past 18 months.

33
The Choice of a N
ew G
eneration A
ugust 2008
Exhibit 1.24: A Look at the Recent Performance of Our Independent Power Producer Coverage Universe
-2.3%
2.8%1.4%
10.6%
-13.4%
-6.3%
-3.5%-1.1%
-19.4%-17.6%
-22.1%
-26.9%
5.4%
8.4%
-40%
-30%
-20%
-10%
0%
10%
20%
30%
40%
Plutonic Boralex Canadian Hydro EarthFirst Innergex S&P TSX Utilities S&P TSXComposite
Pric
e A
ppre
ciat
ion
Q1/08 Q2/08
PCC sells Rainy River and Hope projects to AltaGas
Income Trust
PCC finalizes L/T IBA w/ Sechelt First Nation
11 new projects are added to development
pipeline
Submits 914 MW Bute project into
environmental permitting process
Signed L/T agreement w ith Knight Piesold
Strong Q4/07 earnings results
Won Hydro-Quebec PPAs, but wood-residue and
fuel costs rising
Development pipeline taking longer than
expected
Melancthon II time delays and cost overrun
COO resigns
Melancthon II receives OMB approval to proceed
Won two Hydro-Quebec PPAs, but gave up Le
Nordais Expansion
Wolfe Island costs increase by 10%, and commissioning is set back by five months
Acquires Nuttby Mountain w ind project in
Nova Scotia
Completes credit commitment
Signs Enercon turbine agreement for Grand
Valley
Grand Valley setback due to permitting delays
Hired new CEO, a former TA executive
Dokie I construction
Lost three Hydro-Quebec bids
Acquired rights to 200 MW of BC hydro projects
Source: Bloomberg; Scotia Capital.

Alternative & Renewable Energy August 2008
34
Exhibit 1.27: Geothermal Index Performance (Canadian/U.S.)
0
50
100
150
200
250
Dec-06 Mar-07 Jun-07 Sep-07 Dec-07 Mar-08 Jun-08
Inde
x =
100
@ D
ec 3
1, 2
006
Geothermal Index (rebased) S&P/TSX Index (rebased) MSCI World Index (rebased) Oil (rebased)
Source: Bloomberg; Scotia Capital.
Exhibit 1.26: Solar Value Chain Index Performance (Global)
0
50
100
150
200
250
Dec-06 Mar-07 Jun-07 Sep-07 Dec-07 Mar-08 Jun-08
Inde
x =
100
@ D
ec 3
1, 2
006
Solar Index (rebased) S&P/TSX Index (rebased) MSCI World Index (rebased) Oil (rebased)
Source: Bloomberg; Scotia Capital.
Exhibit 1.25: Wind Turbine Manufacturer Index Performance (Global)
0
50
100
150
200
250
Dec-06 Mar-07 Jun-07 Sep-07 Dec-07 Mar-08 Jun-08
Inde
x =
100
@ D
ec 3
1, 2
006
Wind Index (rebased) S&P/TSX Index (rebased) MSCI World Index (rebased) Oil (rebased)
Source: Bloomberg; Scotia Capital.

The Choice of a New Generation August 2008
35
Exhibit 1.28: Under Either Proposal, Consumers Pay More
$0
$20
$40
$60
$80
$100
$120
$140
$0 $5 $10 $15 $20 $25 $30 $35 $40 $45 $50
Carbon Price ($/MtCO2e)
Leve
lized
Cos
t ($/
MW
h)
Geothermal
Run-of-River
Wind
Natural Gas
Coal
Source: Scotia Capital estimates.
Cap-and-Trade or Carbon Tax? Canadians and others continue to debate whether a cap-and-trade or carbon tax is the most effective method to reduce emissions. As of early August, the Conservatives are formulating a national cap-and-trade program, while the Liberals have proposed a carbon tax. Both methods of penalizing carbon emissions have their merits. We believe that a market-based system (i.e., cap-and-trade) is not only the better option, but will likely prevail in both Canada and the United States.
Complicating matters are the provinces that have their own plans to achieve GHG emission reductions. Both B.C. and Quebec have implemented carbon taxes targeted at reducing emissions, while Ontario and Quebec are proposing a joint cap-and-trade system that could begin as early as 2010. Please refer to the section starting on p. 51 for a summary of regional climate change initiatives to date.
Under a cap-and-trade system, a regulatory body allocates CO2e emission allowances to companies, typically by way of auction, but sometimes for no cost. Each allowance represents the right to emit one tonne of CO2 or CO2 equivalent GHG. The total allowances distributed to a company represent the total emissions that it can produce in any given year without penalty. Firms that emit less than their allowances permit, or can reduce emissions more cheaply than their peers, can either bank their surplus allowances for future years or can sell them to companies whose emissions exceed their own allowances. Distribution of allowances is typically reduced every year, creating a greater liability for those companies that have not lowered their emissions or their emission intensity. This market-based approach assures that emission reductions occur at the lowest possible cost.
A carbon tax simply charges producers of CO2e a set price per tonne, which periodically increases to motivate emitting companies to produce fewer emissions. Unlike a cap-and-trade system, a carbon tax already has the supporting financial infrastructure and does not need a new financial market to exist.
U N D E R E I T H E R C A R B O N P R O P O S A L , C O N S U M E R S P A Y M O R E
The cost of producing electricity will increase for fossil fuel power plants under either a tax or cap-and-trade system (Exhibit 1.28). In our view, utilities will pass on increasing costs to consumers regardless of which system is implemented, implying high generation costs for natural gas and coal plants. We believe that as commodity prices rise and the likelihood of a carbon trading system (or carbon tax) increases, investment in renewable power facilities should only accelerate as they become relatively cheaper alternatives. Exhibits 1.29 and 1.30 sensitize coal and natural gas levelized costs to changes in both carbon prices and fossil fuel prices.

Alternative & Renewable Energy August 2008
36
Exhibit 1.29: Natural Gas Power Levelized Cost Sensitivity
$95 $0 $10 $20 $30 $40 $50$6 $68 $73 $78 $83 $88 $93$7 $77 $82 $87 $92 $97 $102$8 $86 $91 $96 $101 $106 $111$9 $95 $100 $105 $110 $115 $120
$10 $104 $109 $114 $119 $124 $129$11 $113 $118 $123 $128 $133 $138$12 $122 $127 $132 $137 $142 $147
Carbon Price (US$/MtCO2e)
Natu
ral G
as P
rice
(US$
/MM
btu)
Source: Scotia Capital estimates.
Exhibit 1.30: Coal Power Levelized Cost Sensitivity
50 $0 $10 $20 $30 $40 $50$5 $49 $59 $69 $79 $89 $99$6 $49 $59 $69 $79 $89 $99$7 $50 $60 $70 $80 $90 $100$8 $50 $60 $70 $80 $90 $100$9 $51 $61 $71 $81 $91 $101
$10 $51 $61 $71 $81 $91 $101$11 $52 $62 $72 $82 $92 $102
Carbon Price (US$/MtCO2e)
Coa
l Pri
ce
(US
$/st
)
Source: Scotia Capital estimates.
In our view, a cap-and-trade system will likely prevail. Why: (1) generates innovation; (2) sets mandatory emissions reduction targets; (3) offers an equal playing field among competitors; (4) offers flexibility to firms deciding how to meet their obligations; (5) by selling allowances, governments can raise money for other programs – similar to carbon taxes; (6) allows the banking of allowances to deal with macroeconomic fluctuations. Additionally, in the United States, cap-and-trade systems have the most support (including both U.S. Presidential candidates); there are three regional initiatives in the United States supporting cap-and-trade, and the majority of environmentalists favour a system that places a hard limit on emissions.
A key challenge for a carbon tax proposal is the establishment of a fair price for carbon. Additionally, a carbon tax does not set a limit on emissions. Under a carbon tax, no price discovery exists, and the price of carbon will always be a point of contention between business and government.
The Canadian government’s emissions reduction plan, details of which are to be released shortly, proposes to reduce emissions to 20% below 2006 levels by 2020 through the implementation of a cap-and-trade system set to begin in 2010. The plan will specifically be a baseline and credit program where entities that emit less than their targets will be given credits to be sold to those polluters that do not meet their targets. The Canadian government has modelled a market-clearing carbon price that will rise from $25/tonne CO2e in 2010 to $65/tonne CO2e in 2020. Exhibit 1.31 details GHG emissions reduction targets by the federal and provincial governments, while Exhibits 1.32 and 1.33 show the impact of the federal government’s Turning the Corner plan.

The Choice of a New Generation August 2008
37
Exhibit 1.31: Federal and Provincial GHG Emissions Reduction Targets
Jurisdiction Target Announced
Federal Reduce GHGs by 20% below 2006 levels by 2020 April, 2007
British Columbia Reduce GHGs to 33% below 2007 levels by 2020 February 2007 Alberta Reduce emissions by 50% relative to business-as-usual case January 2008 by 2050 or 14% relative to 2005 Saskatchewan Reduce GHGs to 32% below 2004 levels by 2020 June 2007 Manitoba Reduce GHGs to 6% below 1990 levels by 2012 October 2002 Ontario Reduce GHGs to 15% below 1990 levels by 2020 June 2007 Quebec Reduce GHGs to 6% below 1990 levels by 2012 June 2006 New Brunswick Reduce GHGs to 10% below 1990 levels by 2020 June 2007 Nova Scotia Reduce GHGs to 10% below 1990 levels by 2020 March 2007 Prince Edward Island Reduce GHGs to 1990 levels by 2010, 10% below 1990 August 2001 levels by 2020 Newfoundland and Labrador Reduce GHGs to 10% below 1990 levels by 2020 June 2007 Yukon No explicit target Nunavut No explicit target Northwest Territories No explicit target
Source: Government of Canada.
Exhibit 1.33: Turning the Corner Case
550
600
650
700
750
800
850
900
950
2006 2007 2008 2009 2010 2011 2012 2013 2014 2015 2016 2017 2018 2019 2020
Meg
aton
nes
Turning the Corner and other actions.
Business as Usual
Source: Government of Canada; Scotia Capital.
Exhibit 1.32: Business as Usual Case
0
100
200
300
400
500
600
700
800
900
1,000
2005 2006 2010 2015 2020
Meg
aton
nes
Alberta Ontario Quebec British Columbia Saskatchew an Nova Scotia New Brunsw ick Manitoba New foundland PEI/Territories/Other
Source: Government of Canada.

Alternative & Renewable Energy August 2008
38
Exhibit 1.34: Our Call on the B.C. Call
4,500 5,000 5,500 6,000 6,500 7,000 7,500 8,00030% 1,712 MW 1,903 MW 2,093 MW 2,283 MW 2,473 MW 2,664 MW 2,854 MW 3,044 MW35% 1,468 MW 1,631 MW 1,794 MW 1,957 MW 2,120 MW 2,283 MW 2,446 MW 2,609 MW40% 1,284 MW 1,427 MW 1,570 MW 1,712 MW 1,855 MW 1,998 MW 2,140 MW 2,283 MW45% 1,142 MW 1,268 MW 1,395 MW 1,522 MW 1,649 MW 1,776 MW 1,903 MW 2,029 MW50% 1,027 MW 1,142 MW 1,256 MW 1,370 MW 1,484 MW 1,598 MW 1,712 MW 1,826 MW55% 934 MW 1,038 MW 1,142 MW 1,245 MW 1,349 MW 1,453 MW 1,557 MW 1,660 MW60% 856 MW 951 MW 1,046 MW 1,142 MW 1,237 MW 1,332 MW 1,427 MW 1,522 MW
Potential BC Hydro Clean Power Call Award Scenarios (GWh per year)
Capa
city
Fac
tor
SC Est. (low)
SC Est. (high)SC Est.
(base) 2006 Call (actual)
Source: Scotia Capital estimates.
Our Call on the B.C. Call On June 11, 2008, BC Hydro formally issued its Clean Power Call RFPs. Under the terms of the Call, BC Hydro seeks 5,000 GWh/y of clean and renewable resources from projects using proven technologies. In-service dates will range between 2010 and 2016. The RFP submission deadline is November 25, 2008. We expect Electricity Purchase Agreements (EPAs or PPAs) to be awarded following the provincial government election in May 2009.
Under BC Hydro’s 2006 Call for Power, almost 50% more annual energy production was awarded than the Call had anticipated, or 7,351 GWh/y, compared with 5,000 GWh/y that was requested.
In our opinion, EPAs awarded will average about $120/MWh ($2009).
Highlights of the 2008 BC Hydro Clean Power Call are as follows:
• Wind integration adjustment: Qualified wind power projects that are awarded EPAs will receive a $10/MWh premium that will be added to the firm energy price.
• More flexible commissioning period: Unlike BC Hydro’s 2006 Call for Power, the Clean Power Call will allow for a six-year window for projects to be commissioned, from November 2010 through November 2016.
• EPA length: 15 to 40 years.
• No environmental attributes: All environmental attributes are to be assigned to BC Hydro. Winning developers will not be able to sell Emissions Reduction Credits, Renewable Energy Certificates, or any other types of carbon/renewable-related credits.
Based on the outcomes of several factors, we think anywhere from 1,000 MW (5,000 GWh/y) to 2,100 MW (7,500 GWh/y) of renewable power capacity could be awarded in the BC Clean Power Call. Our point estimate of awarded capacity is 1,776 MW (7,000 GWh/y), or 200 MW more than what was awarded in the BC Hydro 2006 Call (Exhibit 1.34). Our point estimate is based on the following: (1) BC Hydro will award about 40% to 50% more expected annual generation than the announced 5,000 GWh/y, similar to its 2006 Call; and (2) more wind power capacity will be awarded than in the past Call, requiring more MW due to its typically lower capacity factor over run-of-river power.

The Choice of a New Generation August 2008
39
Exhibit 1.35: BC Hydro Could Issue Two More Clean Power Calls for a 2016 Start-Up
2016E(GWh)
Forecast consumption @ 2% growth per year 64,600Insurance @ 2.5% 1,615Est. 2007 B.C. supply (ex. Imports) (44,750)
Actual 2006 Call for Power (7,351)Est. attrition @ 50% 3,676
Est. 2008 Clean Power Call (7,000)Est. attrition @ 30% 2,100
Est. 2008 Bioenergy Call - Phase I (1,000)Est. attrition @ 30% 300
Est. 2008 Bioenergy Call - Phase II (500)Est. attrition @ 30% 150
Est. Standing Offer Program (1,000)Est. attrition @ 30% 300
Scotia Capital est. (High) 11,140
Less: Peace River Site C (4,600)Less: Demand Side Management (1,000)
Scotia Capital est. (Low) 5,540
The Attrition rate in the 2003 Call for Pow er w as 75%, and is expected to be at least 50% in the 2006 Call for Pow er. BC Hydro continues to design its Calls to reduce this rate. We assume it is somew hat successful.
Two to three more Clean Power Calls?
One to two more Clean Power Calls?
Source: BC Hydro; Scotia Capital estimates.
E X P E C T H U G E C O M P E T I T I O N
By the end of November, we could see as much as 28,000 GWh/y of capacity bid into the B.C. Hydro Call; assuming that no more than 7,000 GWh/y of renewable power production is awarded with EPAs, then there is an approximate 25% probability of a bid GWh being awarded a long-term power contract (see Exhibit 1.36 on the following page).
For our universe of coverage, we estimate that no more than 400 MW of wind capacity and 1,350 MW of hydro capacity could be bid. Excluding Plutonic Power’s 914 MW Bute Inlet project, which will almost certainly be bid, the likely hydro capacity bid drops to 300 MW. Please refer to our company-specific reports for further details.
M O R E C L E A N P O W E R C A L L S L I K E L Y P O S T B . C . E L E C T I O N
The 2007 B.C. Energy Plan seeks energy self-sufficiency by 2016, 90% of its power production to be generated by renewable technologies, and a 33% reduction of CO2e emissions by 2020 from current levels. To achieve energy independence today, we estimate that B.C. would need to add up to 8,000 GWh/y of generation capacity to eliminate the 10% to 15% of imports that the United States and Alberta supply. Consumption growth at 2% per year through 2016 would push B.C.’s new supply requirement to about 20,000 GWh/y. However, much of the supply needed has been addressed by various Calls already. In our view, BC Hydro could issue one to three more ~5,000 GWh/y renewable power Calls to meet its 2016 goal of energy self-sufficiency (Exhibit 1.35).

Alternative &
Renew
able Energy A
ugust 2008
40
Exhibit 1.36: Our Best Guess on What Companies May Bid in the B.C. Clean Power Call
CompanyMW
(Low)MW
(High)MW
(Low)MW
(High)MW
(Low)MW
(High)GWh/y (Low)
GWh/y (High)
Boralex - - - 100 0 100 0 450Canadian Hydro Developers - - - 55 0 55 0 250EarthFirst - 227 - - 0 227 0 650Innergex 75 150 50 150 125 300 425 1,100Plutonic Power - - 1,047 1,047 1,047 1,047 4,575 4,575
75 377 1,097 1,352 1,172 1,729 5,000 7,025
Aeolis Wind Power - 1,000 - - 0 1,000 0 2,900AXOR Group - - - 125 0 125 0 550Confederation Power - - 99 99 99 99 425 425EPCOR Power 100 200 - - 100 200 300 575Finavera Renewables 300 300 - - 300 300 875 875Fred Olson Renewables - 225 - - 0 225 0 650Kitamaat Renwable Energy - - 51 134 51 134 225 575Kleana Power - - 280 800 280 800 1,225 3,500NaiKun Wind 320 700 - - 320 700 925 2,025Nomis Power 100 200 - - 100 200 300 575NovaGoldPower - - - 80 0 80 0 350Primex - - - 68 0 68 0 300Pristine Power - - 308 808 308 808 1,350 3,550Regional Power - - 100 145 100 145 450 625Run of River Power - - 180 213 180 213 800 925Schneider Power - - - - 0 0 0 0Sea Breeze - 100 28 28 28 128 125 400Stlixwim Hydro - - - 62 0 62 0 275
820 2,725 1,046 2,562 1,866 5,287 7,000 19,075Other/Utilities/Confidential 755 1,100 215 532 540 779 1,550 2,375
1,650 4,202 2,358 4,446 3,578 7,794 13,550 28,475
Note: To estimate production, we assigned average capacity factors of 33% for wind, and 50% for hydro.
Est. TotalWind Run-of-River Est. Total
Source: Company reports; Scotia Capital estimates.

The Choice of a New Generation August 2008
41
Exhibit 1.37: BC Hydro Clean Power Call RFP Schedule
Event/Activity Scheduled Date(s)
Submission of Registration Documents, and registration fee August 12, 2008
BCTC Interconnection Workshop September 15, 2008
Issue of Specimen EPA September 22, 2008
Proponents Submit Request to BC Hydro (for Distribution System-connected Projects) for a Preliminary Interconnection Study
October 7, 2008
Proponents Submit Request to BCTC (for Transmission System-connected Projects) for a Feasibility Interconnection Study
October 17, 2008
Proponents’ RFP Information Session October 20, 2008
Filing of Preliminary Interconnection Study agreements with BC Hydro for Distribution System-connected Projects
November 7, 2008
Filing of Feasibility Interconnection Study agreements with BCTC for Transmission System-connected Projects
November 17, 2008
PROPOSAL SUBMISSION November 25, 2008
Proponents with Projects in Fortis Service Area submit to BC Hydro a FortisBC interconnection study
December 1, 2008
Post-Proposal discussions January through mid-April, 2009
Release of Feasibility Interconnection Study, Preliminary Interconnection Study, or special study (Fortis Service Area) as applicable
February 23, 2009
Final Evaluation and EPA awards Mid-April through June, 2009
Source: BC Hydro.
Exhibit 1.37 shows the anticipated schedule for the BC Hydro Clean Power Call. Key dates include the submission deadline of November 25 and the EPA awards, which we believe will occur after the May 2009 provincial election.

Alternative & Renewable Energy August 2008
42
Exhibit 1.38: Global Growth of Feed-In Tariff Policies
Year Cumulative Countries/States/Provinces Added
1978 1 United States1990 2 Germany1991 3 Switzerland1992 4 Italy1993 6 Denmark, India1994 8 Spain, Greece1997 9 Sri Lanka1998 10 Sweden1999 13 Portugal, Norway, Slovenia2001 15 France, Latvia2002 21 Algeria, Austria, Brazil, Czech Republic, Indonesia, Lithuania2003 28 Cyprus, Estonia, Hungary, South Korea, Slovak Republic, India2004 34 Italy, Israel, Nicaragua, Prince Edward Island (Canada), India (2)2005 41 Ecuador, Turkey, Washington (U.S.), Ireland, China, India (3)2006 44 Ontario (Canada), Argentina, Thailand2007 46 South Australia (Australia), Croatia
Source: REN21.
Follow Feed-In Tariff Legislation In our opinion, feed-in tariffs (FITs) have proven to be one of the world’s most effective renewable energy policies. FIT legislation is currently in place in more than 40 countries, states, and provinces throughout the world. While FITs differ by region, the principles are essentially the same: (1) utilities provide grid access for developers producing renewable power; (2) utilities are required to purchase from the developer all of the renewable energy produced; (3) a pre-established price or price formula is set; and (4) the contract is for a set period of time, ranging between 10 and 40 years.
Germany introduced the first modern-day FIT in 1990, and is now the global leader in renewable energy technology and use. Germany has 1.3 million solar panels in place, over 22,000 MW of installed wind capacity, and has reached its target of producing 12.5% of its power from renewable sources three years ahead of schedule. Exhibit 1.38 shows the growth of feed-in tariff policies globally.
Ontario was the first to introduce feed-in tariffs to Canada, and now many provinces and states are following Ontario’s lead. Michigan recently introduced the Michigan Renewable Energy Sources Act that offers 20-year contracts for all proven renewable energy technologies. Under the act, solar power could receive as much as US$710/MWh ($420/MWh in Ontario), and wind could receive up to US$105/MWh ($110/MWh in Ontario). The catch: any company that wants to participate in Michigan’s program must be connected to the grid within two months of its application. Washington has a limited FIT program that offers solar producers US$540/MWh for up to seven years.
Investors prefer feed-in tariffs. Why: Feed-in tariffs create a stable investment environment and provide long-term market certainty. As long as investment returns are reasonable, equity and debt investors have been eager to provide funds for renewable energy projects.
FITs are powerful, and they work: Twenty-five years ago, the United States had an 80% market share of the solar panel market. This has now been reduced to less than 25%, as Denmark, Germany, and Spain have taken over market share through the use of feed-in tariffs. Similarly, while the United States holds one of the strongest markets for wind turbine demand growth, the majority of mature turbine manufacturers are located in Europe, where feed-in tariffs are commonplace.

The Choice of a New Generation August 2008
43
Exhibit 1.39: Forward Connecticut Class I REC Price History
$0
$5
$10
$15
$20
$25
$30
$35
$40
$45
$50
$55
Sep-07 Oct-07 Nov-07 Dec-07 Jan-08 Feb-08 Mar-08 Apr-08 May-08 Jun-08 Jul-08
Con
nect
icut
Cla
ss I
REC
Pric
es (U
S$/R
EC o
r US$
/MW
h)
2008
2009
2010
Artificial price cap
Short-to M id-Term Forecast
In our opinion, the prim ary reason for the se lloff is due to an em ergency m otion for interim re lie f filed at FERC on July 11, to im m ediate ly
increase transfer capability at the New England - New Brunsw ick interface.
Posted Connecticut Class I REC prices have sold off recently, although w e note that the m ajority of transactions are private bilateral
agreem ents . Data provided is for publicly available transactions only.
Source: Bloomberg; Scotia Capital.
We Are Bullish on Renewable Energy Certificates
Renewable energy certificates (RECs) can represent a meaningful portion of a project’s economic return. Boralex’s wood-residue facilities in Maine are an excellent example of this, where the facilities there barely break even without the inclusion of renewable energy certificate (REC) sales. Depending on the price of the REC, earnings can be substantial, and in Boralex’s case, REC earnings make up about 40% of its annual EBITDA.
RECs are tradable environmental commodities that represent proof that 1 MWh of power was produced from a qualified renewable energy source. Owners of RECs can claim to have purchased renewable energy, which is essential for utilities and power marketers trying to meet state/provincial renewable portfolio standards. If a company does not hold RECs equivalent to the minimum RPS, it can be fined, typically between $50/MWh and $60/MWh. Thus, an artificial price cap is set on RECs, as companies will not pay more than the penalty.
Prices for RECs in the United States are typically in the US$5/MWh to US$10/MWh range. However, in some states, such as Connecticut, which have high renewable portfolio standards coupled with power retailers that are falling short of their renewable mandates, REC prices soared to around US$50/MWh (they have since eased to the US$30/MWh area – see Exhibit 1.39). Typically, REC prices play a smaller role in the economics of renewable power projects, as federal incentives are more heavily relied upon and are government guaranteed.
Emera’s Nova Scotia Power is working with National Grid to develop a new high-voltage transmission line from northern Maine and Canada’s Maritime provinces to the New England market, or NEPOOL. The Northeast Energy Link would provide NEPOOL with substantial renewable energy. In particular, this could severely impact the Connecticut REC market that companies such as Boralex currently enjoy. CT Class I REC prices could drop to US$5/MWh or lower from their recent range of US$45/MWh to US$50/MWh. Wind Power Monthly stated that the “U.S. Northeast is facing a supply gap of up to 10,000 MW in the next decade.”
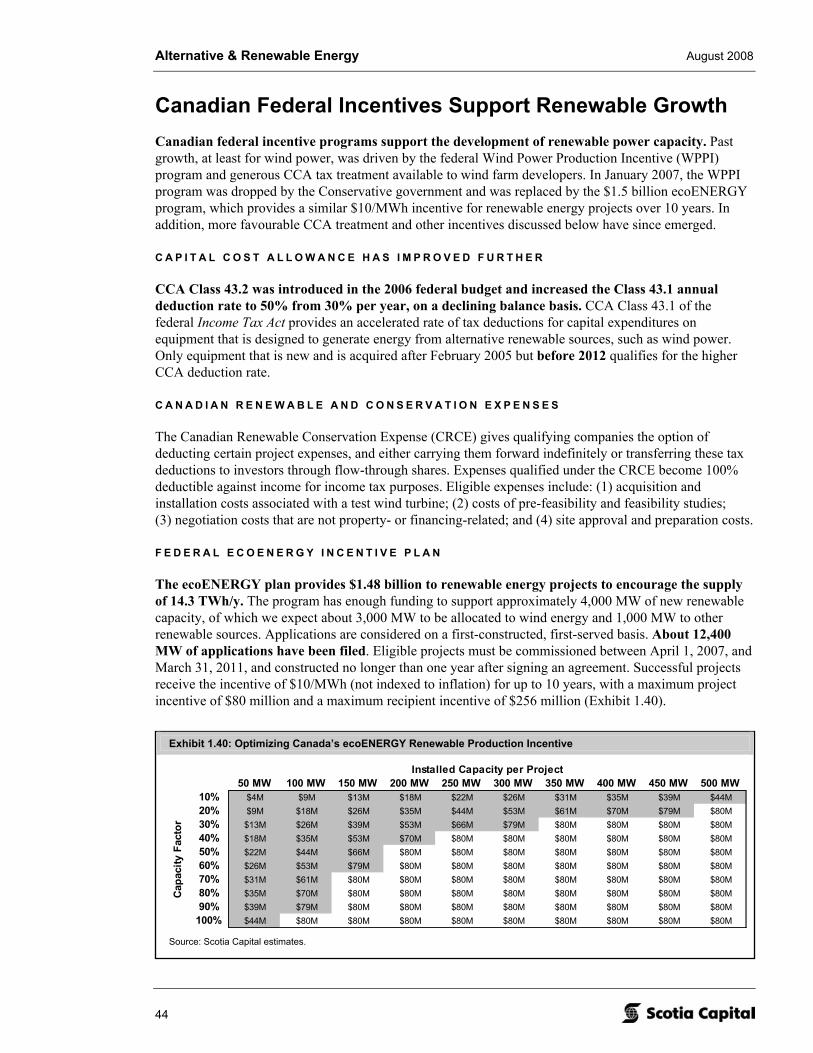
Alternative & Renewable Energy August 2008
44
Exhibit 1.40: Optimizing Canada’s ecoENERGY Renewable Production Incentive
$80.00 50 MW 100 MW 150 MW 200 MW 250 MW 300 MW 350 MW 400 MW 450 MW 500 MW10% $4M $9M $13M $18M $22M $26M $31M $35M $39M $44M20% $9M $18M $26M $35M $44M $53M $61M $70M $79M $80M30% $13M $26M $39M $53M $66M $79M $80M $80M $80M $80M40% $18M $35M $53M $70M $80M $80M $80M $80M $80M $80M50% $22M $44M $66M $80M $80M $80M $80M $80M $80M $80M60% $26M $53M $79M $80M $80M $80M $80M $80M $80M $80M70% $31M $61M $80M $80M $80M $80M $80M $80M $80M $80M80% $35M $70M $80M $80M $80M $80M $80M $80M $80M $80M90% $39M $79M $80M $80M $80M $80M $80M $80M $80M $80M
100% $44M $80M $80M $80M $80M $80M $80M $80M $80M $80M
Capa
city
Fac
tor
Installed Capacity per Project
Source: Scotia Capital estimates.
Canadian Federal Incentives Support Renewable Growth Canadian federal incentive programs support the development of renewable power capacity. Past growth, at least for wind power, was driven by the federal Wind Power Production Incentive (WPPI) program and generous CCA tax treatment available to wind farm developers. In January 2007, the WPPI program was dropped by the Conservative government and was replaced by the $1.5 billion ecoENERGY program, which provides a similar $10/MWh incentive for renewable energy projects over 10 years. In addition, more favourable CCA treatment and other incentives discussed below have since emerged.
C A P I T A L C O S T A L L O W A N C E H A S I M P R O V E D F U R T H E R
CCA Class 43.2 was introduced in the 2006 federal budget and increased the Class 43.1 annual deduction rate to 50% from 30% per year, on a declining balance basis. CCA Class 43.1 of the federal Income Tax Act provides an accelerated rate of tax deductions for capital expenditures on equipment that is designed to generate energy from alternative renewable sources, such as wind power. Only equipment that is new and is acquired after February 2005 but before 2012 qualifies for the higher CCA deduction rate.
C A N A D I A N R E N E W A B L E A N D C O N S E R V A T I O N E X P E N S E S
The Canadian Renewable Conservation Expense (CRCE) gives qualifying companies the option of deducting certain project expenses, and either carrying them forward indefinitely or transferring these tax deductions to investors through flow-through shares. Expenses qualified under the CRCE become 100% deductible against income for income tax purposes. Eligible expenses include: (1) acquisition and installation costs associated with a test wind turbine; (2) costs of pre-feasibility and feasibility studies; (3) negotiation costs that are not property- or financing-related; and (4) site approval and preparation costs.
F E D E R A L E C O E N E R G Y I N C E N T I V E P L A N
The ecoENERGY plan provides $1.48 billion to renewable energy projects to encourage the supply of 14.3 TWh/y. The program has enough funding to support approximately 4,000 MW of new renewable capacity, of which we expect about 3,000 MW to be allocated to wind energy and 1,000 MW to other renewable sources. Applications are considered on a first-constructed, first-served basis. About 12,400 MW of applications have been filed. Eligible projects must be commissioned between April 1, 2007, and March 31, 2011, and constructed no longer than one year after signing an agreement. Successful projects receive the incentive of $10/MWh (not indexed to inflation) for up to 10 years, with a maximum project incentive of $80 million and a maximum recipient incentive of $256 million (Exhibit 1.40).

The Choice of a New Generation August 2008
45
Provinces Also Encourage Renewable Power Investment B R I T I S H C O L U M B I A
British Columbia has set a powerful renewables initiative that requires 90% of new generation to come from renewable sources. By 2016, B.C. wants to be energy self-sufficient. Additionally, the province wants to reduce emissions 33% from current levels by 2020. Based on B.C.’s progress to date, we view its renewable and emissions targets as achievable. In our opinion, B.C. will remain a renewable power investment hotbed over the next three to five years.
The current 2008 BC Hydro Clean Power Call that seeks 5,000 GWh/y of renewable power could award up to 7,500 GWh/y due to high expected attrition rates. In 2006, B.C. awarded over 1,500 MW (~7,500 GWh/y) of renewable capacity, or 50% more than what was originally requested by BC Hydro. Furthermore, the province is hosting a multi-phase bioenergy Call (1,000+ GWh/y), primarily as an environmentally and economically efficient way to deal with dead forests that stem from the mountain pine beetle infestation.
BC Hydro also offers a Standard Offer Program (BC SOP) for all renewable power facilities smaller than 10 MW. Long-term contract prices range from about $70/MWh to $84/MWh (2008 dollars) depending on several factors, including the region of the province. Prices escalate relative to changes in the Consumer Price Index (CPI).
In late 2007, British Columbia introduced the Greenhouse Gas Reduction Act, providing the framework necessary for the province to participate in the Western Climate Initiative. The act also supports the reduction of vehicle emissions, which may not directly impact the renewable energy industry but provides material support for the development of carbon policies in B.C.
As of July 2008, B.C. residents began paying North America’s first revenue-neutral carbon tax of $10/tonne CO2e that equates to a 2.4¢ retail gasoline tax. The carbon tax will increase by $5/tonne CO2e each year to $30/tonne CO2e (7.2¢ per litre) in 2012. All revenue raised from the tax will be returned to individuals and businesses through reductions of other taxes.
A L B E R T A
Alberta is Canada’s leading province of installed wind power capacity, with over 524 MW operating today. Over 10,000 MW of wind power proposals remain in AESO’s queue, of which over 3,500 MW is proposed wind capacity (Exhibit 1.42). Please refer to Exhibit 1.41 for a detailed list of all proposed Alberta power projects. Coal and natural-gas-fired plants currently make up over 90% of the province’s power capacity, creating a significant opportunity for further renewable power investment.
Southwestern Alberta is considered to be one of the best regions in North America for wind resource quality.
Alberta’s soaring demand for electricity, coupled with the Alberta Energy Minister’s action to lift a 900 MW cap on wind power, has led to a massive queue for potential new wind capacity. Alberta is expected to require an additional 5,000 MW by 2017 and 11,500 MW of capacity by 2027. With peak load forecast to expand by over 3.5% per year (i.e., the highest rate in North America), we see Alberta as another province for strong future renewable power investment activity over the long term.
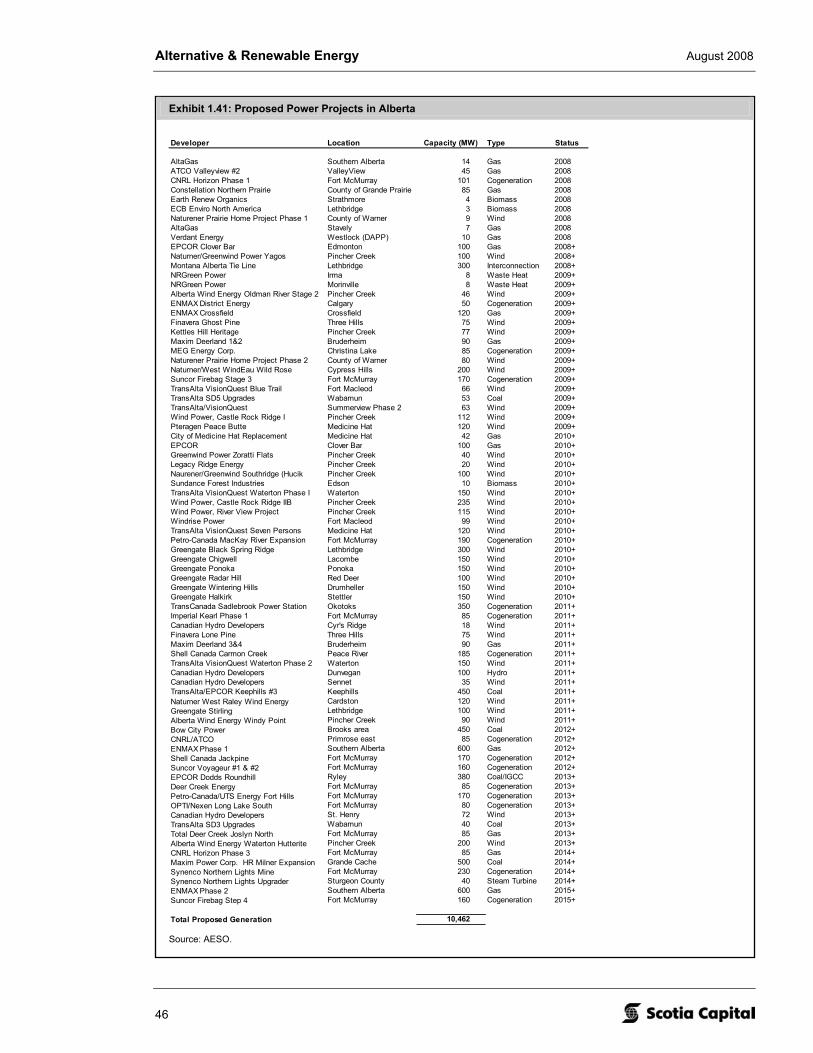
Alternative & Renewable Energy August 2008
46
Exhibit 1.41: Proposed Power Projects in Alberta
Capacity (MW)
AltaGas Southern Alberta 14 Gas 2008ATCO Valleyview #2 ValleyView 45 Gas 2008CNRL Horizon Phase 1 Fort McMurray 101 Cogeneration 2008Constellation Northern Prairie County of Grande Prairie 85 Gas 2008Earth Renew Organics Strathmore 4 Biomass 2008ECB Enviro North America Lethbridge 3 Biomass 2008Naturener Prairie Home Project Phase 1 County of Warner 9 Wind 2008AltaGas Stavely 7 Gas 2008Verdant Energy Westlock (DAPP) 10 Gas 2008EPCOR Clover Bar Edmonton 100 Gas 2008+Naturner/Greenwind Power Yagos Pincher Creek 100 Wind 2008+Montana Alberta Tie Line Lethbridge 300 Interconnection 2008+NRGreen Power Irma 8 Waste Heat 2009+NRGreen Power Morinville 8 Waste Heat 2009+Alberta Wind Energy Oldman River Stage 2 Pincher Creek 46 Wind 2009+ENMAX District Energy Calgary 50 Cogeneration 2009+ENMAX Crossfield Crossfield 120 Gas 2009+Finavera Ghost Pine Three Hills 75 Wind 2009+Kettles Hill Heritage Pincher Creek 77 Wind 2009+Maxim Deerland 1&2 Bruderheim 90 Gas 2009+MEG Energy Corp. Christina Lake 85 Cogeneration 2009+Naturener Prairie Home Project Phase 2 County of Warner 80 Wind 2009+Naturner/West WindEau Wild Rose Cypress Hills 200 Wind 2009+Suncor Firebag Stage 3 Fort McMurray 170 Cogeneration 2009+TransAlta VisionQuest Blue Trail Fort Macleod 66 Wind 2009+TransAlta SD5 Upgrades Wabamun 53 Coal 2009+TransAlta/VisionQuest Summerview Phase 2 63 Wind 2009+Wind Power, Castle Rock Ridge I Pincher Creek 112 Wind 2009+Pteragen Peace Butte Medicine Hat 120 Wind 2009+City of Medicine Hat Replacement Medicine Hat 42 Gas 2010+EPCOR Clover Bar 100 Gas 2010+Greenwind Power Zoratti Flats Pincher Creek 40 Wind 2010+Legacy Ridge Energy Pincher Creek 20 Wind 2010+Naurener/Greenwind Southridge (Hucik Pincher Creek 100 Wind 2010+Sundance Forest Industries Edson 10 Biomass 2010+TransAlta VisionQuest Waterton Phase I Waterton 150 Wind 2010+Wind Power, Castle Rock Ridge IIB Pincher Creek 235 Wind 2010+Wind Power, River View Project Pincher Creek 115 Wind 2010+Windrise Power Fort Macleod 99 Wind 2010+TransAlta VisionQuest Seven Persons Medicine Hat 120 Wind 2010+Petro-Canada MacKay River Expansion Fort McMurray 190 Cogeneration 2010+Greengate Black Spring Ridge Lethbridge 300 Wind 2010+Greengate Chigwell Lacombe 150 Wind 2010+Greengate Ponoka Ponoka 150 Wind 2010+Greengate Radar Hill Red Deer 100 Wind 2010+Greengate Wintering Hills Drumheller 150 Wind 2010+Greengate Halkirk Stettler 150 Wind 2010+TransCanada Sadlebrook Power Station Okotoks 350 Cogeneration 2011+Imperial Kearl Phase 1 Fort McMurray 85 Cogeneration 2011+Canadian Hydro Developers Cyr's Ridge 18 Wind 2011+Finavera Lone Pine Three Hills 75 Wind 2011+Maxim Deerland 3&4 Bruderheim 90 Gas 2011+Shell Canada Carmon Creek Peace River 185 Cogeneration 2011+TransAlta VisionQuest Waterton Phase 2 Waterton 150 Wind 2011+Canadian Hydro Developers Dunvegan 100 Hydro 2011+Canadian Hydro Developers Sennet 35 Wind 2011+TransAlta/EPCOR Keephills #3 Keephills 450 Coal 2011+Naturner West Raley Wind Energy Cardston 120 Wind 2011+Greengate Stirling Lethbridge 100 Wind 2011+Alberta Wind Energy Windy Point Pincher Creek 90 Wind 2011+Bow City Power Brooks area 450 Coal 2012+CNRL/ATCO Primrose east 85 Cogeneration 2012+ENMAX Phase 1 Southern Alberta 600 Gas 2012+Shell Canada Jackpine Fort McMurray 170 Cogeneration 2012+Suncor Voyageur #1 & #2 Fort McMurray 160 Cogeneration 2012+EPCOR Dodds Roundhill Ryley 380 Coal/IGCC 2013+Deer Creek Energy Fort McMurray 85 Cogeneration 2013+Petro-Canada/UTS Energy Fort Hills Fort McMurray 170 Cogeneration 2013+OPTI/Nexen Long Lake South Fort McMurray 80 Cogeneration 2013+Canadian Hydro Developers St. Henry 72 Wind 2013+TransAlta SD3 Upgrades Wabamun 40 Coal 2013+Total Deer Creek Joslyn North Fort McMurray 85 Gas 2013+Alberta Wind Energy Waterton Hutterite Pincher Creek 200 Wind 2013+CNRL Horizon Phase 3 Fort McMurray 85 Gas 2014+Maxim Power Corp. HR Milner Expansion Grande Cache 500 Coal 2014+Synenco Northern Lights Mine Fort McMurray 230 Cogeneration 2014+Synenco Northern Lights Upgrader Sturgeon County 40 Steam Turbine 2014+ENMAX Phase 2 Southern Alberta 600 Gas 2015+Suncor Firebag Step 4 Fort McMurray 160 Cogeneration 2015+
Total Proposed Generation 10,462
Developer Location Type Status
Source: AESO.

The Choice of a New Generation August 2008
47
Exhibit 1.42: Proposed Alberta Power Capacity
Wind35%
Coal14%
Gas20%
Bio-Energy and Other30%
Hydro1%
Source: Alberta Energy.
One big challenge remains for renewable power development in Alberta: the grid has not been updated in over two decades. Unless the system is expanded soon, the risk of blackouts occurring will rise, especially as the province has only 7% of excess capacity available for peak demand. In late 2007, AltaLink saw its proposal for a Calgary-Edmonton link fall through. Bringing new transmission into operation can require as much as eight years to build, potentially limiting massive wind power investment in Alberta, at least in the short term.
Alberta is Canada’s leading greenhouse gas emitter and is the only province not a member of the Climate Registry. The province has put forward several plans to reduce its carbon footprint. In July 2008, the province announced that it will direct $4
billion towards the reduction of GHG emissions, including the further development of carbon capture and storage technology, as well as energy-saving public transit. In 2007, Alberta introduced a provincial bill that charges large GHG emitters (i.e., >100,000 tonnes CO2e/y) a $15/tonne CO2e fine for all emissions above a 12% reduction target over a three-year period. Alberta’s goal is to cut emissions 50% from current levels by 2050 primarily using carbon capture and storage technology.
S A S K A T C H E W A N
Saskatchewan’s Green Power Portfolio intends to meet all electricity demand requirements with renewable sources until 2010 and for 30% of all electricity to be generated by renewable power by 2020. The province’s initiatives target 20 MW of biomass capacity by 2010, an additional 100 MW of wind by 2012, and 500 MW of wind by 2015.
Saskatchewan plans to issue a renewable baseload Request for Proposals (RFP) for between 200 MW and 400 MW in the near term. Similar to southern Alberta, Saskatchewan is home to some of the best wind resource sites in the country.
Saskatchewan has the most aggressive GHG reduction target in Canada, aiming for emissions to be reduced 32% from 2004 levels by 2020. Saskatchewan is also an observing member of the Western Climate Initiative.
M A N I T O B A
Manitoba does not have a renewable portfolio standard given its abundance of hydro power that provides over 98% of its power, but the province has set a goal of having 1,000 MW of wind capacity by 2014. After evaluating 10 short-listed proposals for 300 MW of wind power, it has selected a project near St. Joseph for further discussions with the developer. Manitoba Hydro has plans to hold further RFPs of 200 MW each in 2013-2014, 2015-2016, and 2017-2018. With the province currently having only 99 MW of wind facility and 300+ MW under various stages of development, we see further opportunity of up to 600 MW of wind investment.
The province seeks to reduce its GHG emissions level to 6% below 1990 levels by 2012 (i.e., Kyoto target). It is also an active participant in both the Western Climate Initiative and the Midwestern Regional GHG Reduction Accord.

Alternative & Renewable Energy August 2008
48
Exhibit 1.43: Ontario’s 1,300 MW SOP Contracts
Wind55%
Solar35%
Hydro5%
Bio-Energy5%
Source: Ontario Power Authority; Scotia Capital.
O N T A R I O
In 2004, the Ontario government set a renewable portfolio target of 10% by 2010, requiring the equivalent of about 2,700 MW of installed capacity. In the long term, the province is aiming for 15,700 MW of renewable supply by 2025. Currently, Ontario has less than 1,000 MW of installed renewable capacity, with the majority coming from wind and wood-waste at 518 MW and 224 MW, respectively.
The Ontario Power Authority (OPA) has set an October 30 deadline for bids to be submitted under its Renewable Energy Standard (RES) III that seeks 500 MW of capacity. RES III is the first phase of the province’s goal to build 2,000 MW of new renewable power capacity with plant sizes between 10 MW and 200 MW.
Ontario’s Renewable Standard Offer Program (RESOP) provides small developers the opportunity to build wind, solar, biomass, and hydro projects less than 10 MW in size. RESOP has been too successful, handing out over 1,300 MW of contracted projects in its first year (Exhibit 1.43). When RESOP was launched in 2006, it was expected to develop 1,000 MW over 10 years. Contract prices for RESOP projects are $110/MWh
($420/MWh for solar) and are mostly 20 years in length. Given the success of the program and an application backlog, focus for the program has now shifted to development rather than awarding more contracts. To encourage broader participation in the program, a proponent will be limited to 50 MW per energy source of development capacity at any one time, and proponents will be restricted to a single 10 MW project per transformer station.
In January 2008, Ontario lifted its moratorium on offshore wind development, potentially opening the door to as much as 34,500 MW of offshore wind capacity. The potential for offshore wind power in Ontario is positive, but the OPA has yet to include it in its current plans.
In addition to Ontario’s plan for a cap-and-trade program with Quebec (no details released yet), the province now holds member status with the Western Climate Initiative (announced July 17). Ontario is also an observer in the Regional Greenhouse Gas Initiative.
Q U E B E C
Quebec is one of Canada’s most aggressive provinces in pursuing renewable power, with a stated goal of having 4,000 MW of electricity derived from wind power by 2015. Hydro-Quebec, the province’s utility and holder of North America’s largest hydro portfolio, currently has 422 MW of installed and operating wind power capacity.
In mid-2008, Hydro-Quebec accepted 15 bids (2,004 MW) from its 2005 wind-only RFP. The average wind energy price awarded was $87/MWh. Exhibit 1.44 outlines the successful bidders and the details of each bid.
We expect two 250 MW wind RFPs to be formally issued by Hydro-Quebec in Q4/08. Additionally, the province’s rule-of-thumb ratio used for further wind power development is 100 MW for each 1,000 MW of new hydro installed.

The Choice of a New Generation August 2008
49
Exhibit 1.44: Winning Bids in Hydro-Quebec’s 2,000 MW Wind RFP
Expected Turbine NamplateWinning Bidder Project Region Online Manufacturer Capacity
(MW)Montérégie
Kruger Énergie Inc St-Rémi Les Jardins-de-Napierville, Roussillon 2012 Enercon 100Venterre (KHD) St-Valentin Le Haut-Richelieu 2012 Enercon 50
Centre-du-QuébecEnerfin Sociedad De l'Érable L'Érable 2011 Enercon 100
Chaudières-Appalaches3Ci Inc. Des Moulins L'Amiante 2011 Enercon 156St-Laurent Énergies Massif du Sud Les-Etchemins, Bellechasse 2012 REpower 150
Capitale nationaleBoralex / Gaz Métro Seigneurie de Beaupré #2 Côte-de-Beaupré 2013 Enercon 133Boralex / Gaz Métro Seigneurie de Beaupré #3 Côte-de-Beaupré 2013 Enercon 139St-Laurent Énergies Clermont Charlevoix-Est 2015 REpower 74
Saguenay-Lac-St-JeanSt-Laurent Énergies Rivière du Moulin Fjord-du-Saguenay Charlevoix 2014/2015 REpower 350
Bas Saint-LaurentKruger Énergie Inc Ste-Luce La Mitis 2012 Enercon 68St-Laurent Énergies Lac Alfred La Matapédia La Mitis 2012/2013 REpower 300B&B VDK Vents du Kempt La Matapédia 2014 Enercon 100
Gaspésie-îles-de-la-MadeleineInvenergy Wind Le Plateau Avignon 2011 Enercon 138Venterre (KHD) New Richmond Bonaventure 2012 Enercon 66
MinganieSt-Laurent Énergies Aguanish Minganie 2011 REpower 80
2,004
Source: Hydro-Quebec.
Quebec also supports biomass, but on a much smaller scale, having recently announced (but not formally issued) a 100 MW biomass cogeneration RFP that seeks delivery of awarded projects no later than December 2011. In 2004, a proposal for a cogeneration RFP priced at $100/MWh was rejected. We understand that this RFP will likely be priced between $85/MWh and $100/MWh.
Quebec has been proactive in attempting to reduce its carbon footprint by (1) signing a deal with Ontario for the two provinces to establish a cap-and-trade system by early 2010. Unlike national plans, the partnership seeks real (i.e., absolute) reductions rather than intensity-based reductions; (2) becoming a full member of the Western Climate Initiative; and (3) implementing a tax of 0.8¢ on every litre of gas and 0.9¢ on every litre of diesel sold in the province. Revenue from the tax, estimated to be about $200 million per year, will be used to pay for energy-saving initiatives such as improvements to public transit.
N E W B R U N S W I C K
New Brunswick targets a renewable power portfolio of 10% by 2010 and for NB Power, the provincial utility, to purchase at least 400 MW of wind power by then. The province has yet to install any material wind power capacity, although over 300 MW is under construction, leaving about 100 MW of potential wind investments available by 2010.
NB Power’s 2007 wind RFP sought 300 MW of projects, and was oversubscribed by more than 350%. Six wind capacity projects totalling 308 MW were selected.
New Brunswick has identified up to 90 MW of high-quality tidal power capacity potential.
Alternative & Renewable Energy August 2008
50
New Brunswick holds observer status with the Regional Greenhouse Gas Initiative. Also, the province is a member of the New England Governors and Eastern Premiers that targets a reduction of GHG emissions to 1990 levels by 2010 and a further reduction of emissions to 10% below 1990 levels by 2020.
N O V A S C O T I A
Nova Scotia targets 20% of its electricity to be generated from renewable sources by 2013. This equates to almost 600 MW of new capacity, with the majority of its renewable portfolio to likely come from wind power. Nova Scotia’s coastal location offers excellent tidal (i.e., Bay of Fundy) and wind power (both onshore and offshore) resources.
In 2007, Nova Scotia issued a 130 MW renewable RFP and awarded 240 MW of capacity, of which the majority was wind power. Currently, the province does not have any further RFPs scheduled that we are aware of; however, we believe this will likely change given the province is one of Canada’s most intensive users of coal. Coal power makes up roughly 80% of the province’s power portfolio.
Nova Scotia operates one of the world’s three commercial tidal facilities and offers the best location on the planet for potential tidal power at up to 2,700 MW.
P R I N C E E D W A R D I S L A N D
Prince Edward Island has already met its initial goal of having 15% of all energy consumed to come from in-province renewable sources by 2010, but has since increased its target to 30%. The province is also exploring the possibility of having 100% of its required 1,170 GWh/y of power consumption supplied by renewable power sources.
N E W F O U N D L A N D A N D L A B R A D O R
Newfoundland currently has one small operating wind farm at 1 MW, and in our view, is one of the least attractive Canadian provinces for renewable investments. Despite Newfoundland having strong renewable power resources, the province seems to be solely focused on developing the massive 2,800 MW Lower Churchill Falls project. Over 5,000 MW of potential renewable capacity exists in Newfoundland, but we don’t see rapid development of this occurring anytime soon.
Newfoundland held small wind power RFPs in both 2005 and 2006 that yielded about 25 MW per year of PPAs. The huge potential for wind power in Newfoundland is also limited by the current transmission system there, which could likely not handle more than 80 MW of wind power capacity.
We believe that Newfoundland will continue to see limited renewable investment given (1) no stated renewable portfolio target; (2) focus continues to be on the Lower Churchill Falls project; and (3) the transmission system is constrained for significant incremental wind power capacity.

The Choice of a New Generation August 2008
51
Exhibit 1.45: Regional Climate Change Initiatives Are Growing Rapidly in the United States
Source: Pew Center on Global Climate Change.
North American Initiatives Highlight Growing Acceptance of Climate Change Action The development of regional climate change initiatives in North America has come about as provinces and states continue to set their own emission reduction targets. In North America, there are three major climate initiatives that are expected to begin operating within the next several years: the Western Climate Initiative (WCI), the Midwestern Regional GHG Reduction Accord (Midwestern Accord), and the Regional Greenhouse Gas Initiative (RGGI). Each of these is expected to implement a market-based cap-and-trade program aimed at reducing GHGs.
The U.S. states participating in the initiatives make up nearly 30% of U.S. CO2 emissions and represent over half the of the country’s population. Several of the major states and provinces not participating are leading emitters – Alberta, Texas, Ohio, and Florida.
To date, there has not been any formal announcement with respect to potential trading between the initiatives; however, as the market develops, we expect to see all three initiatives linked in a North-American-wide system.
W E S T E R N C L I M A T E I N I T I A T I V E
The Western Climate Initiative targets emissions reduction of 15% below 2005 levels by 2020. The WCI is the broadest and most comprehensive of the North American initiatives, targeting all sectors and including all six GHGs, not just CO2. British Columbia, Manitoba, Ontario, and Quebec are participating members, while Saskatchewan remains an observer.

Alternative & Renewable Energy August 2008
52
Several of North America’s major emitters, including Alberta and Texas, are not members of the WCI. Prior to becoming a member of WCI, candidate states/provinces must have:
• Adopted an economy-wide GHG reduction goal that reflects similar goals of the WCI;
• Developed a multi-sector climate action plan to achieve its goal;
• Committed to adopt GHG tailpipe standards for passenger vehicles; and
• Become a member of the Climate Registry.
The WCI’s regional program covers less than 50% of the region’s emissions as the transportation sector is not included. This has been one of the major criticisms of the WCI; however, the group plans to incorporate the transportation sector once further studies have been completed. The European Union’s Emission Trading Scheme (EU ETS), which is universally accepted to be the most advanced emissions trading scheme in the world, also does not include the transportation sector in its plan.
To date, the WCI has recommended that each member auction between 25% and 75% of the allowances, with each region receiving the proceeds of the auction. We expect the WCI to release its full cap-and-trade design guidelines in September (a draft version was released in late July).
R E G I O N A L G R E E N H O U S E G A S I N I T I A T I V E
The Regional Greenhouse Gas Initiative (RGGI) is scheduled to hold its first CO2 emissions allowance auction in September 2008 and is targeting to reduce emissions 10% below 2003/2004 levels by 2018. The auction will consist of 188 million tonnes CO2 (4% above the 2000 to 2004 average level) and beginning in 2014 will decline by 2.5% per year to 169 million tonnes CO2. A reserve price of US$1.86 has been set for the first auction. Unlike the WCI and Midwestern Accord, the initiative is initially targeted at reducing only CO2 emissions, specifically from electricity power plants.
The RGGI is primarily targeting facilities greater than 25 MW. Allowances are not sold or allocated to renewable facilities. The RGGI should see the creation of a secondary market, as allowances are auctioned to both utilities and participating brokers who can purchase allowances to profit from later selling them.
M I D W E S T E R N R E G I O N A L G R E E N H O U S E G A S R E D U C T I O N A C C O R D
The Midwestern Accord has yet to set any firm emissions reduction targets, but is expected to be similar in scope to the WCI. Targets will be met through the implementation of both renewable portfolio standards and biofuels targets. Manitoba is the only Canadian province to be a member of the Midwestern Accord, and Ontario is an observer for now.
In late 2007, the Midwestern Governors Association held a climate-change-related summit that established a blueprint renewable portfolio objective as follows: 10% by 2015, 20% by 2020, 25% by 2025, and 30% by 2030. To date, less than half of the Midwestern Accord member states have legislated these goals.
The Midwestern Accord will cover all sectors and is expected to set goals for reductions by the end of 2008. We expect the accord to link with both the WCI and the RGGI, and will use the Climate Registry (see next page) as its emissions tracking system.
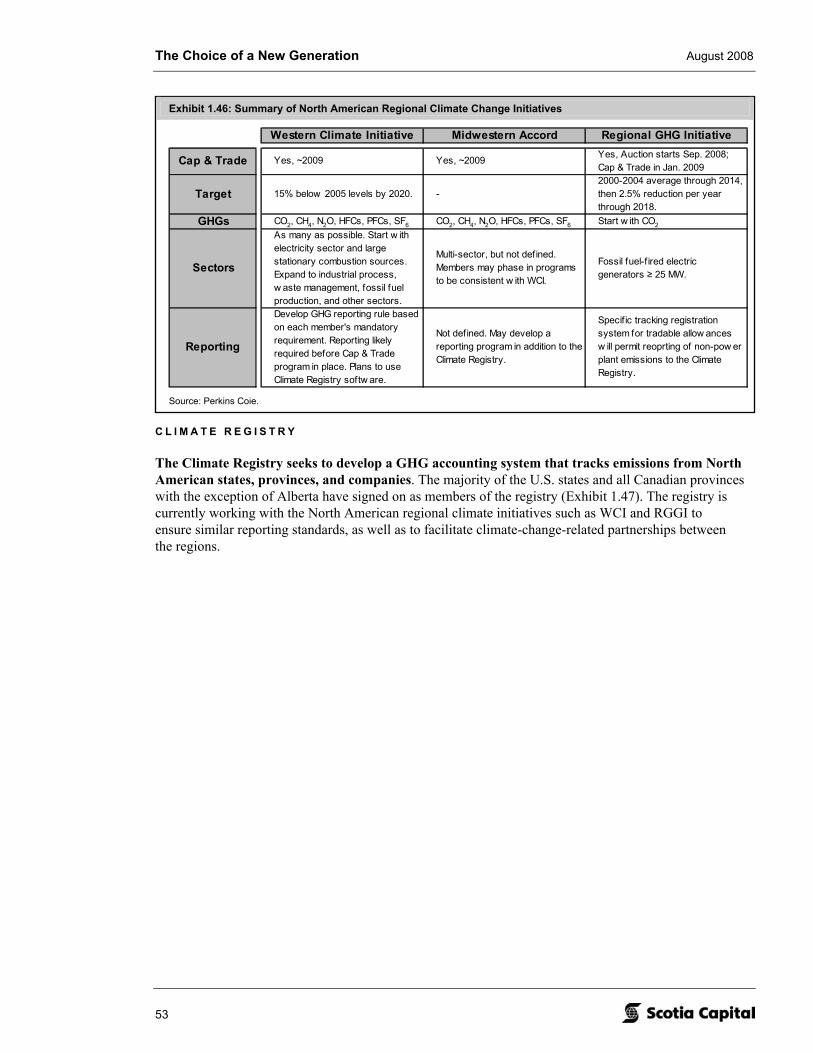
The Choice of a New Generation August 2008
53
Exhibit 1.46: Summary of North American Regional Climate Change Initiatives
Western Climate Initiative Midwestern Accord Regional GHG Initiative
Cap & Trade Yes, ~2009 Yes, ~2009 Yes, Auction starts Sep. 2008; Cap & Trade in Jan. 2009
Target 15% below 2005 levels by 2020. -2000-2004 average through 2014, then 2.5% reduction per year through 2018.
GHGs CO2, CH4, N2O, HFCs, PFCs, SF6 CO2, CH4, N2O, HFCs, PFCs, SF6 Start w ith CO2
Sectors
As many as possible. Start w ith electricity sector and large stationary combustion sources. Expand to industrial process, w aste management, fossil fuel production, and other sectors.
Multi-sector, but not defined. Members may phase in programs to be consistent w ith WCI.
Fossil fuel-f ired electric generators ≥ 25 MW.
Reporting
Develop GHG reporting rule based on each member's mandatory requirement. Reporting likely required before Cap & Trade program in place. Plans to use Climate Registry softw are.
Not defined. May develop a reporting program in addition to the Climate Registry.
Specific tracking registration system for tradable allow ances w ill permit reoprting of non-pow er plant emissions to the Climate Registry.
Source: Perkins Coie.
C L I M A T E R E G I S T R Y
The Climate Registry seeks to develop a GHG accounting system that tracks emissions from North American states, provinces, and companies. The majority of the U.S. states and all Canadian provinces with the exception of Alberta have signed on as members of the registry (Exhibit 1.47). The registry is currently working with the North American regional climate initiatives such as WCI and RGGI to ensure similar reporting standards, as well as to facilitate climate-change-related partnerships between the regions.

Alternative & Renewable Energy August 2008
54
Exhibit 1.47: Alberta Is the Only Canadian Province That Is Not a Member of the Climate Registry
Source: www.theclimateregistry.org

The Choice of a New Generation August 2008
55
Exhibit 1.48: The EU Targets 20% Renewable Energy by 2020
Share Target Share TargetMember State 2006 2010 2005 2020
Austria 64.2% 78.1% 23.3% 34.0%Belgium 2.8% 6.0% 2.2% 13.0%Bulgaria - - 9.4% 16.0%Cyprus - 6.0% 2.9% 13.0%Czech-Republic 4.2% 8.0% 6.1% 13.0%Denmark 26.0% 29.0% 17.0% 30.0%Estonia 1.6% 5.1% 18.0% 25.0%Finland 24.0% 31.5% 28.5% 38.0%France 10.9% 21.0% 10.3% 23.0%Germany 12.0% 12.5% 5.8% 18.0%Greece 13.0% 20.1% 6.9% 18.0%Hungary 4.4% 3.6% 4.3% 13.0%Ireland 10.0% 13.2% 3.1% 16.0%Italy 16.0% 25.0% 5.2% 17.0%Latvia 49.9% 49.3% 34.9% 42.0%Lithuania 3.6% 7.0% 15.0% 23.0%Luxembourg 6.9% 5.7% 0.9% 11.0%Malta - 5.0% - 10.0%The Netherlands 6.5% 9.0% 2.4% 14.0%Poland 2.8% 7.5% 7.2% 15.0%Portugal 35.7% 45.6% 20.5% 31.0%Romania - - 17.8% 24.0%Slovak Republic 16.1% 31.0% 6.7% 14.0%Slovenia 24.4% 33.6% 16.0% 25.0%Spain 19.0% 29.4% 8.7% 20.0%Sweden 51.7% 60.0% 39.8% 49.0%United Kingdom 4.1% 10.0% 1.3% 15.0%
EU 14.0% 21.0% 8.5% 20.0%
EnergyElectricity
Source: International Energy Agency.
Europe Leads the World in Renewable Energy Targets Binding and non-binding targets for renewable energy have exploded in recent years as countries accept the reality of global warming and the need to reduce carbon emissions. Europe continues to lead the way in driving supportive renewable energy policy. Support in the United States is growing rapidly as well, with 33 U.S. states having renewable portfolio standards (RPSs). Furthermore, with both U.S. presidential candidates seeking a federal cap-and-trade system, we believe that a nationwide RPS may one day be in the cards.
E U R O P E A N U N I O N R E N E W A B L E T A R G E T S A R E A G G R E S S I V E A N D A R E B E I N G M E T
In 2001, the European Union set an initial target for its member states to have 21% of electricity come from renewable fuel sources. Since then, material progress has been made to achieve this target, as wind and solar capacity growth has exploded in several member countries. By the end of 2006, the EU had achieved two-thirds of its stated target, or 14%. However, the target has now changed to 20% by 2020 and includes total energy use rather than just electricity (Exhibit 1.48).
In Europe, high feed-in tariff rates are the key incentive that governments offer to renewable power producers to install new capacity. Germany and Spain, Europe’s leaders for renewable power, each have high tariffs for both wind and solar power. While it recently reduced its solar PV tariff (much less than expected) to motivate manufacturers to reduce costs quickly, Germany did raise its feed-in tariffs for both onshore and offshore wind to €92/MWh and €130/MWh, respectively. Spain also reduced its solar PV tariff, which was expected, but surprised all market observers by capping new solar build to 300 MW next year. Many had expected a cap closer to 3,000 MW.
S E V E N T E E N U . S . S T A T E S S T I L L D O N O T H A V E R P S G O A L S
Unlike the European Union, the United States does not have a nationwide RPS target, but has implemented multiple initiatives to help states achieve their goals. These financial incentives are outlined in Exhibit 1.49 and include the U.S. Production Tax Credit, which is currently set to expire at the end of 2008.

Alternative & Renewable Energy August 2008
56
Exhibit 1.49: U.S. Federal Renewable Energy Incentive Programs
Production Tax Credit (PTC)
Wind, Geothermal, Closed-Loop Biomass, Solar: US$20/MWh for first 10 years of operation. Small Hydro, Cogen, Waste-to-Energy, Open-Loop Biomass: US$10/MWh for first 10 years of operation. Indexed to inflation and expires 12/31/2008.
Renewable Energy Production Incentive (REPI)
US$1.5/MWh in 1993 current US$ for first 10 years of operation. Subject to annual appropriations such that it may not be fully funded from year to year. Indexed to inflation and expires in 2026.
Corporate Investment tax Credit (ITC) Credit against income tax as percent of investment. Reduces from 30% to 10% after 12/31/2008.
Personal Investment Tax Credit (ITC) 30% up to a maximum of US$2,000 for solar electric and water heating. US$500 per 0.5kW for fuel cells. Expires 12/31/2008.
Modified Accelerated Cost Recovery System (MACRS) Eligible technologies are allowed 5 year versus 15 year depreciation.
Clean Renewable Energy Bonds (CREBs)Bond instrument where holders earn returns through tax credits. US$1.2 billion authorized through January 2009. Targeted at not-for-profit utilities.
Source: Database of State Incentives for Renewable Energy
Exhibit 1.50: U.S. State RPS Targets
State Target
Arizona 15% of electricity by 2025California 20% of electricity by 2010Colorado 20% of electricity by 2020Connecticut 23% of electricity by 2020District of Columbia 11% of electricity by 2022Delaw are 20% of electricity by 2019Haw aii 20% of electricity by 2020Iow a 105 MWIllinois 25% of electricity by 2025Massachusetts 4% of electricity by 2009Maryland 20% of electricity by 2022Maine 10% of new electricity by 2017Minnesota 25% of electricity by 2025Missouri 11% of electricity by 2020Montana 15% of electricity by 2015New Hampshire 23.8% of electricity by 2025New Jersey 22.5% of electricity by 2021New Mexico 20% of electricity by 2020Nevada 20% of electricity by 2015New York 24% of electricity by 2013North Carolina 12.5% of electricity by 2021North Dakota 10% of electricity by 2015Ohio 25% of electricity by 2025Oregon 25% of electricity by 2025Pennsylvania 18% of electricity by 2020Rhode Island 16% of electricity by 2020South Dakota 10% of electricity by 2015Texas 5,880 MW by 2015Utah 20% of electricity by 2025Vermont 20% of electricity by 2017Virginia 12% of electricity by 2022Washington 15% of electricity by 2020Wisconsin 10% of electricity by 2015
Source: Database of State Incentives for Renewable Energy
Thirty-three U.S. states have now implemented RPS (hard) targets or (soft) goals. California (20% by 2010) and Texas (5,880 MW by 2015) have the most aggressive targets in the United States, which vary widely from as low as 4% to as high as 25%.
From an investment perspective, setting a high or a low RPS doesn’t provide much insight into renewable power growth opportunities unless the RPS target is a material change from the state’s current power portfolio mix. For example, if a state sets a target of 20% by 2010, the opportunities are likely limited if that state was already at 19% when the RPS was established. Conversely, a seemingly low RPS target (i.e., 5%) may offer more opportunity if: (1) that state consumes relatively more power than its peers; and (2) the original renewable proportion of its power portfolio was significantly lower than its RPS target.
For these U.S. states to achieve their RPS targets or goals, state-level financial incentives are typically offered to renewable power producers (and marketers) in addition to the federal ones listed in Exhibit 1.50. Exhibit 1.51 breaks down the types of financial incentives offered on a state-by-state basis.

The Choice of a New Generation August 2008
57
Exhibit 1.51: U.S. State-Level Financial Incentives
Personal Corp. Sales Prop. Industry Production Tax Tax Tax Tax Support Incentives
Alabama 1-S 3-U 1-S 1-S 1-U 1-U Alaska 2-S 1-U Arizona 3-S 1-S 1-S 2-S 6-U Arkansas California 1-S 1-S 5-S 34-U 1-L 1-L 2-S 1-U 1-L 1-S 2-U Colorado 1-S 1-L 2-S 7-U 3-L 1-L 1-P 3-U 1-L 1-S Connecticut 1-S 1-S 2-S 4-S 2-S 2-S 1-P Delaware 1-S 2-S Florida 2-S 1-S 1-S 1-S 7-U 2-L 2-S 4-U 1-U Georgia 1-S 1-S 1-S 3-U 3-U 1-U Hawaii 1-S 1-S 2-U 1-S 2-U 1-L 1-S 1-L Idaho 1-S 1-S 1-S 1-U 2-P 1-S 1-S 1-P Illinois 2-S 1-S 3-S 1-P Indiana 1-S 1-S 25-U 1-S Iowa 1-S 1-S 1-S 3-S 6-U 1-S 2-S Kansas 1-S 1-S Kentucky 1-S 2-S 1-S 5-U 2-U 1-P 1-U Louisiana 1-S 1-S 1-S 1-S Maine 1-S 1-S 1-S Maryland 2-S 2-S 2-S 4-S 3-L 3-S 1-L 2-S Massachusetts 2-S 3-S 1-S 1-S 2-S 2-U 3-S 1-S 1-U 2-S 1-P Michigan 1-S 1-U 4-S 2-S Minnesota 2-S 1-S 2-S 9-U 3-U 5-S 1-U 1-S 1-U Mississippi 4-U 1-S 1-U Missouri 1-S 6-U 1-S 1-U Montana 3-S 1-S 3-S 2-U 1-U 2-P 1-S 2-S 1-P Nebraska 1-S 2-U 1-S Nevada 3-S 1-S New Hampshire 1-S 3-U 1-S New Jersey 1-S 4-S 1-U 1-S 1-U 1-S New Mexico 3-S 3-S 2-S 1-S 1-S 1-U New York 2-S 1-S 1-S 2-S 5-S 3-U 1-S 2-S 3-S 1-S North Carolina 1-S 1-S 1-S 1-S 1-S 1-S 1-U 1-P North Dakota 1-S 1-S 2-S Ohio 1-S 1-S 1-S 1-L 6-U 2-S 1-S Oklahoma 1-S 3-S 1-S Oregon 1-S 1-S 1-S 3-S 12-U 1-S 2-P 1-S 7-U 1-S 1-U 1-P Pennsylvania 1-S 3-S 3-L 1-S 1-U 5-L Rhode Island 1-S 1-S 1-S 2-S 1-U 1-S 1-S 1-P South Carolina 1-S 2-S 1-S 1-S 2-U 1-S 1-S 5-U 1-S South Dakota 3-S 1-U 1-U Tennessee 1-S 1-S 1-S 1-U Texas 1-S 1-S 11-U 1-S Utah 1-S 1-S 1-S 5-U Vermont 1-S 1-S 1-S 1-S 1-S 1-U 1-S 2-U Virginia 1-S 1-S 1-U Washington 1-S 11-U 1-L 2-P 9-U 1-S 1-S 3-U 1-P West Virginia 1-S 1-S Wisconsin 1-S 2-S 2-U 1-S 1-U 1-S 4-U Wyoming 1-S 1-S 1-U District of Columbia 1-S Palau Guam Puerto Rico 1-S 1-S 1-S Virgin Islands 1-S 1-S N. Mariana Islands American Samoa Totals 33 36 28 54 229 60 94 22 3 39
Bonds
S = State/Territory L = Local U = Utility P = Private
State Rebates Grants Loans
Source: Database for State Renewable Energy Incentives

Alternative & Renewable Energy August 2008
58
Exhibit 1.52: Select Country Renewable Energy Targets (ex. Canada, EU Members, and the U.S.)
Country Share (2006) Target
Argentina (ex. large hydro) 1.3% 8% of electricity by 2016Australia 7.9% 9,500 GWh of electricity annually by 2010Brazil (ex. large hydro) 5.0% -China - 10% total energy by 2010; 15% by 2020Egypt 15.0% 20% of electricity by 2020India 4.0% -Israel - 5% of electricity by 2016Japan (ex. large hydro) 0.4% 1.63% of electricity by 2014Korea 1.0% 7% of electricity by 2010Malaysia - 5% of electricity by 2025Mexico 16.0% 4 GW of new renewables by 2014Morocco 10.0% 20% of electricity by 2012, including 1 GW of wind powerNew Zealand 65.0% 90% of electricity by 2025Nigeria - 7% by 2025Norway - 7 TWh from heat and wind by 2010Pakistan - 10% of electricity by 2015Philippines - 4.7 GW of new renewables by 2013Singapore - 50,000 m2 of solar thermal systems by 2012South-Africa - 10 TWh of renewables by 2013Switzerland 52.0% 3.5 TWh from electricity and heat by 2010Thailand 7.0% -Turkey - 2% of electricity from wind by 2010Uganda - 100 MW small hydro and 45 GW geothermal by 2017
Source: IEA; REN21; Scotia Capital.
Exhibit 1.53: RPS and Feed-In Tariff Policy Growth
6 912 13 15
18 19
3438 39
44
9 1013 13 15
21
2834
4144 46
1997 1998 1999 2000 2001 2002 2003 2004 2005 2006 2007
Global RPS PoliciesGlobal Feed-In Policies
Source: REN21; Scotia Capital.
T H E R E S T O F T H E W O R L D I S C O M I N G A R O U N D
Outside of Canada, Europe, and the United States, many developed and developing nations have set renewable energy portfolio targets or goals as well (Exhibit 1.52). Most of these countries offer feed-in tariffs, investment tax credits, and tradable renewable energy certificates to achieve their goals. Surprisingly, over the past two years, many developing countries have upgraded their previous RPS targets. Egypt recently revised its RPS to 20% by 2020 from 14%, while Argentina also increased its 2016 RPS target to 8%. Perhaps the most interesting country to watch achieve its RPS is China, which seeks 10% of total energy consumption by 2010 to come from alternative energy. On average, China commissions one new coal-fired power plant per week.

The Choice of a New Generation August 2008
59
Exhibit 1.54: New Global Investment in Alternative & Renewable Energy, 2004-2007
$0
$20,000
$40,000
$60,000
$80,000
$100,000
$120,000
$140,000
$160,000
$180,000
2004 2005 2006 2007
Mill
ions
(US$
)
Small Scale Projects
Asset Finance
Gov/Corp R&D
Public Markets
VC/PE
$33.3B
$58.5B
$92.6B
$148.4B
Source: New Energy Finance; Scotia Capital
Exhibit 1.55: Clean Energy Funds, March 2008
Sector Focus VC/PE Public Project (Equity)
Project (Debt)
(US$M) (US$M) (US$M) (US$M)
Renewable Projects
$1,579 $0 $7,831 $1,448
Environmental & Climate Change
$5,614 $19,034 $901 $847
Clean Energy $6,326 $22,864 $682 $96
$13,519 $41,898 $9,414 $2,391
Source: New Energy Finance; Scotia Capital.
Exhibit 1.56: CDM Projects by Country, July 2008
Country RegisteredPre-
registered Total
India 354 552+ 906+China 241 907+ 1,148+Brazil 142 137+ 279+Mexico 105 76+ 181+Avg. 211 418+ 629+
Avg. for others 4 7 11
Source: New Energy Finance; United Nations; Scotia Capital.
Global Investment Trends Support Our Bullish View The year 2007 was another record for investment into alternative and renewable energy, with US$148.4 billion poured into the sector globally, up 60% from 2006 (Exhibit 1.54). On top of this, total M&A transactions in the space amounted to over US$55 billion. Asset financing was the main driver for investment growth, up 68% year over year to US$84.5 billion in 2007, mostly from wind power activity. According to New Energy Finance, annual investment in the space is expected to hit US$450 billion by 2012 and US$600 billion by 2020.
Assets under management in clean tech, environmental, and renewable power-related funds surged to over US$65 billion by the end of last year (Exhibit 1.55). R&D spending on alternative and renewable energy in 2007 was US$16.9 billion, split US$9.8 billion from corporate R&D and US$7.1 billion from government R&D programs.
Investment dollars are now flowing more towards developing nations than ever before. A large chunk of the money is being invested in Kyoto-related Clean Development Mechanism (CDM) projects in BRIC nations (i.e., Brazil, Russia, India, and China) as well as Mexico (Exhibit 1.56). Accordingly, at the end of this section, we focus our attention on the alternative energy investment trends of BRIC nations.
Annual investment in alternative & renewable energy could hit US$450 billion by 2012.

Alternative & Renewable Energy August 2008
60
Exhibit 1.57: Total Public Markets Transactions by Type, 2001-2007
$0
$5,000
$10,000
$15,000
$20,000
$25,000
$30,000
2001 2002 2003 2004 2005 2006 2007
Mill
ions
(US$
)
Convertible & Other
Secondary
IPO
$0.4B $0.4B $0.7B$0.3B
$5.6B
$27B
$12.6B
Source: New Energy Finance; Scotia Capital
Exhibit 1.58: Public Market Transactions by Exchange
$415
$161
$208
$219
$242
$252
$387
$427
$497
$506
$617
$723
$1,294
$1,464
$1,649
$2,865
$2,925
$3,393
$8,126
$607
$0 $2,000 $4,000 $6,000 $8,000 $10,000
Other
AMEX
Sao Paulo
Luxembourg
Copenhagen
Shenzhen
Phillippines
Euronext Paris
Athens
Hong Kong
Bombay
TSX
Singapore
Oslo
AIM
LSE
NYSE
Frankfurt
NASDAQ
Madrid
Millions (US$)
Source: New Energy Finance; Scotia Capital.
P U B L I C M A R K E T I N V E S T M E N T
Alternative and renewable energy companies raised US$27 billion of equity in 2007, or a 114% improvement from 2006, which itself was a 125% increase from 2005 (Exhibit 1.57). About 60% of the money raised in public markets was for initial public offerings, followed by 20% for secondary offerings and 20% for convertible/other equity financings.
In 2007, Spain’s Iberdrola raised US$7.2 billion from the IPO of its Iberdrola Energias Renovables (Iberenova), the largest renewable-related IPO to date. As a result, the Madrid Stock Exchange earned top spot for total public market investment in 2007, although only two IPOs and one secondary offering occurred there. There were 21 renewable-related IPOs and secondary offerings on Nasdaq for a combined value of US$3.4 billion including convertibles (Exhibit 1.58).
The Alternative Investment Market (AIM) of London continues to attract alternative and renewable energy companies. Thirty-two transactions occurred on AIM last year, likely due to (1) its less stringent reporting requirements than U.S. markets; and (2) its access to the financial centre of Europe.
Solar companies raised over US$9.4 billion last year, and more than double the US$4.6 billion that was raised in 2006. Chinese cell and module manufacturers typically IPO’d in the United States. Also, German and U.S. solar players prepared themselves (via secondary offerings) for consolidation.

The Choice of a New Generation August 2008
61
Exhibit 1.60: M&A Transactions by Sector, 2007
$0
$28
$53
$235
$324
$367
$369
$623
$714
$974
$2,578
$3,916
$4,032
$11,538
$0 $4,000 $8,000 $12,000
Marine
CC&S
Hydrogen
Fuel Cells
Pow er Storage
Geothermal
Carbon Markets
Small Hydro
Services & Support
Biomass & WTE
Biofuels
Solar
Eff iciency
Wind
Millions (US$)
Source: New Energy Finance; Scotia Capital.
Exhibit 1.59: Corporate M&A by Business Model of Target, 2001-2007
$0
$5,000
$10,000
$15,000
$20,000
$25,000
$30,000
2001 2002 2003 2004 2005 2006 2007
Mill
ions
(US$
)
Services & Other
Manufacturing
Pow er Generation
$1.8B $2.2B$4.6B $4.0B
$11.5B
$16.9B
$25.7B
Source: New Energy Finance; Scotia Capital
C O R P O R A T E M & A A C T I V I T Y
Global M&A activity for alternative and renewable energy exploded in 2007 with 237 deals completed for US$25.7 billion, up 52% from 2006 (Exhibit 1.59). Most of the increase occurred in the second half of 2007, when the credit crunch forced the start of market consolidation.
Driving M&A deals were utilities seeking to hedge against oil, coal, and gas price increases, and tougher market conditions that favour the investment-grade credit quality of utilities over IPPs. Also, the rising cost of building new plants partly increased M&A activity, as increases in steel
and nickel prices, as well as labour, made it cheaper to buy existing plants. The United States and Europe accounted for 84% of the value of deals completed in 2007.
Wind power led all M&A transactions in the space, with US$11.5 billion of deals completed last year, dominated by three major deals (Exhibit 1.60): (1) Goldman Sachs’ sale of Horizon Wind Energy to EDP for US$2.7 billion; (2) Germany’s E.ON purchase of the Iberian wind assets of Danish energy company Dong for US$1 billion; and (3) E.ON’s acquisition of Irish wind farm developer Airtricity’s North American operations for US$1.4 billion. In early 2008, the remaining assets of Airtricity were acquired by Scottish & Southern Energy for US$2.2 billion.
A S S E T F I N A N C I N G
US$108 billion of alternative and renewable energy assets were financed in 2007, up 61% year over year from US$67 billion in 2006 (Exhibit 1.61). US$85 billion was spent on new capacity build, while US$18 billion was used for acquisition, and almost US$6 billion for refinancing.
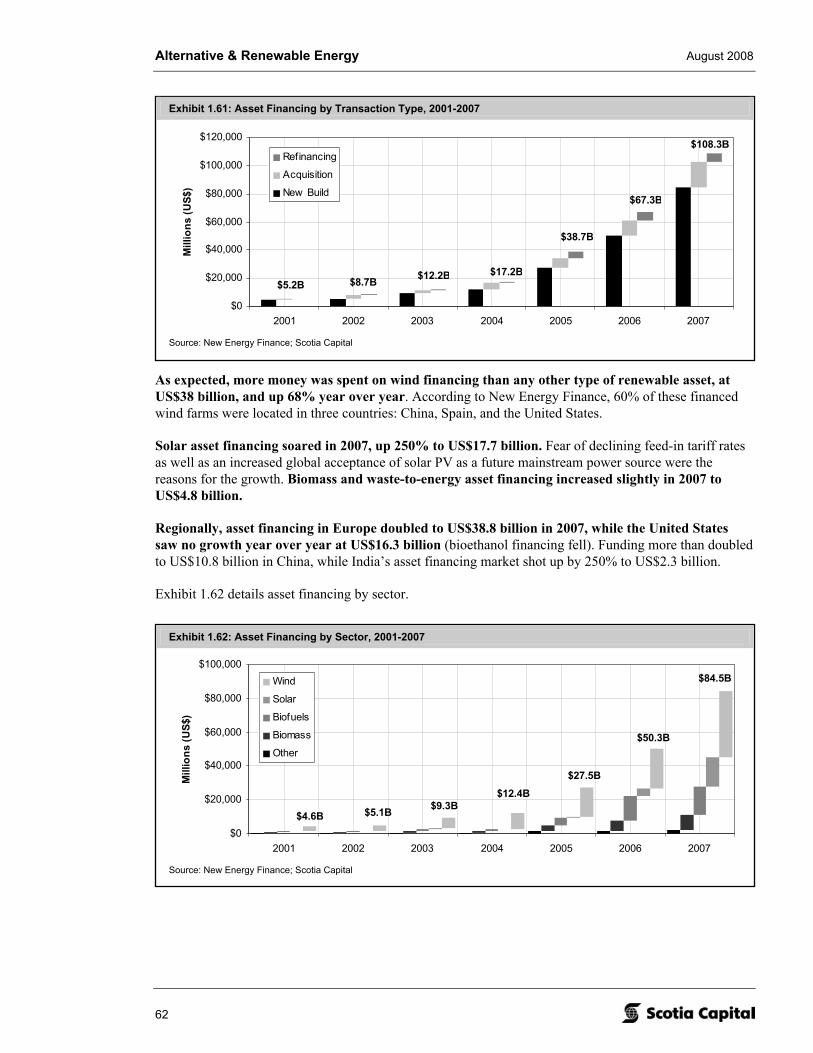
Alternative & Renewable Energy August 2008
62
Exhibit 1.62: Asset Financing by Sector, 2001-2007
$0
$20,000
$40,000
$60,000
$80,000
$100,000
2001 2002 2003 2004 2005 2006 2007
Mill
ions
(US$
)
Wind
Solar
Biofuels
Biomass
Other
$12.4B$27.5B
$50.3B
$84.5B
$5.1B $9.3B$4.6B
Source: New Energy Finance; Scotia Capital
Exhibit 1.61: Asset Financing by Transaction Type, 2001-2007
$0
$20,000
$40,000
$60,000
$80,000
$100,000
$120,000
2001 2002 2003 2004 2005 2006 2007
Mill
ions
(US$
)
Refinancing
Acquisition
New Build
$5.2B $8.7B $12.2B $17.2B
$38.7B
$67.3B
$108.3B
Source: New Energy Finance; Scotia Capital
As expected, more money was spent on wind financing than any other type of renewable asset, at US$38 billion, and up 68% year over year. According to New Energy Finance, 60% of these financed wind farms were located in three countries: China, Spain, and the United States.
Solar asset financing soared in 2007, up 250% to US$17.7 billion. Fear of declining feed-in tariff rates as well as an increased global acceptance of solar PV as a future mainstream power source were the reasons for the growth. Biomass and waste-to-energy asset financing increased slightly in 2007 to US$4.8 billion.
Regionally, asset financing in Europe doubled to US$38.8 billion in 2007, while the United States saw no growth year over year at US$16.3 billion (bioethanol financing fell). Funding more than doubled to US$10.8 billion in China, while India’s asset financing market shot up by 250% to US$2.3 billion.
Exhibit 1.62 details asset financing by sector.

The Choice of a New Generation August 2008
63
Exhibit 1.63: VC/PE Transactions by Type, 2001-2007
$0
$2,000
$4,000
$6,000
$8,000
$10,000
$12,000
$14,000
$16,000
2001 2002 2003 2004 2005 2006 2007
Mill
ions
(US$
)
PIPE/OTCs
PE Buy-outs
PE Expansion Capital
VC Late Stage
VC Early Stage
$2.5B
$6.4B
$9.3B
$13.2B
$0.8B$1.2B
$1.0B
Source: New Energy Finance; Scotia Capital
Exhibit 1.64: VC/PE Transactions by Sector, 2001-2007
$0
$2,000
$4,000
$6,000
$8,000
$10,000
$12,000
$14,000
$16,000
2001 2002 2003 2004 2005 2006 2007
Mill
ions
(US$
)
Solar
Biofuels
Efficiency
Wind
Other
$2.5B
$6.4B
$9.3B
$13.2B
$0.8B$1.2B$1.0B
Source: New Energy Finance; Scotia Capital
V E N T U R E C A P I T A L A N D P R I V A T E E Q U I T Y
US$13.2 billion was invested into the alternative and renewable energy space by venture capital and private equity players in 2007, up 42% from 2006. The number of deals also increased in 2007 to 537 from 439 the previous year. Specifically, private equity investment of US$7.2 billion mainly fell into two areas: (1) buyout deals that totalled US$3.4 billion and (2) expansion funding of US$3.8 billion; see Exhibit 1.63.
Solar companies dominated the venture capital market, attracting US$3.7 billion last year, an 85% year-over-year increase. The majority of the 42 completed solar deals occurred in North America, and were mostly related to investment in thin-film technology.
Biomass and waste-to-energy VC/PE investment grew faster than any other sector, up 430% to US$1.3 billion in 2007. Deals tripled to 37 from 11 in 2006.
Maturing renewable power technologies saw relatively little activity from the venture capital market. Wind investment increased by 20% to US$1.8 billion from US$1.5 billion in 2006, most of which was from the private equity market. Surprisingly, there was little interest in emerging marine-related technology investments such as tidal, wave, and ocean thermal power. Exhibit 1.64 details the market activity by sector.

Alternative & Renewable Energy August 2008
64
Exhibit 1.65: China’s Renewable Status & Targets
2007 Capacity 2020 NDRC Target
Hydro 145,000 MW 300,000 MW (including 75,000 MW small hydro)
Wind 6,000 MW 30,000 MW
Solar PV 100 MW 1,800 MW
Biomass 3,000 MW 30,000 MW
Geothermal 32 MW (power) 12M tons of coal equivalent (power & thermal)
Tidal - 100 MW
Source: New Energy Finance; NDRC; Scotia Capital.
Exhibit 1.66: Alternative & Renewable Energy Transactions in China, 2004-2007
$0
$2,000
$4,000
$6,000
$8,000
$10,000
$12,000
$14,000
$16,000
2004 2005 2006 2007
Mill
ions
(US$
)
Mergers & Acquisitions
Asset Finance
Public Markets
Venture Capital/ Private Equity
$0.3B
$1.9B
$6.6B
$12.9B
Source: New Energy Finance; Scotia Capital.
B R I C M A R K E T S
Renewable Investment in China Set to Soar
Installed capacity of renewable power generation in China is relatively small at only 9,000 MW, representing just over 1% of the country’s power requirements. Two-thirds of this capacity is wind power, 3,400 MW of which was added in 2007. In September 2007, China’s National Development and Reform Commission (NDRC) established new renewable targets, which if achieved, will require over
US$250 billion to be invested in the space, or more than US$80 billion if large hydro is excluded (Exhibit 1.65).
While public market activity was strong in China in 2007 at US$1.5 billion of alternative energy IPOs, US$3.4 billion was raised by renewable power related Chinese companies on foreign exchanges, mostly solar companies with IPOs in the U.S. Asset financing in China nearly doubled year over year to US$10.8 billion, while M&A activity remained weak at US$386 million. Exhibit 1.66 shows the growth in alternative and renewable energy investment in China over the past four years.

The Choice of a New Generation August 2008
65
Exhibit 1.68: Alternative & Renewable Energy Transactions in India, 2004-2007
$0$500
$1,000$1,500$2,000$2,500$3,000$3,500$4,000$4,500$5,000
2004 2005 2006 2007
Mill
ions
(US$
)
Mergers & Acquisitions
Asset Finance
Public Markets
Venture Capital/ Private Equity
$0.6B$1.1B
$1.3B
$3.7B
Source: New Energy Finance; Scotia Capital.
Exhibit 1.69: Brazil’s Renewable Status & Targets
2007 Capacity 2008 Target
Large Hydro 144,000 MW -
Small Hydro 1,800 MW 2,900 MW
Wind 237 MW 1,637 MW
Solar PV 8.6 MW -
Biomass 3,700 MW 4,600 MW
Geothermal - -
Tidal/Wave/OTEC - -
Source: Brazil Government; New Energy Finance; Scotia Capital.
Exhibit 1.67: India’s Renewable Status & Targets
2007 Capacity 2012 Target
Large Hydro 34,200 MW -
Small Hydro 2,000 MW 3,400 MW
Wind 7,800 MW 18,300 MW
Solar PV 2.1 MW 52.1 MW
Biomass ~1,400 MW ~3,500 MW
Geothermal - -
Tidal - -
Source: New Energy Finance; MNRE; Scotia Capital.
Excluding Wind, Investment Activity in India Is Quiet
Despite the Indian government setting a renewable energy target of 10% by 2032, wind power seems to be the only renewable fuel source that is attracting material investment attention. At the end of 2007, 11,400 MW of renewable capacity was online, most of which was wind power at 7,800 MW.
Exhibit 1.67 shows India’s official renewable targets from its most recent five-year plant (2007-2012).
In the capital markets, 2007 saw US$628 million raised locally in new equity, compared to nothing raised in 2006. Similar to China, India-based renewable companies looked overseas for the majority of their funding requirements, raising US$1.4 billion outside of India. Also notable was Suzlon raising US$551 million via a secondary offering on the Bombay Stock Exchange to fund its acquisition of REpower. Exhibit 1.68 shows the growth in alternative and renewable energy investment in India over the past four years.
Investment in Brazil Going Mainly to Large Hydro and Ethanol
Including large hydro, renewable fuel sources make up 84% of Brazil’s power generation capacity, and 46% of its energy mix. However, despite Brazil’s PROINFA program, which offers feed-in tariffs for wind, small hydro, and biomass, there seems to be a lack of investment interest in renewable power capacity other than large hydro. Exhibit 1.69 shows Brazil’s 2008 renewable power targets.

Alternative & Renewable Energy August 2008
66
Exhibit 1.70: Alternative & Renewable Energy Transactions in Brazil, 2004-2007
$0
$1,000
$2,000
$3,000
$4,000
$5,000
$6,000
$7,000
$8,000
$9,000
2004 2005 2006 2007
Mill
ions
(US$
)
Mergers & Acquisitions
Asset Finance
Public Markets
Venture Capital/ Private Equity
$0.2B$0.5B
$5.1B
$7.9B
Source: New Energy Finance; Scotia Capital
US$6.1 billion was spent on asset financing last year (up 40% year over year), mostly on biofuel plants with some towards small hydro. Only one wind financing deal took place in Brazil during 2007 for US$69 million. Most venture capital and private equity dollars (US$658 million) were directed towards ethanol expansion, as were M&A transactions. Australian wind developer Pacific Hydro acquired SES Ltda, for the only Brazilian wind deal of 2007. Exhibit 1.70 shows the growth in alternative and renewable energy investment in Brazil over the past four years.
Russia Still Focused Heavily on Its Fossil Fuels
Russia’s vast fossil fuel resources, coupled with its economy which has not grown as fast as its BRIC peers, has not yet forced the country to consider its alternative power generation options. Currently, there are 10 million Russians with no grid access. Russia’s first wind project, the Kalmykia Wind Farm, recently completed construction of its first phase in early 2008. Dutch wind developer Windlife International plans to build a 200 MW facility near Murmansk by 2011.

The Choice of a New Generation August 2008
67
Boralex Inc. (BLX-T)
Aug 15, 2008: $14.80 1-Yr Target: $18.00 Capitalization Rating: 1-Sector Outperform 1-Yr ROR: 21.6% Shares O/S (M) 37.8 Risk: High 2-Yr Target: $20.00 Total Value ($M) 559.4 IBES EPS 2008E $0.78 2-Yr ROR: 35.1% Float O/S (M) 19.1 IBES EPS 2009E $0.89 Float Value ($M) 282.1 Div. (Curr.): $0.00 TSX Weight -- Yield: 0.0%
Valuation: 75% DCF @ 10%; 25% NAV
Qtly EPS (FD) (Next Release: Nov-08)
Y/E DECEMBER-31 Mar Jun Sep Dec Year P/E 2007A $0.32A $0.15A $0.03A $0.15A $0.60 28.6x 2008E $0.24A $0.03A $0.08 $0.16 $0.51 28.8x 2009E $0.25 $0.15 $0.12 $0.22 $0.73 20.2x 2010E $0.27 $0.18 $0.10 $0.24 $0.79 18.6x Industry Specific 2006A 2007A 2008 2009 2010 Production (GWh) 1,377 1,544 1,626 1,764 1,856
Note: Historical price multiple calculations use FYE price. Source: Reuters; company reports; Scotia Capital estimates.
A Lean, Green, Cash Flow Machine I N V E S T M E N T H I G H L I G H T S
• 1,000 MW by 2012 achievable. In our minds, Boralex Inc.’s (Boralex) plan to nearly triple its capacity by 2012 from ~350 MW is not fully discounted in its share price. Its growth target is based on hydro growth in B.C., an entrance into the solar market, and new wind farm capacity in both Canada and Europe.
• A New England call option on natural gas. Boralex’s exposure to merchant power markets in the northeastern United States is high, as marginal power prices there are typically set by natural-gas-fired generators. We see natural gas prices rising over the long term.
• Upside potential. Strong spot northeastern U.S. power prices, our long-term outlook for a tight Connecticut REC market, and easing diesel prices coupled with improving burn rates at its wood-residue facilities are the basis for our positive outlook.
• Stock catalysts. We believe an extension of the U.S. Production Tax Credit will boost Boralex’s share price, as will higher Renewable Energy Certificate (REC) prices and Boralex being awarded power purchase agreements (PPAs) from several renewable request for proposals (RFPs). Reducing its relative commodity price exposure should occur naturally through the addition of free-fuel wind and hydro assets.
• Relative valuation attractive. While we don’t rely on relative valuation metrics to set our target prices, on a forward P/E, EV/EBITDA, P/S, and P/CF basis, Boralex is trading at a material discount to both its peer group and its closest comparable company, Canadian Hydro Developers. In our opinion, this discount is unwarranted and presents investors with an attractive entry point into the name.
• We have transferred coverage of the common shares of Boralex Inc., raising our rating to 1-Sector Outperform. We also increased our one-year target to $18.00 per share, based on a 75%-weighted discounted cash flow approach, using a 10% discount rate, and a 25%-weighted net asset value calculation.

Alternative & Renewable Energy August 2008
68
Exhibit 2.1: Boralex Inc. – Relative Valuation Metrics
Last SC 1-Year 1-Year MarketCompany Ticker Price Rating Target ROR DCF NAV Cap 2008E 2009E 2010E
8/15/2008 ($M) (x) (x) (x)
Boralex BLX $14.80 1-SO $18.00 22% $18.33 $17.03 $560 9.9x 8.6x 7.6xCanadian Hydro Developers KHD $4.38 1-SO $7.00 60% $7.04 $6.95 $628 20.3x 9.9x 7.6xEarthfirst Canada EF $0.27 3-SU $0.40 48% $0.35 $0.60 $28 n.m. -5.5x -0.9xInnergex Renew able Energy INE $8.25 3-SU $9.50 15% $9.44 $9.55 $194 n.m. 18.4x 7.8xPlutonic Pow er PCC $7.04 2-SP $9.00 28% $9.03 $8.75 $297 n.m. n.m. n.m.Average 35% $341 15.1x 7.8x 5.5x
Company Ticker Beta 2008E 2009E 2010E 2008E 2009E 2010E 2008E 2009E 2010E(x) (x) (x) (x) (x) (x) (x) (x) (x)
Boralex BLX 0.7 28.8x 20.2x 18.6x 2.6x 2.5x 2.3x 10.4x 8.7x 7.7xCanadian Hydro Developers KHD 0.5 54.6x 23.4x 17.3x 7.2x 3.9x 3.1x 16.0x 9.0x 6.6xEarthfirst Canada EF - n.m. n.m. n.m. n.m. 5.5x 0.9x n.m. n.m. 5.6xInnergex Renew able Energy INE - n.m. n.m. 25.5x 27.5x 8.3x 4.2x n.m. 33.6x 10.2xPlutonic Pow er PCC 0.9 n.m. n.m. n.m. n.m. n.m. n.m. n.m. n.m. n.m.Average 0.7 41.7x 21.8x 20.5x 12.4x 5.1x 2.6x 13.2x 17.1x 7.5x
Price to Earnings Price to Sales Price to Cash Flow
Enterprise Value to EBITDA
Source: Bloomberg; Scotia Capital estimates.
Summary & Investment Recommendation Boralex offers investors an opportunity to participate in one of the most well-diversified renewable power portfolios in North America. In addition to a strong capacity expansion plan expected over the next five years, we see material upside from several factors that we believe are not reflected in the current share price. Easing diesel costs, a reasonable likelihood of a U.S. Production Tax Credit renewal in 2009, coupled with our bullish long-term Connecticut REC market outlook, and northeastern U.S. power prices that should remain in the US$90/MWh to US$110/MWh range are several reasons why. Beyond that, we think that market uncertainty as to whether 34%-owner Cascades will need to sell Boralex stock to avoid a potential cash crunch is for the most part unwarranted. Also, CO2 allowance prices within the European Union’s Emissions Trading Scheme remain 10% to 30% above our long-term forecast.
Major near-term stock catalysts for Boralex include winning new renewable power PPAs in the Ontario RES III RFP, the BC Hydro Clean Power Call, two 250 MW Quebec wind RFPs, and the B.C. and Ontario standard offer programs. We also think the stock will move on announcements of new wind capacity development in France or Italy, a final decision to enter the solar power market in Spain or France, and the extension of the U.S. Production Tax Credit. While at least two to three years out, watch for a new transmission line announcement that would connect northern Maine into NEPOOL. If this were to occur, we think 68 MW of capacity could become REC-certified for the Connecticut market.
We have transferred coverage of the common shares of Boralex. We rate the company a 1-Sector Outperform, with a High risk ranking and a one-year target of $18 per share. Our target price is based on a 75% weighted discounted cash flow analysis at a 10% discount rate, and a 25% weighted net asset value per share.
F I N A N C I A L O U T L O O K
For 2008, we estimate EBITDA and fully diluted EPS of $67.4 million and 51¢, respectively, slightly below consensus on both measures. Looking past 2008, we estimate EBITDA and fully diluted EPS of $77.9 million and 73¢, respectively. Our 2009E production forecast increases by 8.5% year over year to 1,764.1 GWh. We estimate EBITDA per MWh will hit about $44 in 2009, up from $41 this year.

The Choice of a New Generation August 2008
69
Exhibit 2.2: Boralex Inc. – Stock Price Performance
$12.00
$14.00
$16.00
$18.00
$20.00
$22.00
$24.00
Dec-07 Feb-08 Apr-08 Jun-08
Pric
e
050100150200250300350400450500
Daily
Vol
ume
(000
s)
BLX (Volume) BLX (Price) STUTIL (rebased) SPTSX (rebased)
$560.0M
BLX$14.80
$19.39$13.0037.8M
Ticker:Last Price:Market Cap:52 Wk High:52 Wk Low :Shares O/S:
Source: Bloomberg; Scotia Capital.
Capital Markets Profile Since its 1982 incorporation, Boralex has grown into one of Canada’s pre-eminent independent power producers, with 350 MW (net) of renewable power capacity, as well as a 14 MW natural gas cogeneration facility. The company is well diversified, with hydro, wind, and wood-residue operations scattered throughout Quebec, New England, New York, and France. Boralex also manages various operating assets on behalf of Boralex Power Income Fund, of which it currently holds a 23% interest. In addition to traditional electricity sales, Boralex’s earnings are materially boosted by favourable renewable energy and climate change policies, such as the U.S. Production Tax Credit, and the sale of Renewable Energy Certificates. Please refer to Exhibit 2.41 at the end of this company section for a display of Boralex’s corporate structure.
Bernard Lemaire is the founder, visionary, and Executive Chairman of the board of Boralex. Mr. Lemaire’s son, Patrick, joined Boralex in 2006 as President and CEO. Prior to joining Boralex, Patrick Lemaire held the position of VP & COO at Containerboard of Norampac Inc. Mr. Jean-Francois Thibodeau, Boralex’s CFO since 2003, brings strong financial management experience to the team, having served as VP & Treasurer at CAE Inc. and as Treasurer for Transcontinental Group Ltd. Boralex’s management and directors collectively control 16.9% of the firm. Boralex employs over 300 people, with corporate offices in Kingsey Falls and Montreal, Quebec.
Boralex’s founder, Bernard Lemaire, is also co-founder and current Chairman of Cascades Inc., a Canadian-based paper and packaging company. Cascades currently owns 34.3% of Boralex, while Kernwood Ltd., a private investment company controlled by the Kernaghan family, owns 13.5% and Fidelity owns over 11%.
Boralex’s 37.8 million Class A shares trade on the Toronto Stock Exchange under the ticker symbol BLX. Exhibit 2.2 shows the stock’s historical trading range and volume. We believe the company’s policy of not paying dividends will continue and is in line with the firm’s strategy of funding future growth from earnings. Boralex’s institutional shareholder base is predominantly Canadian, with some holdings in both Europe and the United States. Boralex reports in Canadian dollars in accordance with Canadian Generally Accepted Accounting Principles (GAAP).
Cascades Inc. holds over 34% of Boralex; the Kernaghan family owns about 14%.

Alternative & Renewable Energy August 2008
70
Exhibit 2.3: Boralex Could Require $90M to $110M of New Equity to Reach Its 1,000 MW Goal
100 $2.70M $2.80M $2.90M $3.00M $3.10M $3.20M $3.30M150 MW $0M $0M $0M $0M $0M $0M $0M175 MW $0M $0M $0M $0M $0M $0M $0M200 MW $0M $0M $0M $0M $0M $0M $0M225 MW $0M $0M $0M $0M $0M $0M $0M250 MW $0M $0M $0M $0M $0M $5M $10M275 MW $0M $0M $5M $10M $16M $21M $27M300 MW $7M $13M $19M $25M $31M $37M $43M325 MW $20M $27M $34M $40M $47M $53M $60M350 MW $34M $41M $48M $55M $62M $69M $76M375 MW $47M $55M $63M $70M $78M $85M $93M400 MW $61M $69M $77M $85M $93M $101M $109M425 MW $75M $83M $92M $100M $109M $117M $126M450 MW $88M $97M $106M $115M $124M $133M $142M475 MW $102M $111M $121M $130M $140M $149M $159M500 MW $115M $125M $135M $145M $155M $165M $175M525 MW $129M $139M $150M $160M $171M $181M $192M550 MW $142M $153M $164M $175M $186M $197M $208M
New
Inst
alle
d C
apac
ity
Weighted Average Capital Cost per Installed MW
Excluding current development projects
Gengrowth (90 MW) and Seigneurie de Beaupre
(136 MW).
Source: Scotia Capital estimates.
When Will Boralex Need New Equity? Unlike several companies within our coverage universe, Boralex has a substantial operating asset base that generates strong annual free cash flow. Its mid-term growth plan includes the installation of 600+ MW of new capacity, for a capital spend range between $1.8 billion and $2.1 billion. Typically, the company targets a debt to equity ratio of 80%/20% for its power projects, implying a potential future equity need of up to $400 million.
For its current development plan, which includes Gengrowth (90 MW) and Seigneurie de Beaupre (net 136 MW), Boralex will use its cash on hand as well as future free cash flow to finance the equity requirements. About 80% to 85% of cash expenditures for its Seigneurie de Beaupre investment will not be spent before 2012 and 2013.
Beyond these two projects, we think that Boralex could need $90 million to $110 million of new equity to complete its goal of 1,000 MW by 2012. Exhibit 2.3 sensitizes our forecast Boralex future equity requirement to changes in (1) average cost per installed MW; and (2) total new installed capacity contracted by 2012, excluding its two development projects.
In mid-2007, Boralex closed a $100 million bought deal that yielded $105.6 million to the company, after a 10% overallotment was fully exercised and net of underwriter fees. The deal was priced at $15 per share and was primarily used to reduce its revolving credit facility.
Boralex could spend $1.8 billion to $2.1 billion on new capacity by 2012/13.
We think that Boralex could need $90 million to $110 million of new equity to complete its goal of 1,000 MW by 2012.

The Choice of a New Generation August 2008
71
Exhibit 2.4: Boralex Is Well Diversified
Technology DiversificationHydro Wind Wood-residue Co-gen
MW 7.4% 32.2% 56.1% 4.3%MWh 6.9% 13.5% 77.1% 2.5%EBITDA 8.5% 35.9% 52.0% 3.6%
Seasonal DiversificationQ1 Q2 Q3 Q4
MWh 29.7% 21.2% 24.2% 24.9%EBITDA 43.2% 10.4% 15.2% 31.2%
USA Canada FranceMWh 83.1% 0.9% 16.0%
EBITDA1 62.0% -3.3% 41.3%Assets 35.2% 22.8% 42.0%
1. EBITDA in Canada of -3.3% includes corporate costs.
Geographic Diversification
Source: Company reports.
Exhibit 2.5: Natural Gas to NEPOOL On-Peak Prices
y = 8.9872x + 4.2895R2 = 0.7942
$20
$40
$60
$80
$100
$120
$140
$160
$180
$0 $2 $4 $6 $8 $10 $12 $14 $16 $18 $20
Natural Gas - Northeast Average (US$/mmBtu)
NEP
OO
L O
n-P
eak
Pric
e (U
S$/
MW
h)
Winter
Summer
Source: Bloomberg; Scotia Capital.
We Like Boralex’s Geographic, Technology, and Seasonal Diversification Boralex is well diversified. Unlike some of its renewable peers such as Plutonic Power and EarthFirst that currently target one source of renewable power generation, Boralex is active in three types of renewable electricity generation – hydro, wind, and wood-residue. Boralex is also nicely spread among geographic regions such as Quebec, New England, New York, and France. Exhibit 2.4 shows Boralex’s 2007 capacity, generation, and EBITDA profile by fuel source, quarter, and region.
Power stations that are subject to long-term fixed price contracts are seasonally impacted by generation volume fluctuations only. Facilities that sell power on the open market are seasonally impacted by both
volume and price fluctuations. In the northeastern United States, electricity demand peaks in winter and summer periods, typically resulting in higher NEPOOL open market prices in Q1 and Q3. This allows Boralex to increase its wood-residue generation during these periods and leave regular maintenance for Q2 and/or Q4. Conversely, hydrology conditions at its New York and Quebec hydro facilities are better in Q2 and Q4 as water flow tends to decrease in the summer and winter seasons. In France, wind conditions are much stronger in Q1 and Q4 that lead to stronger capacity factors over other quarters, although a higher risk exists of lower availability caused by unfavourable weather conditions such as icing.
H I G H E R C O N T R A C T E D P R O D U C T I O N = G R E A T E R E A R N I N G S S T A B I L I T Y
Boralex continues to increase its proportional share of long-term contracted production capacity versus merchant production. Currently, 15 facilities are under fixed-price contracts, while six facilities earn revenues from spot or day-ahead power markets. In our opinion, reduced volatility associated with stable, predictable, and certain power prices deserves a slight premium over spot and/or day-ahead power market unpredictability. Exhibit 2.5 shows the strong relationship between local natural gas and spot on-peak power prices, while Exhibit 2.6 forecasts future on-peak NEPOOL spot prices based on the current natural gas forward curve.
Unlike some of its peers, Boralex is well diversified by fuel source and geographic region.

Alternative & Renewable Energy August 2008
72
Exhibit 2.6: On-Peak NEPOOL Power Prices Should Stay Around US$100/MWh Through 2010
$40
$60
$80
$100
$120
$140
$160
$180
$200
$220
Dec-04 Jun-05 Dec-05 Jun-06 Dec-06 Jun-07 Dec-07 Jun-08 Dec-08 Jun-09 Dec-09 Jun-10 Dec-10 Jun-11 Dec-11
NEP
OO
L O
n-Pe
ak P
rice
(US$
/MW
h)
ForecastBack-Tested Forecast
NEPOOL On-Peak Spot Pow er Price
Source: Bloomberg; Scotia Capital.
B A L A N C E S H E E T S T R E N G T H S U P P O R T E D B Y R E L A T I V E L Y L O W D E B T
Boralex maintains a healthy balance sheet. In our opinion, liquidity is not a concern for Boralex due to (1) annual cash flow from operations generation of about $50 million to $60 million per year; (2) close to $80 million of cash (and equivalents) on hand; (3) a current ratio of 2.4x; and (4) significant room in its debt facilities. Long-term debt continues to decline relative to total capital invested (now 33%), although we believe that the company’s debt to equity ratio will likely increase at a 4:1 ratio with the addition of new projects.
In mid 2007, Boralex refinanced a €265 million (~$380 million) master financing agreement for the development, until 2010, of wind power projects in France. About €170 million remains undrawn, and could support a further 125 MW of capacity growth. In our opinion, the master financing agreement could be extended beyond 2010 and beyond France to Italy if Boralex decides to develop wind farm projects there.
We think average NEPOOL and New York on-peak power prices will stay within a US$90 to US$110/MWh range through 2010.
Undrawn debt facilities could support a further 125 MW of wind capacity in France.

The Choice of a New Generation August 2008
73
Exhibit 2.7: Forecast Hydro Production Through 2012
05
101520253035404550
Q106
Q306
Q107
Q307
Q108
Q308
Q109
Q309
Q110
Q310
Q111
Q311
Q112
Q312
GW
h pe
r Qua
rter
Actual
Forecast
Source: Company reports; Scotia Capital estimates.
Exhibit 2.8: Forecast Wind Production Through 2012
0
20
40
60
80
100
120
140
160
Q106
Q306
Q107
Q307
Q108
Q308
Q109
Q309
Q110
Q310
Q111
Q311
Q112
Q312
GW
h pe
r Qua
rter
Actual
Forecast
Source: Company reports; Scotia Capital estimates.
Production Profile & Outlook H Y D R O
Boralex owns and operates nine hydro facilities located in B.C., Quebec, France, and New York State, for a total installed capacity of 40.7 MW (net 39.1 MW including 14.5 MW for Ocean Falls), representing 9% of its production portfolio. Going forward, we forecast annual generation of about 116 GWh from these facilities, and 119.2 GWh for 2008 due to above-average water flow in Q1/08 (Exhibit 2.7). Boralex’s
50%-owned, 1 MW La Rochette facility in France sells its electricity production under a 15-year contract with Electricite de France (EDF). In Quebec, two hydro facilities, East Angus (2.2 MW) and Huntingville (0.3 MW), produce a total of 16,000 MWh per year both under long-term (20-year and 25-year) contracts. The remaining five hydro facilities, all in New York State, sell power on the open market, with the exception of Middle Falls (2.3 MW), which supplies its electricity under a 40-year contract. Boralex’s stated capacity factor for this segment is 50.5%.
On June 11, 2008, Boralex announced the purchase of a 14.5 MW hydro facility in B.C., marking the company’s entrance into one of the most important renewable power markets in North America. The facility currently generates 1.5 MW of power that is sold to a local community, as the mill that originally required the facility’s full power was shut down in the 1970s. We note that there is enough water flow to support an eventual expansion to about 37 MW. As part of the acquisition, Boralex also obtained the rights to two hydro development projects in B.C., with a combined potential capacity of 10 MW.
W I N D
All 108 MW (net 106.8 MW) of Boralex’s installed wind capacity is located in France under 15-year Electricite de France (EDF) contracts. This should change by 2H/09 when the 40 MW first phase of its 90 MW Gengrowth wind farm is commissioned in Ontario. The remaining 50 MW of the project are due online no later than the end of 2010, while its (operational) entrance into the Quebec wind market will not be until 2013. For 2008 and 2009, respectively, we forecast 243 GWh and 289.7 GWh of wind-based
power production, or 15% and 17% of its annual production profile (Exhibit 2.8). We expect Boralex will receive an average 2009 contract price for its French wind farms of €85/MWh, increasing annually at 1.8%. We believe that Boralex will continue to focus much of its growth attention on this market, as contract prices are 10% greater than under Ontario’s Standard Offer Program of $110/MWh (plus $5/MWh for 10 years under the $10/MWh ecoENERGY program that is typically split 50:50 with the OPA program).
Hydro represents 9% of Boralex’s production portfolio. Going forward, we forecast annual generation of about 116 GWh/y.
We expect Boralex to receive an average contract price of €85/MWh at its French wind farms in 2009.

Alternative & Renewable Energy August 2008
74
Exhibit 2.9: Forecast Wood-Residue Production Through 2012
0
50
100
150
200
250
300
350
400
Q106
Q306
Q107
Q307
Q108
Q308
Q109
Q309
Q110
Q310
Q111
Q311
Q112
Q312
GW
h pe
r Qua
rter
Actual Forecast
Source: Company reports; Scotia Capital estimates.
W O O D - R E S I D U E
The core of Boralex’s business is its northeastern U.S. wood-residue power stations, which have a total installed capacity of 204 MW and produce about 1,300 GWh/y, or at a 72.7% implied capacity factor. We forecast annual production of 1,224.7 GWh and 1,296 GWh in 2008 and 2009 due to the recent restart of its 18 MW Stacyville facility as well as better-than-expected production in Q1/08. Exhibit 2.9 shows our forecast seasonality chart for Boralex’s wood-residue segment, which is much less seasonal than its other segments. As electricity consumption typically decreases in the spring and fall (and all else equal – spot power prices too), Boralex typically performs its routine maintenance during these periods of lower expected margins.
Wood-residue costs, the primary source of fuel for these plants, have risen significantly over the past few years due to higher transportation costs (mainly diesel) as well as Boralex’s decision to use a better-quality wood-residue to ensure continued REC compliance. As a partial offset, Boralex has implemented various strategies that range from improving burn-rates at some facilities to the introduction of storage facilities in anticipation of seasonal spikes in wood-residue costs.
At a 35% humidity level, Boralex uses 1.65 tons of wood-residue per MWh. About 85% of Boralex’s wood-residue supply is sourced from whole tree chips (30%-35% humidity), while most of the remainder comes from less expensive mill residue (25%-35% humidity). Our operating cost per MWh assumes 25% fixed costs and 75% wood-residue costs. Of the wood-residue costs, about 75% is attributable to transportation, while the remainder is the direct material cost. Depending on the season, Boralex keeps about 60 to 90 days of wood-residue inventory on hand. Inventory typically peaks at the start of the year when there is limited access to wood-residue due to local areas being covered by snow.
On the back of soaring fuel costs, the historical saving grace for Boralex’s wood-residue segment has been its ability to earn revenue in the Connecticut REC market. Boralex can earn up to the equivalent of US$55/MWh from its REC-certified facilities. Historically, Boralex has sold about 75% of its expected RECs forward to hedge against new REC-qualified capacity that may come online in the region that would reduce REC prices. Additionally, its Chateaugay facility is qualified for the New York REC market, which has a 10-year agreement with the state that we believe is somewhat unique. The arrangement provides Boralex with a payment if open market power prices are not high enough to provide the facility with an ample return. Effectively, this program ensures a Chateaugay floor power price of about US$75/MWh.
Boralex can earn up to US$55 per REC (or MWh) in addition to the power price it receives.

The Choice of a New Generation August 2008
75
Exhibit 2.11: Forecast EBITDA per MWh per Fuel Source
$0
$20
$40
$60
$80
$100
$120
2008E 2009E 2010E 2011E 2012E
EBIT
DA p
er M
Wh Wood-
residue
Wind
Hydro Co-gen
Source: Scotia Capital estimates.
Exhibit 2.10: Forecast Cogeneration Production Through 2012
0
5
10
15
20
25
Q106
Q306
Q107
Q307
Q108
Q308
Q109
Q309
Q110
Q310
Q111
Q311
Q112
Q312
GW
h pe
r Qua
rter
Actual Forecast No production forecast for Q2s & Q3s
Source: Company reports; Scotia Capital estimates.
N A T U R A L G A S C O G E N E R A T I O N
Boralex operates a 14 MW natural-gas-based cogeneration plant in France with a material challenge: rising fuel costs with a cap on power prices during half of the year. Over the past several years, its Blendecques facility has shut down during April through October as its contract electricity prices are capped during this high-demand period, while the plant’s natural gas costs are not capped and continue to rise. We believe that Boralex will likely continue this practice of operating only when it is profitable to
do so, and accordingly, we expect the facility to produce only 38.7 GWh of electricity per year, out of a 122 GWh/y of theoretical output. Exhibit 2.10 shows our forecast seasonality chart for Boralex’s cogeneration facility. Steam is also produced at this plant, with an annual output of 528 million pounds per year. But, as the plant is shut down for more than half a year, Boralex is required to operate an auxiliary boiler from April through October to meet its customer contract requirements.
Like a majority of European fossil fuel power producers, Boralex’s Blendecques plant is allocated an annual allowance of CO2 emissions permits under the EU Emissions Trading Scheme (ETS). As the facility does not run for about seven months per year, it is able to sell its excess permits for incremental EBITDA. At the start of 2008, and in accordance with the EU’s Kyoto Protocol commitment, CO2 allowances were scaled back, resulting in higher CO2 prices to date due to lower supply and higher demand. However, for the Blendecques facility, lower sales volume will likely more than offset these higher prices.
In Exhibit 2.11, we have forecast EBITDA per MWh per business segment. Clearly, Boralex’s EBITDA margin on its wind power business is far superior to its other segments. In our view, this is precisely why Boralex is seeking more new wind capacity than any other renewable power technology. Our forecast below includes all incentives such as RECs, excess CO2 quota sales, forward capacity premiums, the U.S. Production Tax Credit, and green credits. Also, we use a par CAD/USD FX rate as well as a long-term CAD/EUR FX rate of $1.50.
Boralex’s Blendecques facility does not operate for seven months per year due to seasonally higher natural gas costs coupled with an electricity price cap during the summer.
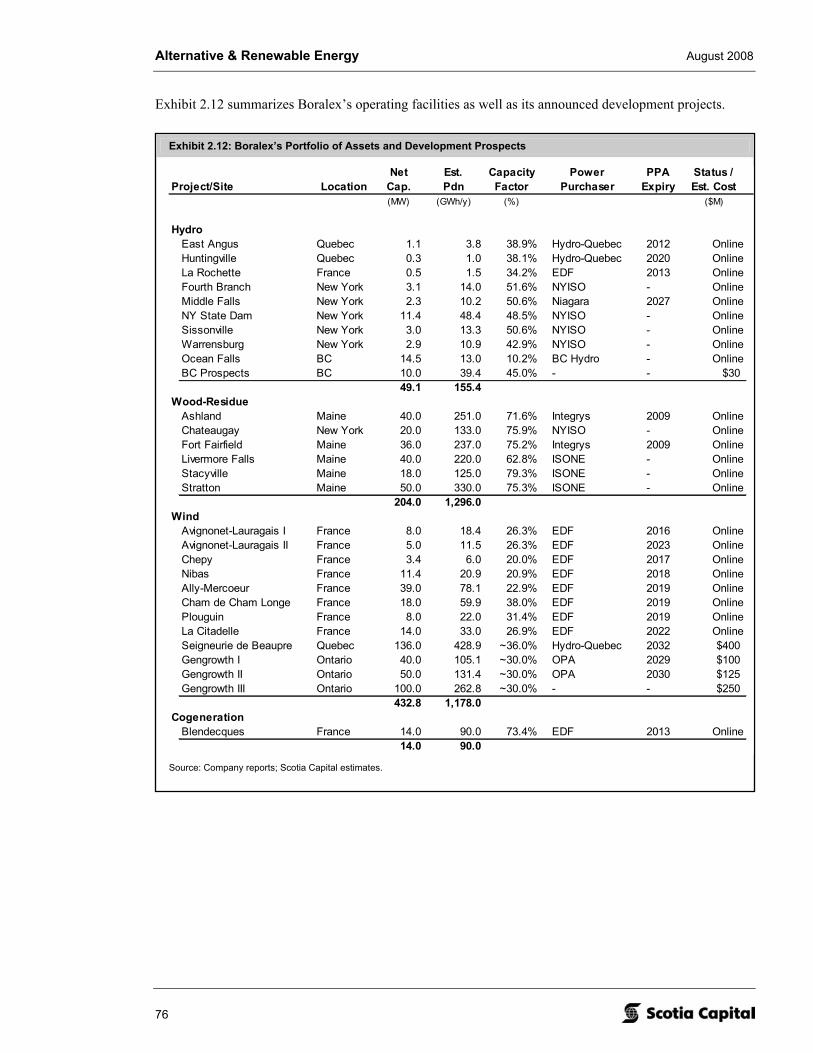
Alternative & Renewable Energy August 2008
76
Exhibit 2.12: Boralex’s Portfolio of Assets and Development Prospects
Net Est. Capacity Power PPA Status /Project/Site Location Cap. Pdn Factor Purchaser Expiry Est. Cost
(MW) (GWh/y) (%) ($M)
HydroEast Angus Quebec 1.1 3.8 38.9% Hydro-Quebec 2012 OnlineHuntingville Quebec 0.3 1.0 38.1% Hydro-Quebec 2020 OnlineLa Rochette France 0.5 1.5 34.2% EDF 2013 OnlineFourth Branch New York 3.1 14.0 51.6% NYISO - OnlineMiddle Falls New York 2.3 10.2 50.6% Niagara 2027 OnlineNY State Dam New York 11.4 48.4 48.5% NYISO - OnlineSissonville New York 3.0 13.3 50.6% NYISO - OnlineWarrensburg New York 2.9 10.9 42.9% NYISO - OnlineOcean Falls BC 14.5 13.0 10.2% BC Hydro - OnlineBC Prospects BC 10.0 39.4 45.0% - - $30
49.1 155.4Wood-Residue
Ashland Maine 40.0 251.0 71.6% Integrys 2009 OnlineChateaugay New York 20.0 133.0 75.9% NYISO - OnlineFort Fairfield Maine 36.0 237.0 75.2% Integrys 2009 OnlineLivermore Falls Maine 40.0 220.0 62.8% ISONE - OnlineStacyville Maine 18.0 125.0 79.3% ISONE - OnlineStratton Maine 50.0 330.0 75.3% ISONE - Online
204.0 1,296.0Wind
Avignonet-Lauragais I France 8.0 18.4 26.3% EDF 2016 OnlineAvignonet-Lauragais II France 5.0 11.5 26.3% EDF 2023 OnlineChepy France 3.4 6.0 20.0% EDF 2017 OnlineNibas France 11.4 20.9 20.9% EDF 2018 OnlineAlly-Mercoeur France 39.0 78.1 22.9% EDF 2019 OnlineCham de Cham Longe France 18.0 59.9 38.0% EDF 2019 OnlinePlouguin France 8.0 22.0 31.4% EDF 2019 OnlineLa Citadelle France 14.0 33.0 26.9% EDF 2022 OnlineSeigneurie de Beaupre Quebec 136.0 428.9 ~36.0% Hydro-Quebec 2032 $400Gengrowth I Ontario 40.0 105.1 ~30.0% OPA 2029 $100Gengrowth II Ontario 50.0 131.4 ~30.0% OPA 2030 $125Gengrowth III Ontario 100.0 262.8 ~30.0% - - $250
432.8 1,178.0Cogeneration
Blendecques France 14.0 90.0 73.4% EDF 2013 Online14.0 90.0
Source: Company reports; Scotia Capital estimates.
Exhibit 2.12 summarizes Boralex’s operating facilities as well as its announced development projects.

The Choice of a New Generation August 2008
77
Exhibit 2.13: Getting to 1,000 MW by 2012
FuelSource Region Target Notes
(net MW)
Installed 364
Advanced DevelopmentWind Quebec 136 PPAs securedWind Ontario (Gengrowth I & II) 90 Under construction
Our Best GuessWind Ontario (Gengrowth III) 100 Recently acquiredWind Quebec 100 Via tw o 250 MW RFPsWind France 50 75 MW being studiedWind Italy 50 Being studiedHydro B.C. 150Solar Spain or France 35 Being studied
1,075
Source: Scotia Capital estimates.
Getting to 1,000 MW by 2012
Boralex has targeted 1,000 MW of total contracted capacity by 2012, or a 30% annual capacity growth rate from its current 363.9 MW, which we believe is achievable. To reach this capacity, Boralex is focused on the following growth initiatives (Exhibit 2.13):
Wind (Quebec). In May 2008, Boralex was awarded two (of three bid) Hydro-Quebec wind power PPAs for a total of 272 MW (net 136 MW). The 20-year PPAs offer an average price of $87/MWh for wind energy plus an additional $18/MWh for transmission and balancing. Additionally, we believe that Boralex will bid 50 MW to 100 MW of wind projects (likely a reworked version of its Seigneurie de Beaupre Phase I) into Quebec’s two 250 MW wind RFPs (i.e., Municipal and First Nations). PPAs for both these RFPs are offered at a fixed energy price of $95/MWh (in 2008 dollars with an annual inflation adjustment).
Wind (France). Under its €265 million (~$400 million) master financing agreement that was completed in June 2007, Boralex could add a further 100 MW to 150 MW in France by 2012. In our opinion, Boralex will aim to install 50 MW of new wind capacity in France prior to the 2010 expiration of its Master Financing Agreement.
Wind (Italy). Boralex continues to investigate wind power opportunities in Italy where the aggregate price of power, green attributes, and government incentives could be in the €180/MWh area. Social acceptance of wind turbines in Italy is materially lower than in other European countries such as Spain and Germany. At best, we see no more than 50 MW (numerous small projects) of installed wind capacity by Boralex in Italy over the next five years.
Gengrowth acquisition. In mid-2007, Boralex acquired from Gengrowth the rights to 90 MW of wind farms to be located in the Windsor, Ontario, region. The acquisition of the nine 10 MW projects each included signed $110/MWh Ontario Standard Offer Program contracts. Boralex expects 40 MW to be installed by Q2/09, with the remainder to be commissioned in 2009/10. A further 100 MW of Ontario wind prospects were purchased by Boralex from Gengrowth in July 2008, and will likely be entered into the 500 MW Ontario Power Authority RES III RFP.
B.C. run-of-river. Boralex has targeted 100 MW to 150 MW of B.C. run-of-river power within the next several years. We believe that Boralex will acquire the rights from local developers directly rather than invest the lengthy time required to conduct its own hydrology studies.
Spanish solar developer acquisition. In 2007, Boralex paid $1.5 million for the 50% acquisition of a local solar power developer in Spain. Spain currently offers a 25-year standard offer solar power PPA at €420/MWh (~$630/MWh). While these contracts expire in September, new tariff rates will drop to the €250/MWh to €280/MWh range, in line with Ontario’s $420/MWh offer, or ~€280/MWh. Boralex aims to have about 35 MW of Spanish (or French) solar power generation in service within five years. We expect an initial 5 MW to 10 MW of solar power to be contracted by the end of 2009.
We believe Boralex will bid 50 MW to 100 MW of wind projects into Quebec’s two 250 MW wind RFPs.
In Italy, we see no more than 50 MW of installed wind capacity by Boralex over the next five years. Social acceptance of wind turbines there is low.

Alternative & Renewable Energy August 2008
78
Exhibit 2.14: Connecticut Seeks 20% Renewable Power by 2020
Start Date Class I Class I or II Class III Total01-Jan-06 2.0% 3.0% 5.0%01-Jan-07 3.5% 3.0% 1.0% 7.5%01-Jan-08 5.0% 3.0% 2.0% 10.0%01-Jan-09 6.0% 3.0% 3.0% 12.0%01-Jan-10 7.0% 3.0% 4.0% 14.0%01-Jan-11 8.0% 3.0% 4.0% 15.0%01-Jan-12 9.0% 3.0% 4.0% 16.0%01-Jan-13 10.0% 3.0% 4.0% 17.0%01-Jan-14 11.0% 3.0% 4.0% 18.0%01-Jan-15 12.5% 3.0% 4.0% 19.5%01-Jan-16 14.0% 3.0% 4.0% 21.0%01-Jan-17 15.5% 3.0% 4.0% 22.5%01-Jan-18 17.0% 3.0% 4.0% 24.0%01-Jan-19 18.5% 3.0% 4.0% 25.5%01-Jan-20 20.0% 3.0% 4.0% 27.0%
Class I: solar, wind, fuel cells, methane gas from landfills, biomass after 1998, ocean,wave or tidal power, run-of-river less than 5 MW beginning after July 1, 2003,low emission advanced renewable energy conversion technologies
Class II: trash-to-energy, run-of-river less than 5 MW and prior to July 1, 2003,and biomass before 1998.
Class III: combined heat and power systems with an operating efficiency greater than 50%
Source: Company reports; Scotia Capital estimates.
We’re Bullish on Connecticut’s REC Market In addition to its Stratton facility, Boralex recently qualified two wood-residue facilities into the Connecticut Class I REC market, which we believe will generate about US$20 million to US$22 million per year of EBITDA over the next several years, provided the REC market becomes tight again. Boralex is likely the largest provider of RECs into the Connecticut market.
Connecticut has one of the most demanding renewable portfolio standards in the United States, which, by 2020, requires a minimum of 20% of the state’s electricity supply to come from traditional “Class I” renewable technologies. The state’s RPS requirement currently calls for 5% traditional renewable generation that escalates by 1% to 1.5% (Exhibit 2.14). Class I renewable sources include solar, wind, biomass, landfill gas, fuel cells, ocean thermal power, wave or tidal power, and various conservation technologies/programs.
Power marketers may satisfy the state’s requirements by either ensuring that the source of electricity meets the RPS requirements or by purchasing the green attributes (i.e., RECs) of renewable power. If the RPS is not satisfied, a non-compliance penalty of US$55/MWh is charged for all power that falls short of the 5% RPS, effectively creating an artificial price cap for RECs at US$55/MWh.
While there is no escalation rate to the US$55/MWh penalty, the Connecticut Department for Utility Control (CT DPUB) reviews the Alternative Compliance Payment (ACP) every two years. Neighbouring REC markets that operate somewhat similar programs have penalty payments that are indexed to inflation, and are currently in the US$57/MWh area. We expect that CT DPUB will amend its ACP
to include an annual inflation adjustment that results in near identical penalty prices. Why: In the long term, new wind power will likely be built to be REC-qualified in all northeastern U.S. states, allowing for a wind producer to sell its RECs in the highest-paying market at that moment, even if the difference is merely 1¢.
B O R A L E X I S L I K E L Y F I N I S H E D R E C - Q U A L I F Y I N G F A C I L I T I E S , F O R N O W
We believe that Boralex will not qualify any additional capacity (i.e., Fort Fairfield or remaining Ashland capacity) into the CT Class I REC market unless a transmission line that Boralex can access is constructed from northern Maine into NEPOOL.
For those plants that are located in northern Maine and outside of NEPOOL, Boralex must wheel its power through New Brunswick and then into the NEPOOL market in order for those facilities to earn CT Class I RECs. However, there’s a catch. The current agreement that Boralex has with New Brunswick allows for only 26 MW of power to be wheeled through the province and into the NEPOOL market. To increase its transmission capacity to 76 MW (i.e., Ashland + Fort Fairfield) would not provide an ample return to Boralex, as the wheeling cost is likely too high.
We believe that Boralex will not qualify any additional capacity into the Connecticut REC market for the next several years.

The Choice of a New Generation August 2008
79
Exhibit 2.15: Forecast Northeastern U.S. RPS Demand
0
2
4
6
8
10
12
14
16
18
20
22
24
26
28
30
32
34
2007 2008 2009 2010 2011 2012 2013 2014 2015 2016 2017 2018 2019 2020 2021 2022 2023 2024 2025
Pote
ntia
l REC
s (M
illio
ns)
Maine
New Hampshire
Rhode Island
Massachusetts
Connecticut
New York
Source: Scotia Capital.
C O N N E C T I C U T R E C P R I C E S S H O U L D R E M A I N S T R O N G , B U T E X P E C T V O L A T I L I T Y
We believe that at least 800+ MW of new wind capacity (at a greater than 30% capacity factor) would have to come online each year in the northeastern U.S. power markets just to keep REC prices constant. By 2020, northeastern U.S. RPS annual demand for RECs could hit 30 million, or six times higher than 2007 REC demand of about 5 million (Exhibit 2.15). While there is not a lot of wind in New England, there are better wind power opportunities in New York, New Brunswick, and Quebec, or one wheel away. In addition to the possibility that state legislation can effectively change at any time, one small risk exists that about 100 MW of biomass (not owned by Boralex) could become REC-certified at any time, possibly putting temporary downward pressure on REC pricing.
R E C E N T R E C C E R T I F I C A T I O N O F L I V E R M O R E F A L L S I S W O R T H $ 1 . 3 5 P E R S H A R E
We believe the net present value of after-tax incremental REC-based earnings from Livermore Falls through to 2020 is worth $1.35 per share. We do not consider potential REC value beyond 2020, as Connecticut’s current RPS expires by then. We assume a starting REC price of US$48/MWh, in line with recent forward REC sales in the Connecticut market, and added US$1/MWh per year through to 2020. Other assumptions include: (1) a par FX rate; (2) a 63% average capacity factor that is quite conservative compared to most wood-residue facilities; and (3) a 10% discount rate. Exhibit 2.16 outlines a sensitivity analysis of our REC value model.
By 2020, northeastern RPS demand for RECs could hit 30 million, or 6x higher than 2007 REC demand.

Alternative & Renewable Energy August 2008
80
Exhibit 2.16: Incremental BLX Value for New CT Class I REC Installed Capacity
## 13% 12% 11% 10% 9% 8% 7%0 $0.00 $0.00 $0.00 $0.00 $0.00 $0.00 $0.00
10 $0.30 $0.31 $0.32 $0.34 $0.35 $0.37 $0.3920 $0.59 $0.62 $0.64 $0.67 $0.70 $0.74 $0.7730 $0.89 $0.93 $0.97 $1.01 $1.06 $1.10 $1.1640 $1.19 $1.24 $1.29 $1.35 $1.41 $1.47 $1.5450 $1.49 $1.55 $1.61 $1.68 $1.76 $1.84 $1.9360 $1.78 $1.86 $1.93 $2.02 $2.11 $2.21 $2.3270 $2.08 $2.17 $2.26 $2.36 $2.46 $2.58 $2.7080 $2.38 $2.48 $2.58 $2.69 $2.81 $2.94 $3.0990 $2.68 $2.78 $2.90 $3.03 $3.17 $3.31 $3.47
100 $2.97 $3.09 $3.22 $3.36 $3.52 $3.68 $3.86
Discount Rate
Incr
emen
tal C
T RE
C Q
ualif
ied
Capa
city
Source: Scotia Capital estimates.
N E W Y O R K R E C A R R A N G E M E N T P R O V I D E S O P E R A T I O N A L S E C U R I T Y
Boralex’s 20 MW Chateaugay wood-residue facility qualified for the New York State REC market in early 2006. Boralex subsequently signed a 10-year contract to sell those RECs to the New York State government that will expire in mid-2016. The power station receives REC payments when open market power prices fall below a benchmark level, effectively guaranteeing a minimum return to the facility under a normal operating environment. In our opinion, Boralex’s New York REC “hedge” locks in a minimum 2008 power price of US$75/MWh for the Chateaugay facility.

The Choice of a New Generation August 2008
81
Exhibit 2.17: EU ETS – Trial Period (Phase I)
0
5
10
15
20
25
30
35
Dec-04 Jun-05 Dec-05 Jun-06 Dec-06 Jun-07 Dec-07
€/M
tCO
2e
Spot Price
Quarterly Average
Source: Bloomberg; Scotia Capital.
Exhibit 2.18: EU ETS – Compliance Period (Phase II)
0
5
10
15
20
25
30
35
Dec-07 Dec-08 Dec-09 Dec-10 Dec-11 Dec-12
€/M
tCO
2e
Spot Price
Futures Price
Source: Bloomberg; Scotia Capital.
A Small Hedge to High French Natural Gas Costs
Boralex’s 14 MW cogeneration plant in France typically shuts down during April to October as natural gas costs peak from high summer cooling demand, while its contract electricity prices are capped at a price that makes operating the facility uneconomical. Due to the plant being offline for about seven months per year, the Blendecques facility has significant excess carbon emission allowances that it can sell to those European CO2 emitting companies that require them. Excess CO2 quota sales are free of operating costs, and go directly to EBITDA.
E U E T S P H A S E I I ( 2 0 0 8 – 2 0 1 2 ) = R E D U C E D A L L O W A N C E S
Beginning January 2008, and as expected, the EU Emissions Trading Scheme (ETS) reduced its annual emissions cap to 1,859 million tonnes CO2/y through 2012. This event resulted in two implications to the Blendecques facility’s ability to earn cost-free EBITDA from the sale of its excess CO2
quota. First, the reduced volume of allowances will result in lower sales revenue to Boralex. Second, and partially offsetting, the reduced allowances available across the entire program have resulted in an average price increase of over 30%.
Assuming a long-term price of €20/tonne CO2, and an unchanged annual operating cycle, we estimate that the sale of Blendecques’ CO2 excess quota (EUA) will result in annual EBITDA of approximately $1 million to $1.3 million per year.
During the first phase of the EU ETS (i.e., the Trial Period), EUA prices crashed as some countries had emissions caps that were greater than what was actually emitted (Exhibit 2.17).
The second phase of the EU ETS (i.e., the Compliance Period) has an emission cap that is about 10% lower than under the first phase. In particular, France’s cap is 15% lower than it was under the Trial Period. As a result of the reduced cap, we expect prices to remain above €20/tonne CO2 through 2012 (Exhibit 2.18).
During the Trial Period, the EU ETS failed as some countries had emissions caps that were greater than what was actually emitted.
The Compliance Period of the EU ETS to date has been a success, with carbon emissions priced at about $35/tonne CO2.

Alternative & Renewable Energy August 2008
82
Exhibit 2.20: ISO-NE’s FCP Could Hit US$5-US$6/kW-Month Beyond Mid-2011
$0.00
$1.00
$2.00
$3.00
$4.00
$5.00
$6.00
$7.00
$8.00
Dec-06
Jun-07
Dec-07
Jun-08
Dec-08
Jun-09
Dec-09
Jun-10
Dec-10
Jun-11
Dec-11
Jun-12
US$
/KW
-Mon
th
ISO NE's fixed FCM prices to May 31,
2010 are at the low end of market
clearing prices of other regions.
Once implemented in June 2010, we believe that market clearing
prices for ISO NE's FCM will rise materially from
current levels.
Source: Company reports; Scotia Capital estimates.
Exhibit 2.19: ISO-NE’s FCM Is Below Average FCMs
2007/2008 2008/2009Eastern MMAC US$6.01 US$4.53SW MAAC US$4.49 US$6.39RTO US$1.24 US$3.40Average US$3.92 US$4.77
ISO NE US$3.05 US$4.10Discount -22% -14%
Resource Clearing Price
Catching up slowly. By end of 2010 ISO NE set prices w ill have changed to market clearing
Source: Scotia Capital.
ISO-NE’s Forward Capacity Markets If a generator does not run, it typically does not get paid. As peaking generation may run for only a few hours per day, month, or year, independent system operators (ISOs) need a way to motivate power producers to install new (non-baseload) generation capacity. The problem is well illustrated by ISO New England’s 2,700 MW increase in peak demand during 2005 that resulted in only 11 MW of new installed capacity. As a result, in 2006 ISO-NE introduced the Forward Capacity Premium (FCP), an incentive payment system to encourage investment in new capacity.
FCM-qualified assets currently receive a US$3.75/kW-Month capacity premium (about US$3.7 million per year per 100 MW), regardless of whether these facilities are online. This will increase to US$4.10/kW-Month by mid-2009 (Exhibit 2.19). Beyond this transition period of fixed payments, the Forward Capacity Premium will then switch to a market clearing price mechanism effective June 1, 2010. US$4.25kW-Month has already been set for June 1, 2010, through May 31, 2011. We believe that the FCP could then rise to between US$5/kW-Month and US$6/kW-Month, in line with ISO-NE’s neighbouring regions that utilize similar market-based capacity incentive systems (Exhibit 2.20).
FCM-qualified resources include both traditional (oil, natural gas, coal, etc.) and renewable generation sources (wind, solar, biomass, etc.), as well as demand resources such as energy efficiency, load management, and distributed generation.
We expect Boralex to realize about $3.9 million per year in 2008 EBITDA from the Forward Capacity Market, and about $4.5 million the following year.
The ISO-NE Forward Capacity Premium could rise to between US$5 and US$6 per kW-Month beyond mid-2011.

The Choice of a New Generation August 2008
83
Key Investment Risks At first glance, we find that Boralex has slightly more risks than its peer group within our universe of coverage, whose EBITDA profiles do not rely as much on open market prices and renewable incentives. However, many of the company’s risks are somewhat mitigated through diversification and hedges. Accordingly, we believe that Boralex has an overall average risk profile relative to its peers, but a high-risk profile within our Scotia Capital universe of coverage.
E X E C U T I O N R I S K
Obtaining all environmental and regulatory permits and licences, lease agreements, PPAs, local support, financing, and on-time/on-budget construction completion for Boralex’s projects may not occur as planned. Boralex’s stock price could face downward pressure from the unsuccessful completion of a project’s development. However, we note that the company already has a substantial operating asset base from which it generates significant annual free cash flow, unlike some of its more junior peers in the Canadian renewable power space.
R E G U L A T O R Y & P O L I T I C A L E N V I R O N M E N T
A considerable amount of Boralex’s annual revenue and/or EBITDA generation is based on it capitalizing on regulatory bodies’ renewable power and climate change related policies. Within our universe of coverage, Boralex has the highest exposure to “green” financial incentives through its renewable energy certificates, the U.S. production tax credit, New England’s forward capacity premium, and to a much lesser extent, excess CO2 quota sales in France.
• While Boralex is likely the largest player in the Connecticut REC market, an increase in CT Class I REC-qualified capacity (likely) or a decline in that state’s renewable portfolio standard (unlikely), could negatively impact the REC market there.
• EU ETS CO2 allowance (EUAs) prices are capped by a non-compliance penalty of €100/MtCO2. In 2006 and 2007, an over-allocation of EUAs by regulators caused a supply surplus that crashed local carbon emission prices to a near worthless amount. EUA prices are currently robust at about €23/tonne CO2 (~$35/tonne CO2). Our long-term forecast of €20/tonne CO2 (~$30/tonne CO2) gives us room for prices to drop 15%.
• The U.S. Production Tax Credit (PTC) is set to expire on December 31, 2008. The PTC accounts for a material portion of Boralex’s EBITDA generation. If the PTC is not renewed, we believe that annual EBITDA could drop by $11 million to $12 million per year, based on current qualified capacity.
• The forward capacity premium that New England ISO introduced in 2006, and is currently US$3.05/kW-Month for in-service capacity, could be rescinded if newly installed capacity surges over the coming two to three years. We believe that the forward capacity premium will remain in place and rise to US$5/kW-Month to US$6/kW-Month beyond mid-2011.
F O R E I G N C U R R E N C Y
Boralex reports in Canadian dollars and is exposed to both the U.S. dollar (net 226.7 MW) and the euro (net 107.3 MW). Please refer to our financial forecast for EBITDA sensitivities to FX changes.
If the U.S. PTC is not renewed, BLX’s EBITDA could drop by $11 to $12 million per year.

Alternative & Renewable Energy August 2008
84
M E R C H A N T P O W E R P R I C E E X P O S U R E
Boralex has over 200 MW of generation capacity that sells power into NEPOOL (108 MW), the NYISO day-ahead market (40.4 MW), or contracts that will expire within 12-18 months (76 MW). On-peak NEPOOL spot power prices are highly correlated to local natural gas prices, which can be both volatile and unpredictable.
O P E R A T I O N A L
Unplanned and longer-than-planned plant outages for maintenance or repair will negatively impact Boralex’s revenue and profitability, as (1) electricity deliveries could decline; and, (2) operating costs may increase. Many of the company’s wind turbine contracts include warranty and service agreements that partially offset this risk.
C O M M O D I T Y P R I C E E X P O S U R E
Boralex’s earnings from its wood-residue facilities are highly sensitive to changes in wood-residue costs. Rising diesel fuel costs that are tied to oil prices, as much of a facility’s operational expenses are diesel-based fuel costs. Boralex has implemented various strategies to mitigate its wood-residue cost risk, including adopting storage strategies and seeking out alternatives to virgin residue as fuel. Additionally, the company continues to work on improving the burn-rates (i.e., lower humidity wood-residue) at its power stations for higher plant efficiency.
The company’s cogeneration plant in France is exposed to volatile natural gas prices that have caused the shutdown of the facility for seven months per year in each of the past three years.
W E A T H E R & C L I M A T E C H A N G E
Boralex’s wind farms (106.8 MW) and hydro assets (26.1 MW) are subject to uncertain weather and climate pattern changes. While wind and hydrology conditions are fairly predictable over the long-term, below forecast wind speeds and water flow would hinder Boralex’s ability to produce electricity and therefore reduce the company’s revenue and net income generation. Additionally, Boralex’s co-generation facility has been forced to shut down from April though October over the past several years as the company is unable to pass on seasonally high natural gas costs to its power purchaser (EDF) as its electricity price is capped during these months.
F I N A N C I N G
Despite credit risk repricing that may increase Boralex’s cost of capital, we don’t believe the company will require significant new debt (ex. Quebec wind farms) or new equity in the near term. We believe Boralex has enough cash on hand as well as future free cash flow generation potential to complete the construction of its Gengrowth and Seigneurie de Beaupre projects. On debt, Boralex’s wind farm growth in France is subject to a €265 million master credit agreement that was refinanced last year.
A large portion of Boralex’s long-term debt has been issued at variable rates, which in a period of rising interest rates, could substantially reduce the company’s profitability. As a partial mitigation to this risk, Boralex has entered into various interest rate swap agreements that effectively and materially reduce the company’s variable interest rate exposure. Despite fair value appreciation on some of its swap arrangements, Boralex does not intend to monetize its swaps, but rather keep them as a risk reduction tool.

The Choice of a New Generation August 2008
85
Exhibit 2.21: Wind Speed Map – France
Source: www.suivi-eolien.com
Exhibit 2.22: Boralex’s French Assets
Source: Boralex.
French Wind Power Is Booming
2 5 , 0 0 0 M W O F W I N D P O W E R B Y 2 0 2 0
France has an ambitious renewable energy goal that currently seeks over 20% renewable power by 2020, up from 6.7% in 2004. New wind power capacity will play a significant role in reaching this target. Electricite de France (EDF), the world’s largest electricity provider, estimates that wind power should reach 25,000 MW by 2020, and represent 10% of total power consumption. By the end of 2007, France had 2,455 MW of wind power capacity installed.
F R O M N U C L E A R T O R E N E W A B L E S
France derives over 75% of its electricity from nuclear generation and 15% from hydro, primarily due to a long-standing policy of energy security. As a result, France is highly energy independent and one of the lowest-cost providers of electricity in Europe.
While nuclear and utility-scale hydroelectricity will remain the dominant power source in France, much of the country’s major waterways have been fully exploited, leaving wind, and to a lesser extent, run-of-river and biomass as emerging power generation technologies. Wind power in France is still a niche market, unlike its neighbours Germany and Spain, which are the two largest wind power users on the planet. Until 2005, wind farms in France had been capped at 12 MW, virtually eliminating cost advantages realized from economies of scale and the primary reason why it has historically been a niche market. Today, there is no limit as to the size of French wind farms.
B O R A L E X I N F R A N C E
Boralex has operated wind farms in France since 2002, and currently boasts 106.8 net MW of French wind capacity spread over seven projects (Exhibit 2.22). Each of Boralex’s wind farms is subject to
15-year fixed-price EDF contracts. We assume an €85/MWh 2009 contract price that escalates annually at 1.8%. We believe that Boralex will bring at least 50 MW of new French wind capacity online by 2010, financed 80% from its French master credit agreement and 20% from cash on hand and/or operations.
France seeks 25,000 MW of wind power by 2020, up from 2,455 MW in 2007.
Boralex has operated wind farms in France since 2002, and currently boasts 106.8 MW (net) of French wind capacity.

Alternative & Renewable Energy August 2008
86
Exhibit 2.24: B.C.’s Standing Offer Program (’07 dollars)
Energy EnvironmentalPrice Attribute Price Total
($/MWh) ($/MWh) ($/MWh)Vancouver Island 79.00 3.05 82.05Lower Mainland 78.00 3.05 81.05Kelly Nicola 75.00 3.05 78.05Central Interior 72.00 3.05 75.05Peace Region 65.00 3.05 68.05North Coast 66.00 3.05 69.05South Interior 67.00 3.05 70.05East Kootenay 71.00 3.05 74.05
Region
Source: BC Hydro.
Exhibit 2.23: Upcoming Stock Catalysts & Events
Sep 08 Oct 08 Nov 08 Dec 08 Q1/09 Q2/09 Q3/09 Q4/09 2010
Solar in Spain or France?B.C. SOP or Ontario SOC?
Two 250 MW Quebec Wind RFP bids/awards
50+ MW more w ind in France
Gengrowth III bid into OPA RES III RFP (100 MW)
Gengrowth Phase I online
(40 MW)
BC Hydro EPAs
awarded
Gengrowth Phase II online
(50 MW)
BC Clean Power Call bids due
RES III PPA awards
Source: Scotia Capital estimates.
Upcoming Stock Catalysts & Events We see many events over the next two years that could significantly move Boralex’s share price. In our view, awards of new PPAs (hydro in B.C., wind in Ontario, and solar in Spain), the commissioning of new capacity, and the extension of the U.S. Production Tax Credit will likely have the most material impacts on Boralex’s share price. Below, we have listed what we believe to be the more major short- to mid-term stock catalysts for Boralex.
November 2008 – BC Hydro 2008 Clean Power Call bids due. Boralex may submit some hydro projects into this RFP, likely all acquired development projects.
Q4/08 – Ontario RES III. We expect Boralex to submit its 100 MW Gengrowth III wind project into the RFP.
2H/08 to 1H/09 – Entrance into B.C.’s Standing Offer Program. The initial goal for the program is to acquire 200 GWh of energy per year, although no official limits have been set. Qualified projects will be able to sell energy at fixed prices under standard contracts, as shown in Exhibit 2.24. While we believe that these prices are too low to attract much attention, it is possible that Boralex uses a Standing Offer Program to enter the B.C. power market.
2H/08 to 1H/09 – Entrance into Ontario’s Standard Offer Program. Similar to B.C., the Ontario Power Authority (OPA) has a Standard Offer Program for renewable power generation that includes wind, solar (PV), biomass, biofuels, or waterpower. Under the terms of the SOP, renewable power producers must enter into a 20-year contract that will pay $110/MWh (2007 dollars) for renewable power ($420/MWh for solar). As the offer is materially more attractive than in B.C., we think that Boralex has a higher probability of seeking entrance into this program.
New PPAs and the extension of the U.S. Production Tax Credit are major Boralex stock catalysts.

The Choice of a New Generation August 2008
87
2H/08 to 1H/09 – Extension of U.S. Production Tax Credit? The expiration of the U.S. PTC is currently scheduled for December 31, 2008. We believe the U.S. government will eventually extend the PTC, likely following the installation of a new U.S. president in early 2009.
2009 – Solar power development in Spain. Subsequent to Boralex’s $1.5 million 2007 purchase of 50% of a Spanish solar power developer, we look for Boralex to announce either greenfield solar power projects or the acquisition of solar projects in Spain that total 5 MW to 10 MW, or 25 MW to 100 MW within five years.
Q2/09 – Commissioning of the first phase (40 MW) of the Gengrowth project (90 MW).
1H/09 – BC Hydro 2008 Clean Power Call awards expected, likely after the B.C. government election that is scheduled for May 2009.
2010 – Commissioning of the second phase (50 MW) of the Ontario-based Gengrowth project (90 MW).
We think that the BC Hydro 2008 Clean Power Call awards will be announced after the May 2009 B.C. government election.

Alternative & Renewable Energy August 2008
88
Exhibit 2.26: Boralex Power Income Fund – Unit Price Performance
$4.00
$5.00
$6.00
$7.00
$8.00
$9.00
$10.00
Dec-07 Feb-08 Apr-08 Jun-08
Pric
e
0
500
1,000
1,500
2,000
2,500
3,000D
aily
Vol
ume
(000
s)
BPT-U (Volume) BPT-U (Price) STUTIL (rebased) SPTSX (rebased)
$313.7M
BPT-U$5.31
$9.94$4.6859.1M
Ticker:Last Price:Market Cap:52 Wk High:52 Wk Low :Shares O/S:
Source: Bloomberg; Scotia Capital.
Exhibit 2.25: Cascades Inc. – Share Price Performance
$5.00$6.00$7.00$8.00$9.00
$10.00$11.00$12.00$13.00$14.00$15.00
Dec-07 Feb-08 Apr-08 Jun-08
Pric
e
01002003004005006007008009001,000
Daily
Vol
ume
(000
s)
CAS (Volume) CAS (Price) STMATR (rebased) SPTSX (rebased)
$620.5M
CAS$6.28
$10.40$5.1698.8M
Ticker:Last Price:Market Cap:52 Wk High:52 Wk Low :Shares O/S:
Source: Bloomberg; Scotia Capital.
Cascades Likely Won’t Divest Its 34% Stake in Boralex In our opinion, Cascades will not monetize its 34% ownership stake in Boralex within the next 12 to 24 months. Our Paper & Forest Products analyst believes (as we do) that the Lemaire family wants Cascades to hold on to its share of Boralex, as the Lemaires likely believe that Boralex’s potential is not reflected in its current share price. Under a scenario where Cascades’ financial profile deteriorated, we believe that the company would first liquidate some of its non-core and low book value assets before considering its investment in Boralex.
What About the Fund? Boralex’s 23% ownership stake in Boralex Power Income Fund (BPT) could be worth between $80 million and $85 million (gross) one year from now, according to our Power & Energy Infrastructure Trust analyst. Cash distributions to Boralex peaked at $12 million in 2006 and then began to decline following the announcement of the Canadian government’s Tax Fairness Plan of October 31, 2006. Our BPT analyst forecasts a constant 70¢ per unit cash distribution through 2009 that we use and assume will remain constant through 2011. This represents about $9.6 million per year for Boralex. Boralex continues to consider its options with respect to the fund.
Boralex’s 23% stake in BPT, as well as its management agreements, acts as an effective poison pill, which will likely result in a wind-up of BPT back into Boralex.

The Choice of a New Generation August 2008
89
Exhibit 2.27: DCF Analysis of BLX Suggests $18.33/share One Year Out
Gross Effective Capacity Prob. of Adjusted
Project Capacity Capacity Factor DCF Success DCF Comments(MW) (MW) (%) ($/share) (%) ($/share)
East Angus 2.2 1.1 39% $0.03 100% $0.03
Huntingville 0.3 0.3 38% $0.01 100% $0.01
La Rochette 1.0 0.5 34% $0.02 100% $0.02
Fourth Branch 3.1 3.1 52% $0.10 100% $0.10
Middle Falls 2.3 2.3 51% $0.10 100% $0.10
NY State Dam 11.4 11.4 48% $0.33 100% $0.33
Sissonville 3.0 3.0 51% $0.09 100% $0.09
Warrensburg 2.9 2.9 43% $0.06 100% $0.06
Ocean Falls 14.5 14.5 10% $0.12 100% $0.12
BC Prospects 10.0 10.0 ~45% $0.33 0% $0.00
Ashland 40.0 40.0 72% $2.12 100% $2.12
Chateaugay 20.0 20.0 76% $1.18 100% $1.18
Fort Fairfield 36.0 36.0 75% $1.99 100% $1.99
Livermore Falls 40.0 40.0 63% $1.62 100% $1.62
Stacyville 18.0 18.0 79% $0.42 100% $0.42
Stratton 50.0 50.0 75% $2.78 100% $2.78
Avignonet-Lauragais I 8.0 8.0 26% $0.22 100% $0.22
Avignonet-Lauragais II 5.0 5.0 26% $0.12 100% $0.12
Chepy 4.0 3.4 20% $0.04 100% $0.04
Nibas 12.0 11.4 21% $0.17 100% $0.17
Ally-Mercoeur 39.0 39.0 23% $0.75 100% $0.75
Cham de Cham Longe 18.0 18.0 38% $0.96 100% $0.96
Plouguin 8.0 8.0 31% $0.31 100% $0.31
La Citadelle 14.0 14.0 27% $0.40 100% $0.40
Blendecques 14.0 14.0 73% $0.45 100% $0.45
Seigneurie de Beaupre 272.0 136.0 ~36% $4.03 25% $1.01 Received Hydro-Quebec PPA in May/08.
Gengrowth I 40.0 40.0 ~30% $1.06 50% $0.53 Commissioning expected in Q1/09
Gengrowth II 50.0 50.0 ~30% $1.32 25% $0.33 Commissioning expected in 2010.
Gengrowth III 100.0 100.0 ~30% $2.27 0% $0.00
Interest in BPT $2.07 100% $2.07 Taken from NAV.
738.7 599.9 $18.33
Note: All green attributes and other incentives are allocated on a project by project basis.
Source: Scotia Capital estimates.
Valuation & Sensitivity Analysis We value Boralex’s common shares using a blended approach as follows: a 75% weight to a project probability-weighted discounted cash flow (DCF) analysis, at a 10% discount rate, and a 25% weight to a net asset value calculation.
D I S C O U N T E D C A S H F L O W A N A L Y S I S
Our project-probability-based DCF analysis suggests a one-year share price of $18. For our DCF analysis, we use a discount rate of 10%, slightly above Canadian Hydro Developers’ 9.5% due to its higher commodity exposure. In our opinion, the discount rate selected appropriately captures Boralex’s risk/reward profile and outlook. Unlike Canadian Hydro Developers, which targets a 65% debt financed project capital structure, Boralex uses a greater degree of leverage for its projects, typically in the 75% to 80% range, but its high commodity price exposure offsets its heavily debt-weighted capital structure.
In our DCF model, we give full credit to Boralex’s operating facilities and then probability weight development projects based on progress. Specifically, we assign a 25% probability to the on-time and on-budget completion of its two Quebec wind farms, which were recently awarded PPAs by Hydro-Quebec.
Our DCF analysis suggests Boralex is fairly valued at $18 per share one year out.

Alternative & Renewable Energy August 2008
90
Exhibit 2.28: NAV Calculation Suggests $17 per Share
Project Financing Unrisked Net AssetStatus Status Generation Value NAV NAV
(Risked) ($M) (diluted) (%) ($M) (diluted) (%)
Hydro Assets Green AttributesEast Angus 1 1 4 GWh/y @ $1.00M / GWh/y $3.8 $0.10 0.6% U.S. Production Tax Credit $11.5 $0.30 1.7%Huntingville 1 1 1 GWh/y @ $1.00M / GWh/y $1.0 $0.03 0.2% RECs (1.5x booked) $67.5 $1.74 10.2%La Rochette 1 1 2 GWh/y @ $1.00M / GWh/y $1.5 $0.04 0.2% CO2 Quota through 2012 $12.0 $0.31 1.8%Fourth Branch 1 1 14 GWh/y @ $1.00M / GWh/y $14.0 $0.36 2.1% Forward Capacity Premiums $12.1 $0.31 1.8%Middle Falls 1 1 10 GWh/y @ $1.00M / GWh/y $10.2 $0.26 1.5% $103.1 $2.66 15.6%NY State Dam 1 1 48 GWh/y @ $1.00M / GWh/y $48.4 $1.25 7.3%Sissonville 1 1 13 GWh/y @ $1.00M / GWh/y $13.3 $0.34 2.0% Working CapitalWarrensburg 1 1 11 GWh/y @ $1.00M / GWh/y $10.9 $0.28 1.7% Current Assets (Q2/08A) $128.9 $3.33 19.6%Ocean Falls 1 1 13 GWh/y @ $1.00M / GWh/y $13.0 $0.33 2.0% Current Liabilities (Q2/08A) ($53.3) ($1.38) -8.1%BC Prospects 6 4 39 GWh/y @ $0.00M / GWh/y $0.0 $0.00 0.0% $75.6 $1.95 11.5%
155 GWh/y $116.0 $3.00 17.6% LiabilitiesEst. Long-term debt post financing ($402.9) ($10.41) -61.1%
Wood-Residue Assets ($402.9) ($10.41) -61.1%Ashland 1 1 251 GWh/y @ $0.15M / GWh/y $37.7 $0.97 5.7%Chateaugay 1 1 133 GWh/y @ $0.15M / GWh/y $20.0 $0.52 3.0% Net Asset Value $659.12 $17.03 100%Fort Fairfield 1 1 237 GWh/y @ $0.15M / GWh/y $35.6 $0.92 5.4%Livermore Falls 1 1 220 GWh/y @ $0.15M / GWh/y $33.0 $0.85 5.0% Est. FD Shares O/S post any equity financing (M) 38.7Stacyville 1 1 125 GWh/y @ $0.15M / GWh/y $18.8 $0.48 2.8%Stratton 1 1 330 GWh/y @ $0.15M / GWh/y $49.5 $1.28 7.5%
1,296 GWh/y $194.4 $5.02 29.5% $17.03 1.00x 1.25x 1.50x 1.75x 2.00x€ 5 $16.21 $16.50 $16.79 $17.08 $17.38
Wind Assets € 10 $16.29 $16.58 $16.87 $17.16 $17.45Avignonet-Lauragais I 1 1 18 GWh/y @ $0.82M / GWh/y $15.1 $0.39 2.3% € 20 $16.45 $16.74 $17.03 $17.32 $17.61Avignonet-Lauragais II 1 1 12 GWh/y @ $0.82M / GWh/y $9.4 $0.24 1.4% € 30 $16.60 $16.89 $17.18 $17.47 $17.76Chepy 1 1 6 GWh/y @ $0.82M / GWh/y $4.9 $0.13 0.7% € 40 $16.76 $17.05 $17.34 $17.63 $17.92Nibas 1 1 21 GWh/y @ $0.82M / GWh/y $17.1 $0.44 2.6%Ally-Mercoeur 1 1 78 GWh/y @ $0.82M / GWh/y $64.0 $1.65 9.7%Cham de Cham Longe 1 1 60 GWh/y @ $0.82M / GWh/y $49.1 $1.27 7.5%Plouguin 1 1 22 GWh/y @ $0.82M / GWh/y $18.0 $0.47 2.7% $17.03 $0.6 $0.7 $0.8 $0.9 $1.0La Citadelle 1 1 33 GWh/y @ $0.82M / GWh/y $27.1 $0.70 4.1% $0.8 $13.37 $14.90 $16.43 $17.96 $19.48Seigneurie de Beaupre 3 3 429 GWh/y @ $0.41M / GWh/y $175.8 $4.54 26.7% $0.9 $13.67 $15.20 $16.73 $18.26 $19.78Gengrowth I 2 3 105 GWh/y @ $0.74M / GWh/y $77.6 $2.00 11.8% $1.0 $13.97 $15.50 $17.03 $18.56 $20.08Gengrowth II 4 3 131 GWh/y @ $0.21M / GWh/y $26.9 $0.70 4.1% $1.1 $14.27 $15.80 $17.33 $18.85 $20.38Gengrowth III 6 4 263 GWh/y @ $0.00M / GWh/y $0.0 $0.00 0.0% $1.2 $14.57 $16.10 $17.63 $19.15 $20.68
1,178 GWh/y $485.2 $12.53 73.6%
Cogen AssetsBlendecques 1 1 39 GWh/y @ $0.15M / GWh/y $5.8 $0.15 0.9% $17.03 70% 75% 80% 85% 90%
39 GWh/y $5.8 $0.15 0.9% $15.33 $17.73 $17.38 $17.03 $16.67 $16.32$16.33 $17.73 $17.38 $17.03 $16.67 $16.32
Investments $17.33 $17.73 $17.38 $17.03 $16.67 $16.32BPT Ownership 13.8M units @ $6.00 / unit $82.8 $2.14 12.6% $18.33 $17.73 $17.38 $17.03 $16.67 $16.32
Less: capital gains tax ($12.8) -$0.33 -1.9% $19.33 $17.73 $17.38 $17.03 $16.67 $16.32BPT Fees (net EBITDA) $1.25M @ 8.0x $10.0 $0.26 1.5%Solar (Spain) $2.0 $0.05 0.3%
$82.0 $2.12 12.4%1. We assume a stable capital structure of 80% debt & 20% equity.2. Project Probability Status: 1. Operating - 100%; 2. Construction - 90%; 3. Permitting & PPA - 50%; 4. Permitting or PPA - 25%; 5. Some Development - 10%; 6. Pipeline - 0%.3. Financing Status: (1) Full f inancing in place; (2) Debt draw n, equity required; (3) Equity in place, debt draw required; (4) Equity & debt draw required.
Multiple of Booked RECs
L/T
EUA
Pric
e
Capital Structure: Debt (%)
Avg
. Equ
ity
Issu
e Pr
ice
Wind Value ($M/GWh/y)
Hyd
ro V
alue
($
M/G
Wh/
y)
NAVPS NAVPS
Average equity issue price has no sensitivity impact for now as we believe that current development
projects do not require the issuance of new equity.
Source: Scotia Capital estimates.
N E T A S S E T V A L U E C A L C U L A T I O N
We calculate a NAV of $17/share. Given recent transactions and using rule-of-thumb metrics, we give credit of $0.82 million per GWh/y for wind capacity that is either operational or under construction with no construction risk. We probability-adjust these values lower for those projects that are less developed. For hydro assets, we give credit of $1 million per GWh/y for operational capacity.
Unlike our DCF valuation, which includes project-specific green attributes, we have separated the value of Boralex’s green attributes in our NAV calculation. We note that we give 1.5x value for Boralex’s US$45 million of RECs that have been sold forward, as we are fairly confident that a tight Connecticut REC market will re-emerge soon. While Connecticut’s renewable portfolio standard will increase to 20% by 2020, we do not know how much extra REC-qualified capacity will come online that could negatively impact this market. There is significant upside potential here, but we will wait to see how this unfolds. Additionally, we use our Power & Energy Infrastructure Trust analyst’s one-year Boralex Power Income Fund target price of $6.00 per unit to arrive at a $70 million net interest to Boralex, or slightly below $2 per Boralex share. Exhibit 2.28 details our NAV calculation.
Our NAV calculation suggests Boralex is fairly valued at $17 per share.
We believe there is significant upside potential to our NAV as we only give 1.5x booked RECs.

The Choice of a New Generation August 2008
91
Exhibit 2.30: $20 per Share Two-Year Target Implies 2011E EV/EBITDA Multiple of 9.1x
2011E EBITDA20 83628.038 88547.335 93466.631 $98,386 103305.22 108224.52 113143.82
7.10x $12.25 $13.25 $14.00 $15.00 $16.00 $16.75 $17.757.60x $13.50 $14.25 $15.25 $16.25 $17.25 $18.25 $19.258.10x $14.50 $15.50 $16.50 $17.50 $18.50 $19.50 $20.758.60x $15.50 $16.75 $17.75 $18.75 $20.00 $21.00 $22.009.10x $16.75 $17.75 $19.00 $20.00 $21.25 $22.50 $23.509.60x $17.75 $19.00 $20.25 $21.50 $22.50 $23.75 $25.00
10.10x $18.75 $20.00 $21.25 $22.75 $24.00 $25.25 $26.5010.60x $20.00 $21.25 $22.50 $24.00 $25.25 $26.50 $28.0011.10x $21.00 $22.25 $23.75 $25.25 $26.50 $28.00 $29.50
EV
/EBI
TDA
Mul
tiple
-15% -10% -5% Base +5% +10% +15%
Source: Scotia Capital estimates.
Exhibit 2.29: $18 per Share One-Year Target Implies 2010E EV/EBITDA Multiple of 9.25x
2010E EBITDA18 74744.4913 79141.23 83537.961 $87,935 92331.43041 96728.17 101124.9
7.25x $11.00 $11.75 $12.50 $13.50 $14.25 $15.00 $16.007.75x $12.00 $12.75 $13.75 $14.50 $15.50 $16.25 $17.258.25x $13.00 $13.75 $14.75 $15.75 $16.75 $17.50 $18.508.75x $13.75 $14.75 $15.75 $16.75 $17.75 $18.75 $19.759.25x $14.75 $16.00 $17.00 $18.00 $19.00 $20.00 $21.259.75x $15.75 $17.00 $18.00 $19.25 $20.25 $21.25 $22.50
10.25x $16.75 $18.00 $19.00 $20.25 $21.50 $22.50 $23.7510.75x $17.75 $19.00 $20.25 $21.50 $22.50 $23.75 $25.0011.25x $18.75 $20.00 $21.25 $22.50 $23.75 $25.00 $26.25
EV
/EB
ITDA
Mul
tiple
-15% -10% -5% Base +5% +10% +15%
Source: Scotia Capital estimates.
T A R G E T P R I C E , R A T I N G , A N D R I S K R A N K I N G
We have transferred coverage of Boralex with a 1-Sector Outperform rating. Our one-year share price target is $18. Our one-year target comprises outcomes of the following valuation approaches: (1) 75% DCF at a 10% discount rate; and (2) 25% NAV.
Our risk ranking for Boralex is High, similar to Canadian Hydro Developers. The company’s stated goal is to reach 1,000 MW of contracted capacity by 2012, or about triple what it currently has in place. We acknowledge that Boralex has a better track record than Canadian Hydro Developers with respect to commissioning projects on-time and within budget. However, Boralex is much more dependent on green attributes such as RECs where a monetary value is not guaranteed unless the certificates are sold forward.
E V / E B I T D A C H E C K
Our one-year target of $18 per share implies an EV/EBITDA multiple of 9.25x on 2010E EBITDA of $88 million. In our opinion, this multiple is reasonable due to (1) the significant growth Boralex aims to achieve over the next five years; (2) potential upside value in the Connecticut REC market, which we have not accounted for in our NAV calculation; and (3) strong seasonal, geographic, and fuel source diversification. Exhibit 2.29 provides a one-year price sensitivity analysis for changes in the EV/EBITDA multiple, as well as changes in 2010E EBITDA, while Exhibit 2.30 sensitizes our two-year target price.
Our one-year target price of $18 per share implies a forward EV/ 2010E EBITDA multiple of 9.25x

Alternative & Renewable Energy August 2008
92
Exhibit 2.31: 2009E Generation by Technology
Wind18%
Wood-Residue
73%
Cogen2%
Hydro7%
Source: Scotia Capital estimates.
Exhibit 2.32: 2009E Generation by Country
United States79%
France17%
Canada4%
Source: Scotia Capital estimates.
Financial Forecast E U R O P E A N A N D B . C . C A P A C I T Y G R O W T H U P S I D E P O T E N T I A L
We assume in our financial forecast that total power generation from current operating plants will remain flat indefinitely at 1,575.5 GWh/y. However, we do expect several production increases as a result of successful organic growth projects such as Seigneurie de Beaupre, and acquisitions such as Gengrowth. Our quarterly electricity production estimates do not include: (1) new wind power opportunities in France, Italy, or elsewhere; (2) solar power development in Spain or possibly Ontario; and (3) the awarding of any PPAs in the 2008 BC Hydro Clean Power Call, as well as the Ontario RES III Call. We will include these and other projects in our forecast as development progresses.
On a plant-by-plant basis, we have seasonally adjusted quarterly production to match the historical mean quarterly profiles. As we progress through a given quarter, we may adjust our production forecast up or down depending on material changes to various weather and climate related factors such as stronger-than-expected wind conditions or below-mean hydrology. Please refer to earlier Exhibits 2.7-2.10 for quarterly production forecasts by business segment through 2012.
While it is possible that Boralex may invest a minor amount of its annual capital expenditures toward increasing the availability at some of its facilities, we believe it is currently immaterial to explore further. Finally, we believe that Boralex's 14 MW French cogeneration plant will continue to be shut between April and October (inclusive) for the remainder of the plant’s contract life.
Exhibits 2.31 and 2.32 show our estimated 2009 electricity generation mix by technology and by country, respectively.
2 0 0 8 E T O T A L R E V E N U E U P 1 4 % Y E A R O V E R Y E A R
Our 14% year-over-year forecast revenue increase for 2008 is derived from electricity generation revenue of $149.9 million, robust REC sales at $34.9 million, and strong (non-REC) renewable incentives at $14.2 million. We expect management fees associated with Boralex Power Income Fund will remain flat at $5.6 million in 2008, while our forecast Boralex share in the Fund’s earnings is pegged at $8.8 million, a $2 million increase over 2007.
2 0 0 8 E E B I T D A P E G G E D A T $ 6 7 M I L L I O N
We expect 2008 operating costs to jump by $18.3 million year over year to $129.6 million, while we think 2008 administration costs will rise slightly to $13.4 million from $13 million last year. Our 2008 EBITDA estimate of $67 million represents a 15% increase year over year. While there are several factors associated with the jump in EBITDA, the primary reason is due to the increase in REC sales. On the surface, green attribute sales are generally considered cost-free, but for Boralex there are small but real additional capital and operating cost increases associated with keeping its wood-residue facilities REC-qualified.
We think that Boralex’s current installed capacity will generate over 1,500 GWh/y going forward.
We are looking for 2008E EBITDA of about $67 million.

The Choice of a New Generation August 2008
93
Exhibit 2.33: Forecast Revenue Through 2012
$109 $120 $163 $185 $194 $209 $222 $233
$90 $87
$105$114 $110 $112 $115 $117
2005 2006 2007 2008E 2009E 2010E 2011E 2012E
Revenue ($M) $/MWh
Source: Scotia Capital estimates.
Exhibit 2.34: Forecast EBITDA Through 2012
$35 $43 $59 $67 $78 $88 $98 $106
$29 $31
$38$41
$44$47
$51 $53
2005 2006 2007 2008E 2009E 2010E 2011E 2012E
EBITDA ($M) $/MWh
Source: Scotia Capital estimates.
U . S . P T C W O R T H A B O U T $ 1 1 . 5 M I L L I O N P E R Y E A R O F E B I T D A
If the U.S. Production Tax Credit (PTC) is not renewed, Boralex could face an $11 million to $12 million reduction in annual EBITDA generation. While the U.S. PTC may not be extended throughout the remainder of our forecast period, we have assumed for now that it will be renewed at its current pricing level.
O U R E U E T S E S T I M A T E O F € 2 0 / T O N N E C O 2 C O U L D B E T O O L O W , B U T W E D O N ’ T K N O W H O W T H I S M A R K E T W I L L P L A Y O U T
EU Allowances (EUA) currently trade at €22.50/tonne CO2 and should remain at least over €20/tonne CO2 for the remainder of Phase II of the EU ETS (2008 to 2012). The average EUA exchange-traded price for much of Phase I of the program (2005 to 2007) did not reflect a reasonable carbon cost to producers due to more allowances being distributed than actual emissions produced. We will keep our forecast price at €20/tonne CO2 until we are able to review the first full year of Phase II (i.e., early 2009). For Boralex, we estimate that about $1 million per year of EUA sales will be recorded in both 2008 and 2009.
C O N S T A N T C D P U F O R B O R A L E X P O W E R I N C O M E F U N D T H R O U G H 2 0 1 1
We believe that Boralex will maintain its 23% interest in BPT, for now. Our Power & Energy Infrastructure analyst currently forecasts a constant 70¢ annual CDPU through the end of 2009. In our financial forecast, we extend this through 2011.
2 0 0 8 E D I L U T E D E P S O F 5 1 ¢ T H A T J U M P S T O 7 3 ¢ I N 2 0 0 9 E
We estimate 2008E fully diluted EPS will drop by 15% year over year to 51¢, as $7.7 million of non-recurring gains and favourable tax adjustments were booked in 2007. On a recurring basis, we forecast a year-over-year EPS improvement due to a combination of increased REC sales and higher realized power prices.
We expect 2009E EPS to jump to 73¢, or more than 40% year over year due to: (1) almost a full year of power production, sales/earnings from the first 40 MW of Boralex’s Gengrowth wind farm; (2) proceeds from the federal government’s $10/MWh ecoENERGY incentive at Gengrowth (shared 50:50 with the Ontario Power Authority); (3) a US$0.6 million increase in Forward Capacity Premium payments; and (4) a higher year-over-year weighted average power price received.
We think total revenue per MWh will rise to $110 by 2009, up from $105/MWh in 2007.
Look for a 40%+ increase in 2009 EPS over 2008.

Alternative & Renewable Energy August 2008
94
Exhibit 2.35: Forward EBITDA and EPS Profile
$0.00
$0.10
$0.20
$0.30
$0.40
$0.50
$0.60
Q1-06 Q1-07 Q1-08 Q1-09E Q1-10E Q1-11E Q1-12E
Ear
ning
s pe
r S
hare
$0
$5,000
$10,000
$15,000
$20,000
$25,000
$30,000
$35,000
EB
ITD
A (0
00s)
Quarterly EBITDA
Quarterly EPS
Source: Scotia Capital estimates.
O T H E R K E Y A S S U M P T I O N S & R A T I O N A L E
New capacity. With the addition of new capacity, we do not speculate what specific day in a quarter new capacity will come online. Accordingly, and similar to the half-year CCA rule, we apply a 50% weight to generation produced from new capacity in its initial quarter.
Forward capacity market. ISO New England’s Forward Capacity Premium will increase from US$3.05/kW-Month to US$4.25/kW-Month by mid-2011, and to between US$5/kW-Month to US$6/kW-Month beyond mid-2011.
Project financing. Our financial forecast assumes that growth opportunities will be financed using Boralex’s targeted capital structure of 80% debt and 20% equity. Under its master credit agreement for its French wind farms, Boralex still has unused credit of about $275 million that may be used through 2010.
Foreign exchange. We use a par CAD/USD FX rate, as well as a $1.50 CAD/EUR FX rate.
Taxes. We forecast that Boralex’s French operations will not pay material cash taxes for seven to 12 years, and that its U.S. operations will not pay taxes for about five years. In the United States, Boralex still has approximately US$18 million of unused Production Tax Credits, as well as $20 million of unused tax losses. In Canada, distribution proceeds from the fund are approximately offset by head office expenses, which results in taxable income that is close to nil. For Boralex’s Canadian growth plans, we forecast no material cash taxes paid for seven to 12 years.
Most of Boralex’s operations will not pay cash taxes for at least five years.

The Choice of a New Generation August 2008
95
Exhibit 2.36: Sensitivity Analysis
Item Change Period Net Income Comp. Income
Interest Rates 5% Q1/08A $22,000 $2,098,000Electricity Prices 5% Q1/08A $371,000 $1,032,000C$ to both US$ & € $0.05 Q1/08A $368,000 $6,436,000
Item Change Period EBITDA
Deisel Fuel US$0.10/gallon 2008E $600,000CT Class I REC US$5/REC 2008E $3,200,000
2008E Estimated
Q1/08 Actual
Source: Company reports; Scotia Capital estimates
Free cash flow. We have not applied excess free cash flow on the balance sheet, for now, other than to finance those projects that we believe will be commissioned within our financial forecast. Cash on hand could be used to: (1) prepay outstanding principal balances on its debt; (2) implement (i) a regular dividend, (ii) a share buyback, and/or (iii) a one-time special dividend; (3) invest in other organic growth opportunities; and (4) enter into an acquisition, joint venture, or similar transaction.
Seasonality profile. We have used the unweighted average seasonality profiles of Boralex’s current hydro and wind facilities as the basis for our future capacity production forecasts.
• Our hydro production profile assumes the following seasonality: Q1 32%; Q2 31%; Q3 10%; and Q4 27%.
• Our wood-residue production profile assumes the following seasonality: Q1 27%; Q2 23%; Q3 25%; and Q4 25%.
• Our wind production profile is as follows: Q1 30%; Q2 20%; Q3 20%; and Q4 30%.
S E N S I T I V I T Y A N A L Y S I S
Exhibits 2.37 through 2.39 display our forecast financial statements for Boralex.
We have not applied any free cash flow on the balance sheet for now, other than to finance Boralex’s current Ontario and Quebec wind projects.
Rising diesel costs remain a concern for Boralex’s wood-residue operations.

Alternative &
Renew
able Energy A
ugust 2008
96 Exhibit 2.37: Boralex Inc. – Income Statement
2005 2006 2007 Q108 Q208 Q308E Q408E 2008E Q109E Q209E Q309E Q409E 2009E 2010E 2011E
Generation Revenue $100,596 $114,432 $138,216 $44,419 $32,649 $33,714 $39,121 $149,903 $43,919 $36,687 $36,812 $43,488 $160,906 $174,700 $187,697REC Revenue $8,100 $5,600 $24,600 $10,600 $7,800 $8,379 $8,167 $34,946 $8,882 $7,972 $8,457 $8,243 $33,555 $33,869 $34,186Incentives $11,039 $10,622 $9,918 $3,122 $2,409 $4,406 $4,277 $14,214 $4,666 $4,213 $4,617 $4,530 $18,026 $18,785 $19,737Operating Costs $87,851 $94,572 $111,281 $34,460 $29,310 $32,179 $33,621 $129,571 $36,092 $29,680 $32,298 $33,942 $132,012 $135,900 $139,732
$31,884 $36,024 $61,612 $23,681 $13,548 $14,320 $17,943 $69,492 $21,375 $19,192 $17,589 $22,318 $80,475 $91,455 $101,888
Share in Fund Earnings $8,873 $10,023 $6,830 $3,248 $1,790 $1,425 $2,300 $8,763 $3,375 $1,775 $1,425 $2,300 $8,875 $8,875 $8,875Fund Management Revenue $5,357 $5,457 $5,602 $1,341 $1,352 $1,463 $1,428 $5,584 $1,375 $1,386 $1,499 $1,464 $5,723 $5,866 $6,013CO2 Quota Revenue $1,000 $3,200 $300 $0 $0 $432 $132 $564 $0 $475 $475 $158 $1,109 $1,210 $1,304Other Revenue $1,563 $1,278 $2,001 $31 $395 $0 $0 $426 $0 $0 $0 $0 $0 $0 $0
$48,677 $56,010 $76,186 $28,301 $17,085 $17,640 $21,803 $84,829 $26,125 $22,828 $20,988 $26,240 $96,182 $107,405 $118,080ExpensesManagement & Operation of the Fund $4,054 $4,249 $4,510 $938 $1,039 $1,039 $1,039 $4,055 $1,064 $1,064 $1,064 $1,064 $4,258 $4,471 $4,694Administration Costs $9,539 $9,237 $13,038 $2,998 $3,399 $3,500 $3,500 $13,397 $3,500 $3,500 $3,500 $3,500 $14,000 $15,000 $15,000
$13,593 $13,486 $17,548 $3,936 $4,438 $4,539 $4,539 $17,452 $4,564 $4,564 $4,564 $4,564 $18,258 $19,471 $19,694
EBITDA $35,084 $42,524 $58,638 $24,365 $12,647 $13,101 $17,264 $67,377 $21,561 $18,263 $16,424 $21,676 $77,924 $87,935 $98,386
Amortization $10,515 $20,880 $23,118 $5,828 $6,015 $6,000 $6,000 $23,843 $6,000 $6,750 $6,750 $6,750 $26,250 $28,875 $30,750Financing Costs $4,421 $12,528 $11,886 $3,465 $2,991 $2,698 $2,723 $11,877 $2,452 $3,393 $3,368 $3,359 $12,572 $16,782 $20,485Financial Instruments $319 $785 $0 $0 $1,104 $0 $0 $0 $0 $0 $0 $0Unusual Items $522 $0 ($5,875) $0 $56 $0 $0 $56 $0 $0 $0 $0 $0 $0 $0
$15,458 $33,408 $29,129 $9,612 $9,847 $8,698 $8,723 $36,880 $8,452 $10,143 $10,118 $10,109 $38,822 $45,657 $51,235
Earnings from Continuing Operations before Taxes $19,626 $9,116 $29,509 $14,753 $2,800 $4,403 $8,541 $30,497 $13,109 $8,121 $6,306 $11,567 $39,102 $42,278 $47,151
Current Income Tax Expense ($2,646) ($563) $109 $2 $0 $0 $0 $2 $0 $0 $0 $0 $0 $0 $0Future Income Tax Expense $86 ($5,100) $8,348 $5,436 $1,642 $1,233 $2,392 $10,702 $3,670 $2,274 $1,766 $3,239 $10,949 $11,838 $13,202
$22,186 $14,890 $21,052 $9,315 $1,158 $3,170 $6,150 $19,793 $9,438 $5,847 $4,540 $8,328 $28,154 $30,440 $33,949Non-Controlling Interests ($98) ($168) $70 ($94) ($23) $0 $0 ($117) $0 $0 $0 $0 $0 $0 $0Earnings from Continuing Operations $22,088 $14,722 $21,122 $9,221 $1,135 $3,170 $6,150 $19,676 $9,438 $5,847 $4,540 $8,328 $28,154 $30,440 $33,949Loss from Discontinued Operations $0 $0 $0 $0 $0 $0 $0 $0 $0 $0 $0 $0 $0 $0 $0Net Earnings $22,088 $14,722 $21,122 $9,221 $1,135 $3,170 $6,150 $19,676 $9,438 $5,847 $4,540 $8,328 $28,154 $30,440 $33,949
Basic shares - opening 29,986.7 29,989.4 30,049.6 37,454.6 37,784.4 37,836.1 37,836.1 37,454.6 37,836.1 37,836.1 37,836.1 37,836.1 37,836.1 37,836.1 37,836.1Plus: Equity issued 2.7 60.2 7,405.0 329.8 0.0 0.0 0.0 329.8 0.0 0.0 0.0 0.0 0.0 0.0 0.0
Less: Share buyback 0.0 0.0 0.0 0.0 0.0 0.0 0.0 0.0 0.0 0.0 0.0 0.0 0.0 0.0 0.0Basic shares - closing 29,989.4 30,049.6 37,454.6 37,784.4 37,836.1 37,836.1 37,836.1 37,836.1 37,836.1 37,836.1 37,836.1 37,836.1 37,836.1 37,836.1 37,836.1Average Shares O/S - Basic (000s) 29,987.0 30,033.7 34,374.3 37,557.0 37,818.5 37,836.1 37,836.1 37,761.9 37,836.1 37,836.1 37,836.1 37,836.1 37,836.1 37,836.1 37,836.1Average Dilution (000s) 253.6 404.6 658.9 926.4 517.8 517.8 517.8 619.9 517.8 517.8 517.8 517.8 517.8 517.8 517.8Average Shares O/S - Diluted (000s) 30,240.6 30,438.3 35,033.2 38,307.0 38,336.3 38,353.9 38,353.9 38,337.8 38,353.9 38,353.9 38,353.9 38,353.9 38,353.9 38,353.9 38,353.9
EPS (Basic) $0.74 $0.49 $0.61 $0.25 $0.03 $0.08 $0.16 $0.52 $0.25 $0.15 $0.12 $0.22 $0.74 $0.80 $0.90EPS (Diluted) $0.73 $0.48 $0.60 $0.24 $0.03 $0.08 $0.16 $0.51 $0.25 $0.15 $0.12 $0.22 $0.73 $0.79 $0.89
Source: Company reports; Scotia Capital estimates.

97
The Choice of a N
ew G
eneration A
ugust 2008
Exhibit 2.38: Boralex Inc. – Balance Sheet
2005 2006 2007 Q108 Q208 Q308E Q408E 2008E Q109E Q209E Q309E Q409E 2009E 2010E 2011E
AssetsCurrent Assets
Cash and cash equivalents $10,615 $13,899 $79,195 $70,495 $77,903 $73,938 $73,288 $73,288 $78,229 $80,663 $81,566 $86,888 $86,888 $13,845 $52,335A/R $26,006 $26,964 $39,200 $45,089 $40,083 $40,083 $40,083 $40,083 $40,083 $40,083 $40,083 $40,083 $40,083 $40,083 $40,083Inventory $5,232 $5,342 $8,002 $6,582 $6,944 $6,944 $6,944 $6,944 $6,944 $6,944 $6,944 $6,944 $6,944 $6,944 $6,944Future Income Taxes $0 $0 $2,394 $1,437 $1,279 $1,279 $1,279 $1,279 $1,279 $1,279 $1,279 $1,279 $1,279 $1,279 $1,279Prepaids $1,955 $2,776 $2,171 $2,824 $2,699 $2,699 $2,699 $2,699 $2,699 $2,699 $2,699 $2,699 $2,699 $2,699 $2,699
$43,808 $48,981 $130,962 $126,427 $128,908 $124,943 $124,293 $124,293 $129,234 $131,668 $132,571 $137,893 $137,893 $64,850 $103,340
Investment $77,997 $75,553 $67,321 $68,292 $67,250 $66,266 $66,156 $66,156 $67,122 $66,487 $65,503 $65,394 $65,394 $64,631 $63,868Property, plant and equipment $262,460 $280,136 $258,712 $281,086 $282,414 $301,633 $320,852 $320,852 $331,444 $341,287 $351,129 $360,972 $360,972 $876,891 $867,014Electricity sales contracts $16,814 $20,631 $18,527 $20,365 $19,741 $19,741 $19,741 $19,741 $19,741 $19,741 $19,741 $19,741 $19,741 $19,741 $19,741Future Income Taxes $7,979 $6,249 $0 $0 $0 $0 $0 $0 $0 $0 $0 $0 $0 $0 $0Other Assets $20,457 $44,480 $39,209 $56,416 $60,088 $60,088 $60,088 $60,088 $60,088 $60,088 $60,088 $60,088 $60,088 $60,088 $60,088Total Assets $429,515 $476,030 $514,731 $552,586 $558,401 $572,670 $591,129 $591,129 $607,629 $619,271 $629,032 $644,087 $644,087 $1,086,201 $1,114,051
LiabilitiesCurrent Liabilities
Bank loans and advances $1,215 $0 $0 $0 $0 $0 $0 $0 $0 $0 $0 $0 $0 $0 $0A/P and accrued liabilities $28,608 $20,005 $20,869 $19,324 $25,268 $25,268 $25,268 $25,268 $25,268 $25,268 $25,268 $25,268 $25,268 $25,268 $25,268Income taxes $2,787 $1,786 $1,481 $1,769 $915 $915 $915 $915 $915 $915 $915 $915 $915 $915 $915Current portion of long-term debt $37,802 $41,835 $26,786 $27,573 $27,142 $36,000 $36,000 $36,000 $36,000 $36,000 $36,000 $36,000 $36,000 $36,000 $36,000
$70,412 $63,626 $49,136 $48,666 $53,325 $62,183 $62,183 $62,183 $62,183 $62,183 $62,183 $62,183 $62,183 $62,183 $62,183
Long-Term Debt $164,832 $192,493 $148,747 $160,143 $156,942 $159,259 $170,434 $170,434 $174,708 $178,982 $183,256 $187,530 $187,530 $587,365 $568,064Future Income taxes $28,026 $20,780 $23,430 $28,759 $24,265 $25,498 $27,890 $27,890 $31,560 $33,834 $35,600 $38,838 $38,838 $50,676 $63,879Deferred Revenue $0 $16,368 $6,642 $6,253 $5,804 $4,495 $3,238 $3,238 $2,355 $1,602 $784 ($2) ($2) ($2) ($2)Fair value of derivatives $0 $0 $1,400 $3,130 $22,694 $22,694 $22,694 $22,694 $22,694 $22,694 $22,694 $22,694 $22,694 $22,694 $22,694Non-controlling interest $1,034 $730 $607 $714 $737 $737 $737 $737 $737 $737 $737 $737 $737 $737 $737
Total Liabilities $264,304 $293,997 $229,962 $247,665 $263,767 $274,866 $287,176 $287,176 $294,237 $300,032 $305,253 $311,980 $311,980 $723,653 $717,554
Shareholders' EquityCapital Stock + Contributed Surplus $111,686 $112,451 $223,531 $225,255 $225,746 $225,746 $225,746 $225,746 $225,746 $225,746 $225,746 $225,746 $225,746 $225,746 $225,746Retained Earnings $84,188 $97,649 $115,669 $124,890 $126,025 $129,195 $135,345 $135,345 $144,783 $150,630 $155,170 $163,498 $163,498 $193,938 $227,887Acc. other comp. income ($30,663) ($28,067) ($54,431) ($45,224) ($57,137) ($57,137) ($57,137) ($57,137) ($57,137) ($57,137) ($57,137) ($57,137) ($57,137) ($57,137) ($57,137)
Total Shareholders Equity $165,211 $182,033 $284,769 $304,921 $294,634 $297,804 $303,954 $303,954 $313,392 $319,239 $323,779 $332,107 $332,107 $362,547 $396,496
Total Liabilities and Shareholders Equity $429,515 $476,030 $514,731 $552,586 $558,401 $572,670 $591,129 $591,129 $607,629 $619,271 $629,032 $644,087 $644,087 $1,086,201 $1,114,051
Source: Company reports; Scotia Capital estimates.

Alternative &
Renew
able Energy A
ugust 2008
98 Exhibit 2.39: Boralex Inc. – Statement of Cash Flows
2005 2006 2007 Q108 Q208 Q308E Q408E 2008E Q109E Q209E Q309E Q409E 2009E 2010E 2011E
Operating ActivitiesEarnings from continuing operations $21,088 $14,721 $21,545 $9,221 $1,135 $3,170 $6,150 $19,676 $9,438 $5,847 $4,540 $8,328 $28,154 $30,440 $33,949Distributions received from the Fund $12,391 $12,392 $12,391 $3,098 $2,409 $2,409 $2,409 $10,326 $2,409 $2,409 $2,409 $2,409 $9,638 $9,638 $9,638Items not affecting cash:
Share in earnings of the Fund ($8,873) ($10,023) ($6,830) ($3,248) ($1,790) ($1,425) ($2,300) ($8,763) ($3,375) ($1,775) ($1,425) ($2,300) ($8,875) ($8,875) ($8,875)Amortization $10,515 $20,880 $22,615 $5,828 $6,015 $6,000 $6,000 $23,843 $6,000 $6,750 $6,750 $6,750 $26,250 $28,875 $30,750Amortization of deferred financing costs $477 $475 $1,807 $708 $724 $500 $500 $2,432 $500 $500 $500 $500 $2,000 $2,000 $2,000Future income taxes $86 ($5,100) $8,348 $5,436 $530 $1,233 $2,392 $9,590 $3,670 $2,274 $1,766 $3,239 $10,949 $11,838 $13,202U.S Production Tax Credit ($11,039) ($9,870) ($4,460) ($1,093) ($395) ($1,309) ($1,257) ($4,054) ($883) ($753) ($818) ($786) ($3,240) $0 $0Unusual items $522 $0 ($5,875) $319 $0 $0 $0 $319 $0 $0 $0 $0 $0 $0 $0Other (incl. change in FV of energy swaps from 2005) $1,052 $744 $2,007 $479 $789 $0 $0 $1,268 $0 $0 $0 $0 $0 $0 $0
Cash flow from operations $26,219 $24,219 $51,548 $20,748 $9,417 $10,578 $13,894 $54,637 $17,760 $15,252 $13,722 $18,140 $64,875 $73,916 $80,664Net change in non-cash working capital balances ($6,907) ($10,713) ($16,491) ($5,542) $9,140 $0 $0 $3,598 $0 $0 $0 $0 $0 $0 $0
$19,312 $13,506 $35,057 $15,206 $18,557 $10,578 $13,894 $58,235 $17,760 $15,252 $13,722 $18,140 $64,875 $73,916 $80,664
Investing ActivitiesBusiness acquisitions ($18,642) ($6,749) $0 $0 $0 $0 $0 $0 $0 $0 $0 $0 $0 $0 $0Purchases of property, plant and equipment ($135,753) ($19,201) ($21,859) ($3,997) ($9,231) ($25,219) ($25,219) ($63,666) ($16,593) ($16,593) ($16,593) ($16,593) ($66,370) ($544,794) ($20,873)Proceeds on disposal of property, plant and equipment $400 $0 $0 $0 $0 $0 $0 $0 $0 $0 $0 $0 $0 $0 $0Change in restricted funds held for for the debt service $0 $0 $6,237 $0 ($25) $0 $0 ($25) $0 $0 $0 $0 $0 $0 $0Reimbursement from lease financings $0 $0 $0 $0 $0 $0 $0 $0 $0 $0 $0 $0 $0 $0 $0Development projects (and "Other") ($3,034) ($7,798) ($7,506) ($14,736) ($2,703) $0 $0 ($17,439) $0 $0 $0 $0 $0 $0 $0
($157,029) ($33,748) ($23,128) ($18,733) ($11,959) ($25,219) ($25,219) ($81,130) ($16,593) ($16,593) ($16,593) ($16,593) ($66,370) ($544,794) ($20,873)
Financing ActivitiesBank loans and advances $19,637 ($1,215) $0 $0 $0 $0 $0 $0 $0 $0 $0 $0 $0 $0 $0Increase in long-term debt $136,108 $69,629 $151,437 $0 $0 $20,175 $20,175 $40,350 $13,274 $13,274 $13,274 $13,274 $53,096 $435,835 $16,699Payments of long-term debt ($9,075) ($56,487) ($198,454) ($9,000) ($1,194) ($9,000) ($9,000) ($28,194) ($9,000) ($9,000) ($9,000) ($9,000) ($36,000) ($36,000) ($36,000)Financing Costs ($2,547) ($1,167) ($2,011) $0 ($151) ($500) ($500) ($1,151) ($500) ($500) ($500) ($500) ($2,000) ($2,000) ($2,000)Net proceeds on issuance of shares (buyback) $12 $273 $105,307 $1,466 $238 $0 $0 $1,704 $0 $0 $0 $0 $0 $0 $0Monetization program, net of related expenses $0 $10,935 ($593) $0 $0 $0 $0 $0 $0 $0 $0 $0 $0 $0 $0Other ($72) $0 ($50) $0 $4 $0 $0 $4 $0 $0 $0 $0 $0 $0 $0
$144,063 $21,968 $55,636 ($7,534) ($1,103) $10,675 $10,675 $12,713 $3,774 $3,774 $3,774 $3,774 $15,096 $397,835 ($21,301)
Translation adjustments on cash and cash equivalents ($1,173) $1,259 ($2,269) $2,361 $1,913 $0 $0 $4,274 $0 $0 $0 $0 $0 $0 $0
Net change in cash and cash equivalents from continuing ops $5,173 $2,985 $65,296 ($8,700) $7,408 ($3,966) ($650) ($5,907) $4,942 $2,434 $904 $5,322 $13,601 ($73,043) $38,489Net change in cash and cash equivalents from discontinued ops $0 $0 $0 $0 $0 $0 $0 $0 $0 $0 $0 $0 $0 $0 $0Net change in cash and cash equivalents $5,173 $2,985 $65,296 ($8,700) $7,408 ($3,966) ($650) ($5,907) $4,942 $2,434 $904 $5,322 $13,601 ($73,043) $38,489
Cash and cash equivalents - beginning of period $5,442 $10,615 $13,899 $79,195 $70,495 $77,903 $73,938 $79,195 $73,288 $78,229 $80,663 $81,566 $73,288 $86,888 $13,845Cash and cash equivalents - end of period $10,615 $13,600 $79,195 $70,495 $77,903 $73,938 $73,288 $73,288 $78,229 $80,663 $81,566 $86,888 $86,888 $13,845 $52,335
Source: Company reports; Scotia Capital estimates.

The Choice of a New Generation August 2008
99
Exhibit 2.40: Management & Directors
Patrick Lemaire President and CEO 97,496
Mr. Lemaire has been CEO of Boralex since September 2006 and a member of the board since June 2006. He is a member of the Environment, Health and Safety Committee. He was previously Vice-President and COO of Containerboard of Norampac Inc.
Jean-François Thibodeau
Vice-President and CFO 129,324 Mr. Thibodeau has been in his current position since October 6, 2003. Previously, Mr. Thibodeau was Vice-President and Treasurer of CAE Inc., since November 2001.
Sylvain AirdGeneral Counsel and Corporate Secretary
16,425 Mr. Aird has been in his current position since September 13, 2004. Previously, Mr. Aird was legal counsel for Abitibi-Consolidated Inc. from October 1996 to March 2004.
Bernard Lemaire Board Chair 651,641
Mr. Lemaire has been Executive Chairman since 1995, was CEO from 2003 to September 2006 and is currently a member of the Administrative Committee. He has been a director of Cascades Inc. since 1964 and acts as chairman.
Germain Benoit Director 70,000 Mr. Benoit is President of Capital Benoit Inc. He has been a director of Boralex since 1995 and is a member of the Audit Committee and Corporate Governance Committee.
Allan Hogg Director 1,650 Mr. Hogg is Director, Finance and Treasurer of Cascades Inc. He has been a member of Boralex since 1996 and is a member of the Administrative Committee.
Edward H. Kernaghan
Director 5,235,400
Mr. Kernaghan is President of Principia Research Inc. and Executive Vice-President of Kernaghan Securities Inc. and Kernwood Ltd. He has been a director of Boralex since June 2006 and is a member of the Corporate Governance Committee.
Richard Lemaire Director - Mr. Lemaire is President of Séchoirs Kingsey Falls Inc. He has been a director of Boralex since 1997 and is a member of the Environment, Health and Safety Committee.
Yves Rheault Director 44,291
Mr. Rheault is a consultant and corporate director. Until October 2002, he was Vice-President, Business Development of Boralex. He has been a member of the Board since 1997 and is a member of the Nominating and Compensation Committee.
Michelle Samson-Doel
Director 39,000
Ms. Samson-Doel is President of Groupe Samson-Doel Ltée and a corporate director. She has been a member of Boralex since 2005 and is a member of the Audit Committee and the Nominating and Compensation Committee.
Pierre Seccareccia Director 7,600 Mr. Seccareccia has been a director of Boralex since 2003 and is a member of the Audit Committee, the Corporate Governance Committee, and the Nominating and Compensation Committee.
Gilles Shooner Director 6,774 Mr. Shooner has been a director of Boralex since 1996 and is a member of the Environment, Health and Safety Committee.
Other 258,072
Total 6,557,673
Fully Diluted Shares Outstanding 38,844,037
% Insider Ownership (ex. Cascades Inc.) 16.9%
FD Shares Controlled Directly or Indirectly BackgroundPositionName
Source: Company reports; SEDI; Scotia Capital.
Management & Directors Boralex’s management strength runs deep. Bernard Lemaire is the founder, visionary, and Executive Chairman of the board of Boralex. Mr. Lemaire’s son, Patrick, joined Boralex in 2006 as President and CEO. Mr. Jean-Francois Thibodeau, Boralex’s CFO since 2003, brings strong financial management experience to the team, having served as VP & Treasurer at CAE Inc. and as Treasurer for Transcontinental Group Ltd. In Exhibit 2.40, we present brief backgrounds of key management and directors of the corporation. In total, insiders and related entities control about 16.9% of Boralex’s fully diluted outstanding shares. Cascades Inc. owns slightly over 34%.

Alternative & Renewable Energy August 2008
100
Exhibit 2.41: Boralex’s Corporate Structure
Boralex Inc.
Canada FranceUnited States
Boralex Power Inc. (Can)
Boralex US Holdings Inc. (Del)
Boralex US Industries Inc.
Boralex S.A.S.
BoralexBlendecques
S.A.S.
Boralex Massif Central S.A.S.
BoralexBiomass
Holdings GP LLC (Del)
Third-partyinvestor
Boralex NVHydro LLC
(Del)
BoralexBiomass
Holdings LP (Del)
Wood-ResidueThermal Power
Stations
HydroelectricStations
100% 100% 100%
100%4.115%LP
0.005%GP
95.885%LP
Source: Boralex.
Boralex’s Corporate Structure

The Choice of a New Generation August 2008
101
Canadian Hydro Developers Inc. (KHD-T)
Aug 15, 2008: $4.38 1-Yr Target: $7.00 Capitalization Rating: 1-Sector Outperform 1-Yr ROR: 59.8% Shares O/S (M) 143.5 Risk: High 2-Yr Target: $7.50 Total Value ($M) 628.5 IBES EPS 2008E $0.08 2-Yr ROR: 71.2% Float O/S (M) 107.9 IBES EPS 2009E $0.23 Float Value ($M) 472.5 Div. (Curr.): $0.00 TSX Weight 0.04% Yield: 0.0%
Valuation: 75% DCF @ 9.5%; 25% NAV
Qtly EPS (FD) (Next Release: Nov-08)
Y/E DECEMBER-31 Mar Jun Sep Dec Year P/E 2007A $0.01A $0.01A $0.00A $0.04A $0.06 102.2x 2008E $0.01A $0.02A $0.00 $0.04 $0.08 54.6x 2009E $0.05 $0.02 $0.00 $0.12 $0.19 23.4x 2010E $0.07 $0.05 $0.01 $0.12 $0.25 17.3x Industry Specific 2006A 2007A 2008 2009 2010 Production (GWh) 707 922 1,122 1,836 2,276
Note: Historical price multiple calculations use FYE price. Source: Reuters; company reports; Scotia Capital estimates.
The Best Bang for Your Renewable Buck I N V E S T M E N T H I G H L I G H T S
• Strong management track record. With 19 years of experience under its belt, Canadian Hydro Developers (KHD) management has successfully executed on the development or acquisition of numerous projects within its portfolio.
• Production and EBITDA set to soar. We anticipate the commissioning of over 400 MW (2.1x current capacity) of mostly contracted wind capacity over the next several years, which we believe will result in a 2011 EBITDA increase of about 300% over 2007.
• Execution hiccups present an opportunity. A few permitting holdups have forced the delay of several KHD projects, resulting in slight cost overruns. However, KHD’s current share price reflects too much of an execution risk discount and, therefore, we believe the company is undervalued.
• Stock catalysts over the coming 12 to 18 months are plentiful. We expect to see near perfect execution on the commissioning of several new KHD facilities in 2008 and 2009. We look for KHD to bid up to 55 MW in the 2008 BC Hydro Clean Power Call and up to 70 MW in the Ontario RES III Request for Proposals (RFP). Dunvegan could be approved by Q1/09.
• Relative valuation attractive. KHD is currently trading at 9.9x EV/2009E EBITDA and 7.6x EV/2010E EBITDA, quite low in our opinion. Our target EV/EBITDA multiple is 10.25x on 2010E EBITDA, which drops to 10.1x on 2011E. We think these multiples are justified by the high growth we expect KHD to realize over the coming years. KHD is also trading at 0.6x our NAV, relative to our group average of 0.8x.
• We have transferred coverage of the common shares of Canadian Hydro Developers, maintaining a 1-Sector Outperform rating and a one-year target price of $7.00 per share. Our valuation is based on a 75%-weighted discounted cash flow approach, using a 9.5% discount rate, and a 25% net asset value calculation.

Alternative & Renewable Energy August 2008
102
Exhibit 3.1: Canadian Hydro Developers Inc. – Relative Valuation Metrics
Last SC 1-Year 1-Year MarketCompany Ticker Price Rating Target ROR DCF NAV Cap 2008E 2009E 2010E
8/15/2008 ($M) (x) (x) (x)
Boralex BLX $14.80 1-SO $18.00 22% $18.33 $17.03 $560 9.9x 8.6x 7.6xCanadian Hydro Developers KHD $4.38 1-SO $7.00 60% $7.04 $6.95 $628 20.3x 9.9x 7.6xEarthfirst Canada EF $0.27 3-SU $0.40 48% $0.35 $0.60 $28 n.m. -5.5x -0.9xInnergex Renew able Energy INE $8.25 3-SU $9.50 15% $9.44 $9.55 $194 n.m. 18.4x 7.8xPlutonic Pow er PCC $7.04 2-SP $9.00 28% $9.03 $8.75 $297 n.m. n.m. n.m.Average 35% $341 15.1x 7.8x 5.5x
Company Ticker Beta 2008E 2009E 2010E 2008E 2009E 2010E 2008E 2009E 2010E(x) (x) (x) (x) (x) (x) (x) (x) (x)
Boralex BLX 0.7 28.8x 20.2x 18.6x 2.6x 2.5x 2.3x 10.4x 8.7x 7.7xCanadian Hydro Developers KHD 0.5 54.6x 23.4x 17.3x 7.2x 3.9x 3.1x 16.0x 9.0x 6.6xEarthfirst Canada EF - n.m. n.m. n.m. n.m. 5.5x 0.9x n.m. n.m. 5.6xInnergex Renew able Energy INE - n.m. n.m. 25.5x 27.5x 8.3x 4.2x n.m. 33.6x 10.2xPlutonic Pow er PCC 0.9 n.m. n.m. n.m. n.m. n.m. n.m. n.m. n.m. n.m.Average 0.7 41.7x 21.8x 20.5x 12.4x 5.1x 2.6x 13.2x 17.1x 7.5x
Price to Earnings Price to Sales Price to Cash Flow
Enterprise Value to EBITDA
Source: Bloomberg; Scotia Capital estimates.
Summary & Investment Recommendation Canadian Hydro Developers’ 364 MW of operating assets are well diversified, both regionally and by renewable technology. Its installed capacity is spread among B.C., Alberta, Ontario, and Quebec, and we believe that Manitoba could be added to its portfolio within the next several years. In the short to mid-term, we see over 400 MW of new capacity coming online, which KHD will need to execute near seamlessly. To further spread its wings, KHD may pierce the solar market, after having recently entered into a no-risk/no-cost 10 MW Ontario Standard Offer Contract. Lastly, we think a final decision on KHD’s 100 MW Dunvegan hydro project in Alberta could come down before the year is out. If commissioned on-time and within budget, this project could add up to $1.50 per share to KHD’s stock price.
We have transferred coverage of the common shares of KHD, maintaining a 1-Sector Outperform rating and a one-year target price of $7.00 per share. Our valuation is based on a 75%-weighted discounted cash flow approach, using a 9.5% discount rate, and a 25% net asset value calculation.
F I N A N C I A L O U T L O O K
We estimate 2008 EPS at 8¢, in line with consensus. Looking into 2009, we think EPS will grow to 19¢. We forecast $54.7 million of EBITDA in 2008, which grows to $112.3 million in 2009 and to $146.5 million by 2010. Our financial forecast is predicated on the following capacity being commissioned: Melancthon II (Q4/08), Wolfe Island (Q2/09), Island Falls (Q4/09), and several B.C. run-of-river projects (Q4/09). On a per MWh basis, we think EBITDA will grow from $41/MWh in 2007 to $61/MWh in 2009, and to $66/MWh by 2011.
R E L A T I V E V A L U A T I O N
KHD is currently trading at 9.9x EV/2009E EBITDA and 7.6x EV/2010E EBITDA, quite low in our opinion (Exhibit 3.1). Our target EV/EBITDA multiple is 10.25x on 2010E EBITDA, which drops to 10.1x on 2011E. We think these multiples are justified by the high growth we expect KHD to realize over the coming years. KHD is also trading at 0.6x our NAV, relative to our group average of 0.8x.

The Choice of a New Generation August 2008
103
Exhibit 3.2: Canadian Hydro Developers Inc. – Stock Performance
$4.00
$5.00
$6.00
$7.00
$8.00
$9.00
$10.00
Dec-07 Feb-08 Apr-08 Jun-08
Pric
e
0
500
1,000
1,500
2,000
2,500
3,000
3,500
4,000
Dai
ly V
olum
e (0
00s)
KHD (Volume) KHD (Price) STUTIL (rebased) SPTSX (rebased)
$628.5M
KHD$4.38
$8.01$4.05
143.5M
Ticker:Last Price:Market Cap:52 Wk High:52 Wk Low :Shares O/S:
Source: Bloomberg; Scotia Capital.
Capital Markets Profile Canadian Hydro Developers is a developer, builder, and operator of Canadian renewable power facilities. The company currently operates 20 power generation facilities with a net ownership capacity of 364 MW, broken down as 12 hydroelectric generating stations (net 86 MW), seven wind (253 MW), and one biomass plant (25 MW). Over 75% of its generated electricity is sold under long-term power contracts to investment-grade counterparties, with the remainder sold on the Alberta spot market. KHD is constructing two wind farms in Ontario that are due online in Q4/08 (Melancthon II – 132 MW) and in Q1/09 (Wolfe Island 197.8 MW). It also intends to commence construction shortly of another 150+ MW of fully contracted wind and hydro facilities in B.C., Ontario, and Quebec. Additionally, the company has over 1,600 MW of undeveloped renewable power prospects, including its 100 MW Dunvegan hydro project in Alberta.
In mid-1989, and two years after incorporating as Oilco Resources Ltd., the company acquired a private firm that was developing a hydroelectric opportunity. Following the acquisition and amalgamation of the private firm, KHD changed its strategy to focus solely on renewable power development, and as a result, Canadian Hydro Developers Inc. was born. With over 35 years of combined Canadian renewable power experience, the founding Keating brothers, John (CEO) and Ross (President), are backed by Kent Brown (EVP & CFO) who has been with KHD for seven years, Ann Hughes (Corporate Secretary) who joined KHD in the mid-1990s, and Keith O’Regan, KHD’s new COO. Executive management is well supported by the company’s board of directors, which includes former Alberta premier Ralph Klein.
With a market capitalization of over $600 million, Canadian Hydro Developers’ shares trade on the Toronto Stock Exchange under the symbol KHD-T; they also trade on the Berlin Stock Exchange. Insiders control about 5% of outstanding KHD shares, and the company’s shareholder base is regionally split 40% Canada, 40% Europe, and 20% United States. KHD reports in Canadian dollars, using a December 31 year-end, and its financial statements are prepared in accordance with GAAP. Exhibit 3.2 shows KHD’s recent share price performance.
KHD operates 20 facilities with a net ownership capacity of 364 MW.
Over 75% of its generated electricity is sold under long-term power contracts to investment-grade counterparties.

Alternative & Renewable Energy August 2008
104
Exhibit 3.4: KHD Could Require $200M of Equity for Dunvegan and 125 MW of Projects Soon to Be Bid
263 1.75 2.00 2.25 2.50 2.75 3.00 3.25 3.500 $0M $0M $0M $0M $0M $0M $0M $0M
25 $15M $18M $20M $22M $24M $26M $28M $31M50 $31M $35M $39M $44M $48M $53M $57M $61M
Hydro in British Columbia 55 $34M $39M $43M $48M $53M $58M $63M $67MWind in Ontario 70 $43M $49M $55M $61M $67M $74M $80M $86M
75 $46M $53M $59M $66M $72M $79M $85M $92MDunvegan 100 $61M $70M $79M $88M $96M $105M $114M $123M
125 $77M $88M $98M $109M $120M $131M $142M $153M150 $92M $105M $118M $131M $144M $158M $171M $184M175 $107M $123M $138M $153M $168M $184M $199M $214M200 $123M $140M $158M $175M $193M $210M $228M $245M
All of the above 225 $138M $158M $177M $197M $217M $236M $256M $276M250 $153M $175M $197M $219M $241M $263M $284M $306M275 $168M $193M $217M $241M $265M $289M $313M $337M300 $184M $210M $236M $263M $289M $315M $341M $368M325 $199M $228M $256M $284M $313M $341M $370M $398M350 $214M $245M $276M $306M $337M $368M $398M $429M375 $230M $263M $295M $328M $361M $394M $427M $459M400 $245M $280M $315M $350M $385M $420M $455M $490M425 $260M $298M $335M $372M $409M $446M $483M $521M450 $276M $315M $354M $394M $433M $473M $512M $551M475 $291M $333M $374M $416M $457M $499M $540M $582M500 $306M $350M $394M $438M $481M $525M $569M $613M
New
Inst
alle
d Ca
paci
ty (M
W)
Weighted Average Installed Cost per MW ($M)
Source: Scotia Capital estimates.
Exhibit 3.3: No New Equity for KHD’s Current Plan
($M) ($M)
Current construction facilities 412.5 Melancthon II 285.0Anticipated construction facilities 302.7 Wolfe Island 450.0Undrawn operating credit facility 5.4 Island Falls 35.5Working capital surplus 37.0 Royal Road 40.0Future cash flow from operations 60.4 English 10.0
Serpentine 22.0Clemina 27.0Bone 49.0New Richmond 190.0St. Valentin 160.0Spent to date (450.4)
818.1 818.1
Funding Sources Funding Uses
Source: Company reports; Scotia Capital estimates.
When Will Canadian Hydro Developers Need New Equity? In its Q2/08 MD&A, KHD noted that it will likely not require new equity to finance its current capital expenditure plan through 2012, as its cash flow from operations should make up any shortfall of current and anticipated facilities. Its capex plan through 2012 includes the following projects: Melancthon II, Wolfe Island, Royal Road, Clemina Creek, Bone Creek, Serpentine Creek, English Creek, St. Valentin, and New Richmond (Exhibit 3.3).
However, we believe there are several scenarios under which KHD will likely require new equity to finance several power projects that are not included in its current plan (Exhibit 3.4). Our table has been sensitized by an average installed cost per MW as well as the number of megawatts to be financed. Our primary assumption in Exhibit 3.4 is that KHD finances its future projects using its target capital structure of 65%/35% debt/equity. KHD could need $100 million in new equity for Dunvegan and another $100+ million for 125 MW of projects that we believe will be bid shortly. Exhibit 3.5 summarizes KHD’s portfolio of both operating and development projects.
We believe there are several scenarios under which KHD will require new equity to finance several power projects that are not included in its current capex plan.
KHD could need about $200 million in new equity if Dunvegan and another 125 MW of projects that are expected to be bid shortly are approved.

The Choice of a New Generation August 2008
105
Exhibit 3.5: KHD’s Portfolio of Assets and Development Prospects
Net Est. Capacity Power PPAProject/Site Location Cap. Pdn Factor Purchaser Expiry Low High
(MW) (GWh/y) (%) ($M) ($M)Hydro
Belly River Alberta 3.0 12.0 45.7% AB Pool 2011Waterton Alberta 2.8 12.4 50.6% AB Pool 2012St. Mary Alberta 2.3 12.6 62.5% AB Pool 2012Taylor (hydro) Alberta 6.5 22.1 38.8% AB Spot -Akolkolex B.C. 10.0 52.7 60.2% BC Hydro 2015Pingston B.C. 22.5 89.0 45.2% BC Hydro 2023Upper Mamquam B.C. 25.0 98.2 44.8% BC Hydro 2025Ragged Chute Ontario 6.6 36.1 62.4% Constellation 2011Moose Rapids Ontario 1.3 5.7 50.1% Constellation 2011Appleton Ontario 1.4 6.6 53.8% Constellation 2011Galetta Ontario 1.6 7.9 56.4% Constellation 2011Misema Ontario 3.2 13.3 47.4% OPA 2027Bone Creek B.C. 18.0 73.0 46.3% BC Hydro 2029 49.0 53.9Clemina Creek B.C. 11.0 33.0 34.2% BC Hydro 2049 27.0 29.7Serpentine Creek B.C. 9.6 34.0 40.4% BC Hydro 2049 22.0 24.2English Creek B.C. 5.0 20.0 45.7% BC Hydro 2049 10.0 11.0Island Falls Ontario 10.0 46.7 53.3% OPA 2029 35.5 39.1Dunvegan Alberta 100.0 600.0 68.5% - - 300.0 330.0(Hydro various) B.C. 260.0 1,024.9 ~45.0% - - 615.0 1,014.7
WindCowley Ridge Alberta 21.4 55.0 29.3% AB Pool 2013Cowley North Alberta 19.5 47.6 27.9% AB Spot -Sinnot Alberta 6.5 15.4 27.0% AB Spot -Taylor (wind) Alberta 3.4 6.6 22.2% AB Spot -Soderglen Alberta 35.3 119.8 38.8% AB Spot -Melancthon I Ontario 67.5 194.8 32.9% OPA 2026Le Nordais Quebec 99.0 165.0 19.0% Hydro-Quebec 2033Melancthon II Ontario 132.0 350.6 30.3% OPA 2028 285.0 285.0Wolfe Island Ontario 197.8 593.5 34.3% OPA 2028 450.0 450.0Royal Road Ontario 18.0 47.3 30.0% OPA 2030 40.0 44.0New Richmond Quebec 66.0 178.7 30.9% Hydro-Quebec 2032 190.0 209.0St. Valentin Quebec 50.0 143.9 32.9% Hydro-Quebec 2032 160.0 176.0(AB wind various) Alberta 75.0 197.1 ~30.0% - - 118.3 195.1(MB wind various) Manitoba 1,000.0 2,628.0 ~30.0% - - 1,576.8 2,601.7(ON wind various) Ontario 127.0 333.8 ~30.0% - - 200.3 330.4
BiomassGrande Prairie Alberta 25.0 162.7 74.3% Various Various
Total 2,443.2 7,439.9
Online
Online
OnlineOnlineOnlineOnlineOnlineOnlineOnline
OnlineOnlineOnlineOnline
Online
OnlineOnlineOnline
Status/Est. Cost
OnlineOnlineOnline
Source: Company reports; Scotia Capital estimates.

Alternative & Renewable Energy August 2008
106
Exhibit 3.6: Forecast Wind Production Through 2012
0
100
200
300
400
500
600
Q106
Q306
Q107
Q307
Q108
Q308
Q109
Q309
Q110
Q310
Q111
Q311
Q112
Q312
GW
h pe
r Qua
rter
Actual
Forecast
Source: Company reports; Scotia Capital estimates.
Exhibit 3.7: Forecast Hydro Production Through 2012
0
50
100
150
200
250
Q106
Q306
Q107
Q307
Q108
Q308
Q109
Q309
Q110
Q310
Q111
Q311
Q112
Q312
GW
h pe
r Qua
rter Actual Forecast
Source: Company reports; Scotia Capital estimates.
Production Profile & Outlook W I N D — K H D ' S B R E A D & B U T T E R
Canadian Hydro Developers owns 252.6 MW of operating wind power capacity, which represents slightly less than 70% of its portfolio of operating assets. About 86 MW of this capacity is situated in Alberta, almost all of which sells electricity into the local spot power market. Melancthon I (67.5 MW), KHD’s only operating wind farm in Ontario, has a long-term contract with the Ontario Power Authority that expires in 2026. Similarly, its only Quebec facility, Le Nordais (99 MW), has a long-term contract with Hydro-Quebec that expires in 2033. The overall capacity factor for its operating wind farms is 27.3%.
We expect 1,313 GWh generated from wind power in 2009, or 2x our 2008 forecast of 641 GWh and 3x actual 2007 wind generation of 431 GWh. Exhibit 3.6 shows our quarterly forecast for KHD’s wind operations through 2012.
KHD continues to add new wind capacity to its portfolio, either through the construction of new projects or through the acquisition of existing ones. Two of its larger wind farms, Soderglen (35.25 MW) in Alberta, and Le Nordais (99 MW) in Quebec, were acquired by KHD in the past
two years. Both facilities have expansion potential, although in May 2008, KHD decided to shelve its 70 MW Le Nordais expansion project in favour of being awarded a 66 MW PPA by Hydro-Quebec. The company expects 132 MW (Melancthon II) of new wind capacity to be online by the end of 2008, 197.8 MW (Wolfe Island) in 1H/09, 18 MW (Royal Road) by the end of 2010, and 116 MW by the end of 2012 (New Richmond and St. Valentin). Additionally, KHD has 1,200+ MW of wind development prospects.
H Y D R O – S L O W A N D S T E A D Y G R O W T H
Almost all of KHD’s hydro facilities operate under long-term contracts that expire between 2011 and 2027. The hydro facilities are geographically dispersed among British Columbia (57.5 MW), Alberta (14.6 MW), and Ontario (14.1 MW). As a result, production volatility due to seasonality is somewhat muted.
Five hydro projects, totalling 53.6 MW, are due to be constructed and commissioned before the end of 2009. Additionally, KHD is pursuing the development of multiple other hydro projects in B.C. (~260 MW) as well as its 100 MW Dunvegan facility in Alberta.
We expect 364 GWh and 390 GWh to be generated from KHD’s hydro portfolio in 2008 and 2009, respectively, about flat with its 2007 hydro generation. Exhibit 3.7 shows our quarterly forecast for KHD’s hydro operations through 2012.
Wind power represents about 70% of KHD’s portfolio of operating assets.
Five hydro projects totalling 53.6 MW are due to be commissioned before the end of 2009.

The Choice of a New Generation August 2008
107
Exhibit 3.8: Forecast Biomass Production Through 2012
05
1015202530354045
Q106
Q306
Q107
Q307
Q108
Q308
Q109
Q309
Q110
Q310
Q111
Q311
Q112
Q312
GW
h pe
r Q
uart
er
ActualForecast
Source: Company reports; Scotia Capital estimates.
B I O M A S S – I M P R O V E M E N T E X P E C T E D O V E R T I M E
KHD owns and operates a 25 MW wood-waste biomass facility in Alberta that is able to produce up to 162.7 GWh/y of energy and 300,000 GJ/y of steam. The $65 million Grand Prairie EcoPower Centre (GPEC) consumes 220,000 tonnes of wood waste annually, and is CO2 neutral. Ninety percent of power generation is sold through long-term contracts with Canfor (to 2019), the City of Grand Prairie (to 2019), and Alberta Infrastructure (to 2024). Power output in 2007 was 123.7 GWh (56.5%), up from 105.1 GWh
(48%) the previous year, but not close to its 162.7 GWh potential. We expect to see operational improvements at the facility soon. Q1/08 production at GPEC was a disappointment, having generated 21 GWh versus our estimated 40.2 GWh.
We expect production of 117 GWh will be generated from KHD’s biomass operations in 2008, which should improve to 133 GWh by 2009. Exhibit 3.8 shows our quarterly forecast for KHD’s biomass operations through 2012.
Production at KHD’s Grand Prairie EcoPower Centre has been disappointing to date, but we are optimistic that planned improvements will be implemented successfully.
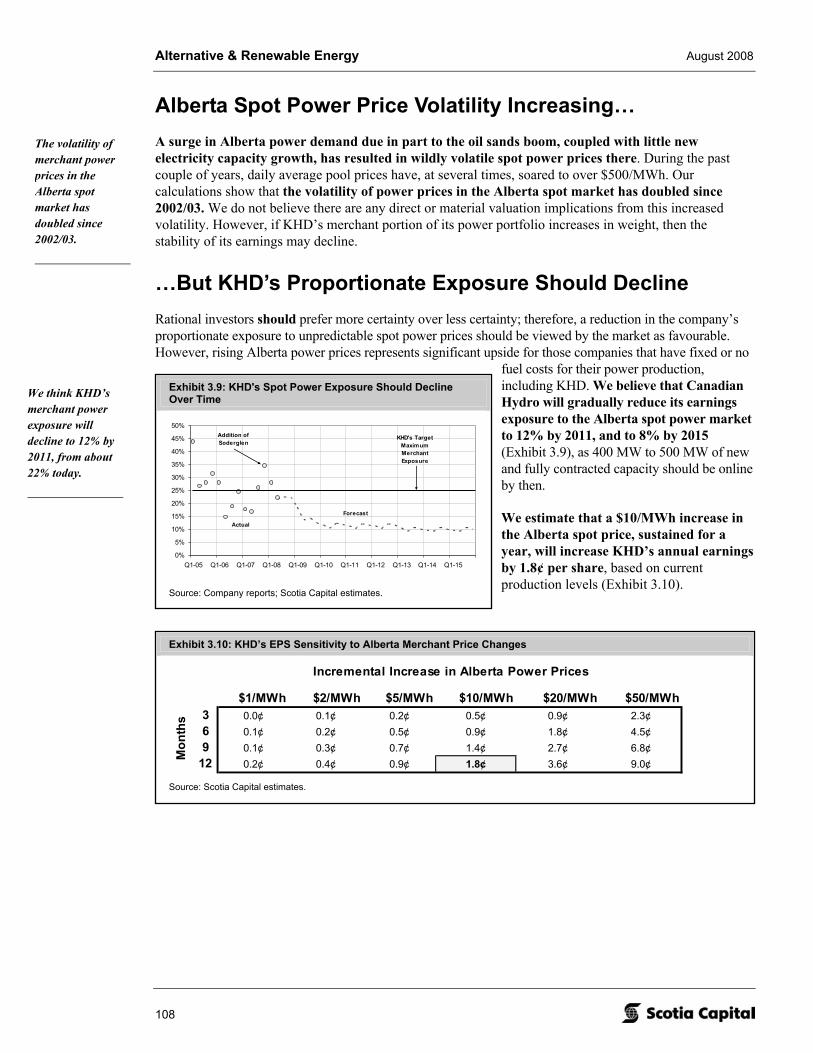
Alternative & Renewable Energy August 2008
108
Exhibit 3.9: KHD's Spot Power Exposure Should Decline Over Time
0%
5%
10%
15%
20%
25%
30%
35%
40%
45%
50%
Q1-05 Q1-06 Q1-07 Q1-08 Q1-09 Q1-10 Q1-11 Q1-12 Q1-13 Q1-14 Q1-15
Forecast
KHD's Target Maximum Merchant Exposure
Addition of Soderglen
Actual
Source: Company reports; Scotia Capital estimates.
Exhibit 3.10: KHD’s EPS Sensitivity to Alberta Merchant Price Changes
0.9 $1/MWh $2/MWh $5/MWh $10/MWh $20/MWh $50/MWh3 0.0¢ 0.1¢ 0.2¢ 0.5¢ 0.9¢ 2.3¢6 0.1¢ 0.2¢ 0.5¢ 0.9¢ 1.8¢ 4.5¢9 0.1¢ 0.3¢ 0.7¢ 1.4¢ 2.7¢ 6.8¢
12 0.2¢ 0.4¢ 0.9¢ 1.8¢ 3.6¢ 9.0¢
Mon
ths
Incremental Increase in Alberta Power Prices
Source: Scotia Capital estimates.
Alberta Spot Power Price Volatility Increasing… A surge in Alberta power demand due in part to the oil sands boom, coupled with little new electricity capacity growth, has resulted in wildly volatile spot power prices there. During the past couple of years, daily average pool prices have, at several times, soared to over $500/MWh. Our calculations show that the volatility of power prices in the Alberta spot market has doubled since 2002/03. We do not believe there are any direct or material valuation implications from this increased volatility. However, if KHD’s merchant portion of its power portfolio increases in weight, then the stability of its earnings may decline.
…But KHD’s Proportionate Exposure Should Decline Rational investors should prefer more certainty over less certainty; therefore, a reduction in the company’s proportionate exposure to unpredictable spot power prices should be viewed by the market as favourable. However, rising Alberta power prices represents significant upside for those companies that have fixed or no
fuel costs for their power production, including KHD. We believe that Canadian Hydro will gradually reduce its earnings exposure to the Alberta spot power market to 12% by 2011, and to 8% by 2015 (Exhibit 3.9), as 400 MW to 500 MW of new and fully contracted capacity should be online by then.
We estimate that a $10/MWh increase in the Alberta spot price, sustained for a year, will increase KHD’s annual earnings by 1.8¢ per share, based on current production levels (Exhibit 3.10).
The volatility of merchant power prices in the Alberta spot market has doubled since 2002/03.
We think KHD’s merchant power exposure will decline to 12% by 2011, from about 22% today.

The Choice of a New Generation August 2008
109
Mixed Reactions on KHD’s Recent Acquisitions Canadian Hydro Developers has completed numerous acquisitions to expand its portfolio of operating assets as well as its development pipeline. In our opinion, only some of KHD’s acquisitions have been viewed favourably by the market. Below, we assess KHD’s more recent transactions.
V E C T O R W I N D E N E R G Y I N C .
Transaction highlights. December 2006 saw KHD purchase Vector Wind Energy for $6.3 million. Vector offered KHD about 1,000 MW of wind energy prospects mainly in Manitoba, as well as the Royal Road project, and some development prospects in Eastern Canada. KHD’s decision to purchase the Manitoba wind development prospects was premised on Manitoba Hydro’s stated commitment to materially increase its installed wind capacity over the coming years by 900 MW to 1,000 MW.
The success of the transaction has been mixed to date. In December 2007, KHD announced that it had not been selected by Manitoba Hydro for 300 MW of wind power RFP negotiations. The company anticipates bidding in upcoming Manitoba Hydro wind RFPs over the coming years, likely totalling a further 600 MW. In mid-2007, KHD sold its 21 MW Fairfield Hill wind prospect located in New Brunswick to TransAlta for $1.27 million. The 27 MW Fermeuse wind project in Newfoundland was also sold, for about $0.5 million.
G W P O W E R C O R P O R A T I O N
Transaction highlights. KHD announced the February 2007 acquisition of GW Power Corporation for $87 million, or $72.6 million after applying working capital deficiencies. The acquisition included (1) a 50% interest in Soderglen, a 70.5 MW wind farm in southern Alberta with a high 38.9% capacity factor; (2) 75 MW of wind prospects in Alberta; and (3) 70 MW of wind prospects in Ontario. In addition to selling Soderglen’s power into the Alberta spot market, the facility qualified for a $10/MWh federal Wind Power Production Incentive (WPPI).
After reducing the purchase price by $14.4 million for working capital deficiencies, $2.06 million per installed MW seems reasonable for a wind farm that produces at a near 40% capacity factor. Additionally, our research indicates that the Alberta and Ontario prospects of 145 MW are more than just “brag-a-watts.” If we give $0.l million per prospective MW, the transaction price for Soderglen falls further to $1.92 million. At this price, we view the acquisition as quite good, considering both the strength of the plant’s ability to capture the wind resource, the WPPI incentive, and the upside potential of the spot market.
L E N O R D A I S W I N D P L A N T
Transaction highlights: In November 2007, Canadian Hydro purchased the Quebec-based 99 MW Le Nordais Wind Plant for $120.75 million (including debt and transaction costs). At the time, the facility had been in operation for eight years, with its power being sold to Hydro Quebec under a long-term PPA that expires at the end of 2033. The acquisition also includes a possible expansion at the site by up to 70 MW.
The transaction cost of about $1.2 million per MW (excluding expansion opportunities) is quite inexpensive and impressive, although further investment will be required by KHD to raise the wind farm’s capacity factor above its low 19%. We believe that over the next several years, KHD will work to increase the wind farm’s availability, resulting in an overall capacity factor increase to between 21% and 22%. As part of the Quebec wind farm acquisition, KHD (negatively) surprised equity markets by also announcing a $55 million bought deal (8.8 million shares @ $6.25/share) to finance the transaction.
Only some of KHD’s acquisitions have been viewed favourably by the stock market.

Alternative & Renewable Energy August 2008
110
Exhibit 3.11: Alberta Power Price Volatility Has Doubled Since 2002/03
$0
$100
$200
$300
$400
$500
$600
Dec-01 Dec-02 Dec-03 Dec-04 Dec-05 Dec-06 Dec-07
Daily
Ave
rage
Poo
l Pric
e ($
/MW
h)
Standard Deviation2002/03 - $34/MWh2004/05 - $37/MWh2006/07 - $68/MWh
Quarterly average pool
price
Daily average pool price
Source: AESO; Scotia Capital.
Key Investment Risks In our opinion, execution risk is the largest threat to our target price for Canadian Hydro Developers. Similar to its IPP peers, KHD faces numerous other risks that could negatively impact its share price, all of which are not unique to the company. Below, we have highlighted the key investment risks to our one-year target price for KHD.
P E R M I T T I N G & E X E C U T I O N R I S K
On the one hand, Canadian Hydro Developers has been extremely successful over its 19-year history at successfully bringing numerous renewable power prospects into its portfolio of profitable operating assets. On the other hand, several delays and cost overruns over the past two years have likely hurt the company’s share price. With approximately 1,135 GWh/y of annual electricity generation in operation and another 3,000 GWh/y at various stages of development, a significant portion of our target price is contingent upon management’s successful execution of the company’s prospects, not all of which will be realized.
At its worst, permitting delays can almost terminate a project, as we have seen with KHD’s 100 MW Alberta-based hydro prospect Dunvegan. Permitting delays can result from as little as one person filing an objection to a project. This is different from a simple denial of a project permit due to, for example, fish habitat concerns. Even if permitting is finally approved for a renewable power prospect to move forward, the length of delays can sometimes materially alter the project’s economics, calling into question the viability of the project.
C O M M O D I T Y & F U E L P R I C E R I S K S
Well over 200 GWh of KHD’s annual power generation is exposed to the volatile Alberta wholesale spot power market (Exhibit 3.11). At times, this market can be highly unpredictable. We estimate that a $10/MWh increase in the Alberta spot price, sustained for a year, will increase KHD’s annual earnings by 1.8¢ per share, based on current production levels.
Execution risk is the largest threat to our target price for Canadian Hydro Developers.
We estimate that a $10/MWh increase in the Alberta spot price, sustained for a year, will increase annual EPS by 1.8¢.

The Choice of a New Generation August 2008
111
The company’s 25 MW biomass facility in Alberta purchases up to 220,000 tonnes/y of wood waste annually from Canfor, one of the plant’s power and steam output customers. Despite a long-term wood waste purchase agreement, the Canadian lumber industry continues to decline, and the viability of Canfor’s lumber mill in Grand Prairie that supplies wood waste to GPEC could face closure risk. However, KHD is indemnified by Canfor should the mill close.
W E A T H E R & C L I M A T E C H A N G E
KHD’s wind farms and hydro facilities are subject to unpredictable weather and climate patterns that may lead to material deviations from our quarterly production forecast. As partial mitigation to this risk, KHD is diversified both regionally and by technology, which should somewhat “weather” the impact of large changes in expected production at any given facility.
R E G U L A T O R Y & P O L I T I C A L E N V I R O N M E N T
Transforming KHD’s pipeline of prospects into operational assets depends heavily on the continuation of favourable federal and provincial initiatives that promote the development of renewable power as a viable alternative to traditional coal- and gas-fired power generation technologies. Our financial forecast assumes that current federal and provincial renewable power incentives, targets, and initiatives will continue.
F I R S T N A T I O N S S U P P O R T
Part of the Environmental Assessment process is a duty to consult with all stakeholders of a project, which may or may not include First Nations groups that once claimed a project’s site as traditional land. Ultimately, the duty of First Nations relations rests with the Crown. However, without the support of local First Nations communities, KHD’s projects could be delayed. As a result, KHD has reached settlements with various First Nations bands that support the construction of projects on their traditional land.
F I N A N C I N G
Given current credit market conditions and credit risk repricing, KHD’s cost of capital may increase and its access to capital could be constrained going forward. Unlike some of its junior peers like EarthFirst and Plutonic Power, Canadian Hydro Developers already generates significant free cash flow and therefore its overall reliance on capital markets is of relatively less concern.
M A N A G E M E N T
Key management risk is normal at KHD. Canadian Hydro is heavily dependent on the founding Keating brothers as well as its EVP & CFO, Kent Brown, to promote the company and realize its future growth opportunities. On October 31, 2007, KHD announced the installation of a new COO that only lasted several months. Since then, a new COO has been hired, as well as a General Counsel. While we don’t expect the Keating brothers to leave KHD within the next 12 months, we believe that KHD’s succession planning to date has laid an appropriate foundation for a smooth transition. Please refer to Exhibit 3.29 for further details.
O P E R A T I O N A L
We believe operational risk is medium for KHD due to its substantial geographic and technological diversification. The nature of multiple-turbine wind farms allow for one to several wind turbines to be offline at any given time without a major impact to the operation of the facility, not to mention the earnings of the overall company. With renewable power facilities sprouting up daily across Canada and around the world, forecasting O&M costs has become fairly effortless. High inflationary periods as well as repair costs for materially damaged or failed machinery are typically covered by insurance.
KHD’s wind farms and hydro facilities are subject to unpredictable weather and climate patterns that may lead to material deviations from our quarterly production forecast.
Key management risk is normal at KHD.

Alternative & Renewable Energy August 2008
112
Exhibit 3.12: Upcoming Stock Catalysts & Events
Sep 08 Oct 08 Nov 08 Dec 08 Q1/09 Q2/09 Q3/09 Q4/09
~70 MW bid into ON
RES III
Island Falls, English Creek, Clemina Creek, Bone
Creek, Serpentine Creek due online
~55 MW bid into BC
Hydro RFP
Wolfe Island due
online
Melancthon II due online
BC Hydro EPAs
awarded
Dunvegan Decision
25 MW Soderglen Expansion annoucement?2009 BC Hydro Clean Power Call?
Final decision on solar?
RES III contracts awarded? 50 MW Roundup Ranch announcment?
Source: Scotia Capital.
Upcoming Stock Catalysts & Events Similar to most Canadian renewable power developers, we see many events over the next two years that could significantly move Canadian Hydro Developers’ share price. In our view, awards of new capacity, the commissioning of new capacity, and movement on the delayed Dunvegan will likely have the most material impacts on KHD’s share price. Below, we have listed what we believe to be the more major short- to mid-term stock catalysts for KHD.
November 2008 – BC Hydro 2008 Clean Power Call bids due. We expect KHD will submit at least 55 MW of new hydro projects in this RFP.
Q4/08 – Commissioning of the 132 MW Melancthon II wind farm in Ontario.
2H/08 – Permitting movement on the 100 MW Dunvegan hydro project in Alberta or a decision to cancel the project altogether.
2H/08 –Decision to enter the Ontario solar market, through a 10 MW Standard Offer Contract.
2H/08 – Announcement that KHD has bid up to 70 MW of wind projects into the OPA’s Renewable Energy Supply (RES) III.
1H/09 – Announcement of anticipated BC Hydro 2009 Clean Power Call. We believe, as do most industry observers, that BC Hydro will announce a 5,000 GWh renewable power RFP in early 2009.
Q1/09 – Commissioning of the 197.8 MW Wolfe Island wind farm in Ontario.
1H/09 – BC Hydro 2008 Clean Power Call awards expected, likely after the B.C. government election that is scheduled for May 2009.
Q4/09 – Commissioning of 20 MW (10 MW net to KHD) Island Falls hydro project in Ontario, and four hydro projects in B.C. that total 43.6 MW.
In Q4/08, watch for a Dunvegan update, the commissioning of Melancthon II, and KHD’s bid into the 2008 BC Hydro Clean Power Call (~55 MW).
Commissioning of Wolfe Island was recently set back by five months to the end of Q1/09.

The Choice of a New Generation August 2008
113
Construction Projects & Development Prospects
Canadian Hydro Developers has 401.4 MW of projects that are either under construction or are construction-ready, excluding two signed PPA wind farm projects in Quebec due online in 2012. Eighty-two percent of the capacity of these projects (or 79% of expected generation) are wind farms located in Ontario. The remaining 71.6 MW of capacity are small hydro projects located in Ontario (28 MW) and in B.C. (43.6 MW). We provide a brief summary of KHD’s construction and construction-ready projects as well as a summary of its development pipeline.
M E L A N C T H O N I I
The 132 MW Melancthon II wind farm is under construction and is expected to be commissioned in November 2008. A longer-than-expected regulatory approvals process caused the anticipated project completion date to be moved back twice, first to June 2008 from Spring 2007, and then to November 2008. The $285 million project, or $2.16 million per MW, has an expected capacity factor of 30.3% on annual generation of 350 GWh. The wind farm has a RES contract with Ontario Power Authority that we estimate will pay KHD slightly less than $100/MWh. Under the terms of the contract, the power price changes annually by a percentage equal to 15% of the annual change in Ontario CPI. We expect the project to receive the $10/MWh ecoENERGY federal incentive payment on the first 10 years of its operation. KHD financed the project using 35% equity and 65% debt.
W O L F E I S L A N D
Canadian Hydro’s 197.8 MW Wolfe Island wind farm could be commissioned as early as March 2009, a five-month setback from KHD’s previous estimate of October 2008. Annual power output is estimated at 593.5 GWh, representing a 34.3% capacity factor. The $450 million project (was $410 million before the setback announcement), or $2.28 million per MW, will use 2.3 MW Siemens turbines. In our opinion, PPA terms are near identical to Melancthon II. We expect the project to receive the $10/MWh ecoENERGY federal incentive payment on the first 10 years of its operation. KHD financed the project using 35% equity and 65% debt.
R O Y A L R O A D
The 18 MW Royal Road wind project is expected to be operational in mid-2010, producing 47.3 GWh/y, or at a 30% capacity factor. The project received two Ontario 20-year Standard Offer Contracts (SOCs) that will pay KHD $110/MWh as well as 50% of the $10/MWh ecoENERGY federal incentive payment, should its application be approved. As Ontario SOCs require projects to be sub-10 MW in nature, Royal Road will be built in two 9 MW phases. The project will consist of twelve 1.5 MW GE turbines.
I S L A N D F A L L S
KHD’s 50%-owned 20 MW Island Falls hydro project (10 MW net to KHD) is expected to be in service by October 2009, or one year later than originally planned. The delay stems from permitting setbacks and will not affect its PPA with Ontario Power Authority. The PPA is a 20-year RES II contract that we expect will be priced at close to $100/MWh by October 2009. Annual escalation in the fixed-price contract is similar to the Melancthon II and Wolfe Island projects. With an estimated production of 93 GWh/y, the project’s capacity factor is 53.3%. We expect the project to receive the $10/MWh ecoENERGY federal incentive payment on the first 10 years of its operation. The capital cost for Island Falls is $71 million, or $3.55 million per MW.
KHD’s Island Falls hydro project is expected to be in service by October 2009, or one year later than originally planned.

Alternative & Renewable Energy August 2008
114
B O N E C R E E K
The 18 MW run-of-river Bone Creek project in B.C. is expected by KHD to be commissioned in the fall of 2009. At $48.6 million, or $2.7 million per MW, Bone Creek should generate 73 GWh/y of electricity, representing a capacity factor of 46.3%. The project has a 20-year BC Hydro PPA that we estimate will pay KHD about $80/MWh in its first full year of operation. The power price is indexed to 50% of the change in annual CPI. Under the terms of the PPA, KHD will provide BC Hydro with all green attributes such as emissions credits and clean power allowances. However, KHD expects the project to be eligible for the $10/MWh federal ecoENERGY incentive for its first 10 years of operation.
C L E M I N A C R E E K
KHD’s 11 MW Clemina Creek hydroelectric project is capable of producing 33 GWh/y, or at a capacity factor of 34.2%. The $27 million project, or $2.45 million per MW, is expected online by the fall of 2009. BC Hydro has provided KHD with a 40-year PPA that we believe will be priced at $74.50/MWh in the project’s first full year of operation. Similar to KHD’s Bone Creek project, all green attributes will be given to BC Hydro, with the exception of the possible federal ecoENERGY incentive payment.
S E R P E N T I N E C R E E K
The 9.6 MW Serpentine Creek run-of-river project is due online by the fall of 2009. At a capital cost of $22 million, or $2.3 million per MW, the facility is expected to generate 34 GWh/y of power, or at a 40.4% capacity factor. Similar to Clemina Creek, the project was awarded a 40-year BC Hydro PPA that we believe will be priced at about $74.50/MWh in its first full year of operation. Again, all green attributes of the project have been forfeited by KHD, with the exception of the possible ecoENERGY incentive. The project will be 35% equity financed, in line with KHD’s stated target.
E N G L I S H C R E E K
English Creek, a 5 MW run-of-river project in B.C., has an in-service date of fall 2009. The $10 million project, or $2 million per MW, is expected to generate 20 GWh/y, representing a capacity factor of 45.7%. We believe the project’s 40-year PPA with BC Hydro will be priced identically to KHD’s Serpentine Creek and Clemina Creek projects.
N E W R I C H M O N D & S T . V A L E N T I N
In May 2008, KHD was awarded two Hydro-Quebec wind PPAs for a total of 116 MW. The 66 MW New Richmond wind farm will consist of 33, 2 MW E82 Enercon turbines that are expected to generate 178.7 GWh/y, or at a capacity factor of 30.9%. The $190 million project, or $2.8 million per MW, has not received all regulatory approvals. St. Valentin will consist of 25, 2 MW E82 Enercon wind turbines that is expected to generate about 143.9 GWh/y, or at a capacity factor of 32.9%. The $160 million project, or $3.2 million per MW, has not received regulatory approvals as well. KHD expects both projects to earn, on average, an 11% return, on a pre-tax, unlevered basis.
D E V E L O P M E N T P R O S P E C T S
In addition to its 517 MW of projects that should be commissioned over the next five years, KHD has a further 1,632 MW of development prospects that may or may not move forward to commissioning. Two-thirds of this potential is in Manitoba, following KHD’s 2006 acquisition of Vector Wind Energy. While the wind regime is strong in its Manitoba development regions, we don’t see KHD commissioning a substantial amount of wind power capacity in the province over the next five years. Manitoba’s target is to achieve 1,000 MW of wind capacity by 2015. Of the remaining development prospects, we think the majority of its pipeline is viable.
On an unlevered, pre-tax basis, KHD expects to earn 11% on its recent Hydro-Quebec PPA wins.
In addition to its 517 MW of projects that should be commissioned over the next five years, KHD has a further 1,632 MW of development prospects, two-thirds of which are in Manitoba.

The Choice of a New Generation August 2008
115
Exhibit 3.13: Potential 2013 REC Generation Could Be High
Today 2013E
Alberta generation 466,200 466,20050% of Le Nordais 82,500 85,000Alberta prospects 0 197,100Dunvegan 0 600,000Contracted (132,000) (132,000)Available for sale 416,700 1,216,300
AssumptionsThe capacity factor at Le Nordais is increased to 22% from 19% over f ive years.Dunvegan is comissioned by December 31, 2012.75 MW of new Alberta w ind facilities are commissioned by December 31, 2012.
Source: Scotia Capital estimates.
Exhibit 3.14: REC Sales Could Be Worth $0.75 to $1/share
0.76 $0.00 $2.50 $5.00 $7.50 $10.00 $12.50 $15.00$0 0.00 0.19 0.39 0.58 0.78 0.97 1.17
$10 0.06 0.25 0.45 0.64 0.84 1.03 1.23$20 0.12 0.31 0.51 0.70 0.89 1.09 1.28$30 0.18 0.37 0.56 0.76 0.95 1.15 1.34$40 0.23 0.43 0.62 0.82 1.01 1.21 1.40$50 0.29 0.49 0.68 0.88 1.07 1.26 1.46
Alberta RECs ($/MWh)
CT C
lass
I RE
Cs(U
S$/M
Wh)
Source: Scotia Capital estimates.
The Value of KHD’s RECs
Renewable Energy Certificates (RECs) are no longer a “bonus” for companies generating alternative energy. Rather, many power developers now depend on the earnings contribution of RECs as a way to maintain a project’s expected returns while providing greater flexibility in allowing companies to bid lower (and more competitive) long-term prices for renewable power RFPs.
KHD generates over one million RECs (or equivalents) per year, most of which are not available for sale. Under many of KHD’s PPAs, the transfer of RECs to its PPA counterparty are required with the delivery of electricity. In Exhibit 3.13, we summarize the current flow of KHD’s annual Alberta REC production (including Le Nordais in Quebec) as well as estimate KHD’s 2013 annual REC production. If our 2013 forecast is accurate, and sustainable (with no more capacity increases), we believe an additional $0.75 to $1.00 per share of upside value exists (Exhibit 3.14).
For KHD’s Quebec-generated RECs to be available for sale into NEPOOL, it must have its plants accredited to sell RECs into the region. Hydro-Quebec will likely have to help KHD in the accreditation process and would probably seek some of the upside from KHD’s Quebec-generated RECs available for sale.
Most of KHD’s generated RECs are contracted for delivery via its PPAs, and are therefore not available for sale.
KHD could one day sell up to 85,000 RECs from its Le Nordais facility into the Connecticut REC market.

Alternative & Renewable Energy August 2008
116
Exhibit 3.16: Dunvegan Could Be Worth $1.50 per Share
$1.34 $55 $60 $65 $70 $75 $80 $85 $9044.5% $0.25 $0.34 $0.43 $0.52 $0.62 $0.71 $0.80 $0.8948.5% $0.36 $0.46 $0.56 $0.66 $0.76 $0.86 $0.96 $1.0652.5% $0.47 $0.58 $0.69 $0.80 $0.91 $1.01 $1.12 $1.2356.5% $0.59 $0.70 $0.82 $0.93 $1.05 $1.17 $1.28 $1.40
60.5% $0.70 $0.82 $0.95 $1.07 $1.19 $1.32 $1.44 $1.5764.5% $0.81 $0.94 $1.07 $1.21 $1.34 $1.47 $1.60 $1.7468.5% $0.92 $1.06 $1.20 $1.34 $1.48 $1.62 $1.76 $1.9072.5% $1.03 $1.18 $1.33 $1.48 $1.63 $1.78 $1.93 $2.07
Capa
city
Fac
tor
Realized Dunvegan Power Price (2008$/MWh)
Source: Scotia Capital estimates.
Exhibit 3.15: Levelized Cost Curves for Dunvegan
$40
$50
$60
$70
$80
$90
$100
$110
$3.00 $3.50 $4.00 $4.50 $5.00 $5.50 $6.00
Cost per Installed MW ($M)
Levl
ized
Cos
t of P
ower
($
/MW
h)
65% c.f.
70% c.f.
60% c.f.
Source: Scotia Capital estimates.
Warming Up to Dunvegan Until recently, we had been disappointed with eight years of permitting delays at KHD’s Dunvegan hydro project with little to show for it. KHD has spent $10.3 million on the development of what has grown to a 100 MW (~$350 million or higher) project from a 40 MW project in 2000.
In its Q1/08 MD&A, KHD stated that in January 2008, it participated in a joint pre-hearing with the Alberta Utilities Commission and Natural Resources & Conservation Board. A hearing date has now been scheduled for mid-September, and is expected to last several days. KHD anticipates that a final decision on the project will be announced in late Q4/08 or early 2009.
Based on our discussions with management, we have warmed up to the idea that the project may receive a green light. All outstanding issues have been resolved for the project to receive regulatory approvals.
While installed capital costs have not been finalized, even at $5 million per MW we believe that the long-term levelized cost for Dunvegan would be attractive and in range between $60/MWh and $70/MWh. Early indications are that two-thirds of the Dunvegan output (i.e., considered baseload) would likely be sold on five-year forward strip contracts, with the remainder sold into the Pool.
We believe that the Dunvegan project could be worth about $1.50 per share (Exhibit 3.16).
We think that KHD’s Dunvegan project could be worth about $1.50 per share. We currently give almost no value for the project.

The Choice of a New Generation August 2008
117
Valuation & Sensitivity Analyses We value Canadian Hydro Developers using a blended approach as follows: a 75% weight to a project probability-weighted discounted cash flow analysis (DCF), and a 25% weight to a net asset value calculation.
D I S C O U N T E D C A S H F L O W A N A L Y S I S
Our project-probability based DCF analysis suggests a one-year share price of $7.04. For our DCF analysis, we chose a discount rate of 9.5%, which we believe appropriately captures the sector’s standard risks as well as KHD’s unique ones. The discount rate reflects Canadian Hydro Developers’ slightly higher tolerance for construction and execution risks, as well as its targeted 65%/35% debt to equity capital structure. KHD’s discount rate of 9.5% is below that of its junior peers such as EarthFirst, Plutonic Power, and Innergex, and 0.5% lower than intermediate IPP Boralex due to KHD’s lower commodity exposure.
In our DCF model, we give full credit to KHD’s operating facilities and probability-weight development projects as follows: a 90% probability to those projects under (or ready for) construction, and a 25% to 75% probability range to projects that have completed various development stages such as permitting, financing, and receiving a PPA. We give no value for “brag-a-watts.” Exhibit 3.17 summarizes our DCF approach on a per project basis.
N E T A S S E T V A L U E C A L C U L A T I O N
We calculate a NAV of $6.95 per share. Given recent transactions and using rule-of-thumb metrics, we give credit of $0.82 million per GWh/y for wind capacity that is either operational or under construction with no construction risk. For hydro assets, we give credit of $1 million per GWh/y for operational capacity. We probability-adjust these values lower for those projects that are less developed. Projects that are under construction (and not 100% fixed-price) or are construction-ready receive about a 10% discount. Projects with signed PPAs or permitting completion are discounted further, as are projects with little to no development progress. Similar to our DCF valuation, we give no value for “brag-a-watts.” Our NAV calculation is laid out in Exhibit 3.18.
T A R G E T P R I C E , R A T I N G , A N D R I S K R A N K I N G
We have transferred coverage of KHD with a 1-Sector Outperform rating. Our one-year share price target is $7.00, which comprises outcomes of the following valuation approaches: (1) 75% DCF at $7.04/share, using a 9.5% discount rate, and (2) 25% NAV at $6.95/share.
Our risk ranking for Canadian Hydro Developers is High, the same as for Boralex. Much of the company has not been built yet, and a significant portion of our one-year target is based on the expectation that future projects are commissioned on time and on budget. This is partially offset by the company’s mostly long-term PPAs with investment-grade counterparties.
E V / E B I T D A C H E C K
Our one-year target of $7.00 per share implies an EV/EBITDA multiple of 10.25x on 2010E EBITDA. In our view, this multiple is justified by the company’s terrific capacity growth prospects, as well as the upside potential for its uncontracted green credits. Exhibit 3.19 sensitizes this valuation approach to various EBITDA multiples as well as changes to our forecast 2010 EBITDA. We have also included our two-year target of $7.50, which implies a 10.1x EV multiple on 2011E EBITDA.
Our project-probability DCF analysis suggests a one-year share price of $7.04. We give no value for “brag-a-watts.”
We calculate a net asset value per share of $6.95.

Alternative & Renewable Energy August 2008
118
Exhibit 3.17: DCF Analysis of KHD Suggests $7.04/Share One Year Out
Gross Effective Capacity Prob. of AdjustedProject Capacity Capacity Factor DCF Success DCF Comments
(MW) (MW) (%) ($/share) (%) ($/share)
Belly River 3 3 46% $0.04 100% $0.04
Waterton 3 3 51% $0.04 100% $0.04
St. Mary 2 2 63% $0.04 100% $0.04
Taylor (hydro) 13 7 39% $0.08 100% $0.08
Akolkolex 10 10 60% $0.16 100% $0.16
Pingston 45 23 45% $0.32 100% $0.32
Upper Mamquam 25 25 45% $0.35 100% $0.35
Ragged Chute 7 7 62% $0.11 100% $0.11
Moose Rapids 1 1 50% $0.02 100% $0.02
Appleton 1 1 54% $0.02 100% $0.02
Galetta 2 2 56% $0.02 100% $0.02
Misema 3 3 47% $0.05 100% $0.05
Bone Creek 18 18 46% $0.18 90% $0.17 Construction risk remains.
Clemina Creek 11 11 34% $0.07 90% $0.06 Construction risk remains.
Serpentine Creek 10 10 40% $0.09 90% $0.08 Construction risk remains.
English Creek 5 5 46% $0.06 90% $0.05 Construction risk remains.
Island Falls 20 10 53% $0.13 50% $0.06 Permitting and financing incomplete.
Dunvegan 100 100 68% $1.34 10% $0.13 8 years of delays continue.
(Hydro various) 260 260 ~45% $2.34 0% $0.00 Expect over 55 MW to be bid soon.
Cowley Ridge 21 21 29% $0.19 100% $0.19
Cowley North 20 20 28% $0.17 100% $0.17
Sinnot 7 7 27% $0.05 100% $0.05
Taylor (wind) 3 3 22% $0.02 100% $0.02
Soderglen 71 35 39% $0.55 100% $0.55
Melancthon I 68 68 33% $0.99 100% $0.99
Le Nordais 99 99 19% $0.75 100% $0.75
Melancthon II 132 132 30% $0.83 90% $0.75 Expected online no later than November 2008.
Wolfe Island 198 198 34% $1.57 75% $1.18 Expected online no later than March 2009.
Royal Road 18 18 30% $0.16 50% $0.08 Permitting and financing incomplete.
New Richmond 66 66 31% $0.22 25% $0.06 PPA secured in Hydro-Quebec 2,000 MW RFP.
St. Valentin 50 50 33% $0.15 25% $0.04 PPA secured in Hydro-Quebec 2,000 MW RFP.
(AB wind various) 100 75 ~30% $0.14 0% $0.00 Nothing announced.
(MB wind various) 1,000 1,000 ~30% $4.75 0% $0.00 Nothing announced.
(ON wind various) 127 127 ~30% $0.87 0% $0.00 Expect 70 MW to be bid soon.
Grande Prairie 25 25 74% $0.39 100% $0.39
2,542 2,443 $7.04
Source: Company reports; Scotia Capital estimates.
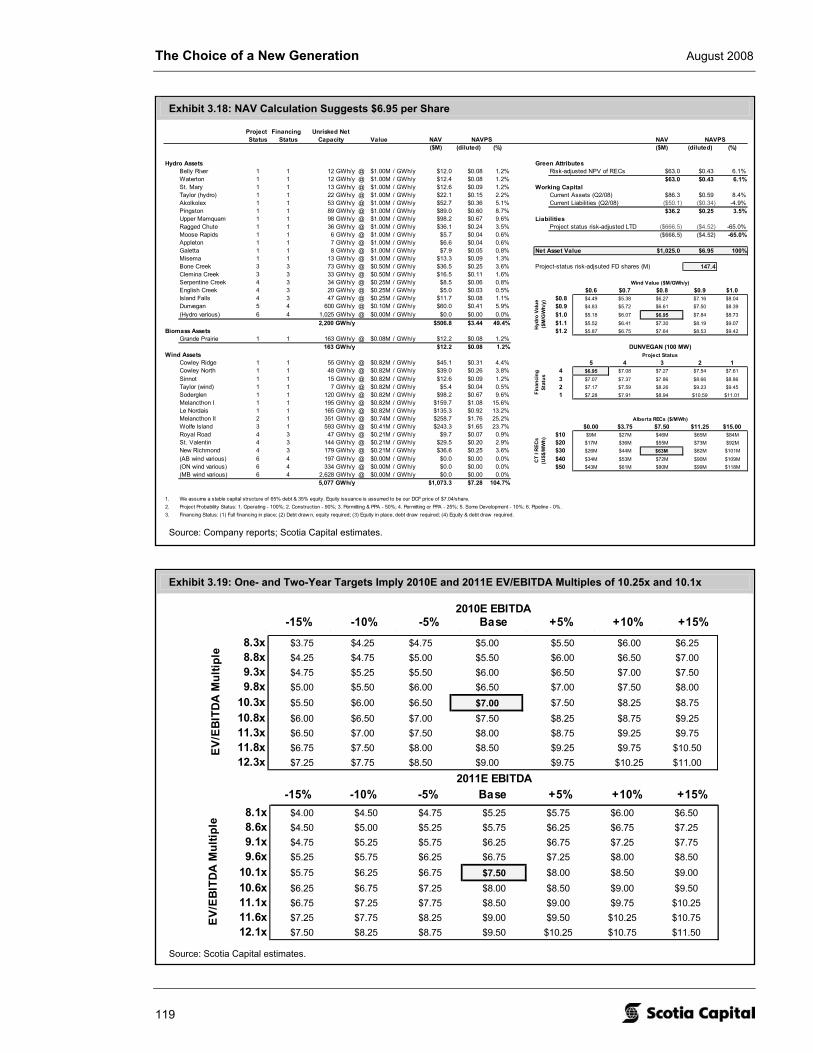
The Choice of a New Generation August 2008
119
Exhibit 3.18: NAV Calculation Suggests $6.95 per Share
Project Financing Unrisked NetStatus Status Capacity Value NAV NAV
($M) (diluted) (%) ($M) (diluted) (%)
Hydro Assets Green AttributesBelly River 1 1 12 GWh/y @ $1.00M / GWh/y $12.0 $0.08 1.2% Risk-adjusted NPV of RECs $63.0 $0.43 6.1%Waterton 1 1 12 GWh/y @ $1.00M / GWh/y $12.4 $0.08 1.2% $63.0 $0.43 6.1%St. Mary 1 1 13 GWh/y @ $1.00M / GWh/y $12.6 $0.09 1.2% Working CapitalTaylor (hydro) 1 1 22 GWh/y @ $1.00M / GWh/y $22.1 $0.15 2.2% Current Assets (Q2/08) $86.3 $0.59 8.4%Akolkolex 1 1 53 GWh/y @ $1.00M / GWh/y $52.7 $0.36 5.1% Current Liabilities (Q2/08) ($50.1) ($0.34) -4.9%Pingston 1 1 89 GWh/y @ $1.00M / GWh/y $89.0 $0.60 8.7% $36.2 $0.25 3.5%Upper Mamquam 1 1 98 GWh/y @ $1.00M / GWh/y $98.2 $0.67 9.6% LiabilitiesRagged Chute 1 1 36 GWh/y @ $1.00M / GWh/y $36.1 $0.24 3.5% Project status risk-adjusted LTD ($666.5) ($4.52) -65.0%Moose Rapids 1 1 6 GWh/y @ $1.00M / GWh/y $5.7 $0.04 0.6% ($666.5) ($4.52) -65.0%Appleton 1 1 7 GWh/y @ $1.00M / GWh/y $6.6 $0.04 0.6%Galetta 1 1 8 GWh/y @ $1.00M / GWh/y $7.9 $0.05 0.8% Net Asset Value $1,025.0 $6.95 100%Misema 1 1 13 GWh/y @ $1.00M / GWh/y $13.3 $0.09 1.3%Bone Creek 3 3 73 GWh/y @ $0.50M / GWh/y $36.5 $0.25 3.6% Project-status risk-adjsuted FD shares (M) 147.4Clemina Creek 3 3 33 GWh/y @ $0.50M / GWh/y $16.5 $0.11 1.6%Serpentine Creek 4 3 34 GWh/y @ $0.25M / GWh/y $8.5 $0.06 0.8%English Creek 4 3 20 GWh/y @ $0.25M / GWh/y $5.0 $0.03 0.5% $6.95 $0.6 $0.7 $0.8 $0.9 $1.0Island Falls 4 3 47 GWh/y @ $0.25M / GWh/y $11.7 $0.08 1.1% $0.8 $4.49 $5.38 $6.27 $7.16 $8.04Dunvegan 5 4 600 GWh/y @ $0.10M / GWh/y $60.0 $0.41 5.9% $0.9 $4.83 $5.72 $6.61 $7.50 $8.39(Hydro various) 6 4 1,025 GWh/y @ $0.00M / GWh/y $0.0 $0.00 0.0% $1.0 $5.18 $6.07 $6.95 $7.84 $8.73
2,200 GWh/y $506.8 $3.44 49.4% $1.1 $5.52 $6.41 $7.30 $8.19 $9.07Biomass Assets $1.2 $5.87 $6.75 $7.64 $8.53 $9.42
Grande Prairie 1 1 163 GWh/y @ $0.08M / GWh/y $12.2 $0.08 1.2%163 GWh/y $12.2 $0.08 1.2%
Wind AssetsCowley Ridge 1 1 55 GWh/y @ $0.82M / GWh/y $45.1 $0.31 4.4% $6.95 5 4 3 2 1Cowley North 1 1 48 GWh/y @ $0.82M / GWh/y $39.0 $0.26 3.8% 4 $6.95 $7.08 $7.27 $7.54 $7.61Sinnot 1 1 15 GWh/y @ $0.82M / GWh/y $12.6 $0.09 1.2% 3 $7.07 $7.37 $7.86 $8.66 $8.86Taylor (wind) 1 1 7 GWh/y @ $0.82M / GWh/y $5.4 $0.04 0.5% 2 $7.17 $7.59 $8.26 $9.23 $9.45Soderglen 1 1 120 GWh/y @ $0.82M / GWh/y $98.2 $0.67 9.6% 1 $7.28 $7.91 $8.94 $10.59 $11.01Melancthon I 1 1 195 GWh/y @ $0.82M / GWh/y $159.7 $1.08 15.6%Le Nordais 1 1 165 GWh/y @ $0.82M / GWh/y $135.3 $0.92 13.2%Melancthon II 2 1 351 GWh/y @ $0.74M / GWh/y $258.7 $1.76 25.2%Wolfe Island 3 1 593 GWh/y @ $0.41M / GWh/y $243.3 $1.65 23.7% $63.00 $0.00 $3.75 $7.50 $11.25 $15.00Royal Road 4 3 47 GWh/y @ $0.21M / GWh/y $9.7 $0.07 0.9% $10 $9M $27M $46M $65M $84MSt. Valentin 4 3 144 GWh/y @ $0.21M / GWh/y $29.5 $0.20 2.9% $20 $17M $36M $55M $73M $92MNew Richmond 4 3 179 GWh/y @ $0.21M / GWh/y $36.6 $0.25 3.6% $30 $26M $44M $63M $82M $101M(AB wind various) 6 4 197 GWh/y @ $0.00M / GWh/y $0.0 $0.00 0.0% $40 $34M $53M $72M $90M $109M(ON wind various) 6 4 334 GWh/y @ $0.00M / GWh/y $0.0 $0.00 0.0% $50 $43M $61M $80M $99M $118M(MB wind various) 6 4 2,628 GWh/y @ $0.00M / GWh/y $0.0 $0.00 0.0%
5,077 GWh/y $1,073.3 $7.28 104.7%
1. We assume a stable capital structure of 65% debt & 35% equity. Equity issuance is assumed to be our DCF price of $7.04/share.2. Project Probability Status: 1. Operating - 100%; 2. Construction - 90%; 3. Permitting & PPA - 50%; 4. Permitting or PPA - 25%; 5. Some Development - 10%; 6. Pipeline - 0%.3. Financing Status: (1) Full f inancing in place; (2) Debt draw n, equity required; (3) Equity in place, debt draw required; (4) Equity & debt draw required.
Alberta RECs ($/MWh)
CT
I REC
s (U
S$/M
Wh)
Wind Value ($M/GWh/y)
NAVPS NAVPS
Project Status
Fina
ncin
g St
atus
Hyd
ro V
alue
($
M/G
Wh/
y)
DUNVEGAN (100 MW)
Source: Company reports; Scotia Capital estimates.
Exhibit 3.19: One- and Two-Year Targets Imply 2010E and 2011E EV/EBITDA Multiples of 10.25x and 10.1x
2010E EBITDA7 124546.059 131872.3 139198.54 $146,525 153851.0135 161177.3 168503.49
8.3x $3.75 $4.25 $4.75 $5.00 $5.50 $6.00 $6.258.8x $4.25 $4.75 $5.00 $5.50 $6.00 $6.50 $7.009.3x $4.75 $5.25 $5.50 $6.00 $6.50 $7.00 $7.509.8x $5.00 $5.50 $6.00 $6.50 $7.00 $7.50 $8.00
10.3x $5.50 $6.00 $6.50 $7.00 $7.50 $8.25 $8.7510.8x $6.00 $6.50 $7.00 $7.50 $8.25 $8.75 $9.2511.3x $6.50 $7.00 $7.50 $8.00 $8.75 $9.25 $9.7511.8x $6.75 $7.50 $8.00 $8.50 $9.25 $9.75 $10.5012.3x $7.25 $7.75 $8.50 $9.00 $9.75 $10.25 $11.00
EV/
EBIT
DA
Mul
tiple
-15% -10% -5% Base +5% +10% +15%
2011E EBITDA7.5 130068.96 137720.07 145371.19 $153,022 160673.42 168324.54 175975.65
8.1x $4.00 $4.50 $4.75 $5.25 $5.75 $6.00 $6.508.6x $4.50 $5.00 $5.25 $5.75 $6.25 $6.75 $7.259.1x $4.75 $5.25 $5.75 $6.25 $6.75 $7.25 $7.759.6x $5.25 $5.75 $6.25 $6.75 $7.25 $8.00 $8.50
10.1x $5.75 $6.25 $6.75 $7.50 $8.00 $8.50 $9.0010.6x $6.25 $6.75 $7.25 $8.00 $8.50 $9.00 $9.5011.1x $6.75 $7.25 $7.75 $8.50 $9.00 $9.75 $10.2511.6x $7.25 $7.75 $8.25 $9.00 $9.50 $10.25 $10.7512.1x $7.50 $8.25 $8.75 $9.50 $10.25 $10.75 $11.50
EV/
EBIT
DA
Mul
tiple
-15% -10% -5% Base +5% +10% +15%
Source: Scotia Capital estimates.

Alternative & Renewable Energy August 2008
120
Exhibit 3.22: Forecast Capacity and Generation Through 2012
162 230 364 496 747 765 765 881
465707
9221,122
1,836
2,276 2,334 2,334
2005 2006 2007 2008E 2009E 2010E 2011E 2012E
Year-End Installed Capacity (MW) Generation (GWh/y)
We assume 116 MW of Quebec wind farms are
commissioned at the end of 2012.
Source: Company reports; Scotia Capital estimates.
Exhibit 3.23: Forecast Revenue Through 2012
$29 $48 $64 $87 $159 $202 $211 $213
$62$68 $69
$78$87 $89 $90 $91
2005 2006 2007 2008E 2009E 2010E 2011E 2012E
Revenue ($M) $/MWh
Source: Scotia Capital estimates.
Exhibit 3.20: 2009E Generation by Province
Alberta24%
Ontario53%
Quebec9%
British Columbia
14%
Source: Scotia Capital estimates.
Exhibit 3.21: 2009E Generation by Technology
Wind72%
Biomass7% Hydro
21%
Source: Scotia Capital estimates.
Financial Forecast
8 5 0 + M W O F C A P A C I T Y O N L I N E B Y 2 0 1 2
We expect close to 550 MW of new installed capacity to be commissioned by the end of 2012. Specifically, we believe 53.6 MW of hydro facilities will be installed in B.C. (43.6 MW) and Ontario (10 MW) by the end of next year, and possibly an additional 55 MW of future B.C. projects further down the road (~20% of its B.C. pipeline). We also estimate 330 MW of new wind power capacity to come online by mid-2009 (i.e., Melancthon II in Q4/08 and Wolfe Island in Q1/09). We forecast the 18 MW Royal Road project (2010) and up to another 127 MW of wind capacity (2011/12) to be online in Ontario, 75 MW in Alberta (2012), and 116 MW in Quebec (2012). Our financial forecast does not include any wind power development in Manitoba, for now. While we don’t expect to see any further biomass projects in the short- to mid-term, there is a possibility that KHD may venture into solar power development, although we have not accounted for this in our financial forecast. As a result of these increases to KHD’s operating portfolio over the next several years, we expect annual electricity generation to increase by 1,200+ GWh/y to 2,333 GWh/y by 2012.
In our view, 2009E revenue will soar to $159.4 million from our $87.5 million forecast for 2008 due to over 325 MW of newly installed wind capacity in Ontario, as well as 53.6 MW of new hydro capacity in B.C. and Ontario. We think that KHD’s 2009 revenue mix will be 72% from wind power, 21% from hydro, and 7% from biomass (Exhibit 3.21). We believe the average power price earned by KHD in 2008 will range between $78/MWh and $80/MWh.
We expect at least 550 MW of new installed capacity to be commissioned by the end of 2012.
Our financial forecast does not include any wind power development in Manitoba, for now.
We expect 2009E revenue to soar by 80% to $159.4 million.

The Choice of a New Generation August 2008
121
Exhibit 3.24: Forecast EBITDA Through 2012
$16 $27 $38 $55 $112 $147 $153 $155
$34$39 $41
$49
$61 $64 $66 $67
2005 2006 2007 2008E 2009E 2010E 2011E 2012E
EBITDA ($M) $/MWh
Source: Company reports; Scotia Capital estimates.
Exhibit 3.25: Forward EBITDA & EPS Profile
($0.05)
$0.00
$0.05
$0.10
$0.15
$0.20
$0.25
Q1-06 Q1-07 Q1-08 Q1-09E Q1-10E
Ear
ning
s pe
r Sh
are
($10,000)
$0
$10,000
$20,000
$30,000
$40,000
$50,000
EBIT
DA
(000
s)
Quarterly EBITDA
Quarterly EPS
Source: Scotia Capital estimates.
Our 2009 financial forecast estimates EBITDA at $112.3 million, or about double our forecast 2008 EBITDA of $54.7 million. On a per MWh basis, we believe operating costs will ease slightly to $20/MWh in 2009 from our estimate in 2008 of $22/MWh. In 2007, operating costs were $20.85/MWh.
We expect 2009 net income to increase to $0.19 per share, or by 135% year over year. The surge in our forecast net income is primarily due to added power generation, and somewhat due to higher power prices received.
K E Y F I N A N C I A L F O R E C A S T A S S U M P T I O N S
New capacity: With the addition of new capacity, we do not speculate what specific day in a quarter new capacity will come online. Accordingly, and similar to the half-year CCA rule, we apply a 50% weight to generation produced from new capacity in its initial quarter.
Capital costs. For the most part, KHD has stated its expected capital costs for its development projects. For those (unannounced) projects that we assume are commissioned within our financial forecast, we have estimated capital costs for wind projects that range between $1.75 million to $2.75 million, and for hydro projects, between $2.65 million to $3 million (excluding Dunvegan).
Project financing. Our financial forecast assumes that growth opportunities will be financed using Canadian Hydro Developers’ targeted capital structure of 65% debt and 35% equity.
Look for 8¢ of 2008E EPS followed by a jump to 19¢ in 2009E.
KHD’s targeted capital structure is 65% debt and 35% equity.

Alternative & Renewable Energy August 2008
122
Seasonality profile. We have used the unweighted average seasonality profiles of KHD’s current hydro and wind facilities as the basis for our production forecasts.
• Our hydro production profile assumes the following seasonality: Q1 16%; Q2 35%; Q3 28%; and Q4 21%.
• Our wind production profile is as follows: Q1 30%; Q2 20%; Q3 16%; and Q4 34%.
Free cash flow. We have not applied excess free cash flow on the balance sheet, for now, other than to finance those projects that we believe will be commissioned within our financial forecast. Cash on hand could be used to: (1) prepay outstanding principal balances on its debt; (2) implement (i) a regular dividend, (ii) a share buyback, and/or (iii) a one-time special dividend; (3) invest in other organic growth opportunities; and (4) enter into an acquisition, joint venture, or similar transaction.
We have not applied excess free cash flow on the balance sheet, for now.

123
The Choice of a N
ew G
eneration A
ugust 2008
Exhibit 3.26: Canadian Hydro Developers – Income Statement
($000s) 2006A 2007A Q108 Q208 Q308E Q408E 2008E Q109E Q209E Q309E Q409E 2009E 2010E 2011E
Energy Sales $47,653 $63,195 $19,275 $19,538 $18,201 $29,841 $86,856 $33,017 $35,170 $32,460 $58,118 $158,765 $201,766 $210,050Revenue Rebate $535 $562 $186 $123 $103 $191 $604 $176 $130 $108 $200 $614 $641 $670Total Revenue $48,188 $63,757 $19,461 $19,661 $18,305 $30,033 $87,460 $33,193 $35,300 $32,568 $58,318 $159,379 $202,407 $210,720
Operating Costs $16,662 $19,213 $5,150 $7,483 $5,461 $6,555 $24,649 $8,253 $8,579 $9,186 $10,828 $36,845 $45,690 $47,763Amortization $11,503 $15,508 $5,029 $5,100 $5,436 $5,581 $21,147 $5,375 $9,133 $9,133 $10,030 $33,671 $47,458 $48,471Admin. (incl. stock comp) $4,270 $6,395 $2,535 $1,819 $1,902 $1,902 $8,158 $2,565 $2,565 $2,565 $2,565 $10,260 $10,192 $9,934Interest on LTD $13,056 $14,847 $4,424 $4,743 $5,438 $7,869 $22,474 $7,869 $11,717 $11,717 $12,941 $44,244 $54,592 $55,678Interest income ($7,047) ($1,451) ($205) ($175) ($733) ($321) ($1,434) ($346) ($437) ($515) ($586) ($1,884) ($4,529) ($7,674)Write-off (gain) of asset/prospect sales $573 $442 $0 $188 $0 $0 $188 $0 $0 $0 $0 $0 $0 $0FX loss (gain) ($788) $1,585 ($201) ($5,081) $0 $0 ($5,282) $0 $0 $0 $0 $0 $0 $0Loss (gain) on derivatives $73 ($363) $0 $0 $0 $0 $0 $0 $0 $0 $0 $0 $0 $0Other ($142) $1,664 ($201) ($4,893) $0 $0 ($5,094) $0 $0 $0 $0 $0 $0 $0Total expenses $38,302 $56,176 $16,732 $14,077 $17,504 $21,586 $69,900 $23,716 $31,557 $32,086 $35,778 $123,136 $153,403 $154,172
Earnings before tax expense $9,886 $7,581 $2,729 $5,584 $800 $8,446 $17,560 $9,477 $3,743 $483 $22,540 $36,243 $49,004 $56,548Current tax $822 $1,964 $138 $1,097 $30 $317 $1,582 $355 $140 $18 $845 $1,359 $1,838 $2,121Future tax $168 ($2,726) $782 $1,604 $170 $1,795 $4,351 $2,014 $795 $103 $4,790 $7,702 $10,413 $12,016Net income $8,896 $8,343 $1,809 $2,883 $600 $6,335 $11,627 $7,108 $2,807 $362 $16,905 $27,182 $36,753 $42,411
Basic shares - opening 118,223.9 119,652.0 141,835.0 143,378.7 143,488.7 143,488.7 141,835.0 143,488.7 143,488.7 143,488.7 143,488.7 143,488.7 143,488.7 143,488.7Plus: Equity issued/warrant conversion 1,428.1 22,183.0 1,543.8 0.0 0.0 0.0 1,543.8 0.0 0.0 0.0 0.0 0.0 0.0 0.0Less: Share buyback 0.0 0.0 0.0 0.0 0.0 0.0 0.0 0.0 0.0 0.0 0.0 0.0 0.0 0.0Basic shares - closing 119,652.0 141,835.0 143,378.7 143,488.7 143,488.7 143,488.7 143,488.7 143,488.7 143,488.7 143,488.7 143,488.7 143,488.7 143,488.7 143,488.7Average Shares O/S - Basic (000s) 119,297.7 130,648.0 142,001.3 143,413.2 143,488.7 143,488.7 143,098.0 143,488.7 143,488.7 143,488.7 143,488.7 143,488.7 143,488.7 143,488.7Average Dilution (000s) 2,689.5 2,667.7 2,048.3 1,712.5 1,712.5 1,712.5 1,796.5 1,712.5 1,712.5 1,712.5 1,712.5 1,712.5 1,712.5 1,712.5Average Shares O/S - Diluted (000s) 121,987.2 133,315.7 144,049.6 145,125.7 145,201.2 145,201.2 144,894.4 145,201.2 145,201.2 145,201.2 145,201.2 145,201.2 145,201.2 145,201.2
EPS (Basic) $0.07 $0.06 $0.01 $0.02 $0.00 $0.04 $0.08 $0.05 $0.02 $0.00 $0.12 $0.19 $0.26 $0.30EPS (Diluted) $0.07 $0.06 $0.01 $0.02 $0.00 $0.04 $0.08 $0.05 $0.02 $0.00 $0.12 $0.19 $0.25 $0.29
EBITDA $27,256 $38,149 $11,776 $10,359 $10,941 $21,576 $54,652 $22,375 $24,156 $20,817 $44,925 $112,273 $146,525 $153,022EBITDA/MWh $39 $41 $47 $40 $45 $59 $49 $59 $57 $54 $69 $61 $64 $66
Source: Company reports; Scotia Capital estimates.

Alternative &
Renew
able Energy A
ugust 2008
124 Exhibit 3.27: Canadian Hydro Developers – Balance Sheet
($000s) 2006A 2007A Q108 Q208 Q308E Q408E 2008E Q109E Q209E Q309E Q409E 2009E 2010E 2011E
AssetsCurrent Assets
Cash and cash equivalents $61,669 $22,785 $22,791 $73,311 $32,108 $34,628 $34,628 $43,671 $51,511 $58,608 $87,833 $87,833 $164,459 $242,855Accounts receivable $13,530 $11,897 $12,238 $10,442 $10,442 $10,442 $10,442 $10,442 $10,442 $10,442 $10,442 $10,442 $10,442 $10,442Revenue rebate $594 $0 $0 $0 $0 $0 $0 $0 $0 $0 $0 $0 $0 $0Prepaid expenses $535 $568 $929 $1,597 $1,597 $1,597 $1,597 $1,597 $1,597 $1,597 $1,597 $1,597 $1,597 $1,597Taxes receivable $0 $0 $0 $0 $0 $0 $0 $0 $0 $0 $0 $0 $0 $0Derivative financial instruments $0 $0 $3,502 $931 $931 $931 $931 $931 $931 $931 $931 $931 $931 $931
$76,328 $35,250 $39,460 $86,281 $45,078 $47,598 $47,598 $56,641 $64,481 $71,578 $100,803 $100,803 $177,429 $255,825
Deferred financing costs $2,628 $0 $0 $0 $0 $0 $0 $0 $0 $0 $0 $0 $0 $0Capital assets $547,797 $797,387 $796,379 $1,018,600 $1,310,313 $1,388,243 $1,388,243 $1,414,603 $1,440,625 $1,451,267 $1,448,756 $1,448,756 $1,431,288 $1,435,329Development costs $60,289 $117,277 $126,260 $34,360 $34,360 $34,360 $34,360 $34,360 $34,360 $34,360 $34,360 $34,360 $34,360 $34,360Total Assets $687,042 $949,914 $962,099 $1,139,241 $1,389,751 $1,470,201 $1,470,201 $1,505,604 $1,539,466 $1,557,206 $1,583,919 $1,583,919 $1,643,078 $1,725,515
LiabilitiesCurrent Liabilities
Revolver $0 $0 $0 $0 $0 $0 $0 $0 $0 $0 $0 $0 $0 $0A/P and accrued liabilities $9,587 $12,084 $12,112 $45,164 $45,164 $45,164 $45,164 $45,164 $45,164 $45,164 $45,164 $45,164 $45,164 $45,164CP LTD $1,996 $2,825 $2,853 $2,191 $11,500 $12,000 $12,000 $12,500 $13,000 $13,500 $14,000 $14,000 $16,000 $18,000Deferred credit $85 $0 $0 $0 $0 $0 $0 $0 $0 $0 $0 $0 $0 $0Derivative liability $0 $1,703 $1,104 $1,763 $1,763 $1,763 $1,763 $1,763 $1,763 $1,763 $1,763 $1,763 $1,763 $1,763Other liabilities (incl. bridge for now) $0 $72,300 $72,300 $0 $0 $0 $0 $0 $0 $0 $0 $0 $0 $0Taxes payable $100 $304 $0 $973 $973 $973 $973 $973 $973 $973 $973 $973 $973 $973
$11,768 $89,216 $88,369 $50,091 $59,400 $59,900 $59,900 $60,400 $60,900 $61,400 $61,900 $61,900 $63,900 $65,900
Long-Term Debt $314,331 $339,631 $339,164 $552,530 $792,461 $863,781 $863,781 $889,062 $918,322 $934,597 $938,616 $938,616 $946,608 $970,618Future income taxes $22,017 $39,091 $39,805 $41,408 $41,578 $43,373 $43,373 $45,387 $46,182 $46,285 $51,074 $51,074 $61,488 $73,504Total Liabilities $348,116 $467,938 $467,338 $644,029 $893,439 $967,054 $967,054 $994,849 $1,025,404 $1,042,282 $1,051,590 $1,051,590 $1,071,996 $1,110,022
Shareholders' EquityShare capital $313,852 $448,031 $454,365 $454,703 $454,703 $454,703 $454,703 $454,703 $454,703 $454,703 $454,703 $454,703 $454,703 $454,703Contributed surplus $2,186 $4,299 $4,840 $5,299 $5,299 $5,299 $5,299 $5,299 $5,299 $5,299 $5,299 $5,299 $5,299 $5,299Retained earnings $22,888 $31,349 $33,158 $36,041 $36,641 $42,976 $42,976 $50,084 $52,891 $53,253 $70,158 $70,158 $106,911 $149,322Accumulated comprehensive income (loss) $0 ($1,703) $2,398 ($831) ($331) $169 $169 $669 $1,169 $1,669 $2,169 $2,169 $4,169 $6,169Total Shareholders Equity $338,926 $481,976 $494,761 $495,212 $496,312 $503,147 $503,147 $510,755 $514,062 $514,924 $532,329 $532,329 $571,082 $615,493
Total Liabilities and Shareholders Equity $687,042 $949,914 $962,099 $1,139,241 $1,389,751 $1,470,201 $1,470,201 $1,505,604 $1,539,466 $1,557,206 $1,583,919 $1,583,919 $1,643,078 $1,725,515
Source: Company reports; Scotia Capital estimates.

125
The Choice of a N
ew G
eneration A
ugust 2008
Exhibit 3.28: Canadian Hydro Developers – Cash Flow Statement
($000s) 2006A 2007A Q108 Q208 Q308E Q408E 2008E Q109E Q209E Q309E Q409E 2009E 2010E 2011E
Operating ActivitiesNet (loss) earnings $8,896 $8,343 $1,809 $2,883 $600 $6,335 $11,627 $7,108 $2,807 $362 $16,905 $27,182 $36,753 $42,411Adjustments for:
Amortization $11,503 $15,508 $5,029 $5,100 $5,436 $5,581 $21,147 $5,375 $9,133 $9,133 $10,030 $33,671 $47,458 $48,471(Gain) loss on derivative financial instruments $229 ($100) $0 $0 $0 $0 $0 $0 $0 $0 $0 $0 $0 $0Stock compensation expense $1,439 $2,288 $722 $584 $500 $500 $2,306 $500 $500 $500 $500 $2,000 $2,000 $2,000(Gain) loss on sale of capital assets &/or development prospects $573 $442 $0 $188 $0 $0 $188 $0 $0 $0 $0 $0 $0 $0Future income tax (recovery) expense $168 ($2,726) $782 $1,604 $170 $1,795 $4,351 $2,014 $795 $103 $4,790 $7,702 $10,413 $12,016
Cash flow from operations $22,808 $23,755 $8,342 $10,359 $6,706 $14,211 $39,618 $14,997 $13,236 $10,098 $32,225 $70,555 $96,624 $104,898Net change in non-cash working capital balances ($9,544) $2,133 $2,610 $35,153 $0 $0 $37,763 $0 $0 $0 $0 $0 $0 $0
$13,264 $25,888 $10,952 $45,512 $6,706 $14,211 $77,381 $14,997 $13,236 $10,098 $32,225 $70,555 $96,624 $104,898
Financing ActivitiesNet issue (buyback) of common shares $2,012 $53,901 $6,084 $213 $0 $0 $6,297 $0 $0 $0 $0 $0 $0 $0Long-term debt advances $148,000 $10,000 $0 $214,400 $251,740 $74,321 $540,460 $28,781 $32,760 $19,775 $7,519 $88,835 $23,992 $42,010Long-term debt repayments ($1,838) ($1,475) ($439) ($1,696) ($2,500) ($2,500) ($7,135) ($3,000) ($3,000) ($3,000) ($3,000) ($12,000) ($14,000) ($16,000)Credit facilities advances (repayments) ($56,600) $87,970 $0 ($72,300) $0 $0 ($72,300) $0 $0 $0 $0 $0 $0 $0Deferred financing costs ($887) ($85) $0 $0 $0 $0 $0 $0 $0 $0 $0 $0 $0 $0Other $0 $0 $0 $0 $0 $0 $0 $0 $0 $0 $0 $0 $0 $0
$90,687 $150,311 $5,645 $140,617 $249,240 $71,821 $467,322 $25,781 $29,760 $16,775 $4,519 $76,835 $9,992 $26,010
Investing ActivitiesCapital asset additions, bus or prospect acquisitions ($193,141) ($145,923) ($4,441) ($130,222) ($297,149) ($83,512) ($515,324) ($31,734) ($35,156) ($19,775) ($7,519) ($94,184) ($29,990) ($52,512)Development costs ($28,942) ($55,737) ($12,150) ($5,387) $0 $0 ($17,537) $0 $0 $0 $0 $0 $0 $0Working capital acquired on acquisition $0 ($13,423) $0 $0 $0 $0 $0 $0 $0 $0 $0 $0 $0 $0Proceeds on sale of capital assets &/or prospects $0 $0 $0 $0 $0 $0 $0 $0 $0 $0 $0 $0 $0 $0Other $0 $0 $0 $0 $0 $0 $0 $0 $0 $0 $0 $0 $0 $0
($222,083) ($215,083) ($16,591) ($135,609) ($297,149) ($83,512) ($532,861) ($31,734) ($35,156) ($19,775) ($7,519) ($94,184) ($29,990) ($52,512)
Net change in cash and cash equivalents ($118,132) ($38,884) $6 $50,520 ($41,203) $2,520 $11,843 $9,043 $7,839 $7,098 $29,225 $53,205 $76,626 $78,396
Cash and cash equivalents - beginning of period $179,801 $61,669 $22,785 $22,791 $73,311 $32,108 $22,785 $34,628 $43,671 $51,511 $58,608 $34,628 $87,833 $164,459Cash and cash equivalents - end of period $61,669 $22,785 $22,791 $73,311 $32,108 $34,628 $34,628 $43,671 $51,511 $58,608 $87,833 $87,833 $164,459 $242,855
Source: Company reports; Scotia Capital estimates.

Alternative & Renewable Energy August 2008
126
Exhibit 3.29: Management & Directors
John Keating CEO 2,432,315
A Chartered Accountant with more than 20 years financial experience. Mr. Keating is also the founding director of the Independent Power Producers Society of Alberta (IPPSA) and is an active participant in the Clean Air Renewable Energy Coalition.
Ross Keating President, Operations & Development
2,479,500 Mr. Keating brings 20 years experience in hydroelectric design and construction. He is also a founding shareholder.
M. Ann Hughes Corporate Secretary 365,650 Ms. Hughes has been a member of KHD's executive team since 1991. She was admitted to the Bar of Manitoba in 1977 and the Bar of Alberta in 1980.
Kent Brown EVP & CFO 405,500 Prior to 2001, Mr. Brown previously served as CFO and VP Finance at another publicly listed Canadian corporation.
Dennis Erker Board Chair 944,500
Director and Managing Partner with Fairley Erker Advisory Group, a private estate planning and insurance consultant. In addition to having served as the Board Chair for at least the past five years, Mr. Erker is also a director of Corus Entertainment Inc.
Ralph Klein Director 100,000
Premier of Alberta from 1992 through 2006. Since then, Mr. Klein acts as a senior business advisor to Canadian law firm Borden, Ladner, Gervais LLP. Additionally, Mr. Klein serves as director of numerous other organizations.
Douglas Patriquin Director 100,000
Head of Institutional Development at CPCS Transcom Ltd. Mr. Patriquin also severs as President of DPC Consultants, an international strategy and finance consulting firm. Prior to these roles, Mr. Patriquin was EVP, President and Chair of the Canadian Commercial Corporation, a federal Crown corporation.
David Stenason Director 302,500 Mr. Stenason is a partner and director of MacDougall Investment Counsel Inc., a private investment counselling company. He is also a director of Whitemud Resources Inc.
John Thomson Director 150,000 Mr. Thomson has over 25 years experience in the Canadian energy industry as an officer of three different oil and gas companies, and more recently as a director of Compton Petroleum and Crew Energy
Kathy Boutin VP Finance 87,500 Ms. Boutin was promoted to VP Finance in May 2008, after having served as Manager, Finance since 2005. Previously, she was a Senior Accountant with Deloitte & Touche LLP.
Keith O'Regan EVP & COO 300,000 Prior to joing KHD in July 2008, Mr. O'Regan served as regional VP Operations at Maple Leaf Foods and as Director of Operations for JDS Uniphase, Canada.
Edwin Ma General Counsel 151,000 Mr. Ma has served as General and/or Legal Counsel for several companies including SMART Technologies ULC, SAP Canada Inc., and Aspen Technology Inc.
Total 7,818,465
Fully Diluted Shares Outstanding 153,905,873
% Insider Ownership 5.1%
FD Shares Controlled Directly or Indirectly
BackgroundPositionName
Source: SEDI, Company reports; Scotia Capital.
Management & Directors There are few (if any) renewable power developers in Canada that have as much quality management experience as Canadian Hydro’s founding Keating brothers. We have seen only one management-related hiccup at KHD, which resulted in a new COO being announced on October 31, 2007, who then resigned several months later. A new COO has since been installed, which adds to KHD’s bench-strength. Additionally, KHD recently added the position of Executive Vice President to Kent Brown’s continued role as CFO. Ed Ma was recently hired as General Counsel, and Kathy Boutin was promoted to VP Finance. Canadian Hydro Developers has a solid board of directors, including former Alberta Premier Ralph Klein. The company’s management and directors control about 5% of KHD’s shares on a fully diluted basis (Exhibit 3.29).

The Choice of a New Generation August 2008
127
EarthFirst Canada Inc. (EF-T)
Aug 15, 2008: $0.27 1-Yr Target: $0.40 Capitalization Rating: 3-Sector Underperform 1-Yr ROR: 48.1% Shares O/S (M) 103.3 Risk: Caution Warranted 2-Yr Target: $0.40 Total Value ($M) 27.9 IBES EPS 2008E $-0.04 2-Yr ROR: 48.1% Float O/S (M) 87.4 IBES EPS 2009E $-0.06 Float Value ($M) 23.6 Div. (Curr.): $0.00 TSX Weight -- Yield: 0.0%
Valuation: 75% DCF @ 11.5%; 25% NAV
Qtly EPS (FD) (Next Release: Nov-08)
Y/E DECEMBER-31 Mar Jun Sep Dec Year P/E 2008E $-0.01A $-0.00A $-0.00 $-0.00 $-0.02 n.a. 2009E $-0.01 $-0.01 $-0.01 $-0.01 $-0.04 n.a. 2010E $-0.02 $-0.01 $-0.01 $0.01 $-0.03 n.a. 2011E $-0.00 $-0.01 $0.00 $0.02 $0.01 19.3x Industry Specific 2007A 2008 2009 2010 2011 Production (GWh) 0 48 294 498
Note: Historical price multiple calculations use FYE price. Source: Reuters; company reports; Scotia Capital estimates.
At Risk: Everything I N V E S T M E N T H I G H L I G H T S
• The not so good. EarthFirst’s (EarthFirst Canada) only construction project, its 144 MW Dokie I wind farm in B.C., has been hurt by cost overruns (up 10.8%), and a reduced wind resource estimate (down 2.3%).
• The bad. On August 5, the company’s $215.7 million debt financing commitment expired as some of the conditions precedent had not been met. Additionally, about $50 million of sub debt and/or equity is likely needed to fund the cost overruns.
• The ugly. EarthFirst is now uncertain whether it will remain a going concern.
• What’s next. We see one of four scenarios unfolding for EarthFirst over the next several months, each of which could substantially move its share price: (1) bankruptcy; (2) a financial partnership; (3) the company is acquired; or (4) refinancing.
• We have transferred coverage of the common shares of EarthFirst Canada Inc., maintaining a 3-Sector Underperform rating and a one-year target price of $0.40 per share.
• Extremely high-risk profile. Despite our probability-weighted one-year target price of $0.40 per share, we suggest investors switch out of this name in favour of relatively lower-risk intermediate independent power producers that generate strong cash flow, such as Canadian Hydro Developers and/or Boralex.

Alternative & Renewable Energy August 2008
128
Exhibit 4.1: Making Sense of Our 40¢ Target Price
Old DCFOld DCF @ 11.5% discount rate $1.60
Bankruptcy Partner Takeout RefinancingValuation $0.00 $0.40 $0.60 $0.40Probability 25% 25% 25% 25%
$0.00 + $0.10 + $0.15 + $0.10 = $0.35
NAV New DCFValuation $0.60 $0.35Weight 25% 75% Target
$0.15 + $0.26 = $0.40
Source: Scotia Capital estimates.
Summary & Investment Recommendation We have transferred coverage on the common shares of EarthFirst Canada, maintaining a 3-Sector Underperform rating and a one-year target price of $0.40 per share. In light of the company’s recent developments, we now consider four equally weighted scenarios, one of which will likely play out over the next several months. We call this our “New DCF,” and when coupled with a net asset value calculation of 60¢, we arrive at a one-year target price of 40¢ (Exhibit 4.1).
We believe that risk-averse investors would be better served by avoiding this stock until reasonable certainty has been established with respect to the company’s ability to remain a going concern.
We recommend investors consider switching into intermediate, established, and cash flow generating renewable power companies such as Canadian Hydro Developers and Boralex, our two top picks.
F I N A N C I A L F O R E C A S T
In our opinion, EarthFirst’s earnings over the next couple of years are not too important until (1) its financing challenge is straightened out; and (2) its first project is fully commissioned in Q4/09. We look for EarthFirst to turn EPS-positive by 2011. We estimate that EarthFirst will generate 2009 EBITDA of $4.3 million, increasing to $27 million in 2010 and to $48.1 million by 2011. Our forecast is based on a 2010 commissioning of its 45 MW Nuttby wind farm in Nova Scotia as well as its 30 MW Grand Valley wind project in Ontario.
Exhibit 4.2: EarthFirst Canada Inc. – Relative Valuation Metrics
Last SC 1-Year 1-Year MarketCompany Ticker Price Rating Target ROR DCF NAV Cap 2008E 2009E 2010E
8/15/2008 ($M) (x) (x) (x)
Boralex BLX $14.80 1-SO $18.00 22% $18.33 $17.03 $560 9.9x 8.6x 7.6xCanadian Hydro Developers KHD $4.38 1-SO $7.00 60% $7.04 $6.95 $628 20.3x 9.9x 7.6xEarthfirst Canada EF $0.27 3-SU $0.40 48% $0.35 $0.60 $28 n.m. -5.5x -0.9xInnergex Renew able Energy INE $8.25 3-SU $9.50 15% $9.44 $9.55 $194 n.m. 18.4x 7.8xPlutonic Pow er PCC $7.04 2-SP $9.00 28% $9.03 $8.75 $297 n.m. n.m. n.m.Average 35% $341 15.1x 7.8x 5.5x
Company Ticker Beta 2008E 2009E 2010E 2008E 2009E 2010E 2008E 2009E 2010E(x) (x) (x) (x) (x) (x) (x) (x) (x)
Boralex BLX 0.7 28.8x 20.2x 18.6x 2.6x 2.5x 2.3x 10.4x 8.7x 7.7xCanadian Hydro Developers KHD 0.5 54.6x 23.4x 17.3x 7.2x 3.9x 3.1x 16.0x 9.0x 6.6xEarthfirst Canada EF - n.m. n.m. n.m. n.m. 5.5x 0.9x n.m. n.m. 5.6xInnergex Renew able Energy INE - n.m. n.m. 25.5x 27.5x 8.3x 4.2x n.m. 33.6x 10.2xPlutonic Pow er PCC 0.9 n.m. n.m. n.m. n.m. n.m. n.m. n.m. n.m. n.m.Average 0.7 41.7x 21.8x 20.5x 12.4x 5.1x 2.6x 13.2x 17.1x 7.5x
Price to Earnings Price to Sales Price to Cash Flow
Enterprise Value to EBITDA
Source: Bloomberg; Scotia Capital estimates.

The Choice of a New Generation August 2008
129
Capital Markets Profile EarthFirst is a Canadian pure-play wind power developer, with over 2,600 MW of potential generation capacity, including 144 MW of under construction capacity, 226.5 MW of fully permitted projects, and a 45 MW project that has a signed PPA that is yet to be fully permitted. Over 80% of its planned wind power capacity is in British Columbia, with the remainder scattered throughout other Canadian provinces. EarthFirst intends to install its first wind turbines in B.C. by the end of 2008 and tender its two fully permitted projects into the 2008 BC Hydro Clean Power Call.
EarthFirst, established as a partnership between Creststreet Capital Corporation and Earth First Energy Inc., was awarded its first B.C. PPA in mid-2006 – a 20-year fixed-price contract with BC Hydro for the 144 MW Dokie I wind project. In December 2007, EarthFirst completed its initial public offering, raising $140 million to partially finance its $360 million Dokie I project. It did so through the issuance of 50.2 million units at $2.25 per unit and 10.4 million flow-through shares at $2.60 per share. Each unit consists of one common share ($2.10) and one-half warrant ($0.15), with each warrant granting the purchase of one common share at $2.60 per share prior to December 11, 2009.
EarthFirst’s management team is solid. Robert J. Toole, one of EarthFirst’s founders, is a chartered accountant and is also the founder of Creststreet. Earth First Energy’s Ron Percival, holds the title of Vice-Chairman, and has been the Chair of the Independent Power Producers of British Columbia (IPPBC) Wind Committee for the past three years. In June 2008, EarthFirst announced that Linda Chambers, a former executive of TransAlta, joined the company as its President and CEO. Ms. Chambers was recently President of TransAlta’s U.S. operations as well as Executive Vice-President of Generation Technology.
With a market capitalization of less than $30 million, EarthFirst’s common shares trade on the Toronto Stock Exchange under the ticker symbol EF. Insiders and related parties control about 15.5% of the fully diluted outstanding company shares, and Pala Investment Holdings Ltd., a private long-term investment company with US$1 billion under management, owns over 14% of the company. EarthFirst reports in Canadian dollars and its financial statements are prepared in accordance with Canadian GAAP.
Over 80% of EarthFirst’s development capacity is located in B.C., a province that seeks 90% of its new power from renewable sources.
Management experience includes raising $0.5 billion of capital and the installation of almost 150 MW of wind capacity.
Exhibit 4.3: EarthFirst Canada Inc. – Stock Performance
$0.00$0.50$1.00$1.50$2.00$2.50$3.00$3.50$4.00$4.50$5.00
Dec-07 Feb-08 Apr-08 Jun-08
Pric
e
01002003004005006007008009001,000
Dai
ly V
olum
e (0
00s)
EF (Volume) EF (Price) STUTIL (rebased) SPTSX (rebased)
$27.9M
EF$0.27
$2.60$0.22
103.3M
Ticker:Last Price:Market Cap:52 Wk High:52 Wk Low :Shares O/S:
Source: Bloomberg; Scotia Capital.

Alternative & Renewable Energy August 2008
130
Exhibit 4.4: EarthFirst Could Require $200M in Equity Financing by 2010 Over and Above Dokie I Requirements
207 $2.00M $2.10M $2.20M $2.30M $2.40M $2.50M $2.60M25 MW $20M $21M $22M $23M $24M $25M $26M50 MW $40M $42M $44M $46M $48M $50M $52M
Wartenbe 70.5 MW $56M $59M $62M $65M $68M $71M $73M100 MW $80M $84M $88M $92M $96M $100M $104M125 MW $100M $105M $110M $115M $120M $125M $130M
Dokie Exp. 156.0 MW $125M $131M $137M $144M $150M $156M $162M175 MW $140M $147M $154M $161M $168M $175M $182M200 MW $160M $168M $176M $184M $192M $200M $208M
Both 226.5 MW $181M $190M $199M $208M $217M $227M $236M250 MW $200M $210M $220M $230M $240M $250M $260M275 MW $220M $231M $242M $253M $264M $275M $286M300 MW $240M $252M $264M $276M $288M $300M $312M325 MW $260M $273M $286M $299M $312M $325M $338M350 MW $280M $294M $308M $322M $336M $350M $364M375 MW $300M $315M $330M $345M $360M $375M $390M400 MW $320M $336M $352M $368M $384M $400M $416M425 MW $340M $357M $374M $391M $408M $425M $442M
New
Inst
alle
d C
apac
ity
Weighted Average Capital Cost per Installed MW
Source: Scotia Capital estimates.
When Will EarthFirst Need More Equity? With neither operating assets nor free cash flow generation for the near term, we believe EarthFirst will need to access both equity and debt capital markets again in order to complete its Dokie I project. Following its debt financing commitment from WestLB that expired on August 5 due to some funding conditions that were not met, EarthFirst is now $235 million short to complete construction of its first project.
In our opinion, about $50 million now needs to be raised as either equity or subordinated debt, with the remaining $200+ million raised as part of a refinanced debt package.
On top of that, more equity will likely be required to continue developing its project pipeline. We assume project financing will occur at a 60%/40% debt/equity split, in line with the company’s stated target and other Canadian renewable power projects.
It is not unreasonable to assume that both EarthFirst’s 156 MW Dokie Expansion and its 70.5 MW Wartenbe projects receive PPAs in the 2008 BC Hydro Clean Power Call and begin construction in 1H/10. Within our financial forecast, we assume the successful on-time and on-budget completion of these two fully permitted projects. Using an installed capital cost of $2.3 million per MW, EarthFirst could require about $200 million of new equity within the next 12 to 18 months (over and above any equity raised to complete Dokie I). Exhibit 4.4 shows a table of potential new equity requirements by 2010 that we have sensitized to changes in new capacity additions, as well as various installed capital costs per MW.
If its two fully permitted projects receive PPAs in the 2008 BC Hydro Clean Power Call, EarthFirst could require about $200 million of new equity.

The Choice of a New Generation August 2008
131
Exhibit 4.5: Recent Carbon Costs
0 5 10 15 20 25 30 35 40
CCX - Dec/07
CCX - Aug/08
2009E Realized Green Credits - EarthFirst
Forecast for no-till credits in Alberta
CERs from developing countries, 2006
Developing countries - projects
Developing countries - CERs
Budget figure used by OPTI Canada Inc.
EU ETS - Feb/08
EU ETS - Aug/08
US$/Carbon tonne
Source: Globe & Mail; Bloomberg; Scotia Capital.
U P S I D E V A L U E I N E M I S S I O N S S A L E S & T R A D I N G
In our opinion, EarthFirst’s share price could realize up to $0.20 of upside (pre-refinancing) value from reasonable growth in carbon prices coupled with a moderate expansion of its generation asset portfolio. To arrive at this estimate, we assume a US$5.00/CO2e tonne starting price for emissions reductions (Exhibit 4.5), which is above the most recent price available on the Chicago Climate Exchange (CCX). We chose this price rather than using CCX pricing because: (1) carbon prices have consistently been trending higher on the CCX; and (2) prices and volumes on the CCX are likely lower than can be realized in bilateral voluntary markets in Canada and the United States. As a comparison, 2009 EU ETS prices are currently hovering around €24/CO2e tonne ($36/CO2e tonne or about $24/MWh), while Alberta charges $15/CO2e tonne (~$10/MWh) as a non-compliance penalty for its largest industrial emitters. B.C. recently introduced a $10/CO2e tonne cost that will rise to $30/CO2e tonne over the next several years.
In our opinion, EarthFirst’s Dokie I green credits could become eligible for sale on the Chicago Climate Exchange (CCX) as an offset provider. This is contingent on the following assumptions: (1) production occurs prior to the end of 2010; (2) projects remain wholly owned by EarthFirst; (3) electricity sold to BC Hydro is “non-green,” meaning the green attributes of the project’s production will be retained by EarthFirst; and (4) EarthFirst does not sell its green credits to BC Hydro or any other counterparty.
In addition to the possibility of registering as an offset provider, we believe EarthFirst may consider forward-selling its green credits, similar to what some of its peers have done.
North American carbon emissions markets will continue to develop in the near term.
EarthFirst intends to retain its green credits for sales to carbon markets, or directly to third parties seeking to comply with emissions reduction targets.
Alternative & Renewable Energy August 2008
132
Key Investment Risks EarthFirst’s investment risks are typical of many junior Canadian renewable power companies that we follow (i.e., high). Similar to Plutonic Power, with only one project under construction, single plant production volatility will have a greater EPS impact than for companies such as Canadian Hydro Developers and Boralex, which have multiple operating facilities in multiple regions. First Nations support, financing risk, turbine supply constraints, operational risk, and a rapidly evolving renewable regulatory environment are all fairly standard for EarthFirst. Unlike Plutonic Power, which has a full fixed-price contract for its flagship project, EarthFirst has limited protection from cost overruns and time delays.
F I N A N C I N G
Given recent cost overruns as well as a debt financing package that has now expired, leaving EarthFirst $235 million short for completion of its Dokie I project, EarthFirst’s cost of capital will almost certainly increase and its access to capital may be constrained going forward. Additionally, as the company does not yet generate free cash flow, its IRR-based project selection criteria, which targets 9%-15%, could be significantly impaired by higher project financing costs. EarthFirst intends to finance its future projects using 60% debt and 40% equity.
W I N D R E S O U R C E V A R I A B I L I T Y
Wind as a resource is variable and intermittent. The amount of power generated by wind farms is dependent on the quality and consistency of wind flow. Below-forecast wind conditions would hinder EarthFirst’s ability to produce electricity and therefore reduce the company’s revenue and net income. As wind farms do not have power storage capability, there is no offset to wind resource variability risk, other than regional diversification of facility sites. A production volatility range of ±15% annually is typical for wind farms.
L I M I T E D C U S T O M E R S
EarthFirst’s growth is highly dependent on its development projects being awarded long-term, fixed-price contracts from a small group of provinces. BC Hydro, expected to be the company’s main customer for its portfolio of projects, has delayed Calls for Power in past years. Prior to the 2006 CFP, BC Hydro’s last two CFPs were held in 2002 and 1989. A 2004 CFP was planned but was delayed by two years. BC Hydro has delayed the submission deadline for 2008 Clean Power Call bids to November 25, 2008. Future government delays in renewable power RFP bidding could significantly lower our future free cash flow expectations for EarthFirst.
F I R S T N A T I O N S S U P P O R T
Lack of agreements or unfavourable outcomes to negotiations with First Nations groups that claim the land base on which EarthFirst’s projects lie could adversely affect the company’s profitability. Without the support of local First Nations communities, EarthFirst’s projects could be delayed or even terminated. The company has reached settlements with three of four First Nations bands that support the construction and operation of EarthFirst’s wind farm projects on their land.
M A N A G E M E N T
Key management risk is high for EarthFirst, as the company has only 17 full-time employees. EarthFirst is heavily dependent on current management to develop, promote, and realize its future growth opportunities. If a key member of EarthFirst’s management were to leave the company, operations could be significantly impaired.
Annual volatility of wind power generation at a particular site of ±15% is not uncommon.
Key management risk at EarthFirst is high, as the company has only 17 full-time employees.
The Choice of a New Generation August 2008
133
C O S T & T I M I N G O V E R R U N S
There is no certainty that future development and construction cost spending will be within budget or on time. Upon being awarded a government-backed PPA, companies typically set a date to commence power generation. If that date is not met, bid winners could lose expected revenue and may be exposed to financial penalties from either the PPA provider or via debt covenants. On July 4, 2008, EarthFirst announced a 10.8% capital cost increase to $360 million for its 144 MW Dokie I project.
R E G U L A T O R Y E N V I R O N M E N T
EarthFirst’s expected EBITDA is based solely on it capitalizing on various Canadian regulatory bodies’ desires to boost their own renewable portfolios. Federal and provincial government policy changes could alter renewable power-related initiatives and incentives that EarthFirst depends upon. Our financial forecast assumes the continuation of current federal and provincial renewable power targets and policies.
G R E E N C R E D I T M A R K E T S A R E I L L I Q U I D A N D U N D E V E L O P E D
Part of EarthFirst’s corporate strategy includes, where possible, retaining its earned green credits for sales and/or trading on various emissions markets, climate exchanges, or directly to third parties. These markets in Canada and the United States are highly illiquid, mostly voluntary, and undeveloped. Government policies impacting emissions markets are evolving rapidly. While we believe the long-term implications to EarthFirst as a renewable power provider are positive, a high level of uncertainty remains with respect to these green credit markets.
S T A N D A R D O P E R A T I O N A L R I S K
Unplanned and longer-than-planned outages for maintenance and repair will negatively impact EarthFirst’s revenue and profitability, as (1) electricity delivery will decline; and (2) operating costs will likely increase. Unlike a conventional power plant (i.e., coal, natural gas, or nuclear) where an outage could impact the entire facility’s operations, an outage of one wind turbine typically has a minor impact on the generation output of a wind farm. Outage materiality depends on the number of turbines on a wind farm.
W I N D T U R B I N E S U P P L Y
With the current supply-constrained market for turbines, EarthFirst may face longer-than-expected lead times for its turbine orders. As a result of soaring wind turbine demand in Europe and North America, as well as a lack of U.S.-based turbine manufacturers, we expect the current supply/demand imbalance for wind turbines to continue over the near term. Many North American wind farm projects now wait up to two years to receive turbines once an order has been placed.
EarthFirst’s share price is vulnerable if it does not receive environmental and regulatory permits as expected.

Alternative & Renewable Energy August 2008
134
Exhibit 4.6: EarthFirst’s Development Pipeline Summary
Turbines(MW) Months Initiated Completed Initiated Completed Leases EPA Acquired
Under ConstructionDokie I B.C. 144 54 Χ Χ Χ Χ Χ Χ Χ
Advanced StageGrand Valley ON 30 29 Χ Χ Χ Χ ΧNuttby Mountain NS 45 23 Χ Χ Χ ΧDokie Expansion B.C. 156 54 Χ Χ Χ Χ ΧWartenbe B.C. 70 69 Χ Χ Χ Χ ΧBonavista NL 45 45 Χ Χ
Development StageGrand Valley ON 10 29 Χ ΧWindrise AB 99 57 Χ Χ Χ ΧBenchlands SK 70 21 Χ Χ ΧN.E. B.C. 630 17 ΧInterior/Kelly Lake B.C. 500 ΧInterior/Nicola B.C. 200Buffalo Atlee AB 200 33 Χ ΧIslands B.C. 450 26
Wind Data Environmental Interconnection Long-Term
Source: EarthFirst Canada Inc.
E A R L Y - S T A G E P R O J E C T S
Obtaining all environmental and regulatory permits and licences, lease agreements, PPAs, local support, and favourable wind data for all projects may not occur as planned. Project implications from unsuccessful completion of a project’s development and construction process could have major share price implications. Exhibit 4.6 shows a summary of EarthFirst’s current development pipeline.

The Choice of a New Generation August 2008
135
Upcoming Stock Catalysts & Events Below, we have outlined upcoming events that we believe could affect EarthFirst’s stock, as follows:
Next two to three months – Announcement of a refinancing package.
November 2008 – BC Hydro 2008 Clean Power Call bids due. In our opinion, EarthFirst’s current share price reflects a high expectation that the company will bid its Dokie I Expansion (156 MW) and Wartenbe (70.5 MW) projects into BC Hydro’s current call for power.
Q4/08 – Commissioning of Dokie I CRCE Turbine Phase (24 MW).
2H/08-1H/09 – Future project turbine supply agreements. The lack of available wind turbines in the market is no longer a minor issue. Projects are being delayed and economic returns reduced due to the long lead time required to secure turbine supply. If the U.S. production tax credit (PTC) is not renewed beyond the end of 2008, we expect several U.S. wind farm projects to be delayed, likely resulting in a short-term phenomenon of excess wind turbines available for Canadian projects.
1H/09 – Financing of Grand Valley. Completion of debt financing at favourable rates for EarthFirst’s 30 MW Grand Valley project will increase the probability of successful project completion.
1H/09 – BC Hydro 2008 Clean Power Call awards expected, likely after the B.C. government election that is scheduled for May 2009.
Q4/09 – Commissioning of Dokie I Infill Phase (120 MW).
Ongoing – New project announcements and other growth initiatives. EarthFirst intends to grow its asset base by (1) bringing construction-ready and advanced-stage projects under PPAs into production; (2) seeking additional PPAs for other advanced-stage projects; (3) moving the remainder of its portfolio through the development pipeline; and (4) acquiring construction-ready and development-stage projects or operating assets that are accretive to shareholders.
Ongoing – Permitting progress on future projects. Specifically, we look for 2008 permitting progress on EarthFirst’s recent acquisition of the 45 MW Nuttby wind farm in Nova Scotia. EarthFirst acquired the project with a signed PPA and interconnection agreement with Nova Scotia Power Inc.
Ongoing – Other provincial RFP announcements or possible forward sales of green credits.
In our minds, in addition to a refinancing plan announcement, the 2008 BC Hydro Clean Power Call award date is the largest foreseeable stock catalyst for EarthFirst.

Alternative & Renewable Energy August 2008
136
Exhibit 4.7: Dokie I Project Timeline
Q1-08 Q2-08 Q3-08 Q4-08 Q1-09 Q2-09 Q3-09 Q4-09
Site Preparation
Foundations
Turbine Installations
Transmission
Substation
Interconnection
Commissioning
Site Preparation
Foundations
Turbine Installations
Transmission
Substation
Interconnection
Commissioning
CR
CE
(24
MW
)In
fill (
120
MW
)
Source: EarthFirst Canada Inc.
EarthFirst’s Flagship 144 MW Dokie I Wind Farm
Located about 150 kilometres south of Fort St. John, the 144 MW Dokie I wind farm project is adjacent to the 500 kV and 230 kV transmission lines originating from the Bennet Dam. Access to Dokie Ridge is available through the use of existing provincial roads, logging roads, and rail corridors. Exhibit 4.7 shows the company’s Dokie I project timeline.
P O W E R P U R C H A S E A G R E E M E N T S
We expect Dokie I to realize a weighted average PPA price of $85/MWh in its first full year of operations, or mostly a firm energy delivery price of $81/MWh that we have adjusted by 50% of our expected annual consumer price index changes. In August 2006, the Dokie I wind farm project was awarded a 20-year PPA from BC Hydro for 144 MW. The PPA is effective on the commercial operating date (COD), which cannot be before November 1, 2009, unless consent is given by BC Hydro. PPA prices are subject to slight hourly and monthly delivery price adjustments. Additionally, the contract enables Dokie I to increase or decrease its monthly firm energy delivery commitment by up to 10%, subject to various conditions.
We expect pre-COD sales to occur on the installation of the project’s 24 MW CRCE Turbine Phase. Should pre-COD sales take place, EarthFirst must sell its power to third parties. Management believes that realized power prices to third parties could be equivalent to a discount of mid-Columbia prices (Exhibit 4.8). The average on-peak price from March 2007 to March 2008 was US$61.62/MWh, while the off-peak average during that time was US$47.80/MWh. Using a par FX rate, we use a $45/MWh average power price for EarthFirst’s pre-COD sales.
We expect the first full year of Dokie I operations will be in 2010.
EarthFirst could benefit from pre-COD sales at prices equivalent to a discount to the Mid-Columbia power market.

The Choice of a New Generation August 2008
137
Exhibit 4.8: Mid-Columbia Electricity Spot Prices
$0
$10
$20
$30
$40
$50
$60
$70
$80
$90
$100
$110
Apr-07 Jun-07 Aug-07 Oct-07 Dec-07 Feb-08 Apr-08 Jun-08 Aug-08
US$
/MW
h
Off-peak prices have converged w ith on-peak
power prices
On-peak prices
Anomaly
Off-peak prices
Source: Bloomberg; Scotia Capital.
P E R M I T S A N D A P P R O V A L S
EarthFirst has successfully received approvals on all Dokie I permitting to date. Management anticipates that permitting requirements during construction will be met on time as well. Dokie I was originally awarded a B.C. Environmental Assessment Certificate in August 2006 for a project up to 300 MW, a permit required for all B.C. projects over 50 MW. The project also received a Licence of Occupation tenure, permitting the construction of the project.
EarthFirst will connect its wind farm to the BC Hydro 230 kV transmission system running adjacent to the project site. A British Columbia Transmission Corporation (BCTC) Preliminary Interconnection Study Report confirmed that the B.C. transmission system will accommodate electricity generated by Dokie I.
Submission for the ecoENERGY Renewable Power Incentive program (eRPI) is complete. Qualifying projects commissioned between April 1, 2007, and March 31, 2011, will receive $10/MWh over 10 years up to a maximum of $80 million per project and $256 million per company. The incentive is awarded on a first-constructed, first-served basis. We believe Dokie I will qualify for the full incentive.
Three of four First Nations groups have signed MOUs that enable benefit sharing. EarthFirst has engaged relevant First Nations groups in its environmental work, road work, and clearing work to date.

Alternative & Renewable Energy August 2008
138
Exhibit 4.9: Dokie I – Monthly Production Variability
0
5
10
15
20
25
30
35
40
45
Jan Feb Mar Apr May Jun Jul Aug Sep Oct Nov Dec
Expe
cted
Mon
thly
Pow
er P
rodu
ctio
n (G
Wh)
Average
Source: Company reports; Scotia Capital estimates.
W I N D R E S O U R C E
Garrad Hassan, a leading wind energy resource consultant, estimates a mean wind energy production level of 341.5 GWh/y. Furthermore, over a 10-year period, there is a 90% probability of exceeding 297.5 GWh. These estimates are based on wind readings from 11 separate locations at the Dokie I and Dokie Expansion project sites. Based on two recent presentations by Garrad Hassan that examined actual results to their estimations, our forecast capacity factor is 26.2%, or 0.9% below the Garrad Hassan forecast (Exhibit 4.9).
T U R B I N E S U P P L Y A N D W A R R A N T Y / S E R V I C E A G R E E M E N T S
Vestas will supply Vestas V90 wind turbines for the project, with the first turbines used for the CRCE (Canadian Renewable Conservation Expense) phase and the remainder used for the infill construction phase. Delivery of the first turbines occurred in July 2008, with the remainder expected in 2H/09. EarthFirst, through its subcontractor Canadian Projects Limited, is responsible for unloading, erecting, assembling, installing, and ensuring grid connection for the turbines.
We believe EarthFirst’s five-year warranty and service agreement with Vestas is of low quality and reflects a growing trend of poor warranty and service agreements offered by international turbine suppliers. The warranty and service agreements require Vestas to conduct (1) scheduled maintenance, (2) unscheduled maintenance, (3) repair and replacement where necessary, (4) regular status meetings with Dokie I Project representatives, and (5) preparation of regular service reports. Because wind turbine suppliers continue to have the upper hand in a supply-controlled market, strong warranty and service agreements are no longer required by manufacturers to differentiate themselves from their competition and to ensure maximum sales targets are achieved.
C O N S T R U C T I O N
EarthFirst has arranged a construction contract with Canadian Projects Limited, a consulting engineering firm specializing in renewable energy development. The company has 100 years of combined experience constructing power projects across Canada. It has worked on wind farm projects ranging in size from 1 MW to 200 MW.
Management forecasts the capital cost for the CRCE turbine phase, consisting of eight turbines, to be $100 million. EarthFirst intends to fund this amount through a combination of IPO proceeds and debt financing. The high price for the installation of only a few turbines is due to the anticipated completion of infrastructure spending for both phases of the project. We expect the first 24 MW of Dokie I to be online by the end of Q4/08. We use a 50% rule in our financial forecast and assume that 12 MW is online for all of Q1/09, as we do not know when specifically during the quarter operations will commence.
Given a satisfactory level of production for the CRCE turbine phase, EarthFirst will install 40 additional turbines during its infill phase. Commencement of this phase is expected to be four months after electricity production of the test turbines from the above phase. Full electricity production from the additional 40 turbines is expected to start sometime during Q4/09. The anticipated cost of $237 million for this phase will likely be financed primarily through debt facilities.
Our forecast capacity factor for Dokie I is 0.9% below the company’s estimation of 27.1%.
EarthFirst plans to have 24 MW operating by the end of Q4/08.

The Choice of a New Generation August 2008
139
Exhibit 4.10: EarthFirst Was a Big Winner in the 2006 BC Hydro Call for Power
Bidder Name Project Name Nearby City Energy Source Capacity (MW) Energy (GWh/yr)
Plutonic Power Corporation East Toba and Montrose Hydroelectric Project Powell River Water 196 702AESWapiti Energy Corporation AESWapiti Energy Corporation Tumbler Ridge Coal / Biomass 184 1,612Dokie Wind Energy Inc. Dokie Wind Project Chetwynd Wind 180 536Bear Mountain Wind Limited Partnership Bear Mountain Wind Park Dawson Creek Wind 120 3713986314 Canada Inc. Canada - Glacier / Howser / East - Project Nelson Water 91 341Green Island Energy Ltd. Gold River Power Project Gold River Biomass 90 745Kwalsa Energy Limited Partnership Kwalsa Energy Project Mission Water 86 384Anyox Hydro Electric Corp. Anyox and Kitsault River Hydroelectric Projects Alice Arm Water 57 242Compliance Power Corporation Princeton Power Project Princeton Coal / Biomass 56 421Upper Stave Energy Limited Partnership Upper Stave Energy Project Mission Water 55 264Mackenzie Green Energy Inc. Mackenzie Green Energy Centre Mackenzie Biomass / Other 50 441Kwoiek Creek Resources Limited Partnership Kwoiek Creek Hydroelectric Project Lytton Water 50 147Mount Hays Wind Farm Limited Partnership Mount Hays Wind Farm Prince Rupert Wind 25 72Canadian Hydro Developers, Inc. Bone Creek Hydro Project Kamloops Water 20 81Songhees Creek Hydro Inc. Songhees Creek Hydro Project Port Hardy Water 15 61Plutonic Power Corporation Rainy River Hydroelectric Project Gibson Water 15 51Hydromax Energy Ltd. Lower Clowhom Sechelt Water 10 48Hydromax Energy Ltd. Upper Clowhom Sechelt Water 10 45Global Cogenix Industrial Corporation Kookipi Creek Hydroelectric Project Boston Bar Water 10 39Cogenix Power Corporation Log Creek Hydroelectric Project Boston Bar Water 10 38Canadian Hydro Developers, Inc. Clemina Creek Hydro Project Kamloops Water 10 31KMC Energy Corp. Tamihi Creek Hydro Project Chilliwack Water 10 52Valisa Energy Incorporated Serpentine Creek Hydro Project Blue River Water 10 29Synex Energy Resources Ltd. Victoria Lake Hydroelectric Project Port Alice Water 10 39Second Reality Effects Inc. Fries Creek Project Squamish Water 9 41Renewable Power Corp. Tyson Creek Hydro Project Sechelt Water 8 48Hupacasath First Nation Franklin River Hydro Project Port Alberni Water 7 19Axiom Power Inc. Clint Creek Hydro Project Woss Water 6 27EnPower Green Energy Generation Inc. Savona ERG Project Savona Waste Heat 6 41EnPower Green Energy Generation Inc. 150 Mile House ERG Project 150 Mile House Waste Heat 6 34Maroon Creek Hydro Partnership Maroon Creek Hydro Project Terrace Water 5 25Spuzzum Creek Power Corp. Sakwi Creek Run of River Project Agassiz Water 5 21Canadian Hydro Developers, Inc. English Creek Hydro Project Revelstoke Water 5 19Synex Energy Resources Ltd. Barr Creek Hydroelectric Project Tahsis Water 4 15Raging River Power & Mining Inc. Raging River 2 Port Alice Water 4 13Synex Energy Resources Ltd. McKelvie Creek Hydroelectric Project Tahsis Water 3 14Advanced Energy Systems Ltd. Cranberry Creek Power Project Revelstoke Water 3 11District of Lake Country Eldorado Reservoir Kelowna Water 1 4Subtotal 1,439 7,125Brilliant Expansion Power Corporation Brilliant Expansion Project (2) Castlegar Water 120 226Total 1,559 7,351
Reduced to 144 MW due to the requirements to meet
the turbine manufacturer's site suitability criteria
Source: BC Hydro; Scotia Capital.
Alternative & Renewable Energy August 2008
140
Grand Valley The 30 MW Grand Valley wind farm project is located 15 kilometres west of Orangeville, Ontario. This project has a potential installed capacity of 40 MW. It received three Standard Offer Contracts (SOCs) from the Ontario Power Authority in January 2007 for a total of 30 MW. The site location has adequate access to transmission and roads. In its Q1/08 MD&A, EarthFirst stated “it appears unlikely that the necessary permits will be received in time to commence construction in 2009.”
O N T A R I O S T A N D A R D O F F E R C O N T R A C T S
EarthFirst was awarded three 10 MW, 20-year term SOCs by the Ontario Power Authority in early 2007. Power generation will occur at facilities in Grand Valley and Shelburne, Ontario. All electricity generated at the facilities will be sold to the OPA at $110/MWh. Twenty percent of this base rate will be adjusted for inflation on an annual basis, using the Ontario Consumer Price Index (OCPI). If the OCPI is negative, there will be no change in payment (i.e., rates will not decline).
EarthFirst is obligated to transfer any green credits earned at its Grand Valley wind farms to the OPA during the terms of the contracts, unlike its PPA with BC Hydro.
P E R M I T S A N D A P P R O V A L S
EarthFirst expects environmental permitting will not be complete by mid-2008, as originally planned for. The OPA’s Standard Offer Contracts (SOCs) for the Grand Valley project each require a commissioning date of January 27, 2010. If this date is not achieved, the OPA has an option to terminate the SOCs. We think that the OPA will not terminate its Grand Valley SOCs and will either extend or renew the contracts. Reasons why include: (1) 30 MW is a relatively small amount of capacity; (2) the permitting delays are out of EarthFirst’s control; and (3) the proposed power is renewable, non-dispatchable, and non base-load (i.e., it is not heavily relied upon). Following permitting completion, EarthFirst will reassess the economic viability of its Grand Valley project.
Screening studies are under way to satisfy eRPI application requirements. Should the eRPI be granted, EarthFirst is contractually obligated to share the proceeds equally with the OPA, or net $5/MWh to EarthFirst.
W I N D D A T A
Wind data has been collected for over 29 months from two towers. No results have been released yet. Grand Valley’s consultant, Garrad Hassan Canada Inc., will complete a wind data study once wind tower locations are confirmed to be in accordance with environmental assessment and manufacturer requirements.
L E A S E R I G H T S
The Grand Valley project will be constructed on privately owned land, requiring annual royalties up to 3% of expected revenue. Grand Valley has 19 options to lease agreements with individual landowners that would allow for the installation of wind turbines, the electrical collection system, and the construction of a road network between Grand Valley’s infrastructure.
P R O J E C T C O N S T R U C T I O N & F I N A N C I N G
We expect the $73 million project to begin generating power by Q4/10, or one year later than planned. Financing arrangements have not been disclosed, and we believe that terms will be announced as permitting completion and construction decisions progress.
Ontario Standard Offer Contracts require EarthFirst to relinquish control of its earned green credits.
We think that the OPA will not terminate its Grand Valley SOCs and will extend or renew the contracts.

The Choice of a New Generation August 2008
141
T U R B I N E S U P P L Y A N D W A R R A N T Y / S E R V I C E A G R E E M E N T S
The Grand Valley project will use 15 Enercon E82 2.0 MW wind turbines that are expected to be delivered in mid-2009. Under the terms of the warranty agreement, EarthFirst will pay Enercon an annual fee per turbine of €9,000 plus $12,500 per annum for the first five years, and €18,000 per turbine plus $25,000 per annum for the following seven years.
If the project does not move forward, we believe that EarthFirst will have the option to allocate the turbines onto another site that is acceptable to Enercon, and which is not further than 300 km from one of Enercon’s wind farm service stations. Alternatively, Enercon has an option to extend the contract in its current form by one year.
Enercon was rated the top turbine manufacturer-based service provider in 2007, according to a recent survey of over 2,000 turbine operators. The study was conducted by the German Wind Energy Association and included Enercon (#1), REpower Systems (#2), Nordex (#3), Siemens (#4), Vestas (#5), and GE Energy (#6).
Enercon was recently rated the top turbine manufacturer-based service provider.

Alternative & Renewable Energy August 2008
142
Exhibit 4.11: EarthFirst’s Project Portfolio Is Moderately Diversified
Source: EarthFirst Canada Inc.
EarthFirst’s Other Wind Projects
We expect EarthFirst to submit 226.5 MW of fully permitted wind projects into the 2008 BC Hydro Clean Power Call. EarthFirst’s 2,600 MW portfolio of construction-ready and development-stage wind projects spans from B.C. to Newfoundland. We highlight each of its projects below. Exhibit 4.11 shows a map of EarthFirst’s project locations in Canada.
D E V E L O P M E N T P R O J E C T S W I T H I N B R I T I S H C O L U M B I A
Wartenbe
We believe that EarthFirst will submit its fully permitted 70.5 MW Wartenbe project into the 2008 BC Hydro Clean Power Call. A provincial Environmental Assessment Certificate for the project was awarded in late 2006 and requires construction to begin prior to October 2011. As the company intends to build the wind farm on Crown lands, a five-year Interim Licence of Occupation has been signed that allows the project a five-year window to complete construction. Once the wind farm is operational, a 30-year land lease with the Crown will commence.
Dokie Expansion
EarthFirst should submit its fully permitted 156 MW Dokie Expansion project into the 2008 BC Hydro Clean Power Call. The project site is located next to Dokie I and represents the remainder of 300 MW of capacity that received a B.C. Environmental Assessment Certificate in mid-2006. Should a PPA be granted, management expects the realization of operational synergies from infrastructure and interconnection sharing with Dokie I.

The Choice of a New Generation August 2008
143
Peace Region
EarthFirst holds numerous permits within B.C.’s Peace Region. These permits enable the company to investigate potential development properties that currently total 630 MW. Within this portfolio is a group of projects (about 300 MW), known as the Hasler Group, which EarthFirst intends to submit into a future BC Hydro Clean Power Call. In late 2007, the Hasler Group of wind farm development properties applied for environmental permitting.
Other B.C. Projects
The Kelly Lake wind power projects represent up to 500 MW of capacity and are in close proximity to the Kelly Lake Substation. EarthFirst has exclusive investigative rights to these wind resources. Environmental assessment application submissions are planned for 2008. We believe the Kelly Lake projects will likely be submitted into a future BC Hydro Power Call.
The Monte Nicola project is composed of three sites located near the Nicola Substation transmission line in the B.C. interior. These projects represent a potential wind power capacity of 200 MW, and may also be tendered into a future BC Hydro Power Call. Similar to its Kelly Lake development prospects, EarthFirst holds exclusive investigative rights to these resources.
EarthFirst also holds comparable rights for several projects on Vancouver Island and Trutch Island that represent a potential wind capacity of 450 MW.
D E V E L O P M E N T P R O J E C T S O U T S I D E O F B R I T I S H C O L U M B I A
Windrise
If constructed, we believe EarthFirst’s 99 MW Windrise project will be one of two EarthFirst projects that do not have long-term power price contracts. The development site is located adjacent to Nexen and Canadian Hydro Developers’ Soderglen wind power facility. The majority of the environmental, wind, and engineering studies are complete. The project location is transmission-constrained and will likely not proceed until construction of a new transmission line is complete.
Buffalo Atlee
The early-stage 200 MW Buffalo Atlee project is located near Brooks, Alberta. It is the second possible site for merchant power generation by EarthFirst. Unlike its Windrise project, EarthFirst has not begun the majority of the required environmental and engineering studies. EarthFirst holds a four-year exploratory Crown land permit.
Benchlands
EarthFirst’s 70 MW Benchlands project did not receive a SaskPower PPA in late 2005 due to a bidding price that was likely too high. The project received a 5 MW PPA in early 2006 that EarthFirst terminated given its small size and high interconnection costs. The wind farm is located near Tompkins, Saskatchewan. It is believed by management to have a potential capacity of 70 MW. We believe EarthFirst will bid this project into the next SaskPower RFP, which may occur in 2009.

Alternative & Renewable Energy August 2008
144
Nuttby
In March 2008, EarthFirst acquired the 45 MW Nuttby wind farm from Atlantic Wind Power Corporation. The acquisition price was paid for with about 192,000 EarthFirst common shares, a share of the gross revenue generated from the project over the 23-year life of the PPA with Nova Scotia Power Inc., as well as a $75,000 cash payment. An interconnection agreement has been reached between EarthFirst and Emera subsidiary Nova Scotia Power. Turbine negotiations are under way for a 2009 delivery, and the Environmental Assessment process is expected to be fully complete by the end of the year. In July, EarthFirst announced that it had received an environmental approval by the Government of Nova Scotia.
Bonavista
The 45 MW Bonavista project, located in Newfoundland, has had two PPA bids rejected by Newfoundland & Labrador Hydro, both in 2006, likely due to bid prices that were too high. While PPAs have been granted at lower prices to other bidders, the only project that has begun construction there is Skypower’s 27 MW Fermeuse wind farm. EarthFirst expects the project to be bid into Newfoundland’s next RFP, which may be announced shortly.

The Choice of a New Generation August 2008
145
Exhibit 4.13: Making Sense of Our 40¢ Target Price
Old DCFOld DCF @ 11.5% discount rate $1.60
Bankruptcy Partner Takeout RefinancingValuation $0.00 $0.40 $0.60 $0.40Probability 25% 25% 25% 25%
$0.00 + $0.10 + $0.15 + $0.10 = $0.35
NAV New DCFValuation $0.60 $0.35Weight 25% 75% Target
$0.15 + $0.26 = $0.40
Source: Scotia Capital estimates.
Exhibit 4.12: Our Old DCF Analysis of EF Supported $1.60 per Share One Year Out
Gross Effective Capacity Prob. of AdjustedProject Capacity Capacity Factor DCF Success DCF Comments
(MW) (MW) (%) ($/share) (%) ($/share)
Dokie I CRCE 24 24 26% $0.10 100% $0.10 Expected online Q4/08
Dokie I Infill 120 120 26% $0.86 100% $0.86 Expected online Q4/09
Grand Valley I 30 30 28% $0.22 25% $0.05 Low er probability due to permitting delays, f/x exposure
Nuttby 45 45 30% $0.43 25% $0.11
Dokie Expansion 156 156 30% $1.36 25% $0.34 Expect the project to enter the BC Hydro Clean Pow er Call
Wartenbe 71 71 30% $0.59 25% $0.15 Expect the project to enter the BC Hydro Clean Pow er Call
Grand Valley II 10 10 28% $0.08 0% $0.00
Bonavista 45 45 28% $0.35 0% $0.00
Windrise 99 99 28% $0.76 0% $0.00
Benchlands 70 70 28% $0.54 0% $0.00
N.E. 630 630 28% $4.83 0% $0.00
Interior/Kelly Lake 500 500 28% $3.84 0% $0.00
Interior/Nicola 200 200 28% $1.53 0% $0.00
Buffalo Atlee 200 200 28% $1.53 0% $0.00
Islands 450 450 28% $3.45 0% $0.00
2,650 2,650 $1.60
Source: Scotia Capital estimates.
Valuation & Sensitivity Analyses
F U L L V A L U E F O R P R O J E C T S U N D E R C O N S T R U C T I O N ; N O N E F O R B R A G - A - W A T T S
We value EarthFirst using a blended approach as follows: a probability-weighted discounted cash flow analysis, and a probability-weighted net asset value (NAV) per share.
Our DCF analysis, prior to the recent development that EarthFirst may not continue as a going concern, supported a one-year target price of $1.60 per share (Exhibit 4.12). At that time, we used an 11.5% discount rate. Since then, we have introduced four equally weighted scenarios that may play out over the short term, which suggests a risk-adjusted DCF valuation of $0.35 per share (Exhibit 4.13).
We do not include any potential non-permitted renewable power projects in our DCF. We assign 25% weights to EarthFirst’s fully permitted projects, Dokie Expansion (156 MW), and Wartenbe (70.5 MW), which we believe will be submitted into the 2008 BC Hydro Clean Power Call. We also assign a
25% weight to the PPA-signed 45 MW Nuttby wind project in Nova Scotia. Finally, we reduced our probability of success on EarthFirst’s Grand Valley project to 25% from 100% previously due to its announcement that it will not complete permitting on time for a Q1/10 commissioning date.

Alternative & Renewable Energy August 2008
146
Exhibit 4.14: Net Asset Value Suggests $0.60 per Share
Project Financing Unrisked NetStatus Status Generation NAV
($M) (diluted) (%)Projects
Dokie I CRCE 2 2 55.0 GWh/y @ $0.74M / GWh/y $40.6 $0.16 26.0%Dokie I Infill 2 2 275.0 GWh/y @ $0.74M / GWh/y $203.0 $0.79 130.2%Grand Valley I 3 4 73.5 GWh/y @ $0.41M / GWh/y $30.1 $0.12 19.3%Nuttby 4 4 118.3 GWh/y @ $0.21M / GWh/y $24.2 $0.09 15.6% $0.60 5 4 3 2 1Dokie Expansion 4 4 410.0 GWh/y @ $0.21M / GWh/y $84.0 $0.33 53.9% 4 $0.58 $0.60 $0.64 $0.70 $0.71Wartenbe 4 4 184.0 GWh/y @ $0.21M / GWh/y $37.7 $0.15 24.2% 3 $0.59 $0.62 $0.67 $0.75 $0.77Grand Valley II 6 4 24.5 GWh/y @ $0.00M / GWh/y $0.0 $0.00 0.0% 2 $0.60 $0.65 $0.73 $0.85 $0.88Bonavista 6 4 110.4 GWh/y @ $0.00M / GWh/y $0.0 $0.00 0.0% 1 $0.60 $0.66 $0.76 $0.91 $0.95Windrise 6 4 242.8 GWh/y @ $0.00M / GWh/y $0.0 $0.00 0.0%Benchlands 6 4 171.7 GWh/y @ $0.00M / GWh/y $0.0 $0.00 0.0%N.E. 6 4 1,545.3 GWh/y @ $0.00M / GWh/y $0.0 $0.00 0.0%Interior/Kelly Lake 6 4 1,226.4 GWh/y @ $0.00M / GWh/y $0.0 $0.00 0.0%Interior/Nicola 6 4 490.6 GWh/y @ $0.00M / GWh/y $0.0 $0.00 0.0% $0.60 5 4 3 2 1Buffalo Atlee 6 4 490.6 GWh/y @ $0.00M / GWh/y $0.0 $0.00 0.0% 4 $0.52 $0.60 $0.73 $0.90 $0.94Islands 6 4 1,103.8 GWh/y @ $0.00M / GWh/y $0.0 $0.00 0.0% 3 $0.54 $0.65 $0.83 $1.12 $1.19
6,521.7 GWh/y $419.7 $1.63 269.2% 2 $0.59 $0.76 $1.02 $1.37 $1.451 $0.60 $0.81 $1.16 $1.72 $1.86
Green AttributesCarbon Offsets $32.0 $0.12 20.5%
$32.0 $0.12 20.5%Working Capital
Current Assets (uncommitted) n.m. $0.00 0.0% $0.60 5 4 3 2 1Current Liabilities (uncommitted) n.m. $0.00 0.0% 4 $0.57 $0.60 $0.66 $0.75 $0.77
$0.00 0.0% 3 $0.57 $0.62 $0.70 $0.83 $0.86Liabilities 2 $0.60 $0.67 $0.80 $0.98 $1.02
Est. Probability-adjusted LTD post future debt financing ($295.8) ($1.15) -189.7% 1 $0.60 $0.69 $0.84 $1.08 $1.14($295.8) ($1.15) -189.7%
Est. Probability-adjusted FD Shares O/S post future equity financing 258.2
Net Asset Value $155.9 $0.60 100%
1. We assume a stable capital structure of 60% debt & 40% equity. Equity issuance is assumed to be our DCF price of $1.6/share.2. Project Probability Status: 1. Operating - 100%; 2. Construction - 90%; 3. Permitting & PPA - 50%; 4. Permitting or PPA - 25%; 5. Some Development - 10%; 6. Pipeline - 0%.3. Financing Status: (1) Full f inancing in place; (2) Debt draw n, equity required; (3) Equity in place, debt draw required; (4) Equity & debt draw required.
Risk-AdjustedAsset Value
WARTENBE (70.5 MW)Project Status
Project Status
Fina
ncin
g St
atus
NUTTBY (45 MW)
Fina
ncin
g St
atus
DOKIE EXPANSION (156 MW)Project Status
Fina
ncin
g St
atus
NAVPS
Source: Scotia Capital estimates.
We calculate a NAV of $0.60 per share. Given recent transactions and using rule-of-thumb metrics, we give credit of $0.82 million per GWh/y for capacity that is either operating or under mostly fixed-price contract construction. We reduce this amount according to various stages of project progress. We assign no value for the rest of its wind project portfolio (Exhibit 4.14).
T A R G E T P R I C E , R A T I N G , A N D R I S K R A N K I N G
We have transferred coverage of EarthFirst with a 3-Sector Underperform rating. Our one-year share price target is $0.40. Embedded in our one-year target are a 25% probability that fully permitted projects Dokie Expansion (156 MW) and Wartenbe (70.5 MW) successfully receive PPAs in the 2008 BC Hydro Clean Power Call, debt and/or equity financing, fixed-price construction contracts, and a two-year wait period for turbine supply.
Our risk ranking for EarthFirst is Caution Warranted, as it is for Plutonic Power and for Innergex Renewable Energy. We believe this is justified by the early stage of the company’s life, the speculative nature of its future projects being successful, the company’s volatile stock price, and stock illiquidity.
EarthFirst’s targeted debt/equity split is 60%/40%, and its counterparties are investment-grade crown corporations that offer long-term fixed-price contracts.

The Choice of a New Generation August 2008
147
Exhibit 4.15: Our Forecast EarthFirst Electricity Generation Capacity
0
20
40
60
80
100
120
140
160
180
200
Q4-08E Q1-09E Q2-09E Q3-09E Q4-09E Q1-10E Q2-10E Q3-10E Q4-10E
Inst
alle
d C
apac
ity (M
W)
In the quarter that new capacity comes online, we apply a 50% mid-point weight as we do not know when in the quarter the facility w ill begin to generate
revenue
Source: Scotia Capital estimates.
Financial Forecast W E E X P E C T D O K I E I T O S T A R T O N T I M E A N D O N ( T H E R E V I S E D ) B U D G E T
We assume that the capital cost for Dokie I (144 MW) does not deviate from $360 million, which was recently revised upwards following higher-than-expected labour and commodity-related costs.
Our experience with actual versus expected wind power generation led us to shave our Dokie I forecast capacity factor down to 26.2% (330,000 MWh per year), or 0.9% lower than EarthFirst’s expected 27.1%. For the Grand Valley project, we assume a net capacity factor of 28%.
We expect 24 MW of effective capacity to be online by the end of Q4/08, but our financial model only gives credit for 50% of this in the first quarter following commissioning, as speculation of the exact day in a quarter that new capacity comes online is useless. Similar to the half-year CCA rule, we apply a 50% weight to generation produced from new capacity in its initial quarter. Exhibit 4.15 shows our effective forecast generating capacity over the next three years.
Our financial forecast excludes those projects that have not achieved at least some of the following milestones: (1) awarded PPAs; (2) project financing; (3) permitting; (4) fixed-price construction contracts; and (5) construction progress. As we expect Dokie I to begin operating on time, we project 2009 generation revenue of $5.1 million, climbing to $31.5 million in 2010 and to $55.5 million the following year.
We believe EarthFirst will retain and sell all of its green credits from its Dokie I wind farm. The company’s stated strategy is to maximize its exposure to the emerging markets for green credits. We have assumed US$5/CO2 tonne is received by EarthFirst on emissions markets such as the Chicago Climate Exchange, or about $3.33/MWh using a par FX rate. Under Ontario’s Standard Offer Contract, all green credits earned are the property of the Ontario Power Authority. EarthFirst’s Nuttby project in Nova Scotia will also not earn any green credits.
We have not applied our (forecast) excess cash on the balance sheet, for now.

Alternative & Renewable Energy August 2008
148
Exhibit 4.16: We Forecast Good EBITDA and EPS Growth over the Next Few Years
($0.03)
($0.02)
($0.01)
$0.00
$0.01
$0.02
$0.03
Q1-08 Q1-09E Q1-10E Q1-11E Q1-12E Q1-13E Q1-14E Q1-15E
Ear
ning
s pe
r Sha
re
($20,000)
($16,000)
($12,000)
($8,000)
($4,000)
$0
$4,000
$8,000
$12,000
$16,000
$20,000
EBIT
DA (0
00s)
Quarterly EBITDA
Quarterly EPS
Source: Scotia Capital estimates.
Our financial forecast shows healthy growth in EBITDA through 2011, at which point annual generation is constant and EBITDA growth is limited to rising power prices based on various CPI indexation formulas. We believe annual EBITDA will likely exceed $4.3 million in 2009 and $27 million in 2010. We expect EarthFirst will pay an immaterial amount of cash taxes over the next several years due to its ability to use the accelerated Class 43.2 CCA rate of 50%, as well as the availability of tax loss carry-forwards. Exhibit 4.16 charts our quarterly EBITDA and earnings forecasts through 2015, giving full credit to Dokie I, Grand Valley, and Nuttby. Material upside exists in our financial forecast and one-year price target should Dokie Expansion and Wartenbe be awarded EPAs.
O T H E R K E Y A S S U M P T I O N S
New capacity. With the addition of new capacity, we do not speculate what specific day in a quarter new capacity will come online. Accordingly, and similar to the half-year CCA rule, we apply a 50% weight to generation produced from new capacity in its initial quarter.
Free cash flow. We have not applied free cash on the balance sheet, for now. Cash on hand could be used to: (1) prepay outstanding principal balances on its debt; (2) implement (i) a regular dividend – unlikely, (ii) a share buyback – unlikely, and/or (iii) a one-time special dividend – unlikely; (3) invest in other organic growth opportunities; and (4) enter into an acquisition, joint venture, or similar transaction.
Future capital costs. Going forward, we assume that installed capital costs per MW in 2008 dollars ranges between $2.25 million and $2.75 million, or slightly above management guidance.
Equity financing. Unlike Plutonic Power’s GE financing deal for its East Toba and Montrose Creek run-of-river projects, we assume that EarthFirst equity is issued at the corporate level.
Exhibits 4.17 through 4.19 display our forecast financial statements for EarthFirst Canada Inc.

149
The Choice of a N
ew G
eneration A
ugust 2008
Exhibit 4.17: EarthFirst Canada Inc. – Income Statement
($000s) Q108 Q208 Q308E Q408E 2008E Q109E Q209E Q309E Q409E 2009E 2010E 2011E 2012E 2013E 2014E 2015E
Generation Revenue $0 $0 $0 $0 $0 $647 $940 $1,180 $1,585 $4,352 $27,027 $48,550 $51,626 $52,141 $52,663 $53,190Incentive Revenue $0 $0 $0 $0 $0 $71 $103 $130 $174 $478 $2,944 $4,655 $4,849 $4,849 $4,849 $4,849Green Credits $0 $0 $0 $0 $0 $33 $48 $61 $82 $225 $1,479 $2,323 $2,553 $2,703 $2,853 $3,003
$0 $0 $0 $0 $0 $751 $1,091 $1,371 $1,841 $5,055 $31,450 $55,528 $59,028 $59,693 $60,365 $61,042
Operating Costs $0 $0 $0 $0 $0 $107 $155 $195 $262 $718 $4,416 $7,467 $7,826 $7,826 $7,826 $7,826General & Admin $1,099 $1,354 $1,000 $1,000 $4,453 $1,050 $1,050 $1,050 $1,050 $4,200 $4,400 $4,600 $4,800 $5,000 $5,200 $5,400Capital Amortization $0 $0 $27 $28 $55 $638 $639 $640 $641 $2,556 $10,424 $15,359 $15,375 $15,391 $15,407 $15,423Pre-Op Amortization $17 $23 $20 $20 $80 $200 $200 $200 $200 $800 $800 $800 $800 $800 $0 $0Interest on LTD $0 $0 $0 $0 $0 $959 $959 $959 $959 $3,834 $16,201 $23,948 $23,948 $23,949 $23,949 $23,949Interest income $0 $0 ($407) ($518) ($925) ($431) ($269) ($108) $0 ($808) $0 $0 $0 $0 $0 ($8)Other $25 $1 $0 $0 $0 $0 $0 $0 $0 $0 $0 $0 $0 $0 $0Total expenses $1,141 $1,378 $640 $531 $3,690 $2,522 $2,733 $2,935 $3,111 $11,301 $36,240 $52,174 $52,749 $52,966 $52,382 $52,591
Earnings before tax expense ($1,141) ($1,378) ($640) ($531) ($3,690) ($1,771) ($1,642) ($1,564) ($1,270) ($6,247) ($4,790) $3,355 $6,278 $6,727 $7,983 $8,452Current Income Taxes $0 $0 $0 $0 $0 $0 $0 $0 $0 $0 $0 $0 $0 $0 $0 $0Future Income Taxes ($417) ($1,135) ($224) ($186) ($1,962) ($620) ($575) ($547) ($444) ($2,186) ($1,676) $1,174 $2,197 $2,355 $2,794 $2,958Earnings from continuing operations ($724) ($243) ($416) ($345) ($1,728) ($1,151) ($1,067) ($1,017) ($825) ($4,060) ($3,113) $2,181 $4,081 $4,373 $5,189 $5,494Gain (loss) on sale of assets/prospects $0 $0 $0 $0 $0 $0 $0 $0 $0 $0 $0 $0 $0 $0 $0 $0Net Income ($724) ($243) ($416) ($345) ($1,728) ($1,151) ($1,067) ($1,017) ($825) ($4,060) ($3,113) $2,181 $4,081 $4,373 $5,189 $5,494
Basic shares - opening 103,300.0 103,300.0 103,300.0 103,300.0 103,300.0 103,300.0 103,300.0 103,300.0 103,300.0 103,300.0 103,300.0 128,300.0 128,300.0 128,300.0 128,300.0 128,300.0Plus: Equity issued 0.0 0.0 0.0 0.0 0.0 0.0 0.0 0.0 0.0 0.0 25,000.0 0.0 0.0 0.0 0.0 0.0Less: Share buyback 0.0 0.0 0.0 0.0 0.0 0.0 0.0 0.0 0.0 0.0 0.0 0.0 0.0 0.0 0.0 0.0Basic shares - closing 103,300.0 103,300.0 103,300.0 103,300.0 103,300.0 103,300.0 103,300.0 103,300.0 103,300.0 103,300.0 128,300.0 128,300.0 128,300.0 128,300.0 128,300.0 128,300.0Average Shares O/S - Basic (000s) 103,300.0 103,300.0 103,300.0 103,300.0 103,300.0 103,300.0 103,300.0 103,300.0 103,300.0 103,300.0 106,425.0 128,300.0 128,300.0 128,300.0 128,300.0 128,300.0Average Dilution (000s) 26,907.5 26,907.5 26,907.5 26,907.5 26,907.5 26,907.5 26,907.5 26,907.5 26,907.5 26,907.5 26,907.5 26,907.5 26,907.5 26,907.5 26,907.5 26,907.5Average Shares O/S - Diluted (000s) 130,207.5 130,207.5 130,207.5 130,207.5 130,207.5 130,207.5 130,207.5 130,207.5 130,207.5 130,207.5 133,332.5 155,207.5 155,207.5 155,207.5 155,207.5 155,207.5
EPS (Basic) ($0.01) ($0.00) ($0.00) ($0.00) ($0.02) ($0.01) ($0.01) ($0.01) ($0.01) ($0.04) ($0.03) $0.02 $0.03 $0.03 $0.04 $0.04EPS (Diluted) ($0.01) ($0.00) ($0.00) ($0.00) ($0.02) ($0.01) ($0.01) ($0.01) ($0.01) ($0.04) ($0.03) $0.01 $0.03 $0.03 $0.03 $0.04
Source: Scotia Capital estimates.

Alternative &
Renew
able Energy A
ugust 2008
150 Exhibit 4.18: EarthFirst Canada Inc. – Balance Sheet
($000s) Q108 Q208 Q308E Q408E 2008E Q109E Q209E Q309E Q409E 2009E 2010E 2011E 2012E 2013E 2014E 2015EAssetsCurrent Assets
Cash (incl. Res. & Escrow) $81,526 $65,127 $82,803 $68,912 $68,912 $43,029 $17,276 $0 $0 $0 $0 $0 $0 $0 $0 $7,892A/R $3,748 $1,573 $1,573 $1,573 $1,573 $1,573 $1,573 $1,573 $1,573 $1,573 $1,573 $1,573 $1,573 $1,573 $1,573 $1,573Due from Related $1,240 $965 $965 $965 $965 $965 $965 $965 $965 $965 $965 $965 $965 $965 $965 $965Prepaid Expenses $2,537 $5,170 $5,170 $5,170 $5,170 $5,170 $5,170 $5,170 $5,170 $5,170 $5,170 $5,170 $5,170 $5,170 $5,170 $5,170Deferred Financing Charges $0 $0 $0 $0 $0 $0 $0 $0 $0 $0 $0 $0 $0 $0 $0 $0
$89,051 $72,835 $90,511 $76,620 $76,620 $50,737 $24,984 $7,708 $7,708 $7,708 $7,708 $7,708 $7,708 $7,708 $7,708 $15,600
Development Costs $87,655 $121,400 $121,400 $121,400 $121,400 $121,400 $121,400 $121,400 $121,400 $121,400 $121,400 $121,400 $121,400 $121,400 $121,400 $121,400Pre-Operating Costs $0 $0 $980 $1,960 $1,960 $1,760 $1,560 $1,360 $1,160 $1,160 $360 ($440) ($1,240) ($2,040) ($2,040) ($2,040)Performance Deposits $12,193 $12,241 $12,241 $12,241 $12,241 $12,241 $12,241 $12,241 $12,241 $12,241 $12,241 $12,241 $12,241 $12,241 $12,241 $12,241Future Income Tax Asset $0 $0 $0 $0 $0 $0 $0 $0 $0 $0 $0 $0 $0 $0 $0 $0Capital Assets $273 $397 $31,390 $62,382 $62,382 $117,870 $173,356 $228,842 $284,326 $284,326 $397,808 $400,188 $399,712 $390,060 $374,654 $359,231Other $0 $0 $0 $0 $0 $0 $0 $0 $0 $0 $0 $0 $0 $0 $0 $0Total Assets $189,172 $206,873 $256,522 $274,603 $274,603 $304,008 $333,541 $371,551 $426,835 $426,835 $539,517 $541,097 $539,821 $529,369 $513,963 $506,432
LiabilitiesCurrent Liabilities
Revolver $0 $0 $0 $0 $0 $0 $0 $8,399 $33,778 $33,778 $38,906 $36,488 $29,995 $19,372 $5,982 $0A/P, accruals, turbine loan $1,957 $20,994 $20,994 $20,994 $20,994 $20,994 $20,994 $20,994 $20,994 $20,994 $20,994 $20,994 $20,994 $20,994 $20,994 $20,994CP LTD $0 $0 $7,500 $10,000 $10,000 $10,000 $10,000 $10,000 $10,000 $10,000 $10,000 $10,000 $10,000 $10,000 $10,000 $10,000Due to related $135 $66 $66 $66 $66 $66 $66 $66 $66 $66 $66 $66 $66 $66 $66 $66
$2,092 $21,060 $28,560 $31,060 $31,060 $31,060 $31,060 $39,459 $64,838 $64,838 $69,966 $67,548 $61,055 $50,432 $37,042 $31,060
Long-Term Debt $0 $0 $11,112 $27,224 $27,224 $58,399 $89,574 $120,749 $151,924 $151,924 $216,268 $216,911 $215,850 $209,293 $199,293 $189,293Preferred Shares $0 $0 $0 $0 $0 $0 $0 $0 $0 $0 $0 $0 $0 $0 $0 $0Future Income Tax Liability $16,459 $15,323 $46,776 $46,590 $46,590 $45,971 $45,396 $44,848 $44,404 $44,404 $42,728 $43,902 $46,099 $48,454 $51,248 $54,206Other $0 $0 $0 $0 $0 $0 $0 $0 $0 $0 $0 $0 $0 $0 $0 $0Total Liabilities $18,551 $36,383 $86,448 $104,874 $104,874 $135,430 $166,030 $205,056 $261,166 $261,166 $328,962 $328,361 $323,004 $308,180 $287,584 $274,559
Shareholders' EquityShare capital (&CS) $239,864 $239,976 $239,976 $239,976 $239,976 $239,976 $239,976 $239,976 $239,976 $239,976 $287,976 $287,976 $287,976 $287,976 $287,976 $287,976Retained earnings ($69,243) ($69,486) ($69,902) ($70,247) ($70,247) ($71,398) ($72,465) ($73,482) ($74,307) ($74,307) ($77,421) ($75,240) ($71,159) ($66,786) ($61,597) ($56,103)Total Shareholders Equity $170,621 $170,490 $170,074 $169,729 $169,729 $168,578 $167,511 $166,494 $165,669 $165,669 $210,555 $212,736 $216,817 $221,190 $226,379 $231,873
Total Liabilities & SE $189,172 $206,873 $256,522 $274,603 $274,603 $304,008 $333,541 $371,551 $426,835 $426,835 $539,517 $541,097 $539,821 $529,369 $513,963 $506,432
Source: Scotia Capital estimates.

151
The Choice of a N
ew G
eneration A
ugust 2008
Exhibit 4.19: EarthFirst Canada Inc. – Cash Flow Statement
($000s) Q108 Q208 Q308E Q408E 2008E Q109E Q209E Q309E Q409E 2009E 2010E 2011E 2012E 2013E 2014E 2015E
Operating ActivitiesNet (loss) earnings ($724) ($243) ($416) ($345) ($1,728) ($1,151) ($1,067) ($1,017) ($825) ($4,060) ($3,113) $2,181 $4,081 $4,373 $5,189 $5,494Adjustments for:
Capital Amortization $0 $0 $27 $28 $55 $638 $639 $640 $641 $2,556 $10,424 $15,359 $15,375 $15,391 $15,407 $15,423Pre-Op Amortization $17 $23 $20 $20 $80 $200 $200 $200 $200 $800 $800 $800 $800 $800 $0 $0(Gain) loss on sale of assets/prospects $0 $0 $0 $0 $0 $0 $0 $0 $0 $0 $0 $0 $0 $0 $0 $0Future income tax (recovery) expense ($417) ($1,135) ($224) ($186) ($1,962) ($620) ($575) ($547) ($444) ($2,186) ($1,676) $1,174 $2,197 $2,355 $2,794 $2,958Other (incl. stock comp. exp.) $141 $114 $0 $0 $255 $0 $0 $0 $0 $0 $0 $0 $0 $0 $0 $0
Cash flow from operations ($983) ($1,241) ($593) ($483) ($3,300) ($933) ($803) ($724) ($429) ($2,890) $6,434 $19,513 $22,453 $22,918 $23,390 $23,874Net change in non-cash WC ($2,340) $2,319 $0 $0 ($21) $0 $0 $0 $0 $0 $0 $0 $0 $0 $0 $0
($3,323) $1,078 ($593) ($483) ($3,321) ($933) ($803) ($724) ($429) ($2,890) $6,434 $19,513 $22,453 $22,918 $23,390 $23,874
Financing ActivitiesNet issue (buyback) of common shares $3,454 $0 $0 $0 $3,454 $0 $0 $0 $0 $0 $48,000 $0 $0 $0 $0 $0Debt advances $0 $13,210 $18,612 $18,612 $50,434 $33,675 $33,675 $33,675 $33,675 $134,700 $74,343 $10,643 $8,939 $3,443 $0 $0Long-term debt repayments $0 $0 $0 $0 $0 ($2,500) ($2,500) ($2,500) ($2,500) ($10,000) ($10,000) ($10,000) ($10,000) ($10,000) ($10,000) ($10,000)
$3,454 $13,210 $18,612 $18,612 $53,888 $31,175 $31,175 $31,175 $31,175 $124,700 $112,343 $643 ($1,061) ($6,557) ($10,000) ($10,000)
Investing ActivitiesCapital asset additions/business acquisitions ($46) ($148) ($31,020) ($31,020) ($62,234) ($56,125) ($56,125) ($56,125) ($56,125) ($224,501) ($123,906) ($17,739) ($14,899) ($5,739) $0 $0Prospect development costs ($23,599) ($28,108) $0 $0 ($51,707) $0 $0 $0 $0 $0 $0 $0 $0 $0 $0 $0Pre-Operation Costs $0 ($2,381) ($1,000) ($1,000) ($4,381) $0 $0 $0 $0 $0 $0 $0 $0 $0 $0 $0Restricted cash returned (paid) ($461) $31,627 $0 $0 $31,166 $0 $0 $0 $0 $0 $0 $0 $0 $0 $0 $0Proceeds on sale of assets/prospects $0 $0 $0 $0 $0 $0 $0 $0 $0 $0 $0 $0 $0 $0 $0 $0
($24,106) $990 ($32,020) ($32,020) ($87,156) ($56,125) ($56,125) ($56,125) ($56,125) ($224,501) ($123,906) ($17,739) ($14,899) ($5,739) $0 $0
Net change in cash and cash equivalents ($23,975) $15,278 ($14,001) ($13,891) ($36,589) ($25,883) ($25,753) ($25,674) ($25,379) ($102,691) ($5,128) $2,418 $6,494 $10,623 $13,390 $13,874+ CHANGE in Res. & Escrow Cash
Cash & Equivalents - Beginning $105,501 $81,526 $96,804 $82,803 $105,501 $68,912 $43,029 $17,276 ($8,399) $68,912 ($33,778) ($38,906) ($36,488) ($29,995) ($19,372) ($5,982)Cash & Equivalents - End $81,526 $96,804 $82,803 $68,912 $68,912 $43,029 $17,276 ($8,399) ($33,778) ($33,778) ($38,906) ($36,488) ($29,995) ($19,372) ($5,982) $7,892
Source: Scotia Capital estimates.

Alternative & Renewable Energy August 2008
152
Management & DirectorsEarthFirst has a strong management team with a broad range of industry experience specifically related to wind power development companies. Through predecessor companies that include various wind power entities related to Creststreet Capital Corporation and EarthFirst Energy Inc., EarthFirst’s management team has been involved in developing, financing, constructing, and operating wind power projects with an aggregate capacity of 148 MW. Specific past projects include the Pubnico project in Nova Scotia (30 MW), Mount Copper in Quebec (54 MW), and Kettles Hill (63 MW).
The management team has also raised $435 million in capital for Canadian wind power projects above and beyond equity and debt financing raised for EarthFirst. In Exhibit 4.20, we present brief backgrounds of key management and directors of the corporation. In total, insiders and related entities control about 15.5% of EarthFirst fully diluted outstanding shares.

The Choice of a New Generation August 2008
153
Exhibit 4.20: Management & Directors
FD Shares Held Partial to Fully Options/ Name Position Personally Controlled Shares Warrants Background
Linda Chambers President & CEO - - 500,000 Ms. Chambers spent 11 years at TransAlta, including President of TransAlta's U.S. operations and Executive Vice President of Generation Technology. She has a strong background of hydro, wind, geothermal, coal, and gas-fired power generation.
David Erskine Chairman & Director 27,500 - 50,000 Mr. Erskine is an independent businessman who has held the position of President and Chief Exectutive Officer at two companies for ten years. From 1999 to 2006 Mr. Erskine was President and CEO at CSS industries Inc. and from 1996 to 1999 he held these postions at Scott Paper Limited.
Robert Toole Vice Chairman - 15,026,230 192,000 Mr. Toole is the founder and and Managing Director of Creststreet. He was recognized by CanWEA for Exceptional Achievement and Individual Leadership in the Canadian wind industry. Mr. Toole graduated from Queen’s University with a Bachelor of Commerce, is a Chartered Accountant, and is a registered portfolio manager in Ontario.
Ron Percival Vice Chairman 417,110 3,604,685 225,125 Mr. Percival is the founder of Earth First Energy Inc. He holds the position as a Director of the Independent Power Producers of British Columbia (IPPBC) and has served as the Chair of the IPPBC Wind Committee for the last three years. He is a member of the B.C. and Federal Caucus of CanWEA, and serves on various other committees.
Gary Patterson Director 20,000 - 50,000 Mr. Patterson is the President and CEO of GAP Financial Ltd. Mr. Patterson was Executive Vice-President and CFO of Inwest Investments Ltd. and was also Executive Vice President and CFO of Future Shop Ltd. Mr. Patterson received a Bachelor of Commerce from Mount Allison University, New Brunswick, and is a Fellow of the Institute of Chartered Accountants.
Gordon Barefoot Director 14,358 - 53,333 Prior to spending three years as the President of Cabgor Management Inc., Mr. Barefoot served as the Senior VP of Finance and CFO of Terasen Inc. Mr. Barefoot worked for Ernst & Young for 19 years, 13 of which he was a partner, and currently sits on the board of directors and is the chairman of the audit committee for both Nventa Biopharmaceuticals Corporation and Auto Canada Income Fund. Mr. Barefoot is a Certified Director and member of the Institute of Coprorate Directors and is a Chartered Accountant.
John Budreski Director 100,000 - 100,000 A director and independent businessman, Mr. Budreski was the CEO of Orion Securities Inc. and Orion Financial Inc. from March 2005 to November 2007. Prior to March 2005, Mr. Budreski was a Managing Director of the Canadian Capital Structuring Group of Scotia Capital Inc. and has held various roles in the firm since 1998.
Paul Bradley Director 10,000 - 55,000 Mr. Bradley currently serves as the Managing Director of PJB Energy Solutions Inc., and from 2005 to 2007 held the position as VP of Electricity Resources for the OPA. From 1997 to 2003, Mr. Barefoot was an Executive Director for the investment banking Power and Utilities team at a leading Canadian financial institution. Prior to 1997, Mr. Bradley held various management roles at Duke Energy Corporation and was a Senior Accountant at Arthur Anderson & Co.
Dennis Nelson Senior VP, Project Development, Chief Operating Officer, Director
129,070 3,604,685 199,973 Mr. Nelson has been involved in the forestry industry for more then 30 years. He has been involved in the development and implementation of new timber harvesting methods within the forestry resource sector.
Derren Newell VP Finance, Chief Financial Officer 50,000 - 222,000 Prior to joining Creststreet, Mr. Newell was VP Finance at Superior Plus Income Fund and later assumed the role of Business Process and Compliance. Mr. Newell holds a Bachelor of Commerce from the University of Alberta and is a Chartered Accountant.
Erich Ossowski VP, Windpower Development, Director
- - 222,000 Prior to leading sales and business development at GE Wind Energy in Canada, Mr. Ossowski worked for three years at ABB Power Generation as a design engineer. He holds an MBA from the Richard Ivey School of Business and a Bachelor of Applied Science in Mechanical Engineering from the University of Waterloo.
Total 740,538 22,235,599 1,319,431
Fully Diluted Shares Outstanding 152,112,000
% Insider Ownership 15.5%
Source: SEDI; Bloomberg; company reports; Scotia Capital.

Alternative & Renewable Energy August 2008
154
T H I S P A G E L E F T I N T E N T I O N A L L Y B L A N K

The Choice of a New Generation August 2008
155
Innergex Renewable Energy Inc. (INE-T)
Aug 15, 2008: $8.25 1-Yr Target: $9.50 Capitalization Rating: 3-Sector Underperform 1-Yr ROR: 15.2% Shares O/S (M) 23.5 Risk: Caution Warranted 2-Yr Target: $10.50 Total Value ($M) 193.9 IBES EPS 2008E $-0.17 2-Yr ROR: 27.3% Float O/S (M) 14.3 IBES EPS 2009E $0.19 Float Value ($M) 117.6 Div. (Curr.): $0.00 TSX Weight -- Yield: 0.0%
Valuation: 75% DCF @ 11%; 25% NAV
Qtly EPS (FD) (Next Release: Nov-08)
Y/E DECEMBER-31 Mar Jun Sep Dec Year P/E 2008E $-0.23A $0.06A $-0.01 $-0.02 $-0.19 n.a. 2009E $-0.02 $0.02 $0.01 $0.02 $0.03 n.a. 2010E $0.06 $0.11 $0.07 $0.07 $0.32 25.5x 2011E $0.08 $0.15 $0.10 $0.10 $0.43 19.4x Industry Specific 2007A 2008 2009 2010 2011 Production (GWh) 42 42 237 570 748
Note: Historical price multiple calculations use FYE price. Source: Reuters; company reports; Scotia Capital estimates.
PPAs in Hand – Now Execute! I N V E S T M E N T H I G H L I G H T S
• Seamless execution critical. Innergex is sitting on over 290 MW of PPAs spread over nine projects. Commissioning of these hydro and wind projects on time and within budget is key to Innergex’s success.
• Above-average risk profile. We believe that Innergex carries an above-average risk profile due its acceptance of high execution and construction risk in return for higher IRRs. To date, two of its three current construction projects have experienced significant delays.
• Rich relative valuation. Based on our 2009 and 2010 forecast, we believe Innergex’s share price is fairly rich. INE is trading above our peer group average on the following forward metrics: P/E, P/S, P/CF, and EV/EBITDA.
• Turning the story around. In our minds, the company’s exclusive relationship with Federation Quebecoise des Municipalites (FQM) puts it ahead of all other bidders in the anticipated Quebec Municipal 250 MW wind RFP.
• Stock catalysts. While winning future PPA bids is important, such as those that we expect INE to enter into the BC Hydro Clean Power Call, we believe the market will place more focus on the successful commissioning of its construction and construction-ready projects.
• We have initiated coverage on the common shares of Innergex Renewable Energy with a 3-Sector Underperform rating and a one-year target price of $9.50 per share. Our valuation is based on a 75%-weighted discounted cash flow approach, using an 11% discount rate, and a 25%-weighted net asset value calculation.

Alternative & Renewable Energy August 2008
156
Exhibit 5.1: Innergex Renewable Energy Inc. – Relative Valuation Metrics
Last SC 1-Year 1-Year MarketCompany Ticker Price Rating Target ROR DCF NAV Cap 2008E 2009E 2010E
8/15/2008 ($M) (x) (x) (x)
Boralex BLX $14.80 1-SO $18.00 22% $18.33 $17.03 $560 9.9x 8.6x 7.6xCanadian Hydro Developers KHD $4.38 1-SO $7.00 60% $7.04 $6.95 $628 20.3x 9.9x 7.6xEarthfirst Canada EF $0.27 3-SU $0.40 48% $0.35 $0.60 $28 n.m. -5.5x -0.9xInnergex Renewable Energy INE $8.25 3-SU $9.50 15% $9.44 $9.55 $194 n.m. 18.4x 7.8xPlutonic Pow er PCC $7.04 2-SP $9.00 28% $9.03 $8.75 $297 n.m. n.m. n.m.Average 35% $341 15.1x 7.8x 5.5x
Company Ticker Beta 2008E 2009E 2010E 2008E 2009E 2010E 2008E 2009E 2010E(x) (x) (x) (x) (x) (x) (x) (x) (x)
Boralex BLX 0.7 28.8x 20.2x 18.6x 2.6x 2.5x 2.3x 10.4x 8.7x 7.7xCanadian Hydro Developers KHD 0.5 54.6x 23.4x 17.3x 7.2x 3.9x 3.1x 16.0x 9.0x 6.6xEarthfirst Canada EF - n.m. n.m. n.m. n.m. 5.5x 0.9x n.m. n.m. 5.6xInnergex Renewable Energy INE - n.m. n.m. 25.5x 27.5x 8.3x 4.2x n.m. 33.6x 10.2xPlutonic Pow er PCC 0.9 n.m. n.m. n.m. n.m. n.m. n.m. n.m. n.m. n.m.Average 0.7 41.7x 21.8x 20.5x 12.4x 5.1x 2.6x 13.2x 17.1x 7.5x
Price to Earnings Price to Sales Price to Cash Flow
Enterprise Value to EBITDA
Source: Bloomberg; Scotia Capital estimates.
Summary & Investment Recommendation Innergex owns and operates an 8 MW hydro facility in Ontario, and has signed PPAs for 293 MW (net to INE) of hydro and wind projects that are under construction, construction-ready, or completing permitting. In addition to its 16.1% equity interest in Innergex Power Income Fund, the company has 2,300 MW of prospective projects in its development pipeline. Innergex intends to commission its current PPA-signed projects by the end of 2012.
We have initiated coverage on the common shares of Innergex Renewable Energy with a 3-Sector Underperform rating and a one-year target price of $9.50 per share. In our opinion, Innergex’s above-average risk profile, coupled with a somewhat rich relative valuation, justifies our rating. After losing its Hydro-Quebec wind farm bids in May, and announcing timing setbacks to two of its three construction projects, we believe investors are now focused on the successful execution of its PPAs in hand.
There is upside to Innergex’s share price should a substantial portion of its pipeline be commissioned as planned. In our view, by early 2009, Innergex’s operating assets, fund management fees, and investment in the fund will set a floor price of $6.90 per share, implying about $2.60 per share for its development pipeline, based on our one-year target price.
We like Innergex’s strategic agreement with Federation Quebecoise des Municipalites that essentially designates Innergex as the preferred partner for the development of wind farm projects under the anticipated 250 MW Quebec Municipal Wind RFP (Q4/08).
F I N A N C I A L O U T L O O K
Innergex’s revenue stream is diverse and comparable to a young Boralex. Our financial forecast suggests the company will become EPS-positive (on a recurring basis) in Q2/09. We estimate 2009 revenue and EBITDA of $23.3 million and $14.3 million, respectively. With the addition of new wind and hydro capacity expected to be commissioned over the next 12 to 24 months, our 2010 revenue and EBITDA estimates soar to $46.4 million and $33.9 million, respectively.

The Choice of a New Generation August 2008
157
Exhibit 5.2: Innergex Renewable Energy Inc. – Stock Performance
$6.00
$8.00
$10.00
$12.00
$14.00
$16.00
$18.00
$20.00
Dec-07 Feb-08 Apr-08 Jun-08
Pric
e
050100150200250300350400450500
Daily
Vol
ume
(000
s)
INE (Volume) INE (Price) STUTIL (rebased) SPTSX (rebased)
$193.9M
INE$8.25
$14.00$6.7623.5M
Ticker:Last Price:Market Cap:52 Wk High:52 Wk Low :Shares O/S:
Source: Bloomberg; Scotia Capital.
Capital Markets Profile Innergex is a developer and operator of Canadian hydro and wind power facilities. It owns and operates an 8 MW hydro facility in Ontario, and has signed PPAs for 293 MW (net to INE) of hydro and wind projects that are under construction, construction-ready, or completing permitting. INE also has a 16.1% equity interest in Innergex Power Income Fund (the “Fund”). The Fund, which has an ownership interest in 210 MW of renewable power capacity (33.8 MW net to INE), is operated by Innergex for which Innergex charges a management fee. Additionally, Innergex has 2,300 MW of prospective projects in its development pipeline. Innergex intends to commission its current PPA-signed projects by the end of 2012.
In December 2007, Innergex completed its initial public offering, raising $115 million ($120.2 million after exercise of over-allotment) to fund a large portion of the equity requirements for its signed PPA renewable power projects. Around the same time, and by way of a private placement, an additional $122 million was raised by Innergex to purchase the outstanding portion it did not own at the time of Innergex II, the company that held all of the operating and development assets. Additionally, Innergex II sold its 38% interest in two Cartier portfolio wind farms to the Fund for an effective 16.1% interest in the Fund.
The management team at Innergex is solid and is led by Michel Letellier, who was appointed President and CEO near the time of INE’s 2007 IPO. Mr. Letellier spent seven years with Boralex before joining Innergex as CFO in 1997. The founder of Innergex, Mr. Gilles Lefrancois, is the company’s Executive Chairman of the board of directors, and still provides the strategic vision for the company. Mr. Letellier is backed by a large management team that has many years of energy development experience.
With a market capitalization of slightly under $200 million, Innergex’s common shares trade on the Toronto Stock Exchange under the symbol INE. Insiders and related parties control (directly or indirectly) about 12.7% of outstanding INE shares, and the company’s shareholder base is located mostly in North America. Innergex reports in Canadian dollars, using a December 31 year-end, and its financial statements are prepared in accordance with GAAP. Exhibit 5.2 shows the recent share price performance of INE.
We expect Innergex to have 60 MW of operating capacity by the end of 2008.
Innergex’s IPO was completed in December 2007, raising $115 million.
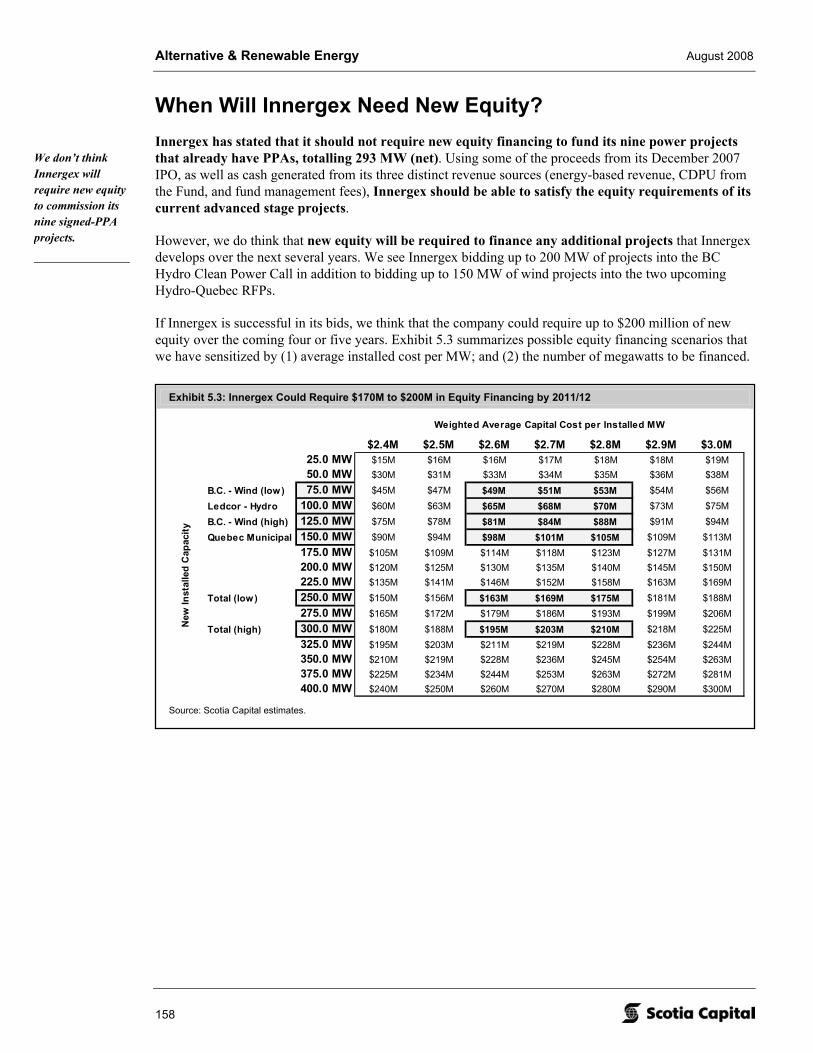
Alternative & Renewable Energy August 2008
158
Exhibit 5.3: Innergex Could Require $170M to $200M in Equity Financing by 2011/12
100100.44 $2.4M $2.5M $2.6M $2.7M $2.8M $2.9M $3.0M
25.0 MW $15M $16M $16M $17M $18M $18M $19M50.0 MW $30M $31M $33M $34M $35M $36M $38M
B.C. - Wind (low) 75.0 MW $45M $47M $49M $51M $53M $54M $56M
Ledcor - Hydro 100.0 MW $60M $63M $65M $68M $70M $73M $75M
B.C. - Wind (high) 125.0 MW $75M $78M $81M $84M $88M $91M $94M
Quebec Municipal 150.0 MW $90M $94M $98M $101M $105M $109M $113M175.0 MW $105M $109M $114M $118M $123M $127M $131M200.0 MW $120M $125M $130M $135M $140M $145M $150M225.0 MW $135M $141M $146M $152M $158M $163M $169M
Total (low) 250.0 MW $150M $156M $163M $169M $175M $181M $188M275.0 MW $165M $172M $179M $186M $193M $199M $206M
Total (high) 300.0 MW $180M $188M $195M $203M $210M $218M $225M325.0 MW $195M $203M $211M $219M $228M $236M $244M350.0 MW $210M $219M $228M $236M $245M $254M $263M375.0 MW $225M $234M $244M $253M $263M $272M $281M400.0 MW $240M $250M $260M $270M $280M $290M $300M
New
Inst
alle
d C
apac
ity
Weighted Average Capital Cost per Installed MW
Source: Scotia Capital estimates.
When Will Innergex Need New Equity? Innergex has stated that it should not require new equity financing to fund its nine power projects that already have PPAs, totalling 293 MW (net). Using some of the proceeds from its December 2007 IPO, as well as cash generated from its three distinct revenue sources (energy-based revenue, CDPU from the Fund, and fund management fees), Innergex should be able to satisfy the equity requirements of its current advanced stage projects.
However, we do think that new equity will be required to finance any additional projects that Innergex develops over the next several years. We see Innergex bidding up to 200 MW of projects into the BC Hydro Clean Power Call in addition to bidding up to 150 MW of wind projects into the two upcoming Hydro-Quebec RFPs.
If Innergex is successful in its bids, we think that the company could require up to $200 million of new equity over the coming four or five years. Exhibit 5.3 summarizes possible equity financing scenarios that we have sensitized by (1) average installed cost per MW; and (2) the number of megawatts to be financed.
We don’t think Innergex will require new equity to commission its nine signed-PPA projects.

The Choice of a New Generation August 2008
159
Exhibit 5.4: Forecast Hydro Production Through 2012
0
50
100
150
200
250
Q1-08 Q1-09E Q1-10E Q1-11E Q1-12E
GW
h pe
r Qua
rter
Actual
Forecast
Source: Scotia Capital estimates.
Exhibit 5.5: Forecast Wind Production Through 2012
0
20
40
60
80
100
120
Q1-08 Q1-09E Q1-10E Q1-11E Q1-12E
GW
h pe
r Qua
rter
Forecast
Source: Scotia Capital estimates.
Production Profile & Outlook H Y D R O
Innergex’s 8 MW Glen Miller hydroelectric plant is the company’s only operating asset (excluding those assets indirectly owned through its 16.1% interest in the Fund), producing 41.5 GWh/y, or at a capacity factor of 59.2%. In our opinion, the facility generates about $2.7 million in energy sales per year, under a 20-year PPA with the Ontario Power Authority. The Ontario-based plant was commissioned in December 2005.
Looking ahead, we estimate 148.8 MW (net to INE) of new hydro capacity will come online by the end of 2011, adding a further 644 GWh/y of hydro-based generation. Specifically, we expect the 49%-owned 23 MW Umbata Falls to be in service in 2008, generating 53.5 GWh of power net to Innergex. By the end of 2009, the fully-owned 49.9 MW Ashlu Creek, located in B.C., should be commissioned, providing 265 GWh/y of incremental output to Innergex’s portfolio. One year later, the remaining 326 GWh/y of hydro-
based power generation could be operational as the Quebec-based Matawin project (15 MW) and B.C.-based Mkw’Alts (47.7 MW) and Kwoiek Creek (25 MW net to INE) projects come online.
We estimate Innergex’s installed capital costs to bring on 148.8 MW of new hydro capacity to be $404 million, or about $2.72 million per MW. Under a best-case scenario, where all expected new capacity is commissioned on time and on budget, with no operational issues, we forecast 2011E hydro-based revenue of $36.6 million.
W I N D
Innergex has no installed wind capacity, for now. However, through its 38%-owned JV with TransCanada, 109.5 MW of wind capacity should be commissioned by the end of 2008. The JV is developing the Cartier portfolio of wind projects, which includes multiple Quebec-based wind farms. We estimate that the Carleton wind farm, due online in Q4/08, should provide 129.4 GWh/y of output net to Innergex, or over $9 million of revenue in its first full year of operation.
Beyond 2009, Innergex is working toward an additional 270 MW from its Cartier JV (102.6 MW net to INE) with estimated in-service dates before the end of 2012, as well as another 900+ MW of Quebec-based prospective wind projects. Additionally, 475 MW of B.C.-based wind capacity has been targeted by the company for future development, of which we think that 75 MW to 125 MW will be bid into the BC Hydro Clean Power Call.
We estimate Innergex will have almost 150 MW of operating hydro capacity by 2011.
Innergex’s first wind farms should be online by the end of 2008.

Alternative & Renewable Energy August 2008
160
Exhibit 5.7: Innergex’s Management Fees from the Fund
Contract 2008E 2009E($M) ($M)
Management Agreement 0.91 0.93Incentive Fee 0.74 0.74Administration Agreement 0.11 0.11Services Agreement* 0.00 0.00
1.76 1.79
* Out-of-pocket expenses covered
Source: Scotia Capital estimates.
Exhibit 5.6: Innergex Power Income Fund’s Operating Assets
Power Remaining Gross IEF.u INE Gross INEFacility Location Purchaser PPA Term Capacity Interest Interest Generation Interest
(years) (MW) (%) (%) (GWh/y) (GWh/y)Hydro
St. Paulin Quebec Hydro-Qubec 6 8.0 100% 16.1% 41.1 6.6Portneuf-1 Quebec Hydro-Qubec 13 8.0 100% 16.1% 40.8 6.6Portneuf-2 Quebec Hydro-Qubec 13 9.9 100% 16.1% 68.5 11.0Portneuf-3 Quebec Hydro-Qubec 13 8.0 100% 16.1% 42.4 6.8Chaudiere Quebec Hydro-Qubec 11 24.0 100% 16.1% 116.7 18.8Montmagny Quebec Hydro-Qubec 13 2.1 100% 16.1% 8.0 1.3Windsor Quebec Hydro-Qubec 8 5.5 100% 16.1% 31.0 5.0Batawa Ontario Ontario Power Authority 21 5.0 100% 16.1% 32.9 5.3Rutherford Creek B.C. BC Hydro 16 49.9 100% 16.1% 180.0 29.0Horseshoe Bend Idaho Idaho Power 22 9.5 100% 16.1% 46.8 7.5
WindBaie-des-Sables Quebec Hydro-Qubec 18 109.5 38% 6.1% 298.3 18.3Anse-a-Valleau Quebec Hydro-Qubec 19 100.5 38% 6.1% 298.0 18.2
340 MW 210 MW 34 MW 1,204.5 134.4
Source: Company reports; Scotia Capital.
Innergex Power Income Fund
Innergex Power Income Fund (IEF.u-T) operates seven run-of-river facilities in Quebec, one in Ontario, one in B.C., and one south of the border, in Idaho. As well, the Fund has a 38% interest in two Quebec-based wind farms with its 62% partner, TransCanada Corp. Exhibit 5.6 summarizes the Fund’s operational assets. Total installed capacity net to Innergex is 33.8 MW at a weighted average capacity factor of 45.4%.
Innergex owns 16.1% of IEF.u, currently worth about $60.6 million, or 1.7% below Innergex’s $61.7 million investment into the Fund. Concurrently with its initial public offering, Innergex sold its 38% interests in the 109.5 MW Baie-des-Sables and the 100.5 MW Anse-a-Valleau wind farms to the Fund. Payment to Innergex by the Fund was made through the issuance of 4.7 million trust units that was valued at $61.7 million on the date of the transaction.
The Fund currently distributes 8.33¢ per unit per month, or $1.00 per annum, or $4.7 million to Innergex per year. We believe that this rate of distributable cash per unit (DCPU) will be maintained throughout at least 2008 and 2009.
In addition to its 16.1%-ownership interest in the Fund, Innergex earns various fees related to management of the Fund, which we expect to be approximately $1.76 million in 2008 and $1.79 million in 2009, as per Exhibit 5.7. Innergex’s management agreements with the Fund have a current expiry date of 2030, which will automatically be renewed for five-year periods unless notice of non-renewal is given by either party.
Innergex has a long-term management agreement with the Fund that expires in 2030, and also owns 16.1% of the Fund.

The Choice of a New Generation August 2008
161
Exhibit 5.9: Sources and Uses of Innergex’s Funds
Sources ($M) Uses ($M)
IPO proceeds 115.0 Acquisition of Innergex II 63.4Private placement 58.8 Repayment of Innergex II debt 123.9Sale of two Innergex II wind farms 61.7 Underwriters fees 6.0
Other IPO expenses 6.0Special dividend 3.8Construction of new capacity 30.0General corporate purposes 2.4
$235.5 $235.5
Source: Company reports; Scotia Capital estimates.
Exhibit 5.8: Institutional Ownership of Innergex
Institutional Investor FD Ownership(%)
CDPQ 10.2%Regime de rentes du Mouvement Desjardins 10.2%Kruger Inc. Master Trust 10.2%TD Capital Ltd. 10.2%Sun Life 3.7%
Source: Innergex; Scotia Capital.
A Big Day for a Small Company On December 6, 2007, Innergex completed its initial public offering of $115 million, and its shares began trading on the Toronto Stock Exchange under the ticker symbol INE-T. Concurrent to its IPO, Innergex completed a variety of transactions that set the foundation of today’s company. Those transactions, detailed below, included a private placement, the sale of interests in certain operating facilities, and the purchase from equity partners of Innergex II.
I N I T I A L P U B L I C O F F E R I N G
Priced at $11 per share, Innergex raised gross proceeds of $115 million on the 10.455 million shares it issued under its IPO. Underwriters’ fees totalled $6.04 million, while other expenses totalled $6 million, for net proceeds to the company of about $103 million. Prior to the final IPO price of
$11 per share, the deal had been marked down twice from an original range of $14 to $16.
P R I V A T E P L A C E M E N T
Innergex issued 5.34 million shares at $11 per share to various institutional investors for proceeds of $58.77 million. The group that purchased the shares included: TD Capital, Desjardins, CDPQ, Sun Life, and Kruger Inc. (Exhibit 5.8).
P U R C H A S E O F I N N E R G E X I I
Innergex purchased the outstanding equity interests in Innergex II for $63.4 million. For payment, Innergex issued the equity partners a total of 5.76 million shares @ $11 per share.
Innergex repaid and purchased all of the outstanding Innergex II debt owed to the equity partners for $123.9 million.
I N N E R G E X I I S E L L S T W O W I N D F A R M I N T E R E S T S
Innergex II sold its 38% interests in two wind farms to Innergex Power Income Fund for $61.7 million. Payment to Innergex II by the Fund was satisfied by the issuance of 4.7 million fund units, resulting in a 16.1% equity interest in the Fund by Innergex. The 109.5 MW Baie-des-Sables wind farm and the 100.5 MW Anse-a-Valleau wind farm are both Cartier projects that are 62% owned by TransCanada. Through its partial ownership of the Fund, Innergex effectively owns a 6.1% interest in each of the two wind farms.
Institutional shareholders and management control over 50% of the company.

Alternative & Renewable Energy August 2008
162
Overview of Projects G L E N M I L L E R : I N N E R G E X ’ S O N L Y O P E R A T I N G F A C I L I T Y
Located near Trenton, Ontario, Innergex’s 8 MW Glen Miller hydroelectric plant is the company’s only 100%-owned operating power generation facility. With an average annual production of 41.5 GWh/y, the plant’s capacity factor is 59.2%. On a per MW basis, the construction cost of the facility was $2.81 million (2004 dollars), for a total cost of $22.5 million. The hydro project has a 20-year PPA with the Ontario Power Authority that expires in 2025. The initial PPA price per MWh in 2006 was a little above $66, and is indexed annually to 15% of the change in Canada’s CPI.
U M B A T A F A L L S : U N D E R C O N S T R U C T I O N
Innergex’s 49%-owned 23 MW Umbata Falls hydro project is currently under construction with an expected commissioning date of Q4/08. The facility is expected by management to operate at a 54.2% capacity factor, and generate about 109 GWh/y. The $60 million project, or $2.61 million per MW, is 85% debt financed with the $9 million equity portion partially financed by the company’s IPO proceeds as well as its free cash flow. The plant has a 20-year signed PPA with the Ontario Power Authority that we believe will expire near the end of 2028. In our opinion, the Umbata Falls project will receive a 2008 power price of about $73.50/MWh, which is indexed annually to 15% of the change in CPI. Additionally, we expect the project to receive a $10/MWh federal ecoENERGY incentive payment for the first 10 years of operations.
A S H L U C R E E K : U N D E R C O N S T R U C T I O N
The 49.9 MW Ashlu Creek project, located near the Squamish River in B.C., is forecast to generate 265 GWh/y, representing a solid 60.6% capacity factor. Construction has been underway for two years with commercial operations due in 2009. The $132 million price tag for the facility, or $2.65 million per MW, will be 83% debt financed with the 17% equity portion coming from Innergex’s IPO proceeds. The project has a 30-year PPA with BC Hydro with an initial power price of $56.36/MWh that is adjusted by 50% of the annual change in CPI. We believe the project will receive a $10/MWh federal ecoENERGY incentive payment for the first 10 years of operations. In addition to a revenue-based royalty scheme provided to the Squamish First Nation, and for a nominal price, Innergex will transfer all of the assets of the project to the Squamish First Nation 40 years after commercial operations have commenced.
M A T A W I N : P P A C O U L D B E F I N A L I Z E D B Y N O V E M B E R
The 15 MW Matawin run-of-river project boasts a 49.9% capacity factor and is expected by Innergex to be commissioned sometime in 2010.
Located near the Saint-Maurice River in Quebec, the project has not finalized its 25-year PPA with Hydro-Quebec, although the project was selected by a Quebec RFP in 2002. Innergex is confident that it will finalize its Matawin PPA shortly as the initial power price to be received in the facility’s first year of operation is a very low at $39.40/MWh, and therefore quite favourable to Hydro-Quebec. The power price is expected to increase each contract year by 0.6%.
We suspect the introduction of the $10/MWh federal ecoENERGY incentive payment is the only reason why the project was not dropped by Innergex. The installed capital cost for Matawin is forecast by the company at $24.6 million, or $1.64 million per MW. The facility will be 73% debt financed with the equity portion provided by Innergex’s IPO proceeds as well as cash flow from operations. Under the terms of the RFP, ownership of the Matawin facility will be transferred to Hydro-Quebec when the 25-year PPA expires.
Innergex finances its projects using 70% to 85% debt.
Many of Innergex’s PPAs are at below-market prices.

The Choice of a New Generation August 2008
163
K W O I E K C R E E K : W H E R E ’ S T H E W A T E R L I C E N C E ?
Despite having a 40-year PPA from BC Hydro, Innergex’s 50%-owned 49.9 MW Kwoiek run-of-river hydro project does not have an approved water licence, which was first applied for in 1990. The $152 million project, or $3.05 million per MW, is expected to generate power at a 49.2% capacity factor, or 215 GWh/y. Innergex appears certain that it will receive its water licence as it intends to commence construction in late 2008 with an in-service date sometime in 2010. The project is 50% owned by the Kanaka Bar Indian Band, which will receive royalty payments as well as the transfer of the project’s assets for a nominal price after 40 years. The initial 2006 PPA price was set at $81.68/MWh, which is adjusted annually by 30% of the change in CPI.
M K W ’ A L T S : E X P I R E D P P A T O B E R E N E G O T I A T E D
Under the terms of a 20-year BC Hydro PPA, the 47.7 MW Mkw’Alts hydro project had a deadline to begin commercial operations by September 2007. Almost one year later, construction has not begun. Innergex expects to renegotiate with BC Hydro for an extension to December 2010, as well as an increase in the PPA length to 30 years from 20 years. The rationale behind Innergex’s confidence that BC Hydro will approve this is due to the favourable PPA power price that BC Hydro will pay the project. The 2004 awarded power price is $57.26/MWh, which will be adjusted annually by 50% of the change in CPI. Should the project move forward, we believe that it will receive the $10/MWh federal ecoENERGY incentive payment for the first 10 years of its operations. Despite the project being located on public lands (near Mount Currie, B.C.), Innergex intends to negotiate with the Mount Currie Indian Band for a royalty payment to the Band to ensure their support of the project. The installed capital cost for Mkw’Alts is $87.3 million, or $1.83 million per MW.
C A R L E T O N : D U E O N L I N E I N Q 4 / 0 8
The 109.5 MW Carleton wind farm is part of the larger Cartier portfolio of wind power projects, a JV between TransCanada (62%) and Innergex (38%). Currently under construction, commissioning of the $181.2 million facility is expected in Q4/08, with a forecast annual electricity generation of 340.5 GWh/y, or a high capacity factor of 35.5%. Seventy-three GE 1.5 MW turbines will be used at the wind farm that have a GE-guaranteed 96% availability and are under a five-year warranty. At $1.65 million per MW installed, we find the project quite inexpensive, especially given its high-quality turbines. The project has a 20-year PPA with Hydro-Quebec at a 2004 starting power price of $73.32/MWh, which changes annually according to a formula that includes CPI changes. While we believe the project will qualify for and receive the $10/MWh ecoENERGY federal incentive payment for its first 10 years of operations, the PPA states that Hydro-Quebec is entitled to 75% of the incentive. Accordingly, our financial forecast uses a $2.50/MWh net to Innergex federal incentive for its 38% share of the project.
M O N T A G N E - S E C H E : P P A , B U T R E G U L A T O R Y A P P R O V A L S F A R A W A Y
Located near Cloridorme, Quebec, the 58.5 MW Montagne-Seche wind farm project is estimated to yield a strong 35.7% capacity factor, assuming annual electricity output of 182.7 GWh/y. With an installed capital cost of $103 million, or $1.76 million per MW, the 38% Innergex-owned project (i.e., part of the Cartier portfolio) is expected to come online in 2011. A 20-year PPA has been signed with Hydro-Quebec with a 2004 power price of $68.80/MWh that changes annually according to a formula that includes CPI changes. We believe the project will qualify for and receive the $10/MWh ecoENERGY federal incentive payment, or $2.50/MWh net to Innergex’s 38% ownership of the project.
Innergex intends to transfer many projects’ assets to local First Nations bands at the expiration of the associated PPAs.
Despite a minority equity interest in its Cartier JV, Innergex shares decision making equally with its JV partner, TransCanada Corporation.

Alternative & Renewable Energy August 2008
164
Exhibit 5.10: Innergex’s Portfolio of Assets and Development Prospects (Excluding Interest in the Fund)
Net Est. Capacity Power PPAProject/Site Location Cap. Pdn Factor Purchaser Expiry Low High
(MW) (GWh/y) (%) ($M) ($M)
WindCarleton Quebec 41.6 129.4 35.5% Hydro-Quebec 2028 68.9 93.6Montagne Seche Quebec 22.2 69.4 35.7% Hydro-Quebec 2031 39.1 50.0Gros Morne I Quebec 38.2 118.8 35.5% Hydro-Quebec 2032 62.9 85.9Gros Morne II Quebec 42.2 131.2 35.5% Hydro-Quebec 2032 69.5 94.9Roussillon Quebec 108.0 312.5 33.0% - - 189.0 243.0Kamouraska Quebec 124.5 363.0 33.3% - - 217.9 280.1Saint-Constant Quebec 70.0 220.0 35.9% - - 122.5 157.5Club des Hauteurs Quebec 195.5 600.0 35.0% - - 342.1 439.9Haute-Cote-Nord Est Quebec 170.0 530.0 35.6% - - 297.5 382.5Haute-Cote-Nord Ouest Quebec 168.0 540.0 36.7% - - 294.0 378.0Riviere-aux-Renards Quebec 12.5 37.0 33.8% - - 21.9 28.1Les Mechins Quebec 57.0 150.2 30.1% - - 99.8 128.3(9 Various) B.C. 1,217.5 3,732.9 ~35.0% - - 2,130.6 2,739.4
2,267.2 6,934.3 34.9% 3,955.7 5,101.2
HydroGlen Miller Ontario 8.0 41.5 59.2% OPA 2025Umbata Falls Ontario 11.3 53.5 54.2% OPA 2028 29.4 32.3Ashlu Creek B.C. 49.9 265.0 60.6% BC Hydro 2039 132.2 149.7Matawin Quebec 15.0 62.5 47.6% Hydro-Quebec 2034 24.6 28.0Kwoiek Creek B.C. 25.0 107.5 49.2% BC Hydro 2050 76.0 84.0Mkw'Alts B.C. 47.7 156.0 37.3% BC Hydro 2030 87.3 96.2Kaipit B.C. 9.9 31.0 35.7% - - 26.2 29.7Kokish B.C. 9.9 38.4 44.3% - - 26.2 29.7Kipawa Quebec 20.2 115.2 65.2% - - 53.4 60.5(Ledcor 18) B.C. 133.3 700.8 ~60.0% - - 353.3 400.0
330.1 1,571.4 54.3% 853.1 964.9
Total 2,597.3 8,505.7 37.4%
Status/Est. Cost
Online
Source: Company reports; Scotia Capital estimates.
G R O S M O R N E P H A S E S I & I I : P P A , R E G U L A T O R Y P R O C E S S U N D E R W A Y
Also part of the Cartier portfolio are the Gros Morne wind power projects, which consist of two phases, representing a combined 211.5 MW of capacity and 657.7 GWh/y of electricity output, or a 35.5% capacity factor. Phase I (100.5 MW) is expected by Innergex to commence commercial operations in 2011, while Phase II (111 MW) could come online one year later. Similar to the Carleton project, GE 1.5 MW turbines will be used for both phases of the project. Both phases of the project have 21-year signed PPAs with Hydro-Quebec at a 2004 initial price of $65.58/MWh that increases annually according to a formula that includes CPI changes.
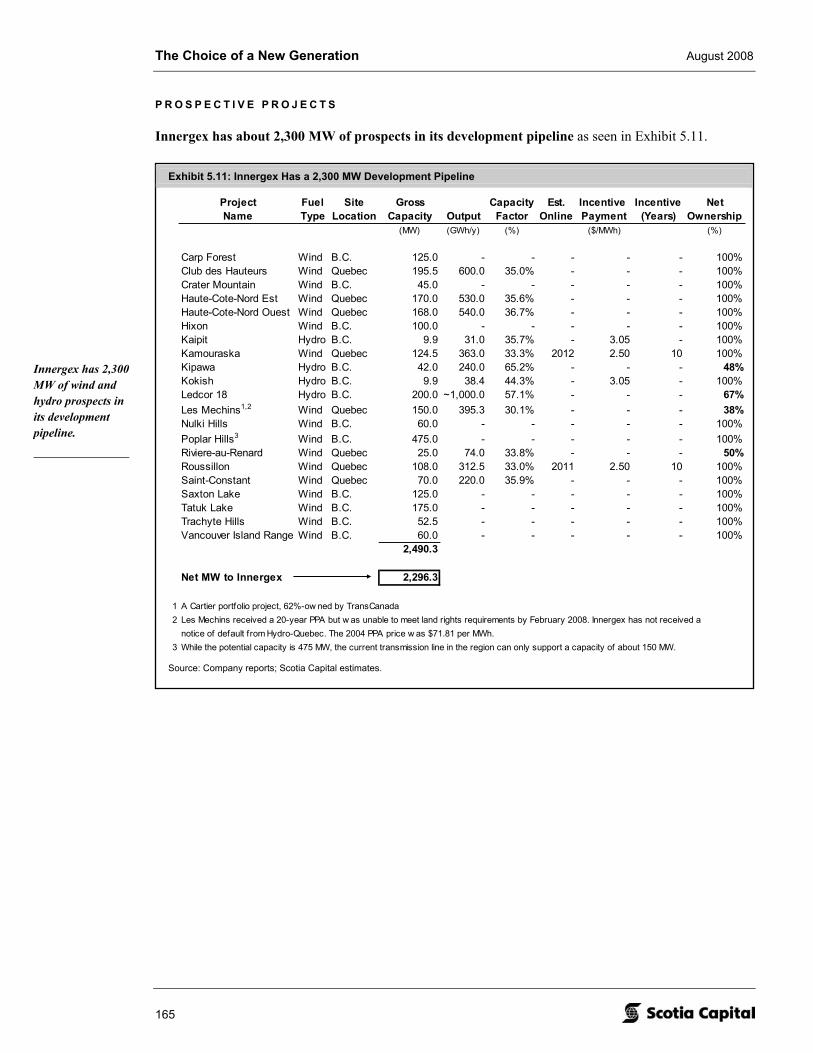
The Choice of a New Generation August 2008
165
Exhibit 5.11: Innergex Has a 2,300 MW Development Pipeline
Project Fuel Site Gross Capacity Est. Incentive Incentive NetName Type Location Capacity Output Factor Online Payment (Years) Ownership
(MW) (GWh/y) (%) ($/MWh) (%)
Carp Forest Wind B.C. 125.0 - - - - - 100%Club des Hauteurs Wind Quebec 195.5 600.0 35.0% - - - 100%Crater Mountain Wind B.C. 45.0 - - - - - 100%Haute-Cote-Nord Est Wind Quebec 170.0 530.0 35.6% - - - 100%Haute-Cote-Nord Ouest Wind Quebec 168.0 540.0 36.7% - - - 100%Hixon Wind B.C. 100.0 - - - - - 100%Kaipit Hydro B.C. 9.9 31.0 35.7% - 3.05 - 100%Kamouraska Wind Quebec 124.5 363.0 33.3% 2012 2.50 10 100%Kipawa Hydro B.C. 42.0 240.0 65.2% - - - 48%Kokish Hydro B.C. 9.9 38.4 44.3% - 3.05 - 100%Ledcor 18 Hydro B.C. 200.0 ~1,000.0 57.1% - - - 67%Les Mechins1,2 Wind Quebec 150.0 395.3 30.1% - - - 38%Nulki Hills Wind B.C. 60.0 - - - - - 100%Poplar Hills3 Wind B.C. 475.0 - - - - - 100%Riviere-au-Renard Wind Quebec 25.0 74.0 33.8% - - - 50%Roussillon Wind Quebec 108.0 312.5 33.0% 2011 2.50 10 100%Saint-Constant Wind Quebec 70.0 220.0 35.9% - - - 100%Saxton Lake Wind B.C. 125.0 - - - - - 100%Tatuk Lake Wind B.C. 175.0 - - - - - 100%Trachyte Hills Wind B.C. 52.5 - - - - - 100%Vancouver Island Range Wind B.C. 60.0 - - - - - 100%
2,490.3
Net MW to Innergex 2,296.3
1 A Cartier portfolio project, 62%-ow ned by TransCanada2 Les Mechins received a 20-year PPA but w as unable to meet land rights requirements by February 2008. Innergex has not received a
notice of default from Hydro-Quebec. The 2004 PPA price w as $71.81 per MWh.3 While the potential capacity is 475 MW, the current transmission line in the region can only support a capacity of about 150 MW.
Source: Company reports; Scotia Capital estimates.
P R O S P E C T I V E P R O J E C T S
Innergex has about 2,300 MW of prospects in its development pipeline as seen in Exhibit 5.11.
Innergex has 2,300 MW of wind and hydro prospects in its development pipeline.

Alternative & Renewable Energy August 2008
166
Key Investment Risks
In our opinion, execution risk is the largest threat to our one-year target price for Innergex Renewable Energy as the company has installed less than 1% of its planned capacity. Similar to its IPP peers, the company faces numerous other risks that could negatively impact its share price, all of which are not unique to the company. Below, we have highlighted the key investment risks to our one-year target price for Innergex.
E X E C U T I O N R I S K
Innergex has well over 2,300 MW of hydro and wind renewable power capacity that it seeks to install and operate over the next decade. Less than 15% of this capacity has received long-term power purchase agreements, leaving a substantial risk that PPAs for its prospective projects may not be received. For several of its projects with PPAs, Innergex does not hold all of the required approvals, licences, and permits needed to proceed to construction and eventual commissioning.
Permitting holdups may lead to time delays, project cost overruns, and possible financial penalties for failure to deliver electricity as contractually required. However, we note that Innergex has a track record of commissioning power plants both on time and within budget.
W E A T H E R & C L I M A T E C H A N G E
Innergex’s operating and planned wind farms and hydro facilities are subject to unpredictable weather and climate patterns that may lead to material deviations from our quarterly production forecast. The relative risk of resource variability to quarterly earnings will undoubtedly lower as more capacity is brought online. Similar to Boralex, Innergex’s stable quarterly management fee and ownership interest in the Fund acts as a partial risk mitigant to resource variability.
C O M P E T I N G B I D S
Some of Innergex’s prospective projects include lands that are covered by PPA bids made by competing independent power producers. Accordingly, if a PPA is awarded to another power producer, the prospective project would either be reduced in size or abandoned altogether.
R E G U L A T O R Y & P O L I T I C A L E N V I R O N M E N T
Transforming Innergex’s pipeline of prospects into operational assets depends heavily on the continuation of favourable federal and provincial initiatives that promote the development of renewable power as a viable alternative to traditional coal- and gas-fired power generation technologies.
Our financial forecast assumes that current federal and provincial renewable power incentives, targets, and initiatives will continue indefinitely.
F I R S T N A T I O N S S U P P O R T
Lack of agreements or unfavourable outcomes to negotiations with First Nations groups that claim the land base on which Innergex’s projects lie could adversely affect the company’s profitability. Without the support of local First Nations communities, INE’s projects could be delayed or even terminated. The company has reached settlements with many First Nations bands that support the construction and operation of its projects on their land.
Execution risk is the largest threat to our one-year target price of $9.50 per share.
Innergex’s 150 MW Les Mechins wind farm is technically in default of its PPA terms with Hydro-Quebec.

The Choice of a New Generation August 2008
167
F I N A N C I N G
Innergex’s cost of capital may increase and its access to capital could be constrained going forward. Unlike some of its peers like EarthFirst and Plutonic Power, Innergex already generates free cash flow from its fund management fees and distributions, as well as from its only operating facility, the 8 MW Glen Miller hydro plant. As more than 85% of the company is yet to be funded, we view financing risk as high for Innergex.
Innergex depends on distributable cash receipts from the Fund to pay its interest and other operating expenses. For 2008 and 2009, we forecast $4.7 million per year of cash received by Innergex from the Fund.
M A N A G E M E N T
We believe key management risk is high at Innergex as the company only has several people in full-time senior management positions. Overall, there are 59 employees at Innergex, which includes 14 employees of the Fund. Innergex is heavily dependent on its President and CEO, as well as the founder and Executive Chairman of the Innergex to promote the company and realize its future growth opportunities. If a key member of Innergex’s management team were to leave the company, operations and earnings could be significantly impaired.
O P E R A T I O N A L
In our view, operational risk is high for Innergex due to its limited operating capacity. While the nature of multiple-turbine wind farms allow for one to several wind turbines to be offline at any given time without a major impact to the operation of the facility, not to mention the earnings of the overall company, Innergex does not have this benefit, for now. Additionally, equipment failures at hydro facilities typically result in a temporary shutdown of the entire project.
W I N D T U R B I N E S U P P L Y
With the current supply-constrained market for wind turbines, Innergex may face longer-than-expected lead times for its turbine orders. As a result of soaring wind turbine demand in Europe and North America, as well as limited U.S.-based turbine manufacturers, the current supply/demand imbalance for wind turbines will likely continue over the next several years. Many North American wind farm projects now wait up to two years to receive turbines once an order has been placed.
We note that all wind turbines for Innergex’s Cartier JV with TransCanada have been secured. The Cartier project includes the following sites: Baie-des-Sables (commissioned), Anse-a-Valleau (commissioned), Carleton (109.5 MW), Les Mechins (150 MW), Montagne-Seche (58.5 MW), and Gros-Morne I and II (211.5 MW).
Key management risk at Innergex is high.

Alternative & Renewable Energy August 2008
168
Exhibit 5.12: Upcoming Stock Catalysts & Events
Sep 08 Oct 08 Nov 08 Dec 08 Q1/09 Q2/09 Q3/09 Q4/09
Kaipit into B.C. SOP?
Ashlu Creek and Matawin
due online
BC Hydro RFP bids
due
BC Hydro EPAs
awarded
Carleton & Umbata Falls due
online
Kokish into B.C.
SOP?
2009 BC Hydro Clean Power Call?Quebec Municipal and First Nations RFPs?
Source: Scotia Capital estimates.
Upcoming Stock Catalysts & Events Similar to most Canadian renewable power developers, we see several events over the next two years that could significantly move Innergex Renewable Energy’s share price. In our view, awards of new capacity and the commissioning of capacity under construction will likely have the most material impacts on INE’s share price. Below, we have listed what we believe to be major short- to mid-term stock catalysts for Innergex (Exhibit 5.12).
November 2008 – BC Hydro 2008 Clean Power Call bids due. We expect Innergex will submit up to 125 MW of wind projects and up to 100 MW of (Ledcor) hydro projects into this RFP.
Q4/08 – Commissioning of the 23 MW Umbata Falls hydro project in Ontario (11.3 MW net).
Q4/08 – Commissioning of the 109.5 Carleton wind farm in Quebec (41.6 MW net).
1H/09 – BC Hydro 2008 Clean Power Call awards expected, likely after the B.C. government election that is scheduled for May 2009.
Q4/09 – Commissioning of the 49.9 MW Ashlu Creek hydro project in B.C.
Q4/09 – Commissioning of the 15 MW Matawin hydro project in Quebec.
Unknown – Bids/awards of the two 250 MW Quebec wind RFPs (i.e., Municipal and First Nations).
Ongoing – Announcement of significant new greenfield or acquisition-based development prospects, projects, or operating assets.
Ongoing – Announcement of bids/awards into the B.C. Standard Offer Program.
We expect Umbata Falls and Carleton to be commissioned before the end of 2008.
We anticipate Hydro-Quebec announcing two 250 MW wind RFPs in late 2008.

The Choice of a New Generation August 2008
169
Exhibit 5.13: Innergex’s Likely Bid-Ready Projects
Gross Net to INE CapacityTechnology Ownership Capacity Capacity Factor
(%) (MW) (MW) (%)
Kamouraska Wind 100% 124.5 124.5 33.3%Riviere-au-Renard Wind 50% 25.0 12.5 33.8%Roussillon Wind 100% 108.0 108.0 33.0%Saint-Constant Wind 100% 70.0 70.0 35.9%Others Wind 100% ~50.0 ~50.0 -
365.0
Gross Net to INE CapacityTechnology Ownership Capacity Capacity Factor
(%) (MW) (MW) (%)
Carp Forest Wind 100% 125.0 125.0 -Crater Mountain Wind 100% 45.0 45.0 -Hixon Wind 100% 100.0 100.0 -Nulki Hills Wind 100% 60.0 60.0 -Poplar Hills Wind 100% 475.0 475.0 -Saxton Lake Wind 100% 125.0 125.0 -Tatuk Lake Wind 100% 175.0 175.0 -Trachyte Hills Wind 100% 52.5 52.5 -Vancouver Island Range Wind 100% 60.0 60.0 -Some of the Ledcor 18? Hydro 67% 60.0 40.0
1,257.5
Gross Net to INE CapacityTechnology Ownership Capacity Capacity Factor
(%) (MW) (MW) (%)
Kaipit Hydro 100% 9.9 9.9 35.8%Kokish Hydro 100% 9.9 9.9 44.3%Some of the Ledcor 18? Hydro 67% 8.0 5.3
25.1
1,647.6
Quebec Municipal and/or First Nations
BC Hydro Clean Power Call
BC Hydro SOP
We expect about 150 MW bid in
Quebec
We expect about 200 MW bid in
B.C.
Source: Scotia Capital estimates.
Our Best Guess on Innergex’s Future PPA Bids
We think that Innergex could bid up to 350 MW into various RFPs over the next year, from a pool of bid-ready projects that total over 1,600 MW. We believe that the company will only bid on projects located in Quebec and B.C. In Exhibit 5.13, we have outlined Innergex’s bid-ready projects, and which RFP(s) we think each project will be bid into.
For the Quebec Municipal and First Nations RFPs, the terms of the RFPs have not been released yet (likely Q4/08), but the PPA price is set at $95/MWh and projects are limited in size to 25 MW. We expect those bid-ready projects that are greater than 25 MW to be broken down into smaller projects for bidding purposes.
Innergex has an exclusive agreement with the Federation Quebecoise des Municipalities (FQM) that represents about 75% of Quebec’s municipalities. Under the terms of the agreement, should any municipality decide to pursue PPA negotiations of the Quebec Municipal wind RFP through FQM, Innergex has the right of first refusal to negotiate. Alternatively, municipalities may elect not to use FQM, and to negotiate PPA terms with other wind developers/bidders. We think this agreement gives Innergex an excellent advantage over its peers and potential upside to our target price.
In our view, Innergex has over 1,600 MW of bid-ready projects, but will likely bid about 350 MW over the next year.

Alternative & Renewable Energy August 2008
170
Exhibit 5.14: DCF Suggests $9.44 per Share
Gross Effective Capacity Prob. of AdjustedProject Capacity Capacity Factor DCF Success DCF Comments
(MW) (MW) (%) ($/share) (%) ($/share)
Glen Miller 8.0 8.0 59% $0.26 100% $0.26 Operating.
Umbata Falls 23.0 11.3 54% $0.69 90% $0.62 Completion expected Q4/08
Ashlu Creek 49.9 49.9 61% $3.08 75% $2.31 Completion expected late fall 2009.
Matawin 15.0 15.0 48% $0.43 25% $0.11
Kwoiek Creek 49.9 25.0 49% $1.74 25% $0.44
Mkw'Alts 47.7 47.7 37% $1.48 25% $0.37
Kaipit 9.9 9.9 36% $0.57 0% $0.00
Kokish 9.9 9.9 44% $0.63 0% $0.00
Kipawa 42.0 20.2 65% $2.31 0% $0.00
(Ledcor 18) 200.0 133.3 ~60% $11.66 0% $0.00
Carleton 109.5 41.6 36% $1.68 90% $1.51 Completion expected Q4/08
Montagne Seche 58.5 22.2 36% $0.54 50% $0.27
Gros Morne I 100.5 38.2 35% $0.95 50% $0.47
Gros Morne II 111.0 42.2 35% $1.29 50% $0.65
Roussillon 108.0 108.0 33% $3.78 0% $0.00 Recently lost PPA bid in Hydro-Quebec 2,000 MW Wind RFP.
Kamouraska 124.5 124.5 33% $4.42 0% $0.00 Recently lost PPA bid in Hydro-Quebec 2,000 MW Wind RFP.
Saint-Constant 70.0 70.0 36% $2.87 0% $0.00
Club des Hauteurs 195.5 195.5 35% $7.66 0% $0.00
Haute-Cote-Nord Est 170.0 170.0 36% $6.86 0% $0.00
Haute-Cote-Nord Ouest 168.0 168.0 37% $7.17 0% $0.00
Riviere-aux-Renards 25.0 12.5 34% $0.46 0% $0.00
Les Mechins 150.0 57.0 30% $1.64 0% $0.00
(9 Various) 1,217.5 1,217.5 ~35% $57.00 0% $0.00
Interest in IEF $2.43 100% $2.43
3,063 2,597 $9.44
Source: Scotia Capital estimates.
Valuation & Sensitivity Analyses We value Innergex Renewable Energy using a blended approach as follows: a probability-weighted discounted cash flow (DCF) analysis, and probability weighted net asset value (NAV) per share.
D I S C O U N T E D C A S H F L O W A N A L Y S I S
Our DCF analysis results in a one-year target price of $9.44 per share. For our DCF analysis, we chose a discount rate of 11%, which we believe appropriately captures the sector’s standard risks as well as Innergex’s unique ones. The discount rate reflects Innergex’s start-up operation, tolerance for construction and execution risks, as well as its targeted 75%/25% debt to equity capital structure. Innergex’s discount rate of 11% is below that of EarthFirst as Innergex has a somewhat diverse cash flow stream, as well as a broader portfolio of projects by region and by fuel source.
We give full value to Innergex’s 8 MW operating hydro facility, Glen Miller, and adjust our project-success probabilities lower based on project milestones achieved to date. Specifically, we assign 90% probabilities to Umbata Falls and Carleton, both of which are due online by the end of 2008. Also under construction is Ashlu Creek, but some setbacks have pushed our estimated commissioning date back to Q4/09, and accordingly, we reduced our project probability to 75%. Exhibit 5.14 details our DCF approach.
Our DCF analysis suggests a one-year share price of $9.44.

The Choice of a New Generation August 2008
171
Exhibit 5.15: Net Asset Value Suggests $9.55 per Share
Project Financing Unrisked NetStatus Status Capacity Value NAV NAV
($M) (diluted) (%) ($M) (diluted) (%)
Hydro Assets Green AttributesGlen Miller 1 1 42 GWh/y @ $1.00M / GWh/y $41.5 $1.12 11.7% Emission Reduction Credits $0.0 $0.00 0.0%Umbata Falls 2 4 53 GWh/y @ $0.90M / GWh/y $48.1 $1.30 13.6% $0.0 $0.00 0.0%Ashlu Creek 2 4 265 GWh/y @ $0.90M / GWh/y $238.5 $6.43 67.3% InvestmentsMatawin 4 4 63 GWh/y @ $0.25M / GWh/y $15.6 $0.42 4.4% IEF.u Ownership 4.7M @ $12.25 $57.9 $1.56 16.3%Kwoiek Creek 4 4 108 GWh/y @ $0.25M / GWh/y $26.9 $0.72 7.6% Less: capital gains tax 4.7M @ ($1.90) ($9.0) ($0.24) -2.5%Mkw'Alts 4 4 156 GWh/y @ $0.25M / GWh/y $39.0 $1.05 11.0% IEF.u Fees (net EBITDA) ~$2.0M/y @ 6.0x $12.0 $0.32 3.4%Kaipit 5 4 31 GWh/y @ $0.10M / GWh/y $3.1 $0.08 0.9% $60.9 $1.64 17.2%Kokish 5 4 38 GWh/y @ $0.10M / GWh/y $3.8 $0.10 1.1%Kipawa 5 4 115 GWh/y @ $0.10M / GWh/y $11.5 $0.31 3.3%(Ledcor 18) 5 4 701 GWh/y @ $0.10M / GWh/y $70.1 $1.89 19.8% Net Asset Value $353.50 $9.55 100%
1,571 GWh/y $498.2 $13.43 140.7%Wind Assets Est. risk-adjusted FD Shares O/S post financing 37.1
Carleton 2 1 129 GWh/y @ $0.74M / GWh/y $95.5 $2.58 27.0%Montagne Seche 4 1 69 GWh/y @ $0.21M / GWh/y $14.2 $0.38 4.0%Gros Morne I 4 4 119 GWh/y @ $0.21M / GWh/y $24.3 $0.66 6.9% $9.55 6 5 4 3 2 1Gros Morne II 4 4 131 GWh/y @ $0.21M / GWh/y $26.9 $0.73 7.6% 4 $9.45 $9.55 $9.60 $9.75 $10.00 $10.05Roussillon 5 4 313 GWh/y @ $0.08M / GWh/y $25.6 $0.69 7.2% 3 $9.45 $9.60 $9.80 $10.10 $10.60 $10.70Kamouraska 5 4 363 GWh/y @ $0.08M / GWh/y $29.8 $0.80 8.4% 2 $9.45 $9.70 $10.10 $10.70 $11.60 $11.80Saint-Constant 6 4 220 GWh/y @ $0.00M / GWh/y $0.0 $0.00 0.0% 1 $9.45 $9.80 $10.25 $11.05 $12.30 $12.60Club des Hauteurs 6 4 600 GWh/y @ $0.00M / GWh/y $0.0 $0.00 0.0%Haute-Cote-Nord Est 6 4 530 GWh/y @ $0.00M / GWh/y $0.0 $0.00 0.0%Haute-Cote-Nord Ouest 6 4 540 GWh/y @ $0.00M / GWh/y $0.0 $0.00 0.0%Riviere-aux-Renards 6 4 37 GWh/y @ $0.00M / GWh/y $0.0 $0.00 0.0% $9.55 6 5 4 3 2 1Les Mechins 5 4 150 GWh/y @ $0.08M / GWh/y $12.3 $0.33 3.5% 4 $9.30 $9.40 $9.55 $9.75 $10.05 $10.10(9 Various) 6 4 3,733 GWh/y @ $0.00M / GWh/y $0.0 $0.00 0.0% 3 $9.30 $9.50 $9.75 $10.20 $10.85 $11.05
6,934 GWh/y $228.7 $6.17 64.6% 2 $9.30 $9.65 $10.15 $10.95 $12.20 $12.501 $9.30 $9.75 $10.40 $11.45 $13.20 $13.60
Working CapitalEst. Current Assets (uncommitted) n.m. $0.00 0.0%Est. Current Liabilities (uncommitted) n.m. $0.00 0.0%
$0.00 0.0% $9.55 6 5 4 3 2 1Liabilities 4 $9.40 $9.45 $9.55 $9.65 $9.90 $9.95
Est. risk-adjusted LTD post future debt financing ($434.2) ($11.71) -122.6% 3 $9.40 $9.50 $9.70 $10.00 $10.45 $10.55($434.2) ($11.71) -122.6% 2 $9.40 $9.60 $9.95 $10.55 $11.40 $11.60
1 $9.40 $9.70 $10.10 $10.85 $12.05 $12.351. We assume a stable capital structure of 75% debt & 25% equity. Equity issuance is assumed to be our DCF price of $9.44017089673835/share.2. Project Probability Status: 1. Operating - 100%; 2. Construction - 90%; 3. Permitting & PPA - 50%; 4. Permitting or PPA - 25%; 5. Some Development - 10%; 6. Pipeline - 0%.3. Financing Status: (1) Full f inancing in place; (2) Debt draw n, equity required; (3) Equity in place, debt draw required; (4) Equity & debt draw required.
NAVPS NAVPS
Project Status
Project Status
Project Status
Kipawa
Kwoiek Creek
Mkw'Alts
Fina
ncin
gSt
atus
Fina
ncin
gSt
atus
Fina
ncin
gSt
atus
Source: Scotia Capital estimates.
N E T A S S E T V A L U E C A L C U L A T I O N
We calculate a risk-adjusted NAV of $9.55/share. Given recent transactions and using rule-of-thumb metrics for wind and hydro power facilities, we give credit of $0.82 million to $1 million per GWh/y for capacity that is either operational or under construction with no construction risk, such as Plutonic’s Toba/Montrose project. We probability-adjust this value lower for those projects that are less developed. Our NAV per share is broken down by project in Exhibit 5.15. We have also sensitized various projects for potential future upside value.
T A R G E T P R I C E , R A T I N G , A N D R I S K R A N K I N G
We have initiated coverage of Innergex Renewable Energy with a 3-Sector Underperform rating. Our one-year share price target is $9.50.
Our risk ranking for Innergex Renewable Energy is Caution Warranted, similar to EarthFirst and Plutonic Power. Despite its diverse revenue stream (like Boralex), almost all of the company has not been built yet, and a significant portion of our one-year target is based on the expectation that future projects are commissioned on time and on budget. Additionally, the early stage of the company’s life coupled with the speculative nature of its future projects being successful, as well as stock illiquidity, supports our view of a Caution Warranted risk ranking.
Our risk-adjusted NAV suggests $9.55/share.

Alternative & Renewable Energy August 2008
172
Exhibit 5.16: 2011E Generation by Province
Quebec29%
Ontario13%
British Columbia
58%
Source: Scotia Capital estimates.
Exhibit 5.18: Forecast Revenue Through 2015
$3 $19 $41 $55 $79 $97 $161 $163
$71$78
$73 $74 $77 $79$85 $86
2008E 2009E 2010E 2011E 2012E 2013E 2014E 2015E
Operating Revenue ($M) $/MWh
Source: Scotia Capital estimates.
Exhibit 5.17: 2011E Generation by Technology
Hydro79%
Wind21%
Source: Scotia Capital estimates.
Financial Forecast We assume in our financial forecast that total power generation ramps up from our estimated 41.5 GWh of production in 2008 to 237.3 GWh in 2009 and to 569.8 GWh in 2010. Our quarterly electricity production estimates through 2010 only include those projects that already have PPAs and are expected to be commissioned before 2011. Specifically, we include Glen Miller (operating), Umbata Falls (Q4/08), Carleton (Q4/08), Ashlu Creek (Q4/09), Matawin (2H/09), and Mkw’Alts (2H/10).
On a plant-by-plant, basis we have seasonally adjusted quarterly production to match mean quarterly profiles. As we progress through a given quarter, we may adjust our production forecast up or down depending on material changes to various weather and climate-related factors such as stronger-than-expected wind conditions or below-mean hydrology. Please refer to earlier Exhibits 5.4 and 5.5 for quarterly production forecasts by business segment through 2012.
Exhibits 5.16 and 5.17 show our estimated 2011 electricity generation mix by province and by fuel source, respectively.
2 0 1 1 E T O T A L R E V E N U E U P 8 . 5 X O V E R 2 0 0 8 E
Almost all of our forecast revenue growth for Innergex is driven by annual increases in installed capacity, with a minor amount attributable to growth in fund-related earnings. In 2009, our forecast revenue per MWh rises to $78/MWh from our estimated $71/MWh in 2008, but then drops to $73/MWh the following year. The decrease in revenue per MWh in 2010 is attributable to the commissioning of Ashlu Creek and Matawin, both expected to earn less than $60/MWh in their first full year of operations. By 2011, we forecast total revenue of $60.8 million, or about 8.5x our 2008 estimate of $7 million. Exhibit 5.18 shows our forecast energy-based revenue growth through 2015, on both an absolute basis as well as on a per MWh basis.
We are looking for 237 GWh of production in 2009, rising to 570 GWh the following year.
We think 2011 revenue could grow 8.5x over 2008.

The Choice of a New Generation August 2008
173
Exhibit 5.20: Forward EBITDA and EPS Profile
($0.25)
($0.15)
($0.05)
$0.05
$0.15
$0.25
$0.35
Q1-08 Q1-09E Q1-10E Q1-11E Q1-12E Q1-13E Q1-14E Q1-15E
Ear
ning
s pe
r Sh
are
($15,000)
($10,000)
($5,000)
$0
$5,000
$10,000
$15,000
$20,000
EBIT
DA (0
00s)
Quarterly EBITDA
Quarterly EPS
Source: Scotia Capital estimates.
Exhibit 5.19: Forecast EBITDA Through 2015
$14 $34 $46 $65 $66 $73 $74
$60 $60 $62 $65 $66 $68 $69
2008E 2009E 2010E 2011E 2012E 2013E 2014E 2015E
Total EBITDA ($M) $/MWh
n.m.
Source: Scotia Capital estimates.
2 0 1 1 E E B I T D A P E G G E D A T $ 4 6 . 1 M I L L I O N
As new capacity ramps up over the next several years, we expect operating margins and EBITDA to be somewhat choppy. By 2011, we anticipate EBITDA of $46.1 million, up from our 2010 EBITDA estimate of $33.9 million, and our $14.3 million 2009 forecast. To arrive at our 2011 estimate, we think that operating expenses will come in at $8.7 million, and will typically range between 15% and 20% of revenue. For now, we have assumed flat SG&A of $6 million per year, or in line with where Innergex is currently tracking.
P O S I T I V E E P S I N 2 0 0 9
We estimate that Innergex’s 2008 loss per share will settle at 19¢ and will improve to positive 3¢ in 2009E, followed by EPS of 32¢ in 2010E.
C O N S T A N T C D P U F O R I N N E R G E X P O W E R I N C O M E F U N D T H R O U G H 2 0 1 1
We believe that Innergex will maintain its 16.1% interest in IEF, for now. We have also held the Fund’s CDPU constant at $1/unit per year through 2011.
Innergex should have positive and sustainable EPS by Q2/09.

Alternative & Renewable Energy August 2008
174
O T H E R K E Y A S S U M P T I O N S A N D R A T I O N A L E
New capacity. With the addition of new capacity, we do not speculate what specific day in a quarter the new facility will come online. Accordingly, and similar to the half-year CCA rule, we apply a 50% weight to generation produced from new capacity in its initial quarter.
Capital costs. For the most part, Innergex has disclosed its project cost estimates for those facilities that have PPAs. For hydro, costs range from $1.64 million to $3.05 million per MW. We use $2.65 million per MW (2008) for those hydro projects with no capital cost disclosure. For wind, costs range from $1.65 million to $1.75 million per MW. We conservatively use $2.25 million per MW to $2.75 million per MW for those wind projects with no capital cost disclosure.
Project financing. Our financial forecast assumes that growth opportunities will be financed using Innergex’s targeted capital structure of 75% debt and 25% equity. Additionally, we have assumed that its current projects with signed PPAs will not require the issuance of new equity to commission the facilities.
Taxes. We forecast that Innergex’s operations will not pay material cash taxes for several years. Also, distribution proceeds and management fees from the Fund are somewhat offset by head office expenses that result in minimal taxable income.
Free cash flow. We have not applied excess free cash flow on the balance sheet, for now, other than to finance those projects that we believe will be commissioned within our financial forecast. Cash on hand could be used to: (1) prepay outstanding principal balances on its debt; (2) implement (i) a regular dividend, (ii) a share buyback, and/or (iii) a one-time special dividend; (3) invest in other organic growth opportunities; and (4) enter into an acquisition, joint venture, or similar transaction. We estimate that if no new projects are financed (highly unlikely), Innergex’s cash on hand could exceed $2.50 per share by the end of 2010.
Seasonality profile. For many of Innergex’s future hydro and wind projects that do not have monthly or quarterly generation forecasts disclosed, we have used the following seasonality profiles as the basis for our future capacity production estimates.
• Our hydro production profile assumes the following seasonality: Q1 20%; Q2 31%; Q3 26%; and Q4 23%.
• Our wind production profile is as follows: Q1 30%; Q2 22%; Q3 18%; and Q4 30%.
• Exhibits 5.21 through 5.23 display our forecast financial statements for Innergex.
We don’t see Innergex paying material cash taxes for several years.

175
The Choice of a N
ew G
eneration A
ugust 2008
Exhibit 5.21: Innergex Renewable Energy Inc. – Income Statement
($000s) Q108 Q208 Q308E Q408E 2008E Q109E Q209E Q309E Q409E 2009E 2010E 2011E 2012E 2013E 2014E 2015E
Operating $712 $883 $720 $637 $2,952 $2,639 $4,649 $3,849 $7,422 $18,559 $41,370 $55,455 $77,715 $79,135 $86,064 $86,748Management Fees $594 $547 $516 $516 $2,174 $525 $525 $525 $525 $2,101 $2,137 $2,174 $2,211 $2,249 $2,288 $2,328Share of Fund Earnings ($335) $994 $624 $637 $1,920 $649 $662 $676 $689 $2,677 $2,897 $3,136 $3,395 $3,675 $3,978 $4,305Total Revenue $971 $2,424 $1,860 $1,790 $7,045 $3,814 $5,836 $5,050 $8,636 $23,337 $46,404 $60,765 $83,321 $85,059 $92,330 $93,381
Operating Expenses $277 ($15) $126 $111 $499 $444 $772 $639 $1,194 $3,050 $6,485 $8,674 $12,333 $12,568 $13,673 $13,793General & Administrative $1,499 $1,755 $1,500 $1,500 $6,255 $1,500 $1,500 $1,500 $1,500 $6,000 $6,000 $6,000 $6,000 $6,000 $6,000 $6,000
$1,776 $1,740 $1,626 $1,611 $6,754 $1,944 $2,272 $2,139 $2,694 $9,050 $12,485 $14,674 $18,333 $18,568 $19,673 $19,793
EBITDA ($806) $684 $234 $178 $291 $1,870 $3,564 $2,911 $5,942 $14,287 $33,919 $46,091 $64,988 $66,491 $72,657 $73,589
Depreciation & Amortization $373 $368 $377 $378 $1,496 $1,251 $1,252 $1,253 $2,233 $5,990 $9,488 $12,636 $17,140 $17,433 $18,281 $18,297Interest $255 $209 $295 $367 $1,127 $1,368 $1,421 $1,421 $2,889 $7,100 $11,186 $14,948 $19,310 $18,172 $17,650 $15,530(Gain)/Loss on Sale/Writedown of Assets/Prospects $50 $1,554 $0 $0 $1,603 $0 $0 $0 $0 $0 $0 $0 $0 $0 $0 $0(Gain)/Loss on Derivatives $6,072 ($3,436) $0 $0 $2,636 $0 $0 $0 $0 $0 $0 $0 $0 $0 $0 $0Misc. ($281) ($190) $0 $0 ($471) $0 $0 $0 $0 $0 $0 $0 $0 $0 $0 $0Other $5,841 ($2,073) $0 $0 $3,768 $0 $0 $0 $0 $0 $0 $0 $0 $0 $0 $0EBT ($7,275) $2,180 ($437) ($567) ($6,099) ($750) $891 $237 $820 $1,197 $13,246 $18,506 $28,538 $30,886 $36,727 $39,762
Current tax $1 $1 $0 $0 $2 $0 $0 $0 $0 $0 $0 $0 $0 $0 $0 $0Future tax ($1,802) $605 ($153) ($198) ($1,548) ($262) $312 $83 $287 $419 $4,636 $6,477 $9,988 $10,810 $12,854 $13,917Net income ($5,474) $1,573 ($284) ($369) ($4,554) ($487) $579 $154 $533 $778 $8,610 $12,029 $18,550 $20,076 $23,872 $25,845
Basic shares - opening 23,500.0 23,500.0 23,500.0 23,500.0 23,500.0 23,500.0 23,500.0 23,500.0 23,500.0 23,500.0 23,500.0 26,833.3 26,833.3 26,833.3 26,833.3 26,833.3Plus: Equity issued/warrant conversion 0.0 0.0 0.0 0.0 0.0 0.0 0.0 0.0 0.0 0.0 3,333.3 0.0 0.0 0.0 0.0 0.0Less: Share buyback 0.0 0.0 0.0 0.0 0.0 0.0 0.0 0.0 0.0 0.0 0.0 0.0 0.0 0.0 0.0 0.0Basic shares - closing 23,500.0 23,500.0 23,500.0 23,500.0 23,500.0 23,500.0 23,500.0 23,500.0 23,500.0 23,500.0 26,833.3 26,833.3 26,833.3 26,833.3 26,833.3 26,833.3Average Shares O/S - Basic (000s) 23,500.0 23,500.0 23,500.0 23,500.0 23,500.0 23,500.0 23,500.0 23,500.0 23,500.0 23,500.0 25,166.7 26,833.3 26,833.3 26,833.3 26,833.3 26,833.3Average Dilution (000s) 44.4 1,410.0 1,410.0 1,410.0 1,068.6 1,410.0 1,410.0 1,410.0 1,410.0 1,410.0 1,410.0 1,410.0 1,410.0 1,410.0 1,410.0 1,410.0Average Shares O/S - Diluted (000s) 23,544.4 24,910.0 24,910.0 24,910.0 24,568.6 24,910.0 24,910.0 24,910.0 24,910.0 24,910.0 26,576.7 28,243.3 28,243.3 28,243.3 28,243.3 28,243.3
EPS (Basic) ($0.23) $0.07 ($0.01) ($0.02) ($0.19) ($0.02) $0.02 $0.01 $0.02 $0.03 $0.34 $0.45 $0.69 $0.75 $0.89 $0.96EPS (Diluted) ($0.23) $0.06 ($0.01) ($0.02) ($0.19) ($0.02) $0.02 $0.01 $0.02 $0.03 $0.32 $0.43 $0.66 $0.71 $0.85 $0.92
Source: Company reports; Scotia Capital estimates.

Alternative &
Renew
able Energy A
ugust 2008
176 Exhibit 5.22: Innergex Renewable Energy Inc. – Balance Sheet
($000s) Q108 Q208 Q308E Q408E 2008E Q109E Q209E Q309E Q409E 2009E 2010E 2011E 2012E 2013E 2014E 2015E
AssetsCurrent Assets
Cash & Cash Equivalents $23,626 $20,528 $13,264 $5,277 $5,277 $0 $0 $0 $0 $0 $38,516 $40,811 $79,298 $119,038 $170,707 $225,950A/R $19,027 $6,927 $6,927 $6,927 $6,927 $6,927 $6,927 $6,927 $6,927 $6,927 $6,927 $6,927 $6,927 $6,927 $6,927 $6,927Prepaid & Other $361 $474 $474 $474 $474 $474 $474 $474 $474 $474 $474 $474 $474 $474 $474 $474
$43,014 $27,930 $20,666 $12,678 $12,678 $7,402 $7,402 $7,402 $7,402 $7,402 $45,917 $48,213 $86,700 $126,440 $178,109 $233,352
Investment (Fund) $61,629 $61,442 $60,885 $60,340 $60,340 $60,045 $59,763 $59,493 $59,238 $59,238 $59,300 $60,547 $62,052 $63,837 $65,925 $68,341PP&E $120,264 $136,316 $166,922 $199,856 $199,856 $223,224 $247,280 $260,646 $273,032 $273,032 $366,782 $464,308 $469,671 $479,176 $465,658 $448,721Intangibles $40,746 $40,688 $40,348 $40,008 $40,008 $39,668 $39,328 $38,988 $38,648 $38,648 $37,288 $35,928 $34,568 $33,208 $31,848 $30,488Project Development Costs $38,368 $38,315 $38,315 $38,315 $38,315 $38,315 $38,315 $38,315 $38,315 $38,315 $38,315 $38,315 $38,315 $38,315 $38,315 $38,315Future Income Taxes $4,801 $4,295 $4,448 $4,647 $4,647 $4,909 $4,909 $4,909 $4,909 $4,909 $4,909 $4,909 $4,909 $4,909 $4,909 $4,909Goodwill $30,553 $31,874 $31,874 $31,874 $31,874 $31,874 $31,874 $31,874 $31,874 $31,874 $31,874 $31,874 $31,874 $31,874 $31,874 $31,874Other $2,308 $2,581 $2,181 $1,781 $1,781 $1,381 $981 $581 $181 $181 ($1,419) ($3,019) ($4,619) ($6,219) ($7,819) ($9,419)Total Assets $341,683 $343,442 $365,639 $389,500 $389,500 $406,818 $429,852 $442,209 $453,599 $453,599 $582,967 $681,076 $723,471 $771,541 $808,819 $846,581
LiabilitiesCurrent Liabilities
Revolver $0 $0 $0 $0 $0 $96 $4,013 $5,924 $6,286 $6,286 $0 $0 $0 $0 $0 $0A/P and Accrued Liabilities $8,028 $6,965 $6,965 $6,965 $6,965 $6,965 $6,965 $6,965 $6,965 $6,965 $6,965 $6,965 $6,965 $6,965 $6,965 $6,965CP LTD $0 $0 $2,000 $2,000 $2,000 $2,000 $2,000 $2,000 $2,000 $2,000 $2,000 $2,000 $2,000 $2,000 $2,000 $0Derivatives $8,438 $7,643 $7,643 $7,643 $7,643 $7,643 $7,643 $7,643 $7,643 $7,643 $7,643 $7,643 $7,643 $7,643 $7,643 $7,643
$16,466 $14,608 $16,608 $16,608 $16,608 $16,704 $20,621 $22,532 $22,894 $22,894 $16,608 $16,608 $16,608 $16,608 $16,608 $14,608
Construction Holdbacks $2,420 $3,046 $3,046 $3,046 $3,046 $3,046 $3,046 $3,046 $3,046 $3,046 $3,046 $3,046 $3,046 $3,046 $3,046 $3,046Derivatives $2,616 $0 $0 $0 $0 $0 $0 $0 $0 $0 $0 $0 $0 $0 $0 $0Long-Term Debt $87,125 $89,526 $110,008 $134,237 $134,237 $151,946 $170,173 $180,382 $190,592 $190,592 $264,999 $344,602 $358,459 $375,643 $376,194 $376,194Future Income Taxes $7,601 $8,180 $8,180 $8,180 $8,180 $8,180 $8,491 $8,574 $8,861 $8,861 $13,497 $19,974 $29,963 $40,773 $53,627 $67,544Minority Interest $5 $5 $5 $5 $5 $5 $5 $5 $5 $5 $5 $5 $5 $5 $5 $5
$116,234 $115,364 $137,846 $162,075 $162,075 $179,881 $202,337 $214,539 $225,397 $225,397 $298,155 $384,235 $408,080 $436,074 $449,480 $461,397Shareholders' EquityShare capital $228,808 $229,472 $229,472 $229,472 $229,472 $229,472 $229,472 $229,472 $229,472 $229,472 $277,472 $277,472 $277,472 $277,472 $277,472 $277,472Contributed surplus $521 $912 $912 $912 $912 $912 $912 $912 $912 $912 $912 $912 $912 $912 $912 $912Retained earnings ($3,881) ($2,307) ($2,592) ($2,960) ($2,960) ($3,448) ($2,869) ($2,715) ($2,182) ($2,182) $6,427 $18,457 $37,006 $57,082 $80,954 $106,800Total Shareholders Equity $225,448 $228,077 $227,793 $227,424 $227,424 $226,937 $227,516 $227,669 $228,202 $228,202 $284,812 $296,841 $315,391 $335,467 $359,339 $385,184
Total Liabilities and Shareholders Equity $341,683 $343,442 $365,639 $389,500 $389,500 $406,818 $429,852 $442,209 $453,599 $453,599 $582,967 $681,076 $723,471 $771,541 $808,819 $846,581
Source: Company reports; Scotia Capital estimates.

177
The Choice of a N
ew G
eneration A
ugust 2008
Exhibit 5.23: Innergex Renewable Energy Inc. – Cash Flow Statement
($000s) Q108 Q208 Q308E Q408E 2008E Q109E Q209E Q309E Q409E 2009E 2010E 2011E 2012E 2013E 2014E 2015E
Operating ActivitiesNet (loss) earnings ($5,474) $1,573 ($284) ($369) ($4,554) ($487) $579 $154 $533 $778 $8,610 $12,029 $18,550 $20,076 $23,872 $25,845Adjustments for:
Depreciation & Amortization $373 $368 $377 $378 $1,496 $1,251 $1,252 $1,253 $2,233 $5,990 $9,488 $12,636 $17,140 $17,433 $18,281 $18,297Share of Fund Earnings $335 ($994) ($624) ($637) ($1,920) ($649) ($662) ($676) ($689) ($2,677) ($2,897) ($3,136) ($3,395) ($3,675) ($3,978) ($4,305)Stock-based Compensation $391 $391 $400 $400 $1,582 $400 $400 $400 $400 $1,600 $1,600 $1,600 $1,600 $1,600 $1,600 $1,600Gain/(Loss) on Sale of Assets/Prospects $49 $1,554 $0 $0 $1,603 $0 $0 $0 $0 $0 $0 $0 $0 $0 $0 $0Unrealized (Gain)/Loss on Derivatives $6,072 ($3,436) $0 $0 $2,636 $0 $0 $0 $0 $0 $0 $0 $0 $0 $0 $0Future Income Taxes ($1,802) $605 ($153) ($198) ($1,548) ($262) $312 $83 $287 $419 $4,636 $6,477 $9,988 $10,810 $12,854 $13,917
Cash flow from operations ($55) $61 ($285) ($426) ($704) $252 $1,880 $1,214 $2,763 $6,110 $21,436 $29,606 $43,883 $46,245 $52,630 $55,353Net change in non-cash working capital balances ($5,491) $12,164 $0 $0 $6,672 $0 $0 $0 $0 $0 $0 $0 $0 $0 $0 $0
($5,547) $12,225 ($285) ($426) $5,968 $252 $1,880 $1,214 $2,763 $6,110 $21,436 $29,606 $43,883 $46,245 $52,630 $55,353
Financing ActivitiesNet issue (buyback) of common shares $0 $0 $0 $0 $0 $0 $0 $0 $0 $0 $48,000 $0 $0 $0 $0 $0Long-term debt advances $5,990 $2,401 $22,982 $24,729 $56,102 $18,209 $18,727 $10,709 $10,709 $58,355 $76,408 $81,602 $15,857 $19,184 $2,552 $0Long-term debt repayments ($2,000) $0 ($500) ($500) ($3,000) ($500) ($500) ($500) ($500) ($2,000) ($2,000) ($2,000) ($2,000) ($2,000) ($2,000) ($2,000)Dividends $0 $0 $0 $0 $0 $0 $0 $0 $0 $0 $0 $0 $0 $0 $0 $0Other $431 $625 $0 $0 $1,056 $0 $0 $0 $0 $0 $0 $0 $0 $0 $0 $0
$4,421 $3,026 $22,482 $24,229 $54,158 $17,709 $18,227 $10,209 $10,209 $56,355 $122,408 $79,602 $13,857 $17,184 $552 ($2,000)
Investing ActivitiesCapital asset additions, bus or prospect acquisitions ($9,680) ($17,944) ($30,642) ($32,972) ($91,239) ($24,279) ($24,969) ($14,279) ($14,279) ($77,806) ($101,877) ($108,803) ($21,143) ($25,578) ($3,402) $0Proceeds on sale of capital assets &/or prospects $0 $0 $0 $0 $0 $0 $0 $0 $0 $0 $0 $0 $0 $0 $0 $0New project development costs ($1,439) ($1,586) $0 $0 ($3,025) $0 $0 $0 $0 $0 $0 $0 $0 $0 $0 $0Distributions from Fund $1,181 $1,181 $1,181 $1,181 $4,723 $945 $945 $945 $945 $3,780 $2,835 $1,890 $1,890 $1,890 $1,890 $1,890Other $0 $0 $0 $0 $0 $0 $0 $0 $0 $0 $0 $0 $0 $0 $0 $0
($9,939) ($18,349) ($29,461) ($31,791) ($89,540) ($23,334) ($24,024) ($13,334) ($13,334) ($74,027) ($99,042) ($106,913) ($19,253) ($23,689) ($1,513) $1,890
Net change in cash and cash equivalents ($11,064) ($3,098) ($7,264) ($7,988) ($29,414) ($5,373) ($3,917) ($1,911) ($362) ($11,562) $44,801 $2,295 $38,487 $39,740 $51,669 $55,243
Cash and cash equivalents - beginning of period $34,691 $23,626 $20,528 $13,264 $34,691 $5,277 ($96) ($4,013) ($5,924) $5,277 ($6,286) $38,516 $40,811 $79,298 $119,038 $170,707Cash and cash equivalents - end of period $23,626 $20,528 $13,264 $5,277 $5,277 ($96) ($4,013) ($5,924) ($6,286) ($6,286) $38,516 $40,811 $79,298 $119,038 $170,707 $225,950
Source: Company reports; Scotia Capital estimates.

178
Exhibit 5.24: Management & Directors
Gilles LefrancoisChairman of the Board of Directors
864,769
From 2003 to 2007, Mr. Lefrancois was President and CEO of Innergex, at which time he was appointed Chairman. He founded Innergex in 1990 and is a founding member of Association quebecoise de la production d'energie renouvelable . Mr. Lefrancois, a Chartered Accountant, previously worked at Innocan Inc. as well as a publicly traded transportation company.
Michel LetellierPresident, CEO, and Director
283,617 A director of the company since 2003, Mr. Letellier was appointed President & CEO in 2007. Prior to his appointment, he had been CFO since 1997. From 1990 to 1997, Mr. Letellier was employed by Boralex.
Raymond Laurin Director 600 Over the past 27 years, Mr. Laurin has held various positions at Desjardins and is currently Executive Director of the Regime de rentes du Mouvement Desjardins . He was appointed director of Innergex in 2007.
Pierre Brodeur Director 2,000 Mr. Brodeur brings 25 years of experience to Innergex's board, having previously served as President of Sico Inc., Boulangeries Weston, Quebec Ltd., and Videotron International. He is a director of Industrial Alliance as well as Van Houtte. Mr. Brodeur became a director of Innergex in 2007.
Susan M. Smith Director 1,000
Since 1997, Ms. Smith has acted as President and CEO of RBC Technology Ventures Inc., a subsidary of Royal Bank of Canada. She is also a director on numerous technology fund boards and has served on the Prime Minister's Advisory Council on Science and Technology. She became a director of the corporation in 2007.
Jean Perron VP & CFO 195,633 As a Chartered Accountant, Mr. Perron spent 13 years with KPMG before joining Innergex in 2003. He was appointed VP & CFO in 2007.
Jean Trudel VP Finance & IR 194,000 Mr. Trudel has been VP Finance & Investor Relations since 2003. Previously, Mr. Trudel worked for Sun Life as a director in its Investment Project Finance group. From 1996 to 1999, he was employed by the Bank of Nova Scotia's Corporate Banking group.
Michele Beauchamp VP Legal 193,288 Ms. Beauchamp has held a role as VP Legal Affairs and Corporate Secretary since mid-2004. Prior to that, she was legal counsel to Cascades, and was a law partner at Desjardins Ducharme.
Francois Hebert VP Operations 288,176 Mr. Hebert has been VP Operations since 2003 and acted in a similar capacity for Innergex GP since 1999. Previously, he spent 12 years with Alstom Inc.
Normand Bouchard VP Wind Energy 171,622 Since 2001, Mr. Bouchard has ben VP Wind Energy at Innergex. He previously spent 10 years at Kruger as a project engineer, and prior to that, 10 years with a cogeneration developer as a designer of power plants.
Guy Dufort VP Public Affairs 172,622 Mr. Dufort has been VP Public Affairs since 2003, and was a consultant to Innergex GP from 1994 to 2003. He previously spent 10 years in a similar role at Alcan.
Renaud de Batz VP Hydro - East 162,010 Prior to joining Innergex in 2002, Mr. de Batz spent 12 years with RSW, an energy-related engineering firm.
Peter Grover VP Project Management 163,460 Since 2004, Mr. Grover has been responsible for development projects with PPAs and for prospective projects. He previously worked at Alstrom as well as spent 20 years in project management for various companies.
Richard Blanchet VP Hydro - West 288,176 Mr. Blanchet has appointed to his position in 2004, and was previously with Innergex GP. Prior to 2001, Mr. Blanchet spent 13 years with RSW.
Total 2,980,973
Diluted Shares Outstanding (Q2/08) 23,500,000
% Insider Ownership 12.7%
FD Shares Controlled Directly or Indirectly BackgroundPositionName
Source: SEDI, Company reports; Scotia Capital.
Management & Directors In our opinion, Innergex’s management team and board of directors appear exceptionally experienced, with several members having crossed paths with Boralex and Canadian Hydro Developers. As Executive Chairman, Mr. Lefrancois, the founder of Innergex, still plays an active role in the vision and strategy of the company, while Mr. Letellier, a former Boralex employee and former CFO of Innergex, took over as Innergex’s President and CEO at the end of 2007. The company’s management and directors directly and indirectly control approximately 12.7% of INE’s shares on a fully diluted basis (Exhibit 5.24).
Alternative & Renewable Energy August 2008

179
Exhibit 1.1: Innergex Renewable Energy Corporate Structure
Source: Company reports.
Innergex’s Corporate Stucture
The Choice of a New Generation August 2008

180
T H I S P A G E L E F T I N T E N T I O N A L L Y B L A N K .
Alternative & Renewable Energy August 2008

The Choice of a New Generation August 2008
181
Plutonic Power Corporation (PCC-T)
Aug 15, 2008: $7.04 1-Yr Target: $9.00 Capitalization Rating: 2-Sector Perform 1-Yr ROR: 27.8% Shares O/S (M) 42.2 Risk: Caution Warranted 2-Yr Target: $10.00 Total Value ($M) 297.3 IBES EPS 2008E $-0.24 2-Yr ROR: 42.0% Float O/S (M) 35.5 IBES EPS 2009E n.a. Float Value ($M) 250.1 Div. (Curr.): $0.00 TSX Weight -- Yield: 0.0%
Valuation: 75% DCF @ 10.5%; 25% NAV
Qtly EPS (FD) (Next Release: Nov-08)
Y/E DECEMBER-31 Mar Jun Sep Dec Year P/E 2008E $-0.07A $-0.09A $-0.08 $-0.08 $-0.32 n.a. 2009E $-0.06 $-0.06 $-0.06 $-0.06 $-0.24 n.a. 2010E $-0.05 $-0.04 $-0.04 $-0.07 $-0.21 n.a. 2011E $-0.08 $0.02 $0.08 $-0.05 $-0.02 n.a. Industry Specific 2007A 2008 2009 2010 2011 Production (GWh) 0 0 0 18 298
Note: Historical price multiple calculations use FYE price. Source: Reuters; company reports; Scotia Capital estimates.
One Goal: Winning Its Next BC Hydro Bids I N V E S T M E N T H I G H L I G H T S
• Strong growth plan. Plutonic’s $660 million (196 MW) first pair of B.C. run-of-river projects is now under construction, which we believe is worth about $3 per share. The company has 38 additional projects for about 1,700 MW ($6+ billion) under development, which we estimate is worth an additional $6 per share on a risk-adjusted basis. • High government risk. Plutonic is currently 100% dependent on the B.C. government choosing its renewable projects over others. A possible 2009 government change could risk future growth prospects for British Columbia’s independent power producers. • Focused on the Call: We assume 1,047 MW of Plutonic projects get submitted into the current BC Hydro Clean Power Call. We estimate the market has placed a 25% probability of success on its bids being awarded long-term power purchase contracts. • Neutral on the name, for now. If no more of Plutonic’s projects are chosen, its stock price could drop to $3 per share. If the company wins all 1,047 MW in the BC Hydro Clean Power Call, the stock could be worth about $15.
• We have transferred coverage of the common shares of Plutonic Power, maintaining a 2-Sector Perform rating and our one-year target price of $9.00 per share. Our valuation is based on a 75%-weighted discounted cash flow approach, using a 10.5% discount rate, and a 25%-weighted net asset value calculation.

Alternative & Renewable Energy August 2008
182
Exhibit 6.1: Plutonic Power – Relative Valuation Metrics
Last SC 1-Year 1-Year MarketCompany Ticker Price Rating Target ROR DCF NAV Cap 2008E 2009E 2010E
8/15/2008 ($M) (x) (x) (x)
Boralex BLX $14.80 1-SO $18.00 22% $18.33 $17.03 $560 9.9x 8.6x 7.6xCanadian Hydro Developers KHD $4.38 1-SO $7.00 60% $7.04 $6.95 $628 20.3x 9.9x 7.6xEarthfirst Canada EF $0.27 3-SU $0.40 48% $0.35 $0.60 $28 n.m. -5.5x -0.9xInnergex Renew able Energy INE $8.25 3-SU $9.50 15% $9.44 $9.55 $194 n.m. 18.4x 7.8xPlutonic Power PCC $7.04 2-SP $9.00 28% $9.03 $8.75 $297 n.m. n.m. n.m.Average 35% $341 15.1x 7.8x 5.5x
Company Ticker Beta 2008E 2009E 2010E 2008E 2009E 2010E 2008E 2009E 2010E(x) (x) (x) (x) (x) (x) (x) (x) (x)
Boralex BLX 0.7 28.8x 20.2x 18.6x 2.6x 2.5x 2.3x 10.4x 8.7x 7.7xCanadian Hydro Developers KHD 0.5 54.6x 23.4x 17.3x 7.2x 3.9x 3.1x 16.0x 9.0x 6.6xEarthfirst Canada EF - n.m. n.m. n.m. n.m. 5.5x 0.9x n.m. n.m. 5.6xInnergex Renew able Energy INE - n.m. n.m. 25.5x 27.5x 8.3x 4.2x n.m. 33.6x 10.2xPlutonic Power PCC 0.9 n.m. n.m. n.m. n.m. n.m. n.m. n.m. n.m. n.m.Average 0.7 41.7x 21.8x 20.5x 12.4x 5.1x 2.6x 13.2x 17.1x 7.5x
Price to Earnings Price to Sales Price to Cash Flow
Enterprise Value to EBITDA
Source: Bloomberg; Scotia Capital estimates.
Summary & Investment Recommendation Plutonic Power Corporation (Plutonic) is one of Canada’s fastest-growing suppliers of green run-of-river hydro power. Its first two projects are now under construction (196 MW) in southwest British Columbia, near Powell River. A further 38 potential run-of-river projects are at various stages of development and could add about 1,700 MW of capacity. The key to Plutonic’s future success is the receipt of long-term electricity purchase agreements (EPAs) to be awarded in BC Hydro’s Clean Power Call. We estimate Plutonic will submit 1,047 MW into the Call.
In our minds, while Plutonic is well positioned within the B.C. power industry to secure future BC Hydro Clean Power Call bids, we remain cautious as to whether BC Hydro will award 60% of its Clean Power Call to one project (i.e., ~3,000 GWh/y out of 5,000 GWh/y)
In addition to giving full credit of $3/share for Plutonic’s 196 MW Toba/Montrose project under construction, our DCF valuation gives a 35% probability of success to both its 133 MW Upper Toba and its 914 MW Bute Inlet projects. We have also assumed that Plutonic’s financial arrangement with GE to provide 100% of the total equity requirements for a 41.3% (net to Plutonic) economic interest in the combined projects does not change.
We see no value for Plutonic’s green attributes. Plutonic relinquished control of its initial CO2e Emission Reduction Credits (ERCs) to BC Hydro in a $3/MWh bid credit for its East Toba and Montrose Creek projects. In the current BC Hydro Clean Power Call, project bidders are required to surrender their green attributes.
We have transferred coverage of the common shares of Plutonic Power, maintaining a 2-Sector Perform rating and our one-year target price of $9.00 per share. Our valuation is based on a 75%-weighted discounted cash flow approach, using a 10.5% discount rate, and a 25%-weighted net asset value calculation.
F I N A N C I A L F O R E C A S T
We do not expect Plutonic to become EPS-positive until at least 2011. However, we do expect its flagship 196 MW East Toba and Montrose Creek sites to be fully commissioned by the end of 2010. In 2011, we estimate revenue of $30.2 million, followed by $32.9 million in 2012. Our 2008E and 2009E EPS forecast is for a loss of 32¢ and 24¢ per share, respectively.
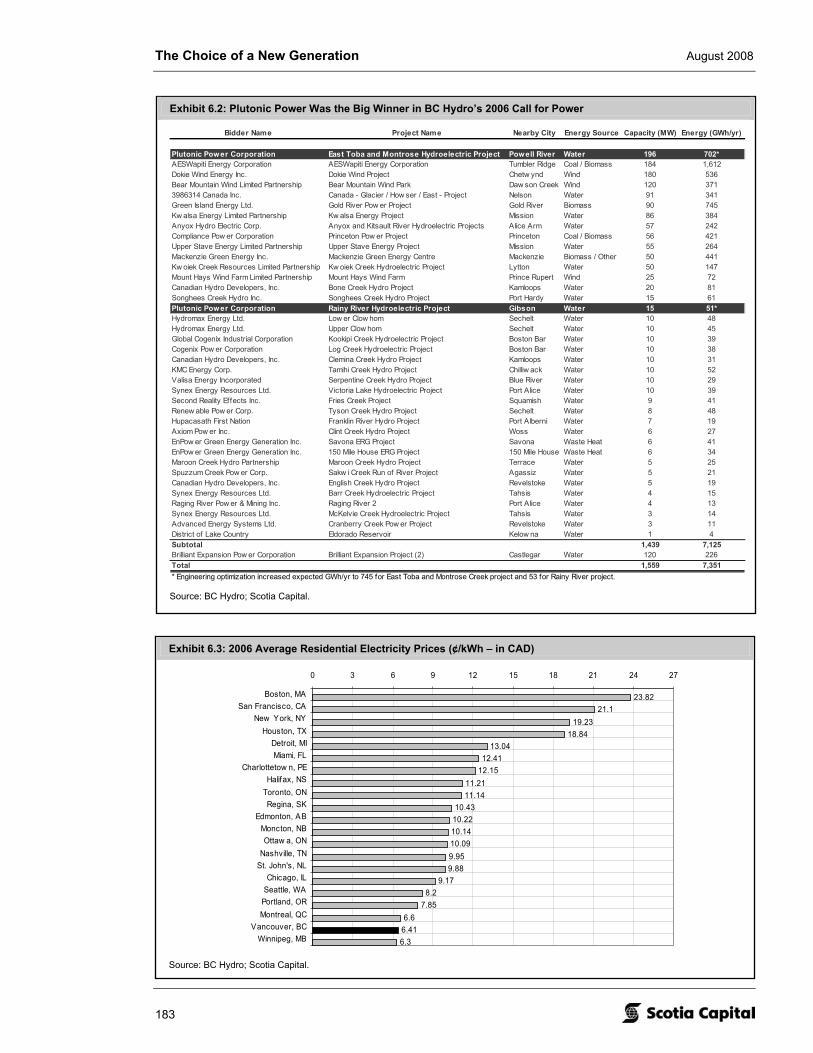
The Choice of a New Generation August 2008
183
Exhibit 6.2: Plutonic Power Was the Big Winner in BC Hydro’s 2006 Call for Power
Bidder Name Project Name Nearby City Energy Source Capacity (MW) Energy (GWh/yr)
Plutonic Power Corporation East Toba and Montrose Hydroelectric Project Powell River Water 196 702*AESWapiti Energy Corporation AESWapiti Energy Corporation Tumbler Ridge Coal / Biomass 184 1,612Dokie Wind Energy Inc. Dokie Wind Project Chetw ynd Wind 180 536Bear Mountain Wind Limited Partnership Bear Mountain Wind Park Daw son Creek Wind 120 3713986314 Canada Inc. Canada - Glacier / How ser / East - Project Nelson Water 91 341Green Island Energy Ltd. Gold River Pow er Project Gold River Biomass 90 745Kw alsa Energy Limited Partnership Kw alsa Energy Project Mission Water 86 384Anyox Hydro Electric Corp. Anyox and Kitsault River Hydroelectric Projects Alice Arm Water 57 242Compliance Pow er Corporation Princeton Pow er Project Princeton Coal / Biomass 56 421Upper Stave Energy Limited Partnership Upper Stave Energy Project Mission Water 55 264Mackenzie Green Energy Inc. Mackenzie Green Energy Centre Mackenzie Biomass / Other 50 441Kw oiek Creek Resources Limited Partnership Kw oiek Creek Hydroelectric Project Lytton Water 50 147Mount Hays Wind Farm Limited Partnership Mount Hays Wind Farm Prince Rupert Wind 25 72Canadian Hydro Developers, Inc. Bone Creek Hydro Project Kamloops Water 20 81Songhees Creek Hydro Inc. Songhees Creek Hydro Project Port Hardy Water 15 61Plutonic Power Corporation Rainy River Hydroelectric Project Gibson Water 15 51*Hydromax Energy Ltd. Low er Clow hom Sechelt Water 10 48Hydromax Energy Ltd. Upper Clow hom Sechelt Water 10 45Global Cogenix Industrial Corporation Kookipi Creek Hydroelectric Project Boston Bar Water 10 39Cogenix Pow er Corporation Log Creek Hydroelectric Project Boston Bar Water 10 38Canadian Hydro Developers, Inc. Clemina Creek Hydro Project Kamloops Water 10 31KMC Energy Corp. Tamihi Creek Hydro Project Chilliw ack Water 10 52Valisa Energy Incorporated Serpentine Creek Hydro Project Blue River Water 10 29Synex Energy Resources Ltd. Victoria Lake Hydroelectric Project Port Alice Water 10 39Second Reality Effects Inc. Fries Creek Project Squamish Water 9 41Renew able Pow er Corp. Tyson Creek Hydro Project Sechelt Water 8 48Hupacasath First Nation Franklin River Hydro Project Port Alberni Water 7 19Axiom Pow er Inc. Clint Creek Hydro Project Woss Water 6 27EnPow er Green Energy Generation Inc. Savona ERG Project Savona Waste Heat 6 41EnPow er Green Energy Generation Inc. 150 Mile House ERG Project 150 Mile House Waste Heat 6 34Maroon Creek Hydro Partnership Maroon Creek Hydro Project Terrace Water 5 25Spuzzum Creek Pow er Corp. Sakw i Creek Run of River Project Agassiz Water 5 21Canadian Hydro Developers, Inc. English Creek Hydro Project Revelstoke Water 5 19Synex Energy Resources Ltd. Barr Creek Hydroelectric Project Tahsis Water 4 15Raging River Pow er & Mining Inc. Raging River 2 Port Alice Water 4 13Synex Energy Resources Ltd. McKelvie Creek Hydroelectric Project Tahsis Water 3 14Advanced Energy Systems Ltd. Cranberry Creek Pow er Project Revelstoke Water 3 11District of Lake Country Eldorado Reservoir Kelow na Water 1 4Subtotal 1,439 7,125Brilliant Expansion Pow er Corporation Brilliant Expansion Project (2) Castlegar Water 120 226Total 1,559 7,351* Engineering optimization increased expected GWh/yr to 745 for East Toba and Montrose Creek project and 53 for Rainy River project.
Source: BC Hydro; Scotia Capital.
Exhibit 6.3: 2006 Average Residential Electricity Prices (¢/kWh – in CAD)
23.8221.1
19.2318.84
13.0412.41
12.1511.2111.14
10.4310.2210.1410.099.959.88
9.178.2
7.856.6
6.416.3
0 3 6 9 12 15 18 21 24 27
Boston, MASan Francisco, CA
New York, NYHouston, TX
Detroit, MIMiami, FL
Charlottetow n, PEHalifax, NS
Toronto, ONRegina, SK
Edmonton, ABMoncton, NBOttaw a, ON
Nashville, TNSt. John's, NL
Chicago, ILSeattle, WA
Portland, ORMontreal, QC
Vancouver, BCWinnipeg, MB
Source: BC Hydro; Scotia Capital.

Alternative & Renewable Energy August 2008
184
Exhibit 6.4: Plutonic Power Corporation – Stock Performance
$5.00
$6.00
$7.00
$8.00
$9.00
$10.00
$11.00
$12.00
Dec-07 Feb-08 Apr-08 Jun-08
Pric
e
050100150200250300350400450500
Dai
ly V
olum
e (0
00s)
PCC (Volume) PCC (Price) STUTIL (rebased) SPTSX (rebased)
$297.3M
PCC$7.04
$9.29$5.8142.2M
Ticker:Last Price:Market Cap:52 Wk High:52 Wk Low :Shares O/S:
Source: Bloomberg; Scotia Capital.
Capital Markets Profile Plutonic Power Corporation is a British Columbia-based independent power producer that focuses on the identification, development, construction, and operation of non-storage hydroelectric projects, or run-of-river projects. Plutonic currently has 38 B.C. run-of-river projects at various stages of development in addition to two under construction, totalling almost 1,900 MW. Production from these projects could be about 6,200 GWh/y. The company believes this could provide over 25% of the incremental generation that British Columbia is forecasting the province will require by 2016.
Incorporated in 1999 as Plutonic Capital under the Capital Pool Company (CPC) program, the company initially engaged in various businesses that included software solutions for the call centre industry, diamond drilling, and mineral exploration. The company went public on November 25, 1999, at $0.20 per share via a $0.26 million initial public offering.
On October 27, 2003, Plutonic entered into a transaction for the purchase of a private British Columbia-based independent power company (Power Co.) founded by engineering firm Knight Piésold in exchange for 20% of Plutonic’s stock. At the time of Plutonic’s acquisition, Power Co. had B.C. water licence applications to generate power for nine drainage basins in Bute Inlet (Bute Inlet projects), three drainage basins in the Toba Inlet district (Toba Inlet projects), and three drainage basins in the vicinity of Knight Inlet (Knight Inlet projects), among others. On May 17, 2004, the transaction to create Plutonic Power Corporation closed.
Plutonic Power’s management team has a successful history of starting up companies, as well as raising capital. Donald McInnes, the company’s founder, CEO, and Vice Chairman, has equipped himself with a strong executive management team, which collectively have an appropriate mix of engineering, finance, electricity, and business talents.
Plutonic currently has a market capitalization of about $300 million, and its common shares trade on the Toronto Stock Exchange under the ticker symbol PCC. Insiders and related parties control about 16.2% of the fully diluted outstanding company shares. Fidelity Investments owns approximately 15.5% of the company. Plutonic Power reports in Canadian dollars and its financial statements are prepared in accordance with GAAP.
Plutonic has two construction projects and 38 development projects that total almost 1,900 MW.
Donald McInnes, the company’s founder, has equipped himself with a strong executive management team.

The Choice of a New Generation August 2008
185
In the 2006 BC Hydro Call for Power (CFP), Plutonic was awarded 211 MW of capacity backed by 35-year EPAs that totalled about 15% of BC Hydro’s awards. Plutonic received more new capacity than any other company in the 2006 BC Hydro CFP awards. Plutonic was awarded three of its four project submissions – namely, East Toba (123 MW), Montrose Creek (73 MW), and Rainy River (15 MW).
In July 2007, Plutonic dropped its Rainy River project due to fish habitat concerns, and subsequently sold the project, among others, to AltaGas Income Trust. Construction of the East Toba and Montrose Creek projects is underway as of early July 2007, with expected completion dates in 2H/10.
We believe that Plutonic will bid on 1,047 MW of new capacity proposals in the current BC Hydro Clean Power Call.
In the 2006 BC Hydro CFP, Plutonic was awarded more new capacity than any other company.
We think that Plutonic will submit over 1,000 MW of bids into the 2008 BC Hydro Clean Power Call.
Exhibit 6.5: Plutonic’s Project Pipeline
Source: Plutonic Power.

Alternative & Renewable Energy August 2008
186
Exhibit 6.6: Plutonic’s Portfolio of Assets and Development Projects
Est. Est. Est. Cap. Exp. PowerProject/Site Loc. Cap. Pdn Factor Purchaser Low High
(MW) (GWh/y) (%) ($M) ($M)Toba/Montrose
East Toba B.C. 123 465 43.2% BC HydroMontrose Creek B.C. 73 280 43.8% BC Hydro
Upper TobaDalgleish Creek B.C. 30 103 39.2% BC Hydro 68 80Jimmie Creek B.C. 56 200 40.8% BC Hydro 126 148Upper Toba River B.C. 47 163 39.6% BC Hydro 106 125
Bute InletAlgard Creek B.C. 21 70 38.1% BC Hydro 80 89Bear River B.C. 38 115 34.5% BC Hydro 145 162Brew Creek B.C. 81 281 39.8% BC Hydro 308 342Coola Creek B.C. 27 79 33.3% BC Hydro 103 115East Orford River B.C. 35 108 35.1% BC Hydro 134 149Elliot Creek B.C. 56 187 38.0% BC Hydro 214 238Elliot Neighbour B.C. 34 114 38.3% BC Hydro 130 145Gargoyle Creek B.C. 28 88 35.7% BC Hydro 107 119Heakamie River B.C. 47 140 33.9% BC Hydro 180 200Icewall Creek B.C. 56 204 41.6% BC Hydro 214 238Jewakwa River B.C. 96 283 33.7% BC Hydro 367 408North Orford River B.C. 22 68 35.3% BC Hydro 84 94Raleigh Creek B.C. 39 112 32.8% BC Hydro 149 166Scar Creek B.C. 58 182 35.8% BC Hydro 222 247Southgate River 1 B.C. 131 453 39.6% BC Hydro 499 555Southgate River 2 B.C. 39 134 39.2% BC Hydro 149 166Southgate River 3 B.C. 39 134 39.2% BC Hydro 149 166Whitemantle Creek B.C. 68 231 38.8% BC Hydro 260 289
Knight InletFissue Creek B.C. 56 165 33.6% BC Hydro 214 238Smythe Creek B.C. 31 89 32.8% BC Hydro 118 132Stanton Creek B.C. 65 197 34.6% BC Hydro 248 276
Europa Creek B.C. 81 280 39.5% BC Hydro 309 344
Freeda Creek B.C. 35 119 38.8% BC Hydro 134 149
OtherChusan Creek B.C. 22 70 36.3% BC Hydro 84 94Crevice Creek B.C. 22 72 37.4% BC Hydro 84 94Hoodo Creek B.C. 32 104 37.1% BC Hydro 122 136Mellersh Creek B.C. 22 72 37.4% BC Hydro 84 94Mill Creek & Woodfibre Creek B.C. 30 100 38.1% BC Hydro 115 128Paradise River B.C. 27 95 40.2% BC Hydro 103 115Racoon Creek B.C. 18 57 36.1% BC Hydro 69 77Sirenia Mountain B.C. 32 101 36.0% BC Hydro 122 136Tahumming River B.C. 28 88 35.9% BC Hydro 107 119Tumult Creek B.C. 41 122 34.0% BC Hydro 157 174Upper Lillooet River B.C. 81 257 36.2% BC Hydro 309 344Zoltan Creek B.C. 29 91 35.8% BC Hydro 111 123
TOTAL 1,895 6,270 37.8% 6,942 7,668
Capital Cost
660 660
Source: Company reports; Scotia Capital estimates.

The Choice of a New Generation August 2008
187
When Will Plutonic Need More Equity? With neither operating assets nor free cash flow generation for the near term, we believe Plutonic Power may need to access the equity markets within the next 12 months in order to further develop its portfolio of projects.
On August 14, Plutonic announced that it had signed a memorandum of understanding (MOU) with GE Energy Financial Services (GE), a unit of GE, to partner on a bid to develop the Upper Toba (133 MW) and the Bute Inlet (914 MW) projects. If the two bids are awarded PPAs, GE will make a $70 million equity contribution for a 50% interest in the Upper Toba project, and a $650 million equity contribution for a 60% interest in the Bute project.
In total, GE would provide 100% of the equity requirements for the projects, leaving Plutonic with no need to raise equity other than possibly for the following: (1) to fund itself until its Toba/Montrose project begins to generate cash; (2) Plutonic could exercise an option to repurchase a 10% interest in the Bute Inlet project for $100 million; and (3) to further develop its remaining projects and/or acquisitions.
Please refer to Exhibit 6.7 for a summary of Plutonic Power’s equity financing history.
Plutonic has arranged for a financial partner to provide the entire equity financing requirements for its Bute and Upper Toba projects, should they be awarded PPAs.
Exhibit 6.7: Plutonic’s Equity Financing History
Date Method of Sale Price per SecurityNumber of Securities Net Proceeds
18-Apr-2007 Private Placement $4.55 7,100,000 $30,467,059 2007 Exercise of options and warrants $0.20 to $2.00 1,996,639 $2,122,290 9-Nov-2006 Private Placement $2.00 10,000,000 $18,608,478 28-Mar-2006 Private Placement $0.80 3,100,000 $2,480,000 2006 Exercise of options and warrants $0.20 to $2.00 4,670,020 $2,894,200 2005 Exercise of options and warrants $0.20 to $0.32 226,250 $58,750 23-Dec-2004 Private Placement $0.70 to $0.80 3,259,169 $2,173,865 17-May-2004 Private Placement $0.25 2,270,000 $538,171 2004 Exercise of options and warrants $0.20 to $0.25 1,205,000 $300,500 8-Aug-2003 Private Placement $0.20 2,500,000 $480,873 2003 Exercise of options and warrants $0.25 60,000 $15,000 Prior to 30-Apr-2002 Escrow shares and IPO $0.20 to $0.40 1,150,000 $3,004,593
$63,143,779
2003 - 2007 $0.20 to $4.65 2,264,563 $1,800,000 (est. value)
Securities Issued for Considerations Other than Cash
Source: Toronto Stock Exchange; Plutonic Power; Scotia Capital.

Alternative & Renewable Energy August 2008
188
Exhibit 6.8: Status of Plutonic’s Impact Benefits Agreements
Project Achieved In Progress NotesSliammon First Nations Toba/Montrose Transmission Line √ Framework for future agreements set.Klahoose First Nations Toba/Montrose Project √ Framework for future agreements set.
Upper Toba Projects √ Consultation underway.Sechelt First Nations Toba/Montrose Transmission Line √ Accommodation to be provided by Plutonic Power.Homalco First Nations Bute Inlet Projects √ Target before Q3/08Da'naxda'xw First Nations Knight Inlet Projects √ Consultation underway.
First Nations Bands
Source: Plutonic Power.
Key Investment Risks H Y D R O L O G Y
Plutonic’s hydrology volatility risk is unavoidable and cannot be hedged without storage capability. The amount of energy generated by run-of-river hydro plants is dependent on water flow. Below-forecast water flow could hinder Plutonic’s ability to produce electricity and therefore reduce the company’s ability to generate revenue and net income. As run-of-river facilities do not have the ability to store water, there is no offset to hydrology risk, other than regional diversification of facility sites. An annual volatility range of +/-12% to 15%% annually is likely.
S I N G L E C U S T O M E R
Plutonic’s growth is 100% dependent on it being selected by its sole customer, BC Hydro. Plutonic relies completely on winning future power purchase agreements and is constrained by the timing of BC Hydro’s CFPs. Prior to the 2006 CFP, there was a 2002/03 Green Power Generation RFP, as well as a 2000/01 Call. A 2004 CFP was planned but delayed by two years. Future government delays in renewables bidding could significantly lower our future free cash flow expectations for Plutonic. In our view, the anticipated 2009 BC Hydro Clean Power Call has likely been pushed back by up to 12 months.
F I R S T N A T I O N S S U P P O R T
Lack of agreements or unfavourable outcomes to negotiations with First Nations groups that claim the land base on which Plutonic’s projects lie could adversely affect the company’s profitability. Run-of-river hydro facility sites are located in unique rugged landscapes that are essential to generating run-of-river power. Without the support of local First Nations communities, Plutonic’s projects could be delayed or even terminated. Plutonic has reached settlements with three First Nations bands that support the construction and operation of its first two run-of-river projects on their land. The outcome of future negotiations with First Nations is a risk to the company’s prospects.
M A N A G E M E N T
Key management risk is significant for Plutonic, as the company has only 35 full-time employees. Plutonic is heavily dependent on current management to promote and realize its future growth opportunities. If a key member of Plutonic’s management were to leave the company, operations could be significantly impaired.
Expect annual water flow volatility of +/-12% to 15% per project.
Plutonic’s growth strategy is 100% dependent on its sole customer, BC Hydro.
Plutonic has excellent relationships with local First Nations bands.

The Choice of a New Generation August 2008
189
C O S T / T I M I N G O V E R R U N S
There is no certainty that Plutonic’s future run-of-river projects and/or construction contracts will mitigate construction delay risks/overruns. Upon being awarded a PPA with BC Hydro, COD dates are typically agreed upon with the utility for a facility’s power generation to commence. If that date is not met, bid winners could lose expected revenue and may be exposed to penalties from debt covenants or from BC Hydro. For Plutonic, this risk is mostly mitigated as it has transferred the initial financial penalty risk on its first two projects to its engineering, procurement, and construction (EPC) contractor, Peter Kiewit Sons Co. (Kiewit).
F I N A N C I N G
Plutonic’s future financing risk is fairly low, following its recently announced deal with GE. However, should the arrangement with GE fall through (unlikely), we believe that Plutonic will need to raise 100% of its future project financing from either capital markets or from financial partners. Given current credit market conditions and credit risk repricing, Plutonic’s cost of capital may be somewhat higher and its access to capital may be somewhat constrained going forward. On debt financing, Plutonic typically seeks to fix the interest rate on its long-term project loans.
R E G U L A T O R Y E N V I R O N M E N T
Growth in the company’s operating assets is based exclusively on the B.C. government’s desire to maintain or increase the proportion of the province’s power portfolio that is generated by independent power producers. Our financial forecast assumes the continuation of current federal and provincial renewable power targets and policies.
S T A N D A R D O P E R A T I O N A L R I S K
Unplanned and longer-than-planned outages for maintenance and repair will negatively impact Plutonic’s revenue and profitability, as (1) electricity delivery will decline; and (2) operating costs will likely increase. Run-of-river outages that affect an entire power plant are generally more material than outages of wind farms, as an equipment failure of one wind turbine typically has an insignificant impact on the production output of an entire facility.
E X E C U T I O N R I S K
Obtaining all environmental and regulatory permits and licences, lease agreements, PPAs, local support, and favourable resource data for all projects may not occur as planned. Project implications from unsuccessful completion of a project’s development and construction process could have major share price implications.
The Fall of Europa Plutonic’s 81 MW Europa Creek project, located about 80 km southeast of Kitimat, may be permanently shelved. In May 2008, the B.C. government introduced legislation to finalize conservation area boundaries in the central and north coast areas of the province. Part of the introduced legislation precludes any type of power production within the specified boundaries, which includes the site for the $250 million run-of-river facility. Plutonic Power continues to seek B.C. government clarification on its new legislation. In our opinion, Plutonic’s Europa Creek project will likely be abandoned, and therefore we currently give no value to this project in our one-year target price. If the project is commissioned on time and within budget, we estimate the facility could be worth up to $3.50 per share.
Plutonic’s 81 MW Europa project will likely be abandoned.

Alternative & Renewable Energy August 2008
190
Share Price Observations – A News-Driven Story
To date, Plutonic has showered the market with numerous news releases, which overall, have had positive stock price reactions (Exhibit 6.9). The story has, as expected, been much quieter in the first half of 2008 as the market waits to see what projects Plutonic will be awarded in the upcoming BC Hydro Clean Power Call. In mid-2009, the anticipated time frame that BC Hydro will announce winning bids, we expect the stock to rise/fall by the net present value of the difference in value of the actual megawatts awarded to the number of megawatts the market anticipates will be awarded. We believe that Plutonic will bid 1,047 MW, or its 914 MW Bute Inlet project (18 sites) as well as its 133 MW Upper Toba project (three sites). Within our DCF, we currently assign a 35% probability of success to both the Upper Toba project and to the Bute Inlet project.
Exhibit 6.9: Plutonic’s Press Releases
Date Headline Value PCC Changes
August 14, 2008Plutonic Power, GE Energy Financial Services Lay Foundation for Largest Canadian Private Sector Hydroelectric Generation Investment
XXX +6.1%
May 15, 2008 Plutonic Power announces resolution results from AGM
X
May 14, 2008Plutonic Power and Knight Piesold extend agreement of partnership for identification and evaluation of run-of-river sites through 2014.
X
April 22, 2008 Plutonic Power submits 914 MW Bute Inlet project into Environmental Permitting Process
XX +10.3% during next week
April 14, 2008 Plutonic Power announces project development activities to advance the Green Power Corridor
- -2.5%
March 31, 2008 Plutonic Power announces the addition of 11 new run-of-river sites to the Green Power Corridor
XXX +7% during the next two weeks
March 3, 2008 Plutonic Power finalizes Long-Term Impact Benefit Agreement with Sechelt First Nation
- -2% the next day
February 13, 2008 Plutonic Power sells Rainy River and Hope Projects to AltaGas Income Trust
XX
February 11, 2008 Plutonic Power energizes executive team through addition of Senior Vice President, Legal Affairs and Corporate Secretary
X
January 24, 2008 Plutonic Power lauds historic and innovative partnership between Klahoose First Nation, Peter Kiewit Sons Co. and Powell River School District
X +5% the next day
November 8, 2007 Plutonic and GE Close $470 Million Credit Facility; Financing of 196 MW Run-of-River Hydroelectric Project Completed
XX-3.5% since commencing on
October 30
October 30, 2007 Plutonic and GE commence funding for Toba Montrose General Partnership
- Flat the next day
October 16, 2007 Plutonic Power announces transformation of its executive management team
X +4.5% the next day
October 4, 2007 BC's Largest Private Run-Of-River Project Unites First Nations and Business Community
XX +7% the next day
September 20, 2007 Plutonic Power and GE Energy Financial Services execute $500 million fixed-price contract for BC's largest renewable energy project
XX +17% during next week
August 13, 2007 Plutonic Power Successfully Applies for Three New Run-Of-River Hydroelectric Projects
XX +3%
August 03, 2007 Plutonic Power exits electricity purchase agreement with BC Hydro for Rainy River project due to environmental permitting complexities
XXX -9% during next week
-5.4% over surrounding days
+4.5% during the week
Source: Company reports; Bloomberg; Scotia Capital.

The Choice of a New Generation August 2008
191
Exhibit 6.9 : Plutonic’s Press Releases (cont’d)
Date Headline Value PCC Changes
July 31, 2007 Plutonic Power Submits 120 MW Upper Toba Valley Run-of-River Project into the Environmental Permitting Process
X +2%
July 17, 2007 Plutonic Breaks Ground On $660 Million East Toba/Montrose Green Energy Project
XXX +9% over next three days
July 11, 2007 Plutonic Adds Power To Its Management Team X +12%
July 09, 2007 Plutonic Power Successfully Applies for Two New Run-Of-River Hydroelectric Projects
XX +17% over next three days
June 27, 2007 Plutonic Power Graduates To The TSX X +3%
May 29, 2007 Plutonic Power Successfully Applies For Four New Run-of-River Hydroelectric Projects
XX +5% the previous day
May 24, 2007
GE Unit To Invest In 196-Megawatt Hydroelectric Project In British Columbia, Its First Equity Investment In Canada -- Plutonic Lays Financing Groundwork For Additional 300 MW
XXX
May 22, 2007 Federal level screening successfully completed for East Toba and Montrose Run of River Project
X
April 30, 2007 Plutonic Power Terminates Consulting Agreement - +10% during the week
April 25, 2007 Plutonic Power Awarded Environmental Assessment Certificate
XX +6% next day
April 19, 2007 Plutonic Power Finalizes Impact Benefits Agreement with Sliammon First Nation
-
April 18, 2007 Plutonic Power Closes $32.3 Million Bought Deal Private Placement
-
April 17, 2007 Plutonic Power Successfully Applies For Three New Run-Of-River Green Energy Hydropower Projects
XX
March 29, 2007 Plutonic Power Corporation Announces $32 Million Bought Deal Private Placement Financing
XXX
March 28, 2007 Plutonic Power Corporation Grants Stock Options -
March 27, 2007 Plutonic Power Corporation Appoints Bruce Ripley Executive Vice-President, Operations
X
March 06, 2007 Plutonic Power Signs Term Sheet With Sliammon First Nation For Run-of-River Hydroelectric Project
X +5%
February 20, 2007 Plutonic Power Finalizes Impact Benefits Agreement With Klahoose First Nation
X +16% during the week leading up to announcement
+8% during the week
Flat during the week
+18% during the week
Source: Company reports; Bloomberg; Scotia Capital.

Alternative & Renewable Energy August 2008
192
Exhibit 6.10: What the Market Is Likely Thinking
Gross Effective Capacity Prob. of AdjustedProject Capacity Capacity Factor DCF Success DCF Comments
(MW) (MW) (%) ($/share) (%) ($/share)
East Toba & Montrose 196 78 43% $2.98 100% $2.98 Fixed-price EPC increased probability to 100% from 90%
Upper Toba 133 67 40% $3.32 25% $0.83 Assumes 50% economic interest
Bute Inlet 914 366 37% $13.97 25% $3.49 Assumes 40% economic interest
Knight Inlet 156 156 34% $5.01 0% $0.00
Europa Creek 81 81 39% $3.51 0% $0.00 At risk of being shelved
Freda Creek 35 35 39% $0.98 0% $0.00
Other (12) 384 384 37% $12.84 0% $0.00
1,899 1,167 $7.30
Note: We have assumed the federal government ecoEnergy incentive payment is extended beyond 2011.
Source: Scotia Capital estimates.
Upcoming Stock Catalysts & Events In our opinion, Plutonic’s current share price of about $7.00 likely reflects the following: a 100% probability of its Toba/Montrose project being commissioned on time and on budget, and a 20% to 25% probability of both its Bute Inlet and Upper Toba projects being selected in the BC Hydro Clean Power Call, as well as being financed and constructed on time and on budget (Exhibit 6.10).
Below, we have identified upcoming events that we believe could move Plutonic’s stock price:
November 2008 – BC Hydro 2008 Clean Power Call bids due. In our opinion, Plutonic will submit its 133 MW Upper Toba and its 914 MW Bute Inlet projects into BC Hydro’s current Call for Power.
1H/09 – BC Hydro 2008 Clean Power Call awards expected, likely after the B.C. government election that is scheduled for May 2009.
Ongoing – Permitting progress on future projects. Specifically, we look for 2008 permitting progress on Plutonic’s Upper Toba, Bute Inlet, Freda Creek, and Knight Inlet projects. We also expect hydrology study progress on many of its other projects.
Ongoing – New project announcements and other growth initiatives.
P L U T O N I C A S A P O S S I B L E T A K E O V E R T A R G E T
Plutonic could be a future acquisition target for energy utility and pipeline companies and/or other large IPPs that wish to enhance the renewable portion of their energy portfolios. Emissions reduction requirements for power companies with coal- and natural-gas-fired power plants could make Plutonic attractive, as 100% of Plutonic’s planned generation will be emissions-free. Possible Canadian suitors for its renewable power portfolio include TransCanada Pipelines Ltd., TransAlta Corporation, and ATCO Ltd., which have about 87%, 86%, and 99% of their portfolios in either coal, nuclear (TransCanada only), or oil- or natural-gas-fired power plants, respectively. Possible international suitors include GE itself, Suez (recently acquired Ventus), AEP (largest coal-fired emitter in North America), or other U.S. entities if/when future GHG emission rules are established for both the United States and Canada on a consistent basis.
November 25, 2008, could be the next major stock catalyst for Plutonic, which is when BC Hydro RFP bids are due.
We don’t think Plutonic has a high probability of being acquired.

The Choice of a New Generation August 2008
193
We believe that Canadian Hydro Developers and Boralex are not likely suitors for Plutonic as any deal for Plutonic would appear too dilutive for too many years. These two companies already have renewable generation at 100% and 96% of total installed MW capacity, respectively. We believe that synergies with Plutonic, besides some SG&A saving, would be minimal.
In our opinion, only a major publicly traded company could consider Plutonic due to likely EPS dilution effects in the near term. Potential private equity bidders would likely focus more on future free cash flows than EPS and may be willing to pay more once Plutonic’s construction and financing risks are over.
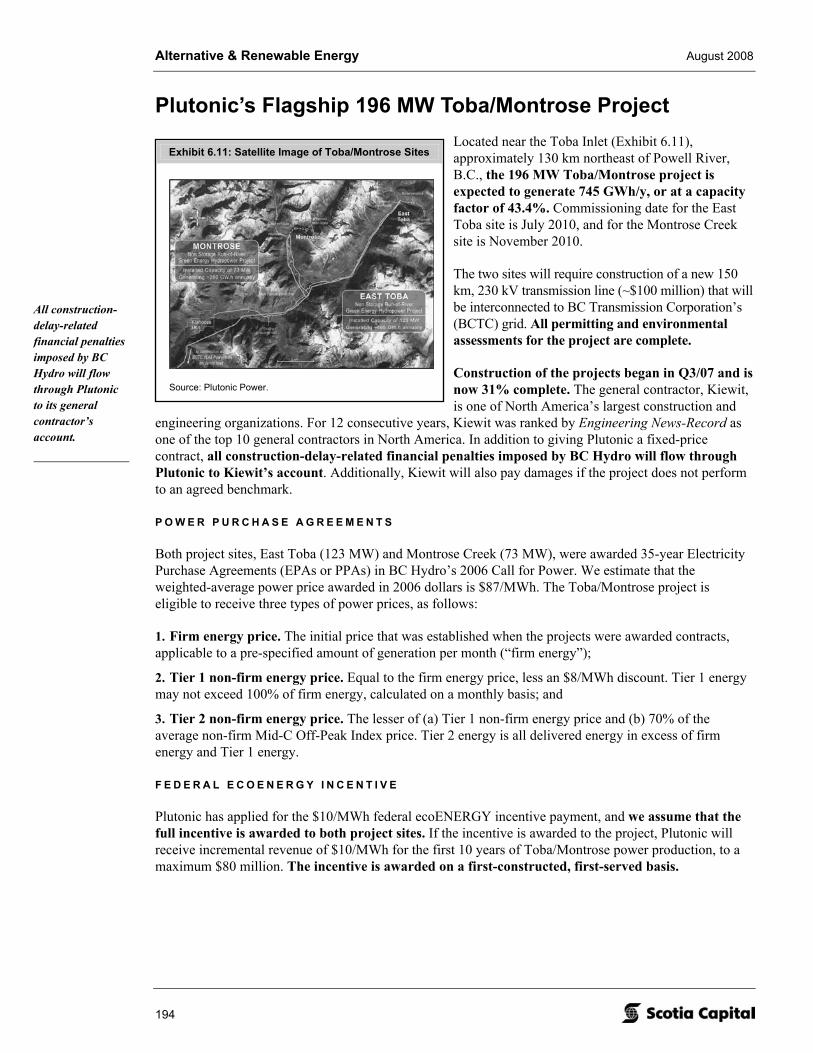
Alternative & Renewable Energy August 2008
194
Exhibit 6.11: Satellite Image of Toba/Montrose Sites
Source: Plutonic Power.
Plutonic’s Flagship 196 MW Toba/Montrose Project Located near the Toba Inlet (Exhibit 6.11), approximately 130 km northeast of Powell River, B.C., the 196 MW Toba/Montrose project is expected to generate 745 GWh/y, or at a capacity factor of 43.4%. Commissioning date for the East Toba site is July 2010, and for the Montrose Creek site is November 2010.
The two sites will require construction of a new 150 km, 230 kV transmission line (~$100 million) that will be interconnected to BC Transmission Corporation’s (BCTC) grid. All permitting and environmental assessments for the project are complete.
Construction of the projects began in Q3/07 and is now 31% complete. The general contractor, Kiewit, is one of North America’s largest construction and
engineering organizations. For 12 consecutive years, Kiewit was ranked by Engineering News-Record as one of the top 10 general contractors in North America. In addition to giving Plutonic a fixed-price contract, all construction-delay-related financial penalties imposed by BC Hydro will flow through Plutonic to Kiewit’s account. Additionally, Kiewit will also pay damages if the project does not perform to an agreed benchmark.
P O W E R P U R C H A S E A G R E E M E N T S
Both project sites, East Toba (123 MW) and Montrose Creek (73 MW), were awarded 35-year Electricity Purchase Agreements (EPAs or PPAs) in BC Hydro’s 2006 Call for Power. We estimate that the weighted-average power price awarded in 2006 dollars is $87/MWh. The Toba/Montrose project is eligible to receive three types of power prices, as follows:
1. Firm energy price. The initial price that was established when the projects were awarded contracts, applicable to a pre-specified amount of generation per month (“firm energy”);
2. Tier 1 non-firm energy price. Equal to the firm energy price, less an $8/MWh discount. Tier 1 energy may not exceed 100% of firm energy, calculated on a monthly basis; and
3. Tier 2 non-firm energy price. The lesser of (a) Tier 1 non-firm energy price and (b) 70% of the average non-firm Mid-C Off-Peak Index price. Tier 2 energy is all delivered energy in excess of firm energy and Tier 1 energy.
F E D E R A L E C O E N E R G Y I N C E N T I V E
Plutonic has applied for the $10/MWh federal ecoENERGY incentive payment, and we assume that the full incentive is awarded to both project sites. If the incentive is awarded to the project, Plutonic will receive incremental revenue of $10/MWh for the first 10 years of Toba/Montrose power production, to a maximum $80 million. The incentive is awarded on a first-constructed, first-served basis.
All construction-delay-related financial penalties imposed by BC Hydro will flow through Plutonic to its general contractor’s account.

The Choice of a New Generation August 2008
195
Exhibit 6.12: East Toba/Montrose Creek Funding
GE Equity $100M EPC Contract $498MPlutonic Equity $30M Financing Expense $87MGE Guarantee - Contingency $28M Contingencies and Debt Service Reserve $29MGE Guarantee - Performance Bond $12M Working Capital and Start-Up Costs $16MPre-COD Revenue $20M EPA Performance Security $12MSenior Loan $470M Land Lease Insurance Property Taxes $7M
Development Costs and First Nations Payment $11M$660M $660M
Sources Uses
Source: Plutonic Power; Scotia Capital estimates.
P R O J E C T E C O N O M I C S
The total cost for Toba/Montrose is about $660 million, which we break down in Exhibit 6.12. At first glance, a cost per installed MW of $3.4 million seems high, but after subtracting $100 million for the construction of a new transmission line that will serve other potential projects, we estimate a comparable cost of $2.85 million per MW.
To finance the $660 million project, Plutonic made the following arrangements with GE Energy Financial Services (GE):
• GE will invest $100 million equity in the Toba/Montrose project.
• GE will co-lead an approximate $470 million senior secured debt offering to finance the project.
• GE will receive a 60% economic interest and 49% ownership interest in the project during the 35-year EPA, at which point the economic interest will revert to 51% to Plutonic and 49% to GE. Additionally, Plutonic granted GE 375,000 two-year common share purchase warrants with an exercise price of $2.50 per share, as well as a further 650,000 two-year common share purchase warrants with an exercise price of $9.03 per share.
• GE will establish a $28 million credit facility as a standby contingency facility.
• GE will establish a $100 million three-year credit facility that will be repaid with the proceeds of its equity investment once commercial operations begin.
• Plutonic will provide $30 million in direct equity prior to the completion of construction, for which GE has provided Plutonic a $30 million line of credit in support of this funding requirement.
• Plutonic will grant GE the right of first refusal to negotiate its participation in up to 200 MW of other run-of-river power projects in that Plutonic tenders into the 2008 BC Hydro Clean Power Call.
The Toba/Montrose cost per MW is $2.85 million, excluding a $100 million transmission line.
GE has the right of first refusal to negotiate participation in up to 200 MW of future B.C. run-of-river projects.

Alternative & Renewable Energy August 2008
196
Exhibit 6.13: Upper Toba Hydrology
0
2
4
6
8
10
12
14
Jan Feb Mar Apr May Jun Jul Aug Sep Oct Nov Dec
Flow
(m3 /s
)
0
5
10
15
20
25
30
35
40
45
Jan Feb Mar Apr May Jun Jul Aug Sep Oct Nov Dec
Flow
(m3 /s
)
Jimmie Creek (56 MW)
0
5
10
15
20
25
30
Jan Feb Mar Apr May Jun Jul Aug Sep Oct Nov Dec
Flow
(m3 /s
)
Upper Toba River (47 MW)
Dalgleish Creek (30 MW)
Avg Flow
Max Flow
Min Flow
Source: Plutonic Power; Scotia Capital.
Plutonic’s Likely BC Hydro Clean Power Call Bids We anticipate that Plutonic Power will submit 1,047 MW of potential installed capacity into BC Hydro’s Clean Power Call – its 914 MW Bute Inlet project and its 133 MW Upper Toba project. We describe these two projects below. While the outcome of the project bids are binary in nature, we have probability-adjusted our estimated success rates of each project in our discounted cash flow valuation. Our valuation therefore has significant upside room should both projects be awarded long-term PPAs.
U P P E R T O B A
Three run-of-river sites make up the 133 MW Upper Toba Valley project, which are all located in an area approximately 50 km northeast of the head of the Toba Inlet. Plutonic estimates the project will be able to achieve an aggregate 466 GWh/y of power production, or an implied capacity factor of 40.0%. Site specifics are as follows: (1) Dalgleish Creek @ 30 MW, producing up to 103 GWh/y; (2) Jimmie Creek @ 56 MW, producing up to 200 GWh/y; and (3) Upper Toba River @ 47 MW, producing up to 163 GWh/y. Plutonic anticipates that the project would use the transmission line currently being built for its Toba/Montrose project. If the project is awarded a PPA, we estimate a 2012 commissioning date. We expect the project’s seasonal production profile to be similar to the Toba/Montrose project. Exhibit 6.13 shows the hydrology of the three sites.
Under the terms of its MOU with GE, Plutonic would provide a 50% economic interest in the project in return for GE providing the entire equity requirement of about $70 million, as well as the right to arrange debt financing. We estimate the total capital cost of the project will range between $300 million and $350 million. Using an 80% debt and 20% equity project capital structure, and assuming no free cash flow is used to support the project as there isn’t any, Plutonic should not need to issue any equity to develop the project.
Our DCF valuation has significant upside room should Plutonic’s Bute Inlet and Upper Toba projects be awarded BC Hydro PPAs.

The Choice of a New Generation August 2008
197
Exhibit 6.14: Map of Bute Inlet Project
Source: Plutonic Power.
B U T E I N L E T
Plutonic’s colossal 914 MW Bute Inlet project consists of 18 sites that are estimated by the company to generate up to 2,980 GWh/y of electricity, or an implied capacity factor of 37.2%. The project sites are located within a 50 km radius of the head of Bute Inlet, which is located about 150 km north of Power River, B.C. (Exhibit 6.14). COD for the 18 Bute sites will likely be staged from 2014 to 2016. We estimate the price tag for the project at $3.5 billion, and accordingly, we believe Plutonic made a smart move by having GE provide the entire equity financing requirement in return for a 60% economic interest. Plutonic has completed Stages 1 and 2 of the process of securing water licences and Crown land from the B.C. government.
O T H E R P R O J E C T S
Plutonic has numerous other sites that, for the most part, are likely too early in the development process to be submitted into the current BC Hydro Clean Power Call. Exhibit 6.6 (earlier) details all of the company’s project sites.
R A I N Y R I V E R A N D H O P E P R O J E C T S S O L D
On February 13, 2008, Plutonic announced that it had sold its 14 MW Rainy River and 37 MW Hope projects to AltaGas Income Trust in an effort to focus on the development of its Green Power Corridor along the southwest coast of B.C. Plutonic received a payment of $4.5 million for the projects, in the form of 180,433 special warrants for AltaGas trust units valued at $24.94 per special warrant. The special warrants convert to AltaGas units on a one-for-one basis on January 1, 2010. On a per MW basis, AltaGas paid $90,000, in line with similar transactions we have seen in the renewable space.
In mid-2006, Plutonic was awarded a 35-year EPA for the Rainy River project by BC Hydro. However, following receipt of the EPA, on August 3, 2007, further development of the project was temporarily abandoned. Plutonic cited “unexpected complexities in the environmental permitting process caused by the discovery of a number of fish species in the area.”
We estimate the price tag for Plutonic’s Bute Inlet project at about $3.5 billion.
Plutonic received about $90,000 per MW for its Rainy River and Hope projects, in line with similar transactions we have seen.

Alternative & Renewable Energy August 2008
198
Exhibit 6.15: DCF Valuation Suggests Plutonic Is Fairly Valued at $9.03/Share One Year Out
Gross Effective Capacity Prob. of AdjustedProject Capacity Capacity Factor DCF Success DCF Comments
(MW) (MW) (%) ($/share) (%) ($/share)
East Toba & Montrose 196 78 43% $2.98 100% $2.98 Fixed-price EPC increased probability to 100% from 90%
Upper Toba 133 67 40% $3.32 35% $1.16 Assumes 50% economic interest
Bute Inlet 914 366 37% $13.97 35% $4.89 Assumes 40% economic interest
Knight Inlet 156 156 34% $5.01 0% $0.00
Europa Creek 81 81 39% $3.51 0% $0.00 At risk of being shelved
Freda Creek 35 35 39% $0.98 0% $0.00
Other (12) 384 384 37% $12.84 0% $0.00
1,899 1,167 $9.03
Note: We have assumed the federal government ecoEnergy incentive payment is extended beyond 2011.
Source: Scotia Capital estimates.
Valuation & Sensitivity Analyses
F U L L V A L U E F O R T O B A / M O N T R O S E ; S O M E V A L U E F O R B I D - R E A D Y P R O J E C T S ; N O N E F O R B R A G - A - W A T T S
We value Plutonic Power using a blended approach as follows: a probability-weighted discounted cash flow (DCF) analysis and a probability-weighted net asset value (NAV) per share.
Our DCF analysis results in a one-year target price of $9.03 per share (Exhibit 6.15). For our DCF analysis, we use a discount rate of 10.5%. In our view, the discount rate selected reasonably reflects the company’s risk profile, as follows: (1) we chose not to include any project in our financial forecast that wasn’t (i) under construction; or (ii) bid-ready with material permitting progress made; (2) Plutonic mitigates cost and timing overrun risks by entering into fixed-price contracts with its contractor (although there is no guarantee this will continue); (3) Plutonic’s only customer (BC Hydro) is an investment-grade crown corporation that offers long-term fixed-price contracts to its PPA holders; and (4) the company uses a project capital structure that is 80% debt-weighted. The cost of debt for Toba/Montrose debt facilities is effectively locked in at a pre-tax rate of less than 6.5%.
• We give full value (i.e., 100% probability) for the Toba/Montrose project being constructed on time and on budget, as financial penalties imposed on Plutonic as a result of a delayed COD will be passed on to Plutonic’s general contractor.
• We assign a 35% probability of success to Plutonic’s 133 MW Upper Toba project being (1) bid into the BC Hydro Clean Power Call; (2) awarded a long-term PPA; (3) constructed on time and within budget. We also assume that Plutonic’s net interest in the project is reduced to 50% in return for 100% of the equity funding requirements provided by GE.
• We assign a 35% probability of success to Plutonic’s 914 MW Bute Inlet project being (1) bid into the BC Hydro Clean Power Call; (2) awarded a long-term PPA; (3) constructed on time and within budget. We also assume that Plutonic’s net interest in the project is reduced to 40% in return for 100% of the equity funding requirements provided by GE.
• Simply put, if the full Bute Inlet project did win its bid submission, it would lock in Plutonic Power as the overall BC Hydro Call for Power winner for a second straight time. It is possible that BC Hydro may not allow this to happen for the following reasons: (1) the project makes up 60% of the 5,000 GWh/y Clean Power Call – too many eggs in one basket; (2) there could be a backlash by independent power producers; and (3) the implications of possible public criticism could be costly in a B.C. government election year (~May 2009).
Our DCF analysis results in a one-year target price of $9.03 per share. We use a WACC of 10.5%.

The Choice of a New Generation August 2008
199
We calculate a risk-adjusted NAV of $8.75 per share. Given recent transactions and using rule-of-thumb metrics for run-of-river facilities, we give power generation credit of $1 million per GWh/y for capacity that is either operational or under construction with no construction risk, such as Plutonic’s Toba/Montrose project. Note that for this project, and for all other projects, we use Plutonic’s net effective interest in the project (i.e., 78.4 MW for Toba/Montrose). We probability-adjust this value lower for those projects that are less developed. Our NAV per share is broken down by project in Exhibit 6.16.
T A R G E T P R I C E , R A T I N G , A N D R I S K R A N K I N G
We have transferred coverage of Plutonic Power with a 2-Sector Perform rating. Our one-year share price target is $9.00. Embedded in our one-year target are a 35% probability that Upper Toba (133 MW) successfully receives a PPA in the 2008 BC Hydro Clean Power Call, and a 35% probability that Bute Inlet (914 MW) receives the same.
Our risk ranking for Plutonic Power is Caution Warranted, as it is for EarthFirst and for Innergex. We believe this is justified by the early stage of the company’s life, the speculative nature of its future projects being successful, and stock illiquidity.
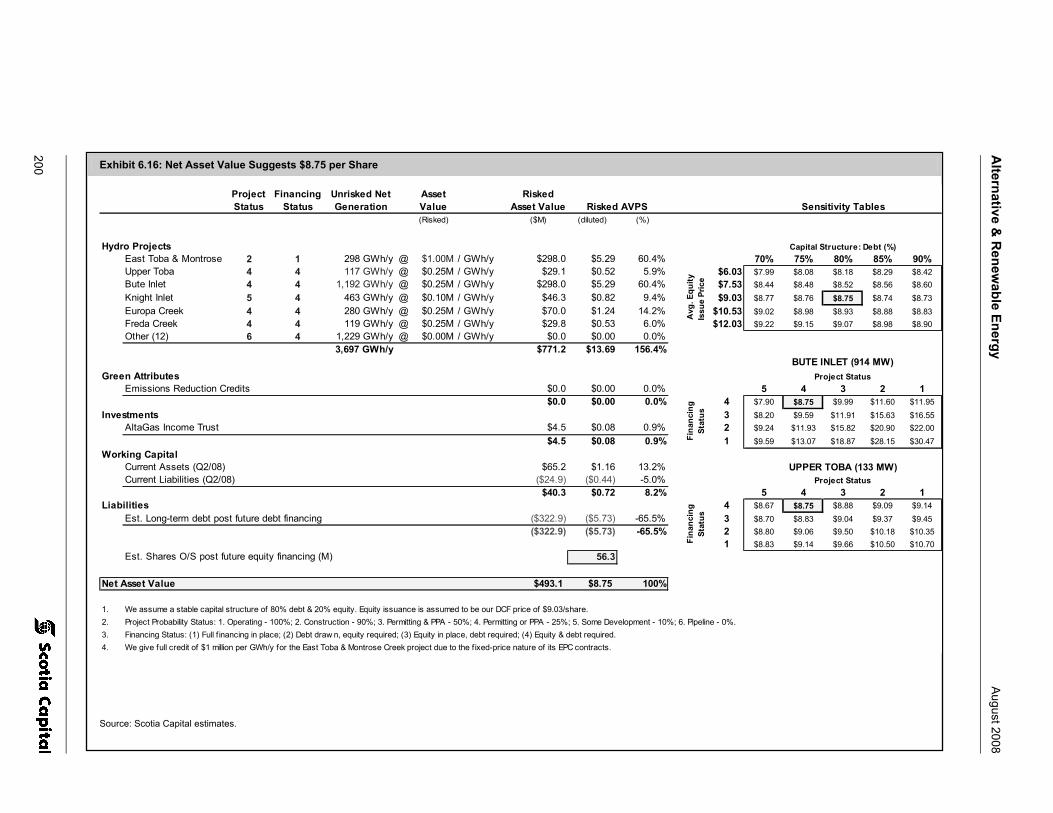
Alternative &
Renew
able Energy A
ugust 2008
200 Exhibit 6.16: Net Asset Value Suggests $8.75 per Share
Project Status
Financing Status
Unrisked Net Generation
Asset Value
Risked Asset Value
(Risked) ($M) (diluted) (%)
Hydro ProjectsEast Toba & Montrose 2 1 298 GWh/y @ $1.00M / GWh/y $298.0 $5.29 60.4% $8.75 70% 75% 80% 85% 90%Upper Toba 4 4 117 GWh/y @ $0.25M / GWh/y $29.1 $0.52 5.9% $6.03 $7.99 $8.08 $8.18 $8.29 $8.42Bute Inlet 4 4 1,192 GWh/y @ $0.25M / GWh/y $298.0 $5.29 60.4% $7.53 $8.44 $8.48 $8.52 $8.56 $8.60Knight Inlet 5 4 463 GWh/y @ $0.10M / GWh/y $46.3 $0.82 9.4% $9.03 $8.77 $8.76 $8.75 $8.74 $8.73Europa Creek 4 4 280 GWh/y @ $0.25M / GWh/y $70.0 $1.24 14.2% $10.53 $9.02 $8.98 $8.93 $8.88 $8.83Freda Creek 4 4 119 GWh/y @ $0.25M / GWh/y $29.8 $0.53 6.0% $12.03 $9.22 $9.15 $9.07 $8.98 $8.90Other (12) 6 4 1,229 GWh/y @ $0.00M / GWh/y $0.0 $0.00 0.0%
3,697 GWh/y $771.2 $13.69 156.4%
Green AttributesEmissions Reduction Credits $0.0 $0.00 0.0% $8.75 5 4 3 2 1
$0.0 $0.00 0.0% 4 $7.90 $8.75 $9.99 $11.60 $11.95Investments 3 $8.20 $9.59 $11.91 $15.63 $16.55
AltaGas Income Trust $4.5 $0.08 0.9% 2 $9.24 $11.93 $15.82 $20.90 $22.00$4.5 $0.08 0.9% 1 $9.59 $13.07 $18.87 $28.15 $30.47
Working CapitalCurrent Assets (Q2/08) $65.2 $1.16 13.2%Current Liabilities (Q2/08) ($24.9) ($0.44) -5.0%
$40.3 $0.72 8.2% $8.75 5 4 3 2 1Liabilities 4 $8.67 $8.75 $8.88 $9.09 $9.14
Est. Long-term debt post future debt financing ($322.9) ($5.73) -65.5% 3 $8.70 $8.83 $9.04 $9.37 $9.45($322.9) ($5.73) -65.5% 2 $8.80 $9.06 $9.50 $10.18 $10.35
1 $8.83 $9.14 $9.66 $10.50 $10.70Est. Shares O/S post future equity financing (M) 56.3
Net Asset Value $493.1 $8.75 100%
1. We assume a stable capital structure of 80% debt & 20% equity. Equity issuance is assumed to be our DCF price of $9.03/share.2. Project Probability Status: 1. Operating - 100%; 2. Construction - 90%; 3. Permitting & PPA - 50%; 4. Permitting or PPA - 25%; 5. Some Development - 10%; 6. Pipeline - 0%.3. Financing Status: (1) Full f inancing in place; (2) Debt draw n, equity required; (3) Equity in place, debt required; (4) Equity & debt required.4. We give full credit of $1 million per GWh/y for the East Toba & Montrose Creek project due to the f ixed-price nature of its EPC contracts.
Risked AVPS
Capital Structure: Debt (%)
Avg
. Equ
ity
Issu
e Pr
ice
Sensitivity Tables
Project Status
Fina
ncin
g St
atus
UPPER TOBA (133 MW)
BUTE INLET (914 MW)Project Status
Fina
ncin
g St
atus
Source: Scotia Capital estimates.

The Choice of a New Generation August 2008
201
Exhibit 6.17: Our Forecast Plutonic Power Electricity Generation (Gross) Capacity
0
50
100
150
200
250
300
350
400
Q1-10 Q2-10 Q3-10 Q4-10 Q1-11 Q2-11 Q3-11 Q4-11 Q1-12 Q2-12 Q3-12 Q4-12
Inst
alle
d Ca
paci
ty (M
W)
In the quarter that new capacity comes online, we apply a 50% mid-point weight as we do not know when in the quarter the facility w ill begin to generate
revenue
Source: Scotia Capital estimates.
Financial Forecast We expect Plutonic’s East Toba and Montrose Creek sites will be up and running by Q3/10 and Q4/10, respectively (Exhibit 6.17). We are not too concerned with construction cost overruns, as Plutonic has passed on the liability for higher-than-budgeted costs to its general contractor through the use of a fixed-price contract. If the Upper Toba and Bute Inlet projects receive PPAs in the current BC Hydro Clean Power Call, and assuming successful completion of permitting, financing, and construction, we think those projects could be online in 2012 and between 2014 and 2016 (staged), respectively.
For now, our financial forecast includes earnings associated with the Bute Inlet and Upper Toba Valley projects, as well as Plutonic’s flagship Toba/Montrose project.
S T A N D A R D B C H Y D R O E P A P R I C I N G P L U S E C O E N E R G Y I N C E N T I V E S
We estimate that the Toba/Montrose project will receive a weighted-average power price of $91.44/MWh in 2011, or the project’s first full year of operation. We also expect the project will qualify for and receive the federal government’s ecoENERGY incentive payment of $10/MWh for the power plant’s first 10 operating years, to a maximum of $80 million. While the current federal government ecoENERGY incentive program is closed for new projects coming online after 2011, we believe the program will be extended for a further three to five years.

Alternative & Renewable Energy August 2008
202
Exhibit 6.19: Expect Seasonally Volatile Quarterly EBITDA and EPS
($0.20)
($0.10)
$0.00
$0.10
$0.20
$0.30
$0.40
$0.50
$0.60
$0.70
$0.80
Q1-11E Q1-12E Q1-13E Q1-14E Q1-15E Q1-16E Q1-17E Q1-18E Q1-19E Q1-20E
Earn
ings
per
Sha
re
($30,000)
($15,000)
$0
$15,000
$30,000
$45,000
$60,000
$75,000
$90,000
$105,000
$120,000
EBI
TDA
(000
s)
Quarterly EBITDA
Quarterly EPS
Source: Scotia Capital estimates.
Exhibit 6.18: Toba/Montrose Seasonality
0
20,000
40,000
60,000
80,000
100,000
120,000
140,000
160,000
180,000
Jan Feb Mar Apr May Jun Jul Aug Sep Oct Nov Dec
MW
h
Forecast Generation
Q1 = 3%Q2 = 32%Q3 = 53%Q4 = 12%
Source: Plutonic Power; Scotia Capital.
For Upper Toba, we use a 2013 weighted-average power price of $126.12/MWh. For Bute Inlet, we adjusted the Upper Toba power price by 50% of annual CPI to arrive at a 2017 full-year, weighted-average price of $131.24/MWh, or $141.24/MWh including the ecoENERGY incentive payment. We used the same pricing formula for both of these projects as Plutonic intends to submit them into the same RFP.
P L U T O N I C W I L L H A V E N O G R E E N A T T R I B U T E S A V A I L A B L E F O R S A L E
In the 2006 BC Hydro Call for Power, Plutonic elected to surrender its Toba/Montrose green attributes for a $3/MWh bid credit (i.e., not an
additional $3/MWh of revenue). While Plutonic would like to keep the Emission Reduction Credits earned from future projects, BC Hydro requires bidders to tender all green attributes.
Q U A R T E R L Y R E V E N U E & E A R N I N G S V O L A T I L I T Y W I L L B E S E V E R E D U E T O S E A S O N A L I T Y O F W A T E R F L O W
We expect energy-based revenue from Plutonic’s interest in the Toba/Montrose project to be $27.2 million in 2011 with an additional $3 million of incentive revenue that year. If the Upper Toba project comes online in 2012, then total 2013 energy-based revenue could hit $57.2 million, assuming Plutonic maintains a 50% economic interest in the facility. We forecast an additional $5.3 million in total 2013 incentives.
Due to the seasonality of B.C. water flow, we expect quarterly earnings will be volatile for at least the next five years (Exhibit 6.19).
Plutonic will have no green attributes available for sale.
We forecast 2011 revenue of about $30.2 million.

The Choice of a New Generation August 2008
203
We have not applied any excess free cash on the balance sheet beyond 2020, for now. Post-2020 cash on hand could be used to: (1) prepay outstanding principal balances on its debt; (2) implement (i) a regular dividend; (ii) a share buyback; and/or (iii) a one-time special dividend; (3) invest in other organic growth opportunities; and (4) enter into an acquisition, joint venture, or similar transaction.
K E Y F I N A N C I A L F O R E C A S T A S S U M P T I O N S
Capital costs. We assume an installed capital cost per GWh/y of $0.8 million. This excludes major infrastructure costs such as transmission lines/upgrades. On capital costs, we assume the following: (1) three years prior to commissioning requires a 20% cash outlay; (2) two years prior requires 35%; (3) one year prior requires 30%; and (4) the year a facility is commissioned requires a 15% capital cost cash outlay, using a half-year rule of thumb.
Incentives. In our opinion, the federal government’s ecoENERGY incentive program for renewable power producers will be extended for a further several years. As a result, we expect all of Plutonic’s run-of-river projects to qualify and receive the $10/MWh incentive, subject to a project cap of $80 million and a company cap of $256 million.
Taxes. We forecast that most of Plutonic’s projects will not pay material cash taxes for the first seven to 12 years of operation.
Future financing. Unlike Plutonic’s financing deal with GE, we assume that all future projects are 100% owned and self-financed, with the exception of the company’s 914 MW Bute Inlet project and its 133 MW Upper Toba project.
In the first quarter that a run-of-river facility is commissioned, we use a half-year rule for capacity utilization, as it is impractical to speculate exactly when a facility will come online.
We have adjusted our revenue according to company seasonality guidance, with much heavier weights in Q2 and Q3. We forecast expenses with a significantly flatter structure, in general.
Royalties. For First Nations payments/royalties, we assume 1.75% of gross revenue, the middle of Plutonic’s 1.5% to 2.0% guidance range.
Line losses. We assume a 2.7% transmission line loss rate for all projects in the Green Power Corridor.
Our First Nations payment assumption of 1.75% of gross revenue is higher than others.

Alternative &
Renew
able Energy A
ugust 2008
204 Exhibit 6.20: Plutonic Power Corporation – Income Statement
($000s) Q108 Q208 Q308E Q408E 2008E Q109E Q209E Q309E Q409E 2009E 2010E 2011E 2012E 2013E 2014E 2015E
Generation Revenue $0 $0 $0 $0 $0 $0 $0 $0 $0 $0 $1,619 $27,249 $29,704 $57,183 $57,755 $58,333Incentive Revenue $0 $0 $0 $0 $0 $0 $0 $0 $0 $0 $179 $2,980 $3,154 $5,310 $5,310 $5,310Green Credits $0 $0 $0 $0 $0 $0 $0 $0 $0 $0 $0 $0 $0 $0 $0 $0Total Revenue $0 $0 $0 $0 $0 $0 $0 $0 $0 $0 $1,798 $30,229 $32,858 $62,493 $63,065 $63,643
Operating & Maintenance Costs $0 $0 $0 $0 $0 $0 $0 $0 $0 $0 $253 $4,301 $4,644 $7,973 $8,133 $8,295General & Admin $1,458 $2,013 $2,150 $2,150 $7,771 $2,193 $2,193 $2,193 $2,193 $8,772 $8,947 $9,126 $9,309 $9,495 $9,685 $9,879Depreciation & Amortization $8 $9 $10 $10 $37 $10 $10 $10 $10 $40 $1,690 $6,640 $8,228 $12,991 $12,991 $12,991Interest on LTD $0 $0 $0 $0 $0 $0 $0 $0 $0 $0 $3,168 $12,672 $15,720 $24,865 $24,865 $24,865Interest income ($426) ($300) ($245) ($191) ($1,161) ($149) ($253) ($192) ($135) ($729) ($1,187) ($898) ($640) ($3,794) ($3,947) ($2,464)Stock-based compensation $992 $1,046 $1,000 $1,000 $4,038 $500 $500 $500 $500 $2,000 $1,000 $0 $0 $0 $0 $0Other $728 $918 $500 $500 $2,646 $0 $0 $0 $0 $0 $0 $0 $0 $0 $0 $0Total expenses $2,760 $3,686 $3,415 $3,469 $13,331 $2,554 $2,450 $2,511 $2,568 $10,083 $13,871 $31,842 $37,261 $51,530 $51,727 $53,566
Earnings before tax expense ($2,760) ($3,686) ($3,415) ($3,469) ($13,331) ($2,554) ($2,450) ($2,511) ($2,568) ($10,083) ($12,073) ($1,613) ($4,403) $10,963 $11,338 $10,077Current Income Taxes $0 $0 $0 $0 $0 $0 $0 $0 $0 $0 $0 $0 $0 $0 $0 $0Future Income Taxes $0 $0 $0 $0 $0 $0 $0 $0 $0 $0 ($1,908) ($564) ($1,541) $3,837 $3,968 $3,527Earnings from continuing operations ($2,760) ($3,686) ($3,415) ($3,469) ($13,331) ($2,554) ($2,450) ($2,511) ($2,568) ($10,083) ($10,166) ($1,048) ($2,862) $7,126 $7,370 $6,550Gain (loss) on sale of assets/prospects $0 $0 $0 $0 $0 $0 $0 $0 $0 $0 $0 $0 $0 $0 $0 $0Net Income ($2,760) ($3,686) ($3,415) ($3,469) ($13,331) ($2,554) ($2,450) ($2,511) ($2,568) ($10,083) ($10,166) ($1,048) ($2,862) $7,126 $7,370 $6,550
Basic shares - opening 40,414.0 41,953.2 42,734.6 42,734.6 40,414.0 42,734.6 42,734.6 42,734.6 42,734.6 42,734.6 42,734.6 49,552.8 49,552.8 49,552.8 68,783.6 68,783.6Plus: Issued 1,539.2 781.4 0.0 0.0 2,320.6 0.0 0.0 0.0 0.0 0.0 6,818.2 0.0 0.0 19,230.8 0.0 0.0Less: Buyback 0.0 0.0 0.0 0.0 0.0 0.0 0.0 0.0 0.0 0.0 0.0 0.0 0.0 0.0 0.0 0.0Basic shares - closing 41,953.2 42,734.6 42,734.6 42,734.6 42,734.6 42,734.6 42,734.6 42,734.6 42,734.6 42,734.6 49,552.8 49,552.8 49,552.8 68,783.6 68,783.6 68,783.6Average Shares O/S - Basic (000s) 41,399.3 42,155.9 42,734.6 42,734.6 42,256.1 42,734.6 42,734.6 42,734.6 42,734.6 42,734.6 48,700.5 49,552.8 49,552.8 66,379.7 68,783.6 68,783.6Average Dilution (000s) 1,000.0 6,325.7 6,325.7 6,325.7 4,994.3 6,325.7 6,325.7 6,325.7 6,325.7 6,325.7 6,325.7 6,325.7 6,325.7 6,325.7 6,325.7 6,325.7Average Shares O/S - Diluted (000s) 42,399.3 48,481.7 49,060.4 49,060.4 47,250.4 49,060.4 49,060.4 49,060.4 49,060.4 49,060.4 55,026.3 55,878.5 55,878.5 72,705.5 75,109.3 75,109.3
EPS (Basic) ($0.07) ($0.09) ($0.08) ($0.08) ($0.32) ($0.06) ($0.06) ($0.06) ($0.06) ($0.24) ($0.21) ($0.02) ($0.06) $0.11 $0.11 $0.10EPS (Diluted) ($0.07) ($0.09) ($0.08) ($0.08) ($0.32) ($0.06) ($0.06) ($0.06) ($0.06) ($0.24) ($0.21) ($0.02) ($0.06) $0.10 $0.10 $0.09
Source: Company reports; Scotia Capital estimates.

205
The Choice of a N
ew G
eneration A
ugust 2008
Exhibit 6.21: Plutonic Power Corporation – Balance Sheet
($000s) Q108 Q208 Q308E Q408E 2008E Q109E Q209E Q309E Q409E 2009E 2010E 2011E 2012E 2013E 2014E 2015EAssetsCurrent Assets
Cash & Equivalents $41,787 $48,926 $38,115 $29,783 $29,783 $50,592 $38,397 $27,062 $18,664 $18,664 $50,256 $34,641 $25,445 $228,135 $149,302 $83,174Receivables $487 $1,112 $1,112 $1,112 $1,112 $1,112 $1,112 $1,112 $1,112 $1,112 $1,112 $1,112 $1,112 $1,112 $1,112 $1,112Prepaid Expenses $426 $320 $320 $320 $320 $320 $320 $320 $320 $320 $320 $320 $320 $320 $320 $320Other $0 $0 $0 $0 $0 $0 $0 $0 $0 $0 $0 $0 $0 $0 $0 $0
$42,700 $50,358 $39,547 $31,215 $31,215 $52,024 $39,829 $28,494 $20,096 $20,096 $51,688 $36,073 $26,877 $229,567 $150,734 $84,606
Development Costs $9,457 $14,533 $14,533 $14,533 $14,533 $14,533 $14,533 $14,533 $14,533 $14,533 $14,533 $14,533 $14,533 $14,533 $14,533 $14,533Perf. Deposits & Res. Cash $20,681 $19,205 $19,205 $19,205 $19,205 $19,205 $19,205 $19,205 $19,205 $19,205 $19,205 $19,205 $19,205 $19,205 $19,205 $19,205Future Income Tax Asset $0 $0 $0 $0 $0 $0 $0 $0 $0 $0 $1,908 $2,472 $4,013 $176 $0 $0PP&E $45,262 $73,153 $102,343 $122,733 $122,733 $151,424 $190,916 $227,207 $253,099 $253,099 $386,319 $455,888 $485,765 $752,093 $1,227,909 $1,633,896Intangibles $5,223 $5,198 $5,198 $5,198 $5,198 $5,198 $5,198 $5,198 $5,198 $5,198 $5,198 $5,198 $5,198 $5,198 $5,198 $5,198Investments & Other $4,793 $4,645 $4,645 $4,645 $4,645 $4,645 $4,645 $4,645 $4,645 $4,645 $4,645 $4,645 $4,645 $4,645 $4,645 $4,645Total Assets $128,115 $167,093 $185,472 $197,530 $197,530 $247,031 $274,327 $299,283 $316,777 $316,777 $483,497 $538,016 $560,238 $1,025,418 $1,422,225 $1,762,085
LiabilitiesCurrent Liabilities
Revolver $0 $0 $0 $0 $0 $0 $0 $0 $0 $0 $0 $0 $0 $0 $0 $0Payables & accruals $7,789 $24,855 $24,855 $24,855 $24,855 $24,855 $24,855 $24,855 $24,855 $24,855 $24,855 $24,855 $24,855 $24,855 $24,855 $24,855CP LTD $0 $0 $0 $0 $0 $0 $0 $0 $0 $0 $5,400 $5,400 $5,400 $5,400 $5,400 $5,400Due to related $0 $0 $0 $0 $0 $0 $0 $0 $0 $0 $0 $0 $0 $0 $0 $0
$7,789 $24,855 $24,855 $24,855 $24,855 $24,855 $24,855 $24,855 $24,855 $24,855 $30,255 $30,255 $30,255 $30,255 $30,255 $30,255
Long-Term Debt $18,811 $39,034 $59,828 $74,355 $74,355 $95,910 $125,156 $152,124 $171,685 $171,685 $270,171 $325,738 $350,822 $568,876 $954,522 $1,284,304Holdback Payable $3,745 $6,417 $6,417 $6,417 $6,417 $6,417 $6,417 $6,417 $6,417 $6,417 $6,417 $6,417 $6,417 $6,417 $6,417 $6,417Future Income Tax Liability $0 $0 $0 $0 $0 $0 $0 $0 $0 $0 $0 $0 $0 $0 $3,792 $7,319Swap Contracts $3,603 $4,499 $4,499 $4,499 $4,499 $4,499 $4,499 $4,499 $4,499 $4,499 $4,499 $4,499 $4,499 $4,499 $4,499 $4,499Non controlling interest $17,178 $16,826 $16,826 $16,826 $16,826 $16,826 $16,826 $16,826 $16,826 $16,826 $16,826 $16,826 $16,826 $16,826 $16,826 $16,826Other $15,495 $15,495 $16,495 $17,495 $17,495 $47,995 $48,495 $48,995 $49,495 $49,495 $50,495 $50,495 $50,495 $50,495 $50,495 $50,495Total Liabilities $66,622 $107,125 $128,919 $144,446 $144,446 $196,501 $226,247 $253,715 $273,776 $273,776 $378,662 $434,229 $459,313 $677,367 $1,066,805 $1,400,114
Shareholders' EquityShare capital (&CS) $77,898 $80,060 $80,060 $80,060 $80,060 $80,060 $80,060 $80,060 $80,060 $80,060 $152,060 $152,060 $152,060 $392,060 $392,060 $392,060Retained earnings ($16,405) ($20,091) ($23,507) ($26,976) ($26,976) ($29,530) ($31,980) ($34,491) ($37,059) ($37,059) ($47,225) ($48,273) ($51,135) ($44,009) ($36,639) ($30,089)Total Shareholders Equity $61,493 $59,968 $56,553 $53,084 $53,084 $50,529 $48,079 $45,568 $43,001 $43,001 $104,835 $103,787 $100,925 $348,051 $355,420 $361,970
Total Liabilities & SE $128,115 $167,093 $185,472 $197,530 $197,530 $247,031 $274,327 $299,283 $316,777 $316,777 $483,497 $538,016 $560,238 $1,025,418 $1,422,225 $1,762,085
Source: Company reports; Scotia Capital estimates.

Alternative &
Renew
able Energy A
ugust 2008
206 Exhibit 6.22: Plutonic Power Corporation – Cash Flow Statement
($000s) Q108 Q208 Q308E Q408E 2008E Q109E Q209E Q309E Q409E 2009E 2010E 2011E 2012E 2013E 2014E 2015E
Operating ActivitiesNet (loss) earnings ($2,760) ($3,686) ($3,415) ($3,469) ($13,331) ($2,554) ($2,450) ($2,511) ($2,568) ($10,083) ($10,166) ($1,048) ($2,862) $7,126 $7,370 $6,550Adjustments for:
Depreciation & amortization $8 $9 $10 $10 $37 $10 $10 $10 $10 $40 $1,690 $6,640 $8,228 $12,991 $12,991 $12,991(Gain) loss on sale of assets/prospects $0 $0 $0 $0 $0 $0 $0 $0 $0 $0 $0 $0 $0 $0 $0 $0Stock-based compensation $992 $1,046 $1,000 $1,000 $4,038 $500 $500 $500 $500 $2,000 $1,000 $0 $0 $0 $0 $0Future income tax (recovery) expense $0 $0 $0 $0 $0 $0 $0 $0 $0 $0 ($1,908) ($564) ($1,541) $3,837 $3,968 $3,527Other $870 $1,042 $0 $0 $1,912 $0 $0 $0 $0 $0 $0 $0 $0 $0 $0 $0
Cash flow from operations ($890) ($1,589) ($2,405) ($2,459) ($7,344) ($2,044) ($1,940) ($2,001) ($2,058) ($8,043) ($9,383) $5,027 $3,825 $23,954 $24,328 $23,068Net change in non-cash WC $193 ($50) $0 $0 $143 $0 $0 $0 $0 $0 $0 $0 $0 $0 $0 $0
($697) ($1,639) ($2,405) ($2,459) ($7,202) ($2,044) ($1,940) ($2,001) ($2,058) ($8,043) ($9,383) $5,027 $3,825 $23,954 $24,328 $23,068
Financing ActivitiesNet issue (buyback) of common shares $1,064 $578 $0 $0 $1,642 $0 $0 $0 $0 $0 $72,000 $0 $0 $240,000 $0 $0Other financing ($7,491) $1,690 $0 $0 ($5,801) $30,000 $0 $0 $0 $30,000 $0 $0 $0 $0 $0 $0Long-term debt advances $10,749 $20,223 $20,794 $14,527 $66,293 $21,555 $29,246 $26,967 $19,561 $97,330 $103,886 $60,967 $30,484 $223,455 $391,046 $335,182Long-term debt repayments $0 $0 $0 $0 $0 $0 $0 $0 $0 $0 $0 ($5,400) ($5,400) ($5,400) ($5,400) ($5,400)
$4,323 $22,490 $20,794 $14,527 $62,134 $51,555 $29,246 $26,967 $19,561 $127,330 $175,886 $55,567 $25,084 $458,055 $385,646 $329,782
Investing ActivitiesCapital asset additions/business acquisitions ($3,500) ($11,897) ($29,200) ($20,400) ($64,996) ($28,702) ($39,502) ($36,302) ($25,902) ($130,406) ($134,911) ($76,209) ($38,105) ($279,318) ($488,807) ($418,978)Prospect development costs ($1,794) ($3,917) $0 $0 ($5,711) $0 $0 $0 $0 $0 $0 $0 $0 $0 $0 $0Performance Deposits (Paid) Returned $55 $2,102 $0 $0 $2,157 $0 $0 $0 $0 $0 $0 $0 $0 $0 $0 $0Proceeds on sale of assets/prospects $0 $0 $0 $0 $0 $0 $0 $0 $0 $0 $0 $0 $0 $0 $0 $0
($5,239) ($13,711) ($29,200) ($20,400) ($68,550) ($28,702) ($39,502) ($36,302) ($25,902) ($130,406) ($134,911) ($76,209) ($38,105) ($279,318) ($488,807) ($418,978)
Net change in cash and cash equivalents ($1,613) $7,140 ($10,811) ($8,332) ($13,618) $20,810 ($12,195) ($11,335) ($8,398) ($11,119) $31,592 ($15,614) ($9,196) $202,690 ($78,833) ($66,128)
Cash & Equivalents - Beginning $43,400 $41,787 $48,926 $38,115 $43,400 $29,783 $50,592 $38,397 $27,062 $29,783 $18,664 $50,256 $34,641 $25,445 $228,135 $149,302Cash & Equivalents - End $41,787 $48,926 $38,115 $29,783 $29,783 $50,592 $38,397 $27,062 $18,664 $18,664 $50,256 $34,641 $25,445 $228,135 $149,302 $83,174
Source: Company reports; Scotia Capital estimates.

The Choice of a New Generation August 2008
207
Management & Directors Plutonic’s senior management has a successful history of starting up companies. The company’s management and directors control approximately 16.2% of Plutonic’s outstanding shares on a fully diluted basis (Exhibit 6.23).
Exhibit 6.23: Management & Directors
Shares Options &Name Position Held Warrants Employment HistoryR. Stuart Angus Director 988,749 127,500 Independent business advisor and director of several other publicly listed
companies. Prior thereto, Managing Director, Mergers and Acquisitions, Endeavor Financial Corp. from 2003 to 2005 and law yer w ith Fasken Martineau DuMoulin before 2003.
Grigor E. Cook President of the Toba Montrose General Partnership
131,875 410,000 Mr. Cook has over 30 years of experience in the Canadian engineering and construction industry. Prior to joining Plutonic, he w as President and Senior Operating Officer for Commonw ealth Construction Canada Ltd and w orked in operational positions across Canada w ith Barnett-McQueen.
Peter Flynn Director 60,000 187,500 Mr. Flynn has over 30 years of experience in the Canadian energy and engineering industry and currently holds director positions for the Electricity Balancing Pool for the Province of Alberta. A former founding director of Edmonton Pow er, now EPCOR, Mr. Flynn holds the Poole Chair in Management of Engineers at the University of Alberta w here he is also a professor for the Faculty of Engineering.
William Lindqvist Director 368,500 76,500 Business consultant. Prior thereto, VP Exploration of Barrick Gold Co. from 2001 to 2002 and VP Exploration of Homestake Mining Co. from 1995 to 2001.Mr. Lindqvist is also a director of Gallant Minerals Ltd. and consultant to Uruguay Minerals Exploration Inc.
Donald McInnes Vice-Chairman and CEO 1,672,926 450,000 Mr. McInnes formed Plutonic Pow er in 2003. His background is in funding natural resource development through Canadian capital markets including the founding of Blackstone Ventures and Western Keltic Mines. In the last 18 months these companies have raised over $750 million in debt and equity. From 1996 to 2002, he w as a Director of the Association for Mineral Exploration British Columbia. He has served on a variety of industry boards and committees including the Prospector and Developers Association of British Columbia as w ell as IPPBC.
Bruce Ripley President and COO 350,000 Mr. Ripley has over 25 years of engineering experience in the hydroelectric industry including 16 years w ith BC Hydro w here he w as Vice-President, Engineering, from 2004 through 2006. In this role, he w as responsible for delivery of engineering and construction projects for the generation, transmission, and distribution systems w ith annual value of greater than $400 million.
Walter T. Segsw orth Chairman of the Board, Director 1,044,000 150,000 A self-employed businessman and engineer, Mr. Segsw orth w as formerly the President, COO, and Director of Homestake Mining Co. from 1998 until a merger w ith Barrick in early 2002. Mr. Segsw orth is currently a director at f ive other junior companies, all of w hich are in the mining sector.
Paul Sw eeney EVP, Business Development 467,500 237,500 Mr. Sw eeney most recently served as CFO of Canico Resource Corp. Prior to this, he w as Vice-President and Chief Financial Off icer for Sutton Resource Corp. He has directly been involved in several billion dollars of project f inancing.
Michael Volker Director 318,874 110,500 Michael Volker is a high-tech entrepreneur and investor involved in the development of technology-based businesses. He is Director of Simon Fraser University's Industry Liaison Office, President of the Western Universities Technology Innovation Fund (WUTIF) and manages the Vancouver Technology Angel netw ork. Mr. Volker currently serves on many non-profit boards such as Telus New Ventures BC and the Canadian Listed Companies Association as w ell as several public and private corporate boards. Recently, he w as Chairman of the Vancouver Enterprise Forum and the B.C. Advanced Systems Institute.
Peter Wong CFO 400,000 105,000 From 1989 to 1992, Mr. Wong articled w ith the accounting f irm of Deloitte and Touche in Vancouver and obtained his Chartered Accountant designation in 1992. He has held a number of progressive senior f inancial management positions w ith a number of mineral exploration stage, development stage and producing companies. Most recently, Mr. Wong served as a treasurer of the Huckleberry mine and w as CFO of Rubicon Minerals Corporation.
Other 53,500 255,000
Total 5,505,924 2,459,500
Fully Diluted Shares Outstanding (Aug 14, 2008) 49,060,003
% Insider Ownership (FD) 16.2%
Source: SEDI; Bloomberg; company reports.

Alternative & Renewable Energy August 2008
208
T H I S P A G E L E F T I N T E N T I O N A L L Y B L A N K .

The Choice of a New Generation August 2008
209
Exhibit 7.1: Forecast Global Wind Power Through 2012
0
25,000
50,000
75,000
100,000
125,000
150,000
175,000
200,000
225,000
250,000
2000 2001 2002 2003 2004 2005 2006 2007 2008E 2009E 2010E 2011E 2012E
Glo
bal I
nsta
lled
Win
d C
apac
ity (M
W)
Source: Global Wind Energy Council.
Exhibit 7.2: The Top 10 Global Wind Power Developers
8,164 MW
5,275 MW
3,824 MW
3,097 MW 2,948 MW
1,444 MW 1,218 MW 1,199 MW 1,112 MW 1,100 MW
0
1,000
2,000
3,000
4,000
5,000
6,000
7,000
8,000
9,000
Iberdrola FPL AccionaEnergy
EDP Babcock &Brow n
Endesa EDF InternationalPow er
MidAmerican E.ON
Inst
alle
d W
ind
Pow
er C
apac
ity (M
W)
Source: Company reports.
Wind Power – An Established & Mainstream Power Source O V E R V I E W
Wind power is now an established, mainstream power source in a rapidly growing number of countries, including Canada. In our minds, threats of global climate change and high fossil-fuel based energy prices will continue to promote the rapid expansion of the wind power industry well into the next decade. Wind power economics should eventually improve soon to a point where government incentives are no longer required to assure profitability.
Globally, cumulative installed wind power capacity has surpassed 100,000 MW, growing at an annual rate of 27% since 2000. The Global Wind Energy Council (GWEC) forecasts 240,000 MW of installed capacity by the end of 2012, representing a reduction in the annual growth rate to about 15%, as the industry begins to mature (Exhibit 7.1). GWEC also estimates that 30% of this growth will come from North America, 30% from Europe, and 30% from Asia. Exhibit 7.2 shows the total installed capacity of the top 10 wind power developers.
In 2007, over 20,000 MW of new wind projects were commissioned, with the U.S., China, and Spain leading the way. Canada only installed 310 MW in 2007, but has hundreds of megawatts either under construction or with signed PPAs, and thousands of megawatts in development.
In the U.S., at least 80% of the wind capacity needed to achieve 20% of U.S. power demand (~300 GW) is already in various interconnection queues. Wind power contributed 35% (~5,300 MW) of all new generating capacity in the U.S. in 2007, and was the second largest resource added for the third straight year.
Globally, cumulative installed wind power capacity has surpassed 100,000 MW, growing at an annual rate of 27% since 2000.

Alternative & Renewable Energy August 2008
210
Exhibit 7.3: Wind Turbine Sizes Are Growing
0.71 MW
0.88 MW
1.21 MW
1.42 MW
1.60 MW1.65 MW
0.4
0.6
0.8
1.0
1.2
1.4
1.6
1.8
1998/99 2000/01 2002/03 2004/05 2006 2007
Ave
rage
Tur
bine
Siz
e (M
W)
Source: American Wind Energy Association.
Exhibit 7.4: Wind Project Sizes Are Growing
38 MW
64 MW
42 MW
60 MW72 MW
120 MW
0
20
40
60
80
100
120
140
1998/99 2000/01 2002/03 2004/05 2006 2007
Ave
rage
Pro
ject
Siz
e (M
W)
Source: American Wind Energy Association.
I N V E S T M E N T P O S I T I V E S & N E G A T I V E S
What we like about wind power: (1) the fuel is free, plentiful, renewable, and clean; (2) all the good wind sites aren’t gone, especially in Canada; (3) can behave like a notional call option on natural gas prices, where natural gas sets the marginal cost of power; (4) turbine efficiency is improving; (5) favourable government legislation continues; (6) failure of one wind turbine will typically have a minimal impact on revenue and earnings, as all other wind farm turbines continue to operate; and (7) surplus power and carbon credits can serve as an incremental revenue source.
What we don’t like about wind power: (1) an intermittent power source that cannot be relied upon for base-load generation; (2) it is non-dispatchable, and therefore it cannot be turned on at will to meet increased power demand or to receive above-average power prices; (3) dependent on favourable government legislation that can change at any time; (4) challenging grid integration – wind farms are typically located further away from urban load centres relative to competing power generation technologies, resulting in higher transmission capital costs; (5) turbine supply is currently constrained by various component part bottlenecks; and (6) we see installed capital costs rising over the next two years. Other (non-investment) concerns that society has placed on wind farms are: visual impact, flickering, turbine noise, and the impact on birds/bats.
W I N D P O W E R M A R K E T T R E N D S
Turbine size is growing. The average turbine size installed in 2007, at 1.65 MW, is much more powerful than the average wind turbine installed in 1999 at less than 0.8 MW (Exhibit 7.3). The largest wind turbines being installed today are generally 3 MW, although we have seen plans for turbines in the 5 MW to 7.5 MW range.
Project size is growing. The average wind project 10 years ago used to be under 40 MW. Today a newly installed wind farm in North America averages 120 MW in size (Exhibit 7.4). South of the border, there are at least three gigawatt sized wind projects that have been proposed, one in California and two in Texas. In our opinion, the growth in project size is evidence of the strong interest in wind power investments, will drive investment in transmission, and will reduce operating costs per MWh due to economies of scale.
Turbine efficiency is improving. Each new generation of wind turbines that is added to a manufacturer’s portfolio typically results in a 3% to 5% decline in wind power production costs.
Each new generation of wind turbines that is added to a manufacturer’s portfolio typically results in a 3% to 5% decline in wind power production costs.

The Choice of a New Generation August 2008
211
Exhibit 7.5: EWEA Believes Installed Capital Costs Have Peaked. We Disagree.
$0.0
$1.0
$2.0
$3.0
$4.0
$5.0
$6.020
0120
0220
0320
0420
0520
0620
0720
0820
0920
1020
1120
1220
1320
1420
1520
1620
1720
1820
1920
2020
2120
2220
2320
2420
2520
2620
2720
2820
2920
30
Inst
alle
d C
apita
l Cos
t per
MW
($M
)
TodayOffshore
Onshore
SC Est.
EWEA Est.
SC Est.
EWEA Est.
Source: European Wind Energy Association; Scotia Capital estimates.
Capital costs still rising. Globally, consumption of raw materials and other factors are driving up capital costs for all power generation technologies, including wind turbines. We estimate that the cost of wind turbines account for about 80% of a project’s installed capital cost. The European Wind Energy Association (EWEA) believes that installed capital costs for traditional and offshore wind projects have peaked (Exhibit 7.5). We think this is optimistic, as turbine component bottlenecks still exist.
Supply chain challenges remain… Wind turbine components such as ball bearings and blades are in shortage, as turbine demand continues to increase in Canada and worldwide. Overcoming these bottlenecks is not as easy as just ramping up production of turbine components. Large investment decisions must be made based on a long-term view of the industry’s growth potential. The problem: the growth potential of the industry is heavily dependent on federal and provincial/state legislation being passed, which would provide the financial incentives for wind power developers to continue investing in the sector. This will remain unchanged until: (1) long-term incentives are offered; or (2) wind power project economics become more cost competitive.
…But easing slightly in the U.S. Finding, developing, and building new manufacturing capacity has proven to be a challenge for suppliers, until recently. Despite the U.S. federal government’s inability to extend its Production Tax Credit for a long period of time, explosive U.S. demand for wind turbines has started to lure global turbine manufacturers to set up shop there (Exhibit 7.6).
It’s a suppliers’ market. With global turbine shortages that can result in two-year delivery wait times, suppliers are offering shorter warranty periods, and demanding standard terms of sale, as well as larger down payments. Buyers are beginning to take on more turbine-related risks than in the past.
Transmission constraints limiting growth. Canada’s transmission is not built for distributed generation that includes wind and other renewable power technologies. Jurisdiction for new transmission capacity rests with provincial governments and not in Ottawa, making a national transmission strategy challenging. We like what Texas has done, which is to legislate five Competitive Renewable Energy Zones (CREZs) in order to facilitate a build-out of new transmission that is dedicated to renewable power. If approved, these CREZs could facilitate 23,000 MW of new wind capacity in Texas. In May 2008, BC Hydro announced that it plans to spend more than $1 billion to connect new renewable generation resources, including the interconnection of its first wind power projects.

Alternative & Renewable Energy August 2008
212
Exhibit 7.6: Wind Turbine Manufacturers Are Finally Expanding Their U.S. Operations
Turbines
Blades
Other
Towers
Existing, prior to 2007New in 2007Announced in 2007
Source: National Renewable Energy Laboratory.
Merchant over contracted power. IPPs in the U.S. and to some extent in Canada are beginning to turn to deregulated wholesale power markets rather than accept long-term PPAs. To satisfy lenders that want to minimize their investment risks, developers typically enter into various hedge contracts that protect against price volatility. Why: (1) forward prices can be higher in wholesale markets; (2) the developer can retain the green attributes of its renewable power such as RECs; and (3) it allows the developer greater flexibility with respect to turbine supply. As peak marginal power is typically produced using natural gas-fired power plants, merchant wind power production creates a notional call option on natural gas prices as well as RECs.
Chinese turbine exports picking up speed. Chinese turbine manufacturers have begun to enter the North American market, primarily to take advantage of the supply backlog their European counterparts face. Ming Yang Wind Power Technology currently has 2,000 MW of turbine orders, 50% of which are destined for the U.S. Other China-based companies are following. There are now over 60 wind turbine manufacturers in China making turbines greater than 1.5 MW. Beyond China, we think South Korea will emerge as the next dominant wind turbine exporter.
Cost competitiveness. Wind energy is the most cost competitive source of renewable power that exists (excluding large hydro). While we expect installed capital costs for wind projects to rise in the short term, over the mid- and long term, we think wind power will eventually become cost competitive with base-load power generation sources such as coal, natural gas, and nuclear power.

The Choice of a New Generation August 2008
213
P R O J E C T E C O N O M I C S T O I M P R O V E , I N A C O U P L E O F Y E A R S
The investment economics of a typical wind power project in Canada has certainly been appealing to date: long-term contracts backed by creditworthy counterparties, fixed power prices that are partially hedged against inflation, potential incremental earnings from the sale of emissions reduction credits, and of course, government subsidization programs as well as various tax-treatment benefits. But, after a long period of decline, installed wind power project costs are on the rise, averaging $2 million to $2.25 million per MW in the first half of 2008.
By 2005, installed project costs had dropped more than 70% from the early 1980s. However, over the last several years, rising materials (oil up over 2.5x, steel up almost 2x, copper up 2x) and labour (up ~10%) costs coupled with multiple turbine component shortages have reversed this trend. Project cost changes are a function of wind turbine prices, which typically represent 70% to 80% of an installed project’s cost. We expect further increases of turbine prices and therefore to installed project costs through 2010.
The good news, at least for project operators and their investors, is that operating and maintenance (O&M) costs continue to fall. According to the U.S. Department of Energy, the capacity-weighted average 2000 to 2007 O&M costs for projects built in the 1980s was US$30/MWh, dropping to US$20/MWh for projects built in the 1990s, and to US$9/MWh for projects built in the 2000s. Logically, O&M costs decrease for more recently constructed projects, and increase with project age. Also, smaller projects have higher O&M costs on a per MWh basis due to fewer MWhs to spread over a project’s fixed costs. As a rule of thumb, O&M expenses are fairly low for the first two or three years at 2% to 3% of total investment costs, but increase with turbine age, typically up to 5% to 6% in later years.
Wind power economics are driven primarily by: (1) wind turbine capital costs; (2) electricity production, or average wind speed; (3) expected power prices; (4) government incentives; (5) operation and maintenance costs; (6) the cost of capital; and (7) various auxiliary costs.
M O D E L L I N G & S E N S I T I V I T Y A N A L Y S E S O F A W I N D P R O J E C T
Our financial modelling and analysis of Canadian wind power projects indicates that equity IRRs typically range from 9% to 15%. We modelled numerous scenarios and sensitized for variations in (1) installed capital cost per MW; (2) PPA prices and escalations rates; (3) capital costs and costs of capital; (3) the federal ecoENERGY incentive payment; (4) operating & maintenance costs; (5) capacity factors; (6) tax rates; and (7) carbon credits/offsets/RECs. Our average, generic project yielded a 12.8% equity IRR. To arrive at this, we made the following assumptions:
• 35% capacity factor. Using a capacity factor of 35% may be a little bit generous, but we note that turbines are becoming more efficient each year, capacity factors are rising, and wind resource estimation and site selection has become much more of a science than an art. Turning to our companies under coverage for guidance, the unweighted average capacity factor for all projects that are either operational or have at least two years of wind data is slightly under 35%.
• $2.25 million per MW installed cost. We picked the upper end of the installed capital cost range we have seen over the past year, as costs are rising. We note that this base case does not include any infrastructure costs such as transmission.
• Starting PPA @ $95/MWh + 1.5% p.a. We have seen lower and higher PPA prices, but took a midpoint. As a point of reference, Hydro-Quebec’s two 250 MW wind RFPs that we anticipate will be formally announced shortly, are both priced at starting PPA prices of $95/MWh.

Alternative & Renewable Energy August 2008
214
• Starting O&M @ $14/MWh + 1.5% p.a. Operating and maintenance costs, on a per MWh basis, generally range between $9/MWh and $20/MWh. As wind turbine and project sizes increase, O&M costs per MWh continue to fall.
• Federal ecoENERGY incentive @ $2.50/MWh. In Canada, we have seen qualified projects receive none, some, or all of the $10/MWh federal ecoENERGY incentive payment, as PPA providers may demand the incentive payment to partially offset the higher-than-normal power prices being offered to developers. To be somewhat conservative, we chose to locate our generic wind project in Quebec, where the provincial utility there takes 75% of the incentive, leaving $2.50/MWh for the developer.
• No carbon credits. Similar to the federal government’s ecoENERGY incentive payment, many PPA providers demand that all green attributes be forfeited to the provincial utility. In Quebec, these carbon credits are effectively trapped, as there is no real method to effectively monetize them.
• Debt to equity split 75%/25%. We have seen project debt as a percentage of total capital invested, range between 65% and 85%. We chose the median and the midpoint for our project capital structure, and assume that the debt is non-recourse (project specific). Equity investors in wind projects have historically required an average return of 12%. However, we note that equity returns have fallen recently to the 9%-10% area.
• Other. For wind projects, PPA terms in Canada typically range between 15 and 25 years. We chose 25 years. We also matched the term of debt financing to this 25-year PPA term, and assumed no merchant tail.
In Exhibit 7.7 on the following page, we provide our equity investment IRR sensitivity analyses to changes in the factors listed above.
Equity investors in wind projects have historically required an average return of 12%.

215
The Choice of a N
ew G
eneration A
ugust 2008
Exhibit 7.7: Generic Wind Project IRR Sensitivity Charts
$40
$60
$80
$100
$120
$140
$1.50 $1.75 $2.00 $2.25 $2.50 $2.75 $3.00
Cost per Installed MW ($M)
Levl
ized
Cos
t of P
ower
($
/MW
h)
35% c.f.
40% c.f.
30% c.f.
$40
$60
$80
$100
$120
$140
5% 6% 7% 8% 9% 10% 11% 12% 13% 14% 15%
Capitalization Rate (%)Le
vliz
ed C
ost o
f Pow
er
($/M
Wh)
35% c.f.
40% c.f.
30% c.f.
$40$60$80
$100$120$140$160$180$200$220
40 35 30 25 20 15 10 5
Expected Facility Life (Years)
Levl
ized
Cos
t of P
ower
($
/MW
h)
35% c.f.
40% c.f.
30% c.f.
0%
5%
10%
15%
20%
25%
30%
35%
40%
$3.00 $2.75 $2.50 $2.25 $2.00 $1.75 $1.50
Cost per Installed MW ($M)
IRR
30% c.f.
35% c.f.
40% c.f.
Base Case
5%
8%
11%
14%
17%
20%
$80 $85 $90 $95 $100 $105 $110
Initial Power Price ($/MWh)
IRR
Base Case O&M @
$18/MWh
O&M @ $10/MWh
O&M @ $14/MWh
10%
14%
18%
22%
26%
30%
$0 $5 $10 $15 $20 $25 $30
Carbon Credit ($/MWh)
IRR
ecoEnergy split 50:50 w ith PPA provider.
Base Case project is in Quebec, where 25% of ecoEnergy, or $2.50/MWh is received by the
power developer. No ecoEnergy.
Full ecoEnergy @ $10/MWh for first 10 years of operation to maximum
of $80 million per project.
Source: Scotia Capital estimates.

Alternative & Renewable Energy August 2008
216
Exhibit 7.8: Generic Wind Project IRR Sensitivity Tables
#### $80 $85 $90 $95 $100 $105 $110$22 6.4% 7.8% 9.1% 10.6% 12.1% 13.6% 15.3%$20 6.9% 8.2% 9.6% 11.1% 12.6% 14.2% 15.9%$18 7.3% 8.7% 10.1% 11.6% 13.2% 14.8% 16.5%$16 7.8% 9.2% 10.7% 12.2% 13.8% 15.5% 17.2%$14 8.3% 9.7% 11.2% 12.8% 14.4% 16.1% 17.9%$12 8.8% 10.3% 11.8% 13.3% 15.0% 16.7% 18.6%$10 9.3% 10.8% 12.3% 13.9% 15.6% 17.4% 19.3%
#### $3.00 $2.75 $2.50 $2.25 $2.00 $1.75 $1.5029% 3.2% 4.5% 6.2% 8.2% 10.9% 14.6% 20.2%31% 4.2% 5.7% 7.4% 9.7% 12.7% 16.8% 23.1%33% 5.2% 6.8% 8.7% 11.2% 14.5% 19.2% 26.2%35% 6.3% 8.0% 10.1% 12.8% 16.4% 21.6% 29.3%37% 7.3% 9.2% 11.4% 14.4% 18.4% 24.2% 32.6%39% 8.4% 10.4% 12.8% 16.1% 20.5% 26.8% 36.0%41% 9.5% 11.6% 14.3% 17.9% 22.7% 29.6% 39.4%
#### 8.25% 7.75% 7.25% 6.75% 6.25% 5.75% 5.25%30% 6.3% 7.2% 8.2% 9.3% 10.4% 11.6% 12.9%25% 6.9% 7.9% 8.9% 10.0% 11.2% 12.4% 13.8%20% 7.5% 8.5% 9.6% 10.7% 12.0% 13.3% 14.6%15% 8.1% 9.1% 10.2% 11.4% 12.7% 14.1% 15.5%10% 8.6% 9.7% 10.9% 12.1% 13.4% 14.9% 16.4%5% 9.2% 10.3% 11.5% 12.8% 14.1% 15.6% 17.2%0% 9.7% 10.8% 12.1% 13.4% 14.9% 16.4% 18.0%
#### $0 $5 $10 $15 $20 $25 $30$0.0 12.1% 13.5% 15.0% 16.6% 18.3% 20.1% 22.0%$2.5 12.8% 14.2% 15.8% 17.4% 19.2% 21.0% 22.9%$5.0 13.5% 15.0% 16.6% 18.3% 20.1% 22.0% 23.9%$7.5 14.2% 15.8% 17.4% 19.2% 21.0% 22.9% 25.0%
$10.0 15.0% 16.6% 18.3% 20.1% 22.0% 23.9% 26.0%
Starting O&M Cost ($/MWh)
Capacity Factor (%)
Effective Cash Tax Rate (%)
ecoEnergy ($/MWh)
Carbon price ($/REC or $/ERC or $/MWh)
Starting PPA Price ($/MWh)
Installed Capital Cost ($M/MW)
Cost of Debt (%)
Source: Scotia Capital estimates.

The Choice of a New Generation August 2008
217
Exhibit 7.10: We Could See Up to 15,000 MW of Canadian Wind Capacity by 2015
Province Initiative2015E Wind
Capacity (MW)
July 2008 Installed Capacity
(MW)
July 2008 Capacity Under Development
(MW)
Current Opportunity
(MW)
British Columbia 90% of new capacity from clean renewables 3,940 0 269 3,671
Alberta 900 MW wind capacity cap removed, transmission upgrades could accommodate 3,000 MW 2,000 524 156 1,320
Saskatchewan 5% electricity demand from wind energy by 2015 200 171 25 4
Manitoba 1,000 MW of wind by 2015 1,000 104 0 896
Ontario 10% renewables by 2010, of which 80% likely wind capacity 2,300 501 1,489 309
Quebec 4,000 MW of wind capacity by 2015 4,000 422 2,999 579
New Brunswick 400 MW of wind capacity by 2016 400 0 309 91
Nova Scotia 20% renewables by 2013, of which 80% likely wind capacity 600 59 124 417
Prince Edward Island ~60 MW by 2010, 100% by 2015 410 72 79 258
Newfoundland 150 MW of wind capacity (no timeline) 150 0 51 99
15,000 1,855 5,501 7,644
Source: CanWEA; Company reports; Scotia Capital estimates.
Exhibit 7.9: Installed Wind Capacity Growth in Canada
137 198 236 322 444 684 1,460 1,770 1,8760
500
1,000
1,500
2,000
2,500
2000 2001 2002 2003 2004 2005 2006 2007 2008TD
Inst
alle
d C
apac
ity (M
W)
0%
20%
40%
60%
80%
100%
120%
Annual growth rate
Source: CanWEA; Scotia Capital.
C A N A D A – A R E V I E W A N D O U T L O O K
Installed wind capacity in Canada has grown nearly 3x to 1,876 MW from 2005 to 2008 to date (Exhibit 7.9). We believe that another 300 MW to 400 MW of wind capacity will be commissioned in 2008. By 2015, we could see up to 15,000 MW of wind power operating in Canada.
Contracts have already been signed for an additional 5,500 MW of wind energy projects that are to be constructed between 2009 and 2015. Please refer to Exhibit 7.11 for a list of current wind farms installed in Canada, and to Exhibit 7.12 for a list of advanced stage wind development projects (i.e., signed PPAs or under construction). Overall, wind power in Canada is still relatively small, representing only 1% of Canada’s power supply.
Canadian wind power growth is fuelled by federal and provincial subsidies, as well as renewable targets set by provincial utilities. Many provincial governments have directed their government-owned utilities to purchase renewable wind or other renewable power from IPPs through: (1) competitive requests for proposals; (2) the implementation of renewable portfolio standards; and (3) standard offer contracts that are typically less than 10 MW in size. In Exhibit 7.10, we present our province-by-province wind industry outlook in which we estimate a potential of 7,500+ MW still up for grabs to reach 15,000 MW by 2015.

Alternative & Renewable Energy August 2008
218
Exhibit 7.11: Operating Wind Farms in Canada
Project Name Capacity Commissoned Turbines Project Owner
Aeolus Wind Farm 3.0 2003 1x Vestas V90 Aeolous PEI WindBaie-des-Sables 109.5 2006 73x GE 1.5 MW Cartier EnergyBrookfield 0.6 2005 1x Turbowinds T-600 Renewable Energy Services LimitedCastle River Wind Farm 9.9 2000 15x Vestas V47 660kW TransAlta WindCastle River Wind Farm 29.0 2001 44x Vestas V47 660kW TransAlta WindCastle River Wind Farms 0.6 1997 1x Vestas V44-600 (600 kW) TransAlta WindCentennial Wind Power Facility 149.4 2006 83x Vestas 1.8 MW (90 MW On-line in 2005/12) SaskPower InternationalChin Chute Wind Farm 30.0 2006 20x 1.5 MW GE Suncor / Acciona / EnbridgeCowley Ridge North Wind Farm 19.5 2001 15x Nordex 1,300 kW Canadian Hydro Developers, Inc.Cypress Wind Power Facility 5.9 2001 9x Vestas V47 (660 kW) SaskPower InternationalCypress Wind Power Facility 4.6 2003 7x Vestas V47 660 kW SaskPower InternationalDigby Limited 0.8 2006 1x Enercom E48 800 kW Renewable Energy Services LimitedDunnville Wind Turbine 0.6 2006 1x Fuhrlander 600 kW Rosa Flora LimitedEastern Kings Wind Farm 30.0 2007 10x Vestas V90 3 MW PEI Energy CorporationErie Shores Wind Farm 99.0 2006 66x GE 1.5 MW Clean Power Income FundEx Place Turbine 0.8 2003 1 Lagerway 750 kWEx Place Turbine 0.8 2003 1 Lagerway 750 kW Toronto Hydro/WindshareFerndale Wind Farm 5.1 2002 1x Vestas 1.8 MW, 2x Vestas 1.65 MW Sky GenerationFitzpatrick Mountain 0.8 2006 1x Enercom E48 800 kW Renewable Energy Services LimitedFitzpatrick Mountain 0.8 2006 1x Enercon E48 800 kW Renewable Energy Services LimitedGlace Bay & Donkin 1.6 2005 2x Enercon 800 kW Cape Breton PowerGoodwood 0.6 2005 1x Turbowinds 600 kW Renewable Energy Services LimitedGrand Etang 0.7 2002 1x Vestas V47-660 (660 kW) Nova Scotia PowerHaeckel Hill 1 0.2 1993 1x bonus 150 kW Yukon Energy CorporationHaeckel Hill 1 0.7 2000 1x Vestas V47 660 kW Yukon Energy CorporationHiggins Mountain Riverhurst 3.6 2006 3x Vensys 1.2 MW Vector Wind Energy/Spring HillHuron Wind 9.0 2002 5x Vestas 1.8 MW Huron WindKettles Hill Phase I 9.0 2006 5x Vestas 1.8 MW Kettles Hill Wind Energy CompanyKettles Hill Phase II 54.0 2007 30x Vestas V80 1.8 MW Kettles Hill Wind Energy Inc.Kingsbridge 1 Wind Power Project 39.6 2006 22x Vestas 1.8 MW EPCORLe Nordais (Phase 1 - Cap Chat) 57.0 1999 76x NEG-Micon NM750/48 (750 kW) AxorLe Nordais (Phase 2 - Matane) 42.8 1999 57x NEG-Micon NM750/48 (750 kW) AxorLingan 10.0 2007 5x Enercon 2 MW Cape Breton PowerLingan 0.6 2002 2x Enercon 2 MW Nova Scotia PowerLittle Brook 0.6 2002 1x Turbowinds T600 Nova Scotia PowerLundbreck 0.6 2001 1x Enercon E40 600kW Lundbreck Developments Joint Venture AMagrath 30.0 2004 20x 1.5 MW GE Wind Suncor, Enbridge, EHNMarshville Limited 0.8 2006 1x Enercom E49 800 kW Renewable Energy ServicesMatane 2.3 1998 3x NEG-Micon 750/44 (750 kW) Hydro-QuébecMcBride Lake 75.2 2003 114x Vestas 660 kW ENMAX, TransAlta WindMcBride Lake East 0.7 2001 1x Vestas V47 660 kW TransAlta WindMelanchton 1 Wind Plant 67.5 2006 45x 1.5 MW GE Canadian Hydro Developers, Inc.Mont Miller Project 54.0 2005 30x Vestas V80 1.8 MW Northland Power Income FundMount Copper Project 9.0 2004 5x V80 1.8 MW 3Ci and Creststreet Asset Management LtdMount Copper Project (Phase 2) 45.0 2005 25x Vestas V80 1.8 MW 3Ci and Creststreet Asset Management LtdNorth Cape Wind Farm 5.3 2004 8x Vestas V47-660 (660 kW) Prince Edward Island Energy CorporationNorth Cape Wind Farm 5.3 2001 8x Vestas V47-660 (660 kW) Prince Edward Island Energy CorporationNorway Wind Park 9.0 2007 3 X Vestas V90 3 MW Ventus EnergyOld Man River Project 3.6 2007 2x Vestas V80 1.8 MW Alberta Wind Energy Corp.Parc éolien du Renard 2.3 2003 3x Jeumont 750 kW J48c Groupement éolien QuébecoisPickering Turbine 1.8 2001 1x Vestas V80 1,800 kW Ontario Power GenerationPoint Tupper 0.8 2006 1x Enercon E48 800 kW Renewable Energy Services LimitedPort Albert Wind Turbine 0.7 2001 1x Vestas V47 (660 kW) PrivatePrince Wind farm 189.0 2006 126x GE 1.5 MW Brookfield PowerPubnico Point - Phase 1 3.6 2004 2x Vestas 1.8 MW Atlantic Wind PowerPubnico Point - Phase 2 27.0 2005 15x Vestas 1.8 MW Atlantic Wind PowerRamea 0.4 2004 6x 65 kW Windmatic WM15S Frontier Power Systems Inc.Ravenswood Wind Farm 9.9 2008 6x Vestas 1.65 Mw Sky GenerationSinnott Wind Farm 6.5 2001 5x Nordex 1,300 kW Canadian Hydro Developers, Inc.Soderglen Wind Farm 70.5 2006 47x GE 1.5 MW Nexen / GW PowerSpring Bay Wind farm 1.6 2007 2x Enercon E48 800 KW Schneider PowerSpringhill Project 1.2 2005 1x Vensys 1.2 MW Vector Wind EnergySpringhill Riverhurst 0.9 2006 1x Americas Wind Energy Vector Wind Energy/SpringhillSt. Leon Project 19.8 2005 12x Vestas NM 82 1.65 MW Airsource Power Fund 1 LPSt. Leon Project - Phase 2 84.2 2006 51x Vestas NM 82 1.65 MW Airsource Power Fund 1 LPSummerview Wind Farm 1.8 2002 1x 1.8MW TransAlta WindSummerview Wind Farm 68.4 2004 38x Vestas 1.8 MW TransAlta WindSunbridge 11.2 2001 17x Vestas V47-660 (660 kW) Suncor & EnbridgeTaber Wind Farm 81.4 2007 37x Enercon E70 2.2 MW ENMAXTallon Energy Project 0.8 2004 1x Lagerway 750 kW Tallon EnergyTaylor Project 3.4 2004 9x Kenetech 375 kW Canadian Hydro Developers, Inc.Tiverton Riverhurst 0.9 2006 1x Americas Wind Energy Vector Wind Energy/SpringhillTiverton Wind Turbine 0.6 1995 1x Tacke TW-600 Ontario Power GenerationVestas Prototype 3.0 2004 1x Vestas V90 3 MW TransAlta Wind and VestasWaterton Wind Turbines 3.8 1998 6x Vestas 600kW TransAlta WindWeather Dancer 1 0.9 2001 1x NEG-Micon 900 kW Epcor/Peigan Nation ReserveWest Cape Wind Farm 19.8 2007 11x Vestas V80 1.8 MW West Cape Wind Energy Inc.
Source: CanWEA.
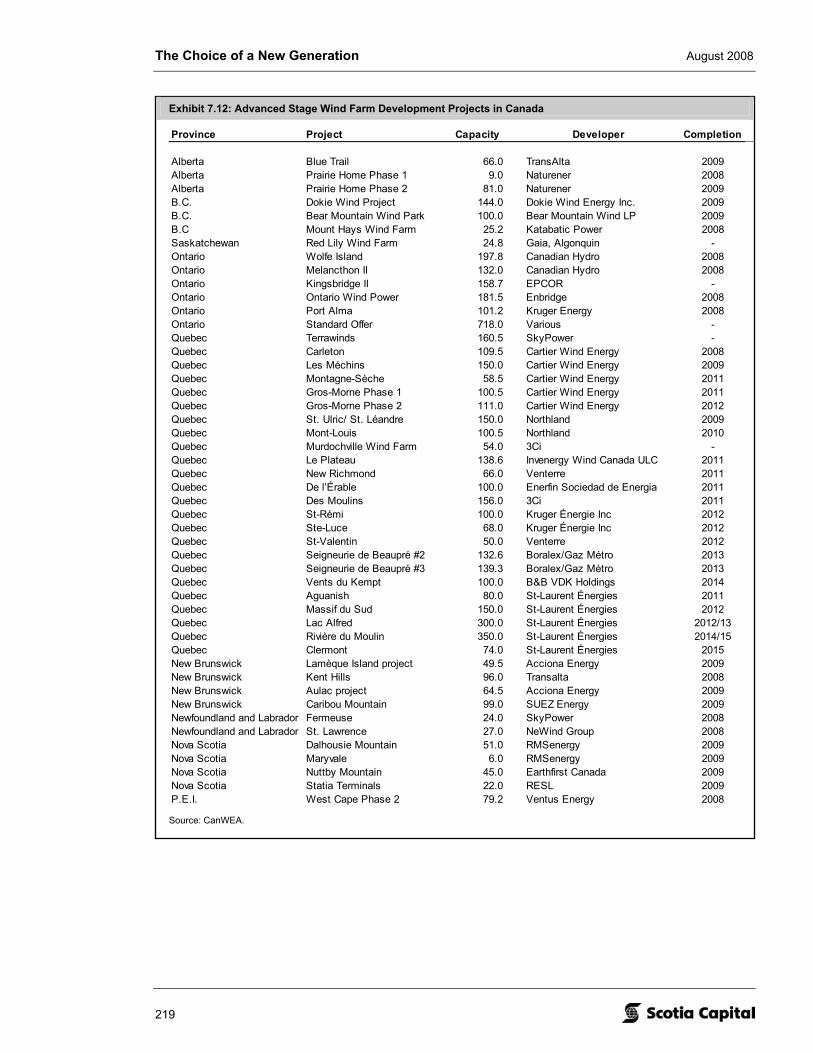
The Choice of a New Generation August 2008
219
Exhibit 7.12: Advanced Stage Wind Farm Development Projects in Canada
Province Project Capacity Developer Completion
Alberta Blue Trail 66.0 TransAlta 2009Alberta Prairie Home Phase 1 9.0 Naturener 2008Alberta Prairie Home Phase 2 81.0 Naturener 2009B.C. Dokie Wind Project 144.0 Dokie Wind Energy Inc. 2009B.C. Bear Mountain Wind Park 100.0 Bear Mountain Wind LP 2009B.C Mount Hays Wind Farm 25.2 Katabatic Power 2008Saskatchewan Red Lily Wind Farm 24.8 Gaia, Algonquin -Ontario Wolfe Island 197.8 Canadian Hydro 2008Ontario Melancthon II 132.0 Canadian Hydro 2008Ontario Kingsbridge II 158.7 EPCOR -Ontario Ontario Wind Power 181.5 Enbridge 2008Ontario Port Alma 101.2 Kruger Energy 2008Ontario Standard Offer 718.0 Various -Quebec Terrawinds 160.5 SkyPower -Quebec Carleton 109.5 Cartier Wind Energy 2008Quebec Les Méchins 150.0 Cartier Wind Energy 2009Quebec Montagne-Sèche 58.5 Cartier Wind Energy 2011Quebec Gros-Morne Phase 1 100.5 Cartier Wind Energy 2011Quebec Gros-Morne Phase 2 111.0 Cartier Wind Energy 2012Quebec St. Ulric/ St. Léandre 150.0 Northland 2009Quebec Mont-Louis 100.5 Northland 2010Quebec Murdochville Wind Farm 54.0 3Ci -Quebec Le Plateau 138.6 Invenergy Wind Canada ULC 2011Quebec New Richmond 66.0 Venterre 2011Quebec De l’Érable 100.0 Enerfin Sociedad de Energia 2011Quebec Des Moulins 156.0 3Ci 2011Quebec St-Rémi 100.0 Kruger Énergie Inc 2012Quebec Ste-Luce 68.0 Kruger Énergie Inc 2012Quebec St-Valentin 50.0 Venterre 2012Quebec Seigneurie de Beaupré #2 132.6 Boralex/Gaz Métro 2013Quebec Seigneurie de Beaupré #3 139.3 Boralex/Gaz Métro 2013Quebec Vents du Kempt 100.0 B&B VDK Holdings 2014Quebec Aguanish 80.0 St-Laurent Énergies 2011Quebec Massif du Sud 150.0 St-Laurent Énergies 2012Quebec Lac Alfred 300.0 St-Laurent Énergies 2012/13 Quebec Rivière du Moulin 350.0 St-Laurent Énergies 2014/15 Quebec Clermont 74.0 St-Laurent Énergies 2015New Brunswick Lamèque Island project 49.5 Acciona Energy 2009New Brunswick Kent Hills 96.0 Transalta 2008New Brunswick Aulac project 64.5 Acciona Energy 2009New Brunswick Caribou Mountain 99.0 SUEZ Energy 2009Newfoundland and Labrador Fermeuse 24.0 SkyPower 2008Newfoundland and Labrador St. Lawrence 27.0 NeWind Group 2008Nova Scotia Dalhousie Mountain 51.0 RMSenergy 2009Nova Scotia Maryvale 6.0 RMSenergy 2009Nova Scotia Nuttby Mountain 45.0 Earthfirst Canada 2009Nova Scotia Statia Terminals 22.0 RESL 2009P.E.I. West Cape Phase 2 79.2 Ventus Energy 2008
Source: CanWEA.

Alternative & Renewable Energy August 2008
220
Exhibit 7.13: Annual Wind Power Capacity Additions by Province (2000-2015)
Source: Emerging Energy Research.
C A T A L Y S T S F O R T H E C A N A D I A N W I N D P O W E R M A R K E T
Positive A downturn in the U.S. market will likely lead to increased activity in Canada, as well as increased turbine availability. The most likely event that would cause a downturn in the U.S. wind power market is a non-renewal of the U.S. Production Tax Credit by the U.S. federal government.
Positive Federal legislation on mandatory carbon emissions reductions will give the Canadian wind power market a positive boost. Whether a carbon tax, a cap-and-trade program, or something else, more renewable power will be required, and wind power will likely continue to lead the pack.
Positive Growth of turbine suppliers establishing manufacturing facilities in the U.S. (or Canada).
Negative Caps or ceilings on future wind power development. Alberta recently eliminated its 900 MW cap on wind energy capacity in the province (a positive), and it is now designing transmission upgrades that could connect up to 3,000 MW of wind capacity in the southern part of the province. Caps will likely be implemented when provincial utilities cannot provide or build transmission to support further wind power development.
Negative Better project economics from competing renewable technologies such as solar power will likely reduce activity in Canadian wind power development.

The Choice of a New Generation August 2008
221
Exhibit 7.14: The EU Has Installed 57 GW of Wind Power, 48 GW Since 2000
76,641
48,856
2,299 1,655 1,795
-5,871-11,027
-14,385-25,000
0
25,000
50,000
75,000
100,000
NaturalGas
Wind Coal Fuel Oil LargeHydro
Biomass Nuclear Other
Net
incr
ease
/dec
reas
e in
pow
er c
apac
ity E
U 2
000-
2007
(MW
)
Source: European Wind Energy Association
Exhibit 7.15: Wind Power Is Reducing EU’s Emissions
0.0%
0.0%
0.0%
0.0%
0.0%
0.1%
0.1%
0.1%
0.1%
0.1%
0.2%
0.3%
0.3%
0.3%
0.4%
0.7%
0.8%
0.8%
1.4%
1.5%
2.0%
2.1%
2.1%
2.5%
3.1%
6.2%
8.5%
Slovakia
Romania
Slovenia
Malta
Cyprus
Lithuania
Czech Republic
Hungary
Bulgaria
Poland
Latvia
Belgium
Finland
Estonia
Luxembourg
UK
Italy
France
Netherlands
Greece
Sw eden
EU-15
Austria
Germany
Ireland
Portugal
Denmark
Source: European Wind Energy Association.
T H E E U R O P E A N U N I O N I S F A R M O R E A D V A N C E D I N W I N D P O W E R D E V E L O P M E N T T H A N N O R T H A M E R I C A
Europe continues to lead the market in wind power, although the U.S. and China are catching up quickly. Between 2000 and 2007, total EU power capacity increased by 200 GW to 775 GW. The most notable change in the mix of capacity is the near doubling of natural gas capacity to 164 GW. Wind energy more than quadrupled from 9 GW to 57 GW (Exhibit 7.14).
Wind power is working to reduce GHG emissions in Europe. By 2007, Spain, Denmark, and Portugal had all reduced their CO2e emissions by more than 5% below 1990 levels due solely to the installation of wind power capacity. Overall, Europe’s 2007 emissions were 2.1% below the 1990 level from wind energy (Exhibit 7.15).
Exhibit 7.16, on the following page, shows a map of Europe’s installed wind capacity. Perhaps more interesting is Exhibit 7.17, which shows the impact that wind power investments will have on avoided fuel costs @ US$120/bbl oil and avoided carbon costs @ €40/tonne CO2e.

Alternative & Renewable Energy August 2008
222
Exhibit 7.16: Map of Europe’s Installed Wind Power Capacity
2nd most installed w ind capacity in EU Boralex may
enter Italy
Boralex has 100+ MW in
France
Germany is #1 in installed w ind capacity
Expect a lot of offshore
growth here
Wind power accounts for 20%+ of
consumption
Source: European Wind Energy Association; Scotia Capital.
Exhibit 7.17: Forecast EU Wind Investments Compared with Lifetime Avoided Fuel and CO2e Costs
0
10,000
20,000
30,000
40,000
50,000
60,000
70,000
80,000
2008
2009
2010
2011
2012
2013
2014
2015
2016
2017
2018
2019
2020
2021
2022
2023
2024
2025
2026
2027
2028
2029
2030
€ M
illio
ns
Lifetime CO2 cost avoided (€40/MtCO2e)
Lifetime fuel cost avoided (Oil @ US$120/bbl)
Annual wind investments
Lifetime CO2 cost avoided (€40/tonne CO2e)
Source: European Wind Energy Association; Scotia Capital.

The Choice of a New Generation August 2008
223
Exhibit 7.18: The 500+ MW M&A Club
Acquiror Target Date
E.ON Airtricity North America Oct-07Wind Energy America Boreal Oct-07Babcock & Brown Bluewater Wind Sep-07Acciona EcoEnergy Jun-07Duke Energy Tierra Energy May-07Iberdrola CPV Wind Apr-07Energias de Portugal Horizon Mar-07Naturener Great Plains Wind & Energy Feb-07Iberdrola PPM (Scottish Power) Dec-06BP Orion Energy Dec-06Iberdrola Midwest Renewable Energy Corp. Oct-06BP Greenlight Aug-06Babcock & Brown Superior Aug-06CPV Wind Disgen Jul-06NRG Padoma Jun-06Iberdrola Community Energy Inc. Apr-06Babcock & Brown G3 Energy Jan-06Airtricity Renewable Generation Inc. Dec-05Diamond Castle Catamount Oct-05Goldman Sachs Zilkha (Power) Mar-05AES SeaWest Jan-05
Source: Berkeley Lab.
W I N D M & A A C T I V I T Y A N D C A P I T A L M A R K E T S T R E N D S
The global credit crunch has caused lenders and equity investors to become more cautious about their investments. Finance costs are increasing for wind power projects, reducing equity returns, and potentially lowering developer appeal.
Consolidation Continues
2007 was another strong year for wind developer corporate transactions, with eight announced acquisitions for target companies that had 500 MW or more of wind capacity in development (Exhibit 7.18).
Europeans Entering North American Markets
One emerging trend over the past two years is the increase of large European energy companies entering the North American wind market, typically through acquisitions, rather than greenfield development. Increased globalization of the wind sector, as well as the very early stages of a maturing European wind power market, are the reasons why.
European wind power development companies are attracted to the Canadian market due to its provincial RFPs and/or standard offer contracts, as well as the potential upside in future federal, regional, or provincial carbon markets. But, as in all industries, foreign companies lack the people on the ground as well as the cultural experience to effectively compete against greenfield developers.
Equity Returns Falling
Equity returns in large portfolio deals where there is risk diversification among turbine types and region have dropped to below 7% in the U.S. For most American projects, however, equity returns typically range between 7% to 8%, but can go as high as 10%. The impact of low returns: large equity players unhappy with a poor risk/reward profile are now turning to solar and geothermal projects.
Junior Banks More Aggressive
According to Garrad Hassan Canada Inc., equity investors are more interested in P50 or P75 wind resource estimates, while experienced lenders continue to demand more conservative estimates of P90, P95, or even P99. Junior banks typically seek out new business more aggressively, and tend to offer better rates to developers than large financial institutions that have experienced wind power development financing problems.
Equity players unhappy with a poor risk/reward profile in wind power are now turning to solar and geothermal projects.

Alternative & Renewable Energy August 2008
224
Exhibit 7.19: Breakdown of the Wind Power Transactions Studied
Assets59%
Corporate41%
Operating Assets only (41%)
Operating and Development
(5%)
Development Pipeline only (13%)
Source: Scotia Capital.
The Debt to Equity Switch
Historically, we have seen wind farm project financing occur at a capital structure of two-thirds debt and one-third equity. In 2006 and 2007, this financing structure reversed to two-thirds equity and one-third debt, although we don’t expect this to continue. On the debt side, about 99% consisted of senior debt, while on the equity side, we have seen 90% of equity requirements funded from the balance sheet, 4% from CRCE flow through shares, 3% from IPO proceeds, and 2% from private equity. We see an increased interest by private equity players in the wind power development space.
Wind Power Transactions Suggest $0.82 Million Paid per Operating GWh/y
We analyzed 90+ global wind power transactions since 2005 that led us to an average transaction price paid per operating MW of $2.16 million, and per operating GWh/y of $0.82 million. Accordingly, our net asset value calculations for operating wind farms assign a value of $0.82 million per GWh/y. The breakdown of the types of deals we looked at is shown in Exhibit 7.19.
On average, development capacity for wind projects traded for slightly above $0.4 million per MW, but by no means should this be used as a rule-of-thumb. Depending on the progress of a project, these transaction prices ranged between ~$0 (almost free) and ~$2 million (almost operational) per MW.
Exhibit 7.20 lists the transactions we looked at.

The Choice of a New Generation August 2008
225
Exhibit 7.20: Select Wind Power Transactions Since 2005
Date Acquirer TargetTransaction
TypeTarget
LocationOperating Capacity
Estimated Production
Development Pipeline
Transaction Price
Transaction Price
Adjusted Transaction
Price
Adjusted Operating
Price
Adjusted Operating
Price(MW) (GWh/y) (MW) (Local $M) (C$M) (C$M) (C$M/MW) (C$M/GWh/y)
Jul, 08 E.ON/Dong London Array Assets Europe - - 330 - - - - -Jul, 08 GreenHunter Energy Wheatland Wind Project Assets United States - - 390 - - - - -Jul, 08 Boralex Gengrow th III Assets Canada - - 100 - - - - -
Jun, 08 Duke Energy Catamount Energy Corporate United States 300 788 1,750 320 324 - - -Jun, 08 Multiple Acquirers Allco Finance Assets United States - - - 325 331 331 - -Apr, 08 Energias de Portugal Wind Farms in France Assets France 35 83 560 95 150 - - -Apr, 08 NTR Wind Capital Group Assets United States - - - 150 152 152 - -Apr, 08 FPL Energy Mount Copper and Pubnico Point Corporate Canada 85 269 - 122 122 122 1.43 0.45Mar, 08 Ventus Energy West Cape Wind Energy Corporate Canada - - - 21 21 - - -Mar, 08 Enmax Energy Corporation Kettles Hill Corporate Canada 63 166 77 163 163 131 2.07 0.79Feb, 08 Wind Energy America Boreal Corporate United States - - 1,200 - - - - -Feb, 08 Gaz de France Nass & Wind Corporate Europe 34 89 150 - - - - -Feb, 08 Scottish & Southern Energy Airtricity Corporate Europe 310 815 2,000 1,455 2,155 1,307 4.22 1.60Feb, 08 Iberdrola Rights to 1,600 MW in Romania Assets Europe - - 1,600 363 364 - - -Jan, 08 Acciona Corporación Eólica CESA Corporate Europe 37 97 9 114 114 110 3.00 1.14Dec, 07 GE Energy Four Wind Farms in US Assets United States - - 600 600 599 346 - -Dec, 07 Babcock & Brow n Wind Farms From Gamesa Assets Spain - - 150 - - - - -Dec, 07 Electrabel 1 Wind Farm in Portugal Assets Portugal 38 77 - 50 71 71 1.88 0.93Dec, 07 Sorgenia La Française d'Eoliennes Assets Europe 115 302 - 496 497 497 4.32 1.64Dec, 07 Nuevas Energías del Occidente Relax Wind Parks Assets Europe - - 1,022 54 78 - - -Dec, 07 Gaz de France Eoliennes Corporate Europe 38 99 - - - - - -Dec, 07 Canadian Hydro Developers 99 MW Le Nordais Wind Plant Assets Canada 99 165 - 121 121 121 1.20 0.70Dec, 07 Martifer Renew ables Tw o Wind Farms In Germany Assets Europe 53 140 - 132 134 134 2.52 0.96Dec, 07 Babcock & Brow n Three Wind Farms in US Assets United States 315 937 - 309 313 313 - 0.33Dec, 07 Innergex Pow er Income Fund Tw o Wind Farms in Quebec Assets Canada 80 210 - 154 154 154 1.93 0.73Dec, 07 Iberdrola Tw o Wind Parks in Almeria Assets Europe 50 131 - 66 97 97 1.95 0.74Nov, 07 Electrabel Wind Farms in Mourisca and Fafe II Assets Europe 64 168 - 137 133 133 2.07 0.79Nov, 07 Electrabel La Compagnie du Vent S.A. Corporate Europe - - - 468 449 449 - -Oct, 07 EnerTAD Five Wind Farms Assets France 55 126 - 82 112 112 2.03 0.89Oct, 07 E.ON Airtricity, Inc., North American Operations Corporate United States 650 1,708 5,000 1,400 1,320 - - -Oct, 07 Iberdrola Four Hungarian Wind Farms Assets Europe - - 108 155 213 168 - -Oct, 07 Iberdrola Eólicas de Euskadi Corporate Europe - - - 164 161 161 - -Oct, 07 Gaz de France Ereliagroupe Corporate France 70 184 300 - - - - -Sep, 07 SUEZ Energy North America Ventus Energy Corporate United States 29 76 379 119 119 - - -Sep, 07 Babcock & Brow n Bluew ater Wind Corporate United States - - 450 - - - - -Sep, 07 Vardar Eurus Tooma Tuulepark Corporate Europe 24 63 - 35 49 49 2.06 0.78Sep, 07 Babcock & Brow n Enersis Wind Farms (50% Interest) Assets Portugal 262 648 69 487 694 665 2.53 1.03Sep, 07 M&G Investment Management Zephyr Investments Corporate Europe 129 339 - 289 301 301 2.33 0.89Aug, 07 International Pow er Wind Farms in Italy and Germany Assets Europe 581 1,527 - 1,196 1,263 1,263 2.17 0.83Aug, 07 Renew able Energy Holdings Wind Farm Assets Germany 8 21 - 11 15 15 1.89 0.72Aug, 07 Iberdrola Three Wind Farms in Germany Assets Europe - - - 30 43 43 - -Aug, 07 Finavera Renew ables Wind Farm Assets Germany 20 39 - - - - - -Aug, 07 E.ON ENERGI E2 Renovables Ibéricas Corporate Europe 260 683 560 994 1,048 1,048 3.12 1.19Aug, 07 Babcock & Brow n The Valdeconejonos Wind Farm Assets Spain 32 85 - 51 74 74 2.30 0.87
Jul, 07 Boralex Gengrow th II Assets Canada - - 90 - - - - -Jul, 07 TransAlta Fairf ield Hill Prospect Corporate Canada 21 55 - - - - - -Jul, 07 Babcock & Brow n Conjuro Wind Farm (70% Interest) Assets Spain 12 22 - 30 27 27 2.30 1.25Jul, 07 Energias de Portugal Horizon Wind Energy Corporate Canada 559 1,469 9,000 2,700 2,866 - - -Jul, 07 Theolia 165 Megaw att Wind Farms Assets Europe 165 434 - 132 140 140 - -
Jun, 07 Acciona Wind Assets in Illinois Corporate United States - - 1,300 1,300 1,852 1,303 - -Jun, 07 Babcock & Brow n Tw o Wind Farms in Spain Assets Spain 64 185 - 180 163 163 2.55 0.88Jun, 07 Electrabel 1 Wind Farm in Portugal Assets Portugal 32 107 - 55 78 78 2.45 0.74May, 07 AES Tw o Wind Farms Assets United States 186 489 - - - - - -May, 07 Duke Energy Tierra Energy Wind Business Corporate United States - - 1,000 - - - - -Apr, 07 Iberdrola CPV Wind Corporate United States - - 3,500 55 84 - - -Apr, 07 Finavera Renew ables 3 Hills Wind Pow er Project Assets Canada - - 225 3 3 - - -Mar, 07 Babcock & Brow n Wattle Point Wind Farm Assets United States 91 312 - 225 260 260 2.85 0.83Mar, 07 Allco Finance German Wind Assets Assets Europe 112 294 - 200 235 235 2.10 0.80Mar, 07 Canadian Hydro Developers GW Pow er Corporation Corporate Canada 35 145 - 87 87 73 2.06 0.60Feb, 07 Naturener Great Plains Wind & Energy Corporate United States - - 300 - - - - -Feb, 07 Endesa Seven Wind Farms in Italy Assets Europe 240 631 - 401 466 466 1.94 0.74Feb, 07 GE Energy Wind Farm Assets United States 287 754 - 212 247 247 - -Jan, 07 Babcock & Brow n Six Wind Farms Assets United States 410 1,167 - 387 454 454 - -Jan, 07 Babcock & Brow n Kaarst Wind Farm Assets Germany 12 23 - 30 28 28 2.30 1.19Dec, 06 Theolia Natenco Corporate Europe 25 66 810 133 154 - - -Dec, 06 Shear Wind Vindt Resources Corporate Canada - - 100 1 1 - - -Dec, 06 BP Alternative Energy Orion Energy Corporate United States - - 6,000 - - - - -Dec, 06 Novas Energías do Ocidente Agrupación Eólica Corporate France/Spain 155 475 1,044 348 531 91 0.59 0.19Nov, 06 Babcock & Brow n Four U.S. Wind Farms Assets United States 232 610 - 345 394 394 1.70 0.65Nov, 06 International Pow er Levanto Onshore Wind Farm Portfolio Assets Europe 436 1,146 - 721 817 817 1.87 0.71Oct, 06 Iberdrola Midw est Renew able Energy Corporate United States - - 400 30 43 - - -Oct, 06 Iberdrola Wind Farms from Gamesa Assets Europe - - 1,000 1,000 1,122 700 - -Sep, 06 Enbridge Income Fund Wind Farm Assets Canada 25 66 - 42 42 42 1.66 0.63Sep, 06 Iberdrola Wind Farms in UK Assets Europe 21 54 - - - - - -Aug, 06 Babcock & Brow n Superior Renew able Energy Corporate United States 125 329 500 - - - - -Aug, 06 BP Alternative Energy Greenlight Energy Corporate United States - - 6,500 98 110 - - -
Jul, 06 Babcock & Brow n Tw o Wind Farms (Class B Ow nership) Assets United States 118 427 - 72 81 81 - -Jul, 06 NRG Energy Padoma Wind Pow er Corporate United States - - 1,000 - - - - -Jul, 06 CPV Wind Distributed Generation's Wind Portfolio Assets United States - - 1,000 - - - - -Jul, 06 Iberdrola Perfect Wind Corporate Europe - - 600 52 74 - - -Jul, 06 Babcock & Brow n Crescent Ridge (Class B Ow nership) Assets United States 54 172 - 50 56 56 - -
May, 06 Iberdrola Community Energy Corporate United States - - 200 30 33 - - -May, 06 Iberdrola Community Energy Corporate United States - - - 30 33 - - -Mar, 06 Babcock & Brow n Three Wind Farms in France Assets Europe 22 50 - 30 42 42 1.92 0.85Feb, 06 Babcock & Brow n Eifel Wind Farm Assets Europe 23 46 13 9 13 7 - -Jan, 06 Babcock & Brow n G3 Energy Corporate United States - - 500 - - - - -Jan, 06 Acciona Corporación Eólica CESA Corporate Europe 499 1,312 129 1,658 1,908 1,853 3.71 1.41Jan, 06 Iberdrola Naturener Eolica Corporate Europe - - 280 26 37 - - -Dec, 05 Airtricity Renew able Generation Corporate United States - - 1,000 - - - - -Dec, 05 Boralex La Citadelle Assets France 12 28 - 21 21 21 1.75 0.75Dec, 05 Babcock & Brow n Wind Farms in Texas, Oklahoma and Oregon Assets United States 98 257 - - - - - -Nov, 05 Electrabel Fafe Wind farm Assets Europe 80 210 - 123 146 146 1.82 0.69Oct, 05 Iberdrola Wind Farms in Spain and Italy Assets Europe 700 1,840 - 900 1,279 1,279 1.83 0.70Sep, 05 Energias de Portugal Five Wind Farms in Portugal Assets Portugal 48 127 72 72 84 84 1.12 0.42Aug, 05 Endesa FINERGE - Gestão de Projectos Energéticos, S.A. Corporate Europe 60 158 260 214 259 149 2.49 0.95
Jul, 05 Iberdrola Wind Farms in Greece Assets Europe 56 147 - 78 115 115 2.06 0.78Jul, 05 Iberdrola Wind Farms in Germany and France Assets Europe - - 201 - - - - -
Mar, 05 Goldman Sachs Zilkha Renew able Energy Corporate United States - - 350 - - - - -Feb, 05 Energias de Portugal Wind Farms in Spain Assets Europe - - - 21 34 34 - -Jan, 05 AES SeaWest Holdings Corporate United States - - 500 60 72 - - -
Source: Scotia Capital.

Alternative & Renewable Energy August 2008
226
Exhibit 7.21: Magenn’s Air Rotor System (MARS)
Source: Magenn.
Exhibit 7.22: MagLev Wind Turbine
Source: www.magturbine.com.
Exhibit 7.23: Flying Electric Generator
Source: Sky Wind Power.
For a detailed review of wind power science & technology 101, please refer to our May 2007 report, Seizing the Wind Power Opportunity.
E M E R G I N G W I N D T E C H N O L O G I E S
Not just bigger and better. While it is true that turbines have been growing in size and improving in efficiency, we now see several companies developing unique methods of capturing wind energy. With respect to traditional turbine size growth, Clipper Windpower out of the U.K. may be leading the pack as it
has already pre-sold some 7.5 MW deep water Britannia turbines. To put this in perspective, imagine a turbine nearly twice the height of London’s famous Big Ben clock tower. Below, we summarize three unique wind turbine emerging technologies that we have come across.
Canadian-based Magenn Power has developed a lighter-than-air tethered device that rotates about a horizontal axis in response to wind (Exhibit 7.21). According to the company, the technology generates electricity “at a lower cost than all competing systems,” primarily due to no structural capital costs such as a tower that requires the use of an expensive crane. Helium provides the closed air rotor with lift as well as the ability to ascend to optimal altitudes. The company also claims that its technology has a potential capacity factor of 40% to 50%, unlike traditional wind turbines with capacity factors in a 25% to 35% range. The higher capacity factor is due to MARS’ ability to climb to 1,000 feet above ground in search of stronger and optimal wind speeds. Other advantages of the technology include: (1) the floating wind farms can be placed closer to demand centres; (2) the Magenn Air Rotors are mobile and can easily be moved to different locations; and (3) the system can operate at wind speeds as low as 1 m/s, compared with traditional wind turbines that begin operating at 3 m/s.
At the 2007 Wind Power Asia exhibition in Beijing, MagLev Wind Turbine Technologies introduced a magnetic levitation wind power technology that could revolutionize the industry (Exhibit 7.22). Vertically oriented blades are suspended in the air using neodymium magnets, replacing the need for ball bearings. Potential advantages of the frictionless technology include: (1) starting speeds as low as 1.5 m/s and as high as 40 m/s; (2) 20% higher than capacity factors than conventional wind turbines; (3) 50% lower operating costs; and (4) a 500-year potential lifespan. MagLev and Zhongke Hengyuan Energy Technology are developing a 1 GW Maglev wind turbine, enough electricity to power 750,000 homes, and would require only 100 acres of land. This compares with 1,000 standard wind turbines that can power 500,000 homes and require about 64,000 acres of land. The company claims that it will generate power for less than US$10/MWh.

The Choice of a New Generation August 2008
227
Exhibit 7.24: Compressed Air Wind Energy Storage
Source: Iowa Stored Energy Park.
Sky Wind Power recently demonstrated a 0.2 MW Flying Electric Generator (FEG) at high altitudes (Exhibit 7.23). Similar to Magenn Power, the flying power generators would use a tether to bring the electricity to the ground. The California-based company believes that FEGs could reach 20 MW each, with capacity factors as high as 80%.
Surplus Wind to Hydrogen
The 240-resident town of Utsira, Norway, recently won the Platts Global Energy Award for the world’s best site in renewable energy. Two Enercon wind turbines provide energy to 10 households when the wind is blowing. Surplus energy at Utsira is converted to hydrogen, using an electrolyzer, and stored. When there is no wind, the stored hydrogen is used to run a fuel cell and a motor that produces electricity. The hydrogen plant is built to provide up to two days of power with no wind.
Compressed Air Wind Energy Storage
Iowa Stored Energy Park is currently building a system where wind power is stored underground as compressed air during off peak hours and used to generate energy during peak times (Exhibit 7.24). Wind turbines power air compressors during off peak hours and store the energy underground and then during peak hours, using a natural gas catalyst, the compressed air is used to power turbines allowing the company to sell the electricity at on-peak prices.
Only two compressed air energy storage plants are currently operating, one in the U.S. and one in Germany. The project in Iowa is expected to come online in 2011. The technology, while not 100% renewable, opens the door to capacity factors well above 35%.

Alternative & Renewable Energy August 2008
228
Exhibit 7.25: Canada Has Massive Offshore Wind Energy Potential
Source: Environment Canada; Scotia Capital.
O F F S H O R E W I N D C A P I T A L C O S T S H A V E N O T P E A K E D Y E T
Offshore wind energy is growing faster than onshore wind. At least, it is outside of North America. Canada and the U.S. are off to a slow start to install offshore wind farms. In fact, they haven’t started at all. So far, all operating offshore wind energy projects have been constructed in Europe, which totalled about 1,100 MW at the end of 2007 (200 MW installed in 2007). In Europe, offshore wind farms are seen as essential to meeting its renewable power targets.
The lag in North American offshore wind power development is mainly due to its much higher capital costs per installed MW than compared with onshore wind farms. For offshore wind projects, there are higher costs for civil engineering, electrical connection costs (i.e., undersea cable installation), and the requirement for non-corrosive materials to be used. Also, offshore wind developers have to compete with oil and gas companies for the specialized vessels needed to install turbines and other heavy equipment at sea.
To make matters worse, we expect capital costs to increase by a further 10% to 20% over the next two to three years, before peaking. Today, the average cost of an offshore wind project is US$4.8 million per MW, which could jump to US$6 million per MW by 2011. The higher capital costs are partially offset by higher capacity factors due to less surface turbulence, as well as an average availability rate of 98%. A rule-of-thumb cost comparison that we have come across several times, and which is somewhat accurate, is as follows: Onshore wind project costs 25% infrastructure and 75% turbines; Offshore wind project costs 75% infrastructure and 25% turbines.
Canada is likely three to five years away from having any utility-scale offshore wind farms commissioned. Why: Canada still has lots of potential for traditional and less expensive land-based wind farms. We have only come across two Canadian offshore wind project proposals to date.
1. Naikun Wind Development Inc. wants to build a massive 1,750 MW wind farm in the Hecate Straight, off the coast of British Columbia. We expect Naikun to submit its first phase of the project, about 350 MW, into the BC Hydro Clean Power Call, due November 25, 2008.
2. Trillium Power Wind Corp. is developing a 710 MW project that would be sited 20 kilometres offshore in Lake Ontario. Helimax Energy suggests that the Great Lakes could generate up to 47,000 MW of electricity per year, or close to double Ontario’s existing capacity.

The Choice of a New Generation August 2008
229
Exhibit 7.26: 1,000+ GW of U.S. Offshore Wind Potential
Region 0 - 30 30 - 60 60 - 900 > 900 Total
New England 10,300 43,500 130,600 0 184,400Mid-Atlantic 64,300 126,200 45,300 30,000 265,800Great Lakes 15,500 11,600 193,600 0 220,700California 0 300 47,800 168,000 216,100Pacific Northwest 0 1,600 100,400 68,200 170,200Total (MW) 90,100 183,200 517,700 266,200 1,057,200
Offshore Wind Resource (MW) by Depth (m)
Source: National Renewable Energy Laboratory.
Exhibit 7.27: Interest for U.S. Offshore Wind Is Active
U.S. State Proposed Offshore Wind Capacity
Massachusetts 783 MWDelaware 450 MWNew Jersey 350 MWNew York 160 MWTexas 150 MWOhio 20 MWGeorgia 10 MW
Source: U.S. Department of Energy.
Exhibit 7.28: Global Turbine Manufacturers’ Market Share (2007)
Gamesa15.4%
Enercon14.0%
Others10.3%
GE Wind 16.6%
Suzlon10.5%
REpower3.3%Siemens
7.1%
Vestas22.8%
Source: European Wind Energy Association.
In late January 2008, the Ontario government lifted its 14-month moratorium on offshore wind projects in the Great Lakes. The moratorium on offshore wind power development was put in place so the government could study the potential impact of offshore wind projects on aquatic species, bird migration routes, and recreational boating and fishing.
The U.S. is still waiting for the final rules and regulations for offshore wind energy development. However, five areas in coastal waters have been approved by the Minerals Management Service for renewable energy research, including New Jersey, Delaware, Georgia, and California. The Cape Wind project off of New England is the most advanced U.S. offshore wind project and will likely be the first to be commissioned, although no green light has been given to date. Exhibit 7.26 shows the potential size of the U.S. offshore wind farm market.
Regulatory delays, turbine supply shortages, high and uncertain project costs, and public acceptance concerns continue to weigh down progress in the North American offshore wind space. According to the U.S. Department of Energy, 2007 saw the cancellation of a 500 MW Texas project, and has put a 150 MW New York project and a 450 MW Delaware project in jeopardy (Exhibit 7.27).
T H E T U R B I N E M A N U F A C T U R E R O L I G O P O L Y
Six manufacturers control 85% of the global market for wind turbines. With a 23% market share, Vestas leads the pack, followed by GE Wind, and Gamesa (Exhibit 7.28). However, smaller players – particularly in China and India – are growing rapidly, but we expect will primarily serve their domestic markets rather than expanding globally. Stock prices of the pure-play wind turbine manufacturers have soared over the last two and half years, up almost five times over the S&P/TSX Composite Index and the S&P 500 Index (Exhibit 7.29).
In the Canadian market, Danish manufacturer Vestas is the lead turbine supplier to date, followed by GE and Siemens.

Alternative & Renewable Energy August 2008
230
Exhibit 7.29: Pure-Play Wind Turbine Manufacturer Stocks Have Increased Almost 5x Since the Start of 2006
0
50
100
150
200
250
300
350
400
450
500
Dec-05 Mar-06 Jun-06 Sep-06 Dec-06 Mar-07 Jun-07 Sep-07 Dec-07 Mar-08 Jun-08
Inde
x =
100
@ D
ecem
ber 3
1, 2
005
Wind Turbine Mfrs (Index) SPTSX (rebased) SPX (rebased)
Index Mem bers*Gam esaNordexREpow erSuzlonVestas
*We only included those w ind turbine manufacturers that are (1) publicly traded; and (2) mostly pure-play. Accordingly, w e did not include Enercon, GE, and Siemens.
Source: Bloomberg; Scotia Capital.
Exhibit 7.30: Why Manufacturers Have Been Reluctant to Enter the U.S.
0
500
1,000
1,500
2,000
2,500
3,000
3,500
4,000
4,500
5,000
5,500
6,000
6,500
1999 2000 2001 2002 2003 2004 2005 2006 2007 2008E
U.S.
Win
d C
apac
ity In
stal
latio
ns (M
W)
93% Drop
78% Drop75% Drop
U.S. Production Tax Credit Expiry
Source: Scotia Capital.
Entrance into the U.S. market by major European turbine manufacturers has been limited, due primarily to the short-term nature of the U.S. Production Tax Credit. Exhibit 7.30 clearly shows why foreign manufacturers have historically been reluctant to set up shop in the U.S.
We see several reasons why global turbine manufacturer investment in new U.S. capacity is accelerating: (1) a weak U.S. dollar; (2) many U.S. states now have a Renewable Portfolio Standard (RPS); (3) the United States has one of the largest wind power market potentials; and (4) there is a clear focus on clean power generation technologies. Evidence in 2008 can be seen through U.S. investment by most global turbine manufacturers, including Siemens (new blade plant in Iowa); Suzlon (new nose cone plant in Minnesota); Vestas (new blade plant in Colorado); Acciona (new production plant in Iowa); Moventas (doubles gear production); REpower (new turbine plant); and GE Energy (doubling annual production in the U.S.).
In Canada, following Hydro-Quebec’s awarding of 2,000 MW of wind PPAs in May 2008, REpower and Enercon were indirectly selected as the winning turbine suppliers. Both of these companies must incur at least 60% of their project-related costs in Quebec.

The Choice of a New Generation August 2008
231
Exhibit 7.31: Enercon Provides the Best Service, Again and Again
1.97
2.57
3.31
3.02
3.31
3.33
1.92
2.55
3.19
3.36
3.50
3.50
1.0 1.5 2.0 2.5 3.0 3.5 4.0
Enercon
REpower
Nordex
Siemens
Vestas
GE Energy
1.0 (Excellent) - 6.0 (Poor)
20075-Year Average
Source: German Wind Energy Association.
Exhibit 7.32 Operators That Want to Switch
Turbine UnderManufacturer Warranty < 6 Years > 6 Years Total
Enercon 0.0% 1.1% 1.3% 1.1%REpower 0.0% 0.0% 33.3% 6.9%Nordex 20.0% 56.3% 17.4% 26.9%Siemens 0.0% 14.3% 36.6% 29.3%Vestas 30.8% 18.9% 22.3% 22.0%GE Energy 62.5% 62.5% 42.6% 52.6%
Turbine Age
Source: German Wind Energy Association.
Exhibit 7.33: Finavera Renewables – Stock Performance
$0.10$0.15$0.20$0.25$0.30$0.35$0.40$0.45$0.50$0.55$0.60
Dec-07 Feb-08 Apr-08 Jun-08
Pric
e
02004006008001,0001,2001,4001,6001,8002,000
Daily
Vol
ume
(000
s)
FVR (Volume) FVR (Price) STUTIL (rebased) SPTSX (rebased)
$35.5M
FVR$0.18
$0.52$0.10
202.9M
Ticker:Last Price:Market Cap:52 Wk High:52 Wk Low :Shares O/S:
Source: Bloomberg; Scotia Capital.
Multibrid, an offshore turbine manufacturer that is majority-owned by French nuclear giant Areva, intends to open its first North American manufacturing plant in southern Ontario. Trillium Power Wind Corp.’s Lake Ontario project, together with another project being developed by Fisherman’s Energy of New Jersey, represent potential orders for more than 300 offshore wind turbines.
Enercon Still Number One in Service
For the fifth year in a row, the German Wind Energy Association’s (BWE) annual survey on service reveals that Enercon needs little repair. Siemens and Vestas received lower service rankings in 2007 over 2006, (Exhibit 7.31). Perhaps a more telling story is shown in Exhibit 7.32, where over 50% of operators of GE wind turbines want to switch to a different service company in the future, compared with 1.1% for Enercon.
F I N A V E R A R E N E W A B L E S I N C .
Finavera Renewables (FVR-V) is developing wind projects in B.C., Alberta, and in Ireland. The Peace Region project (seven sites), which targets 366 MW of wind capacity to be commissioned between 2011 and 2013, has now received land permit approvals. The Cascades Region of projects (nine sites) is further behind, having only received Investigative Use Permits for three of its sites. In Alberta, the company purchased a two-phase project (Three Hills) with a total expected capacity between 155 MW and 165 MW. While FVR has targeted a 2008 construction start date for Ghost Pine, the first phase of Three Hills, we believe that FVR may be looking to sell the project in order to fund further development. FVR also has 175 MW of wind power development opportunities in Ireland at two different sites. In Ireland, wind farm projects can receive up to 100% debt financing.

Alternative & Renewable Energy August 2008
232
Exhibit 7.34: Keewatin Windpower – Stock Performance
$1.00
$1.20
$1.40
$1.60
$1.80
$2.00
$2.20
$2.40
Dec-07 Feb-08 Apr-08 Jun-08
Pri
ce (U
S$)
0
25
50
75
100
125
150
175
200
Daily
Vol
ume
(000
s)
KWPW (Volume) KWPW (Price) STUTIL (rebased) SPTSX (rebased)
$13.6M
KWPW$1.10
$1.95$0.5512.4M
Ticker:Last Price:Market Cap:52 Wk High:52 Wk Low :Shares O/S:
USUS
USUS
Source: Bloomberg; Scotia Capital.
Exhibit 7.35: Sea Breeze – Stock Performance
$0.20$0.25$0.30$0.35$0.40$0.45$0.50$0.55$0.60$0.65$0.70
Dec-07 Feb-08 Apr-08 Jun-08
Pri
ce
0102030405060708090100
Dai
ly V
olum
e (0
00s)
SBX (Volume) SBX (Price) STUTIL (rebased) SPTSX (rebased)
$31.7M
SBX$0.405
$0.55$0.2078.4M
Ticker:Last Price:Market Cap:52 Wk High:52 Wk Low :Shares O/S:
Source: Bloomberg; Scotia Capital.
K E E W A T I N W I N D P O W E R C O R P .
Keewatin Windpower (KWPW-OTCBB) is a development stage company, which recently acquired Sky Harvest Wind Power, a company that owns a wind farm site located in southern Saskatchewan. Keewatin has secured land lease agreements for the site and expects to develop 150 MW of wind power capacity there. In total, Keewatin anticipates the development of about 300 MW in southern Saskatchewan.
S E A B R E E Z E P O W E R C O R P .
Sea Breeze (SBX-V) is a British Columbia-based energy development company with one wind project in development, a number of wind farm prospects, and plans to develop two underwater transmission lines. SBX’s Knob Hill project is a 99 MW wind farm to be located on the northern tip of Vancouver Island. The project has been approved by the B.C. Environmental Assessment Office (EAO) and is now preparing for a bid submission into the BC Hydro Clean Power Call. There are 700+ MW of wind power prospects for Sea Breeze, all of which are in B.C.

The Choice of a New Generation August 2008
233
Exhibit 7.36: NaiKun Wind – Stock Performance
$0.50
$1.50
$2.50
$3.50
$4.50
$5.50
$6.50
Dec-07 Feb-08 Apr-08 Jun-08
Pric
e
050100150200250300350400450500
Dai
ly V
olum
e (0
00s)
NKW (Volume) NKW (Price) STUTIL (rebased) SPTSX (rebased)
$43.0M
NKW$1.14
$3.75$0.9137.8M
Ticker:Last Price:Market Cap:52 Wk High:52 Wk Low :Shares O/S:
Source: Bloomberg; Scotia Capital.
Exhibit 7.37: Shear Wind – Stock Performance
$0.40
$0.60
$0.80
$1.00
$1.20
$1.40
$1.60
$1.80
$2.00
Dec-07 Feb-08 Apr-08 Jun-08
Pric
e
0
50
100
150
200
250
300D
aily
Vol
ume
(000
s)
SWX (Volume) SWX (Price) STUTIL (rebased) SPTSX (rebased)
$22.3M
SWX$0.50
$1.66$0.4544.7M
Ticker:Last Price:Market Cap:52 Wk High:52 Wk Low :Shares O/S:
Source: Bloomberg; Scotia Capital.
N A I K U N W I N D E N E R G Y G R O U P I N C .
NaiKun (NKW-V) is developing an offshore wind farm in B.C. near Prince Rupert. The company has the rights to a 550 km2 offshore wind site in the Hecate Straight Energy Field, which is known as one of the world’s 10 best locations for offshore wind energy due to its high and consistent wind speeds. NKW proposes to develop the site in five phases, with a final anticipated capacity of 1,750 MW. Construction of the 320 MW Phase I is expected to begin in 2009. With the BC Hydro Clean Power Call looking for larger projects, NKW hopes to bid for and win a BC Hydro PPA over the next year.
S H E A R W I N D I N C .
Shear Wind (SWX-V) is developing seven wind projects in Nova Scotia, New Brunswick, Saskatchewan, and Alberta. Shear’s projects have a potential total capacity of 1,500+ MW with two projects of 160 MW expected to begin construction in 2009. SWX’s 60 MW Glen Dhu Wind Park in Nova Scotia is expected to consist of thirty 2 MW turbines at a total cost of $150 million, or an installed capital cost of $2.5 million per MW. Shear has secured a 20-year PPA with Nova Scotia Power and expects the site to be commissioned by 2011. The company believes the site can support an additional 170 MW. In June, Shear secured a 100 MW build-out position on the Alberta electrical grid for its Glenridge Phase I project.

Alternative & Renewable Energy August 2008
234
Exhibit 7.38: Western Wind – Stock Performance
$1.00
$1.50
$2.00
$2.50
$3.00
$3.50
$4.00
$4.50
$5.00
Dec-07 Feb-08 Apr-08 Jun-08
Pric
e
02004006008001,0001,2001,4001,6001,8002,000
Daily
Vol
ume
(000
s)
WND (Volume) WND (Price) STUTIL (rebased) SPTSX (rebased)
$52.9M
WND$1.75
$4.35$0.9030.2M
Ticker:Last Price:Market Cap:52 Wk High:52 Wk Low :Shares O/S:
Source: Bloomberg; Scotia Capital.
W E S T E R N W I N D E N E R G Y C O R P .
Western Wind (WND-V) operates 35 MW of wind capacity and is pursuing three U.S. wind projects. The Mesa Wind Generating facility, located near Palm Springs, California, has a capacity of 30 MW as well as signed PPAs through 2011. The company’s smaller 4.5 MW Windridge facility also has a PPA, which expires in 2014. In 2005, WND was awarded a 120 MW PPA for its Windstar I project, to supply California with renewable power over a 20-year period. Installation of the turbines is expected by 2H/09. Once completed, WND’s 15 MW Steel Park project, located in Arizona and which can be expanded by a further 200 MW, would be the first utility-scale wind energy project in the state.
Western Wind also has a 100 MW wind and solar energy site near Barstow, California, which is currently completing environmental permitting. WND is 100% debt free and owns 3,700 acres of land that are zoned and permitted for wind power development.

235
The Choice of a N
ew G
eneration A
ugust 2008
Exhibit 7.39: Wind Turbine Manufacturer Valuation Metrics
Company Name TickerLast Price
52-Wk Low
52-Wk High
Shares O/S
Market Cap
Debt/ Equity
Debt/ Assets
Debt/ EBITDA
1-MonthROR
3-MonthROR
1-Year ROR
(8/15/2008) (M) (C$M) (%) (%) (x) (%) (%) (%)
AAER AAE $0.21 $0.21 $2.10 85.5 $18 - - n.m. -7% -50% -41%Americas Wind Energy AWNE US$0.30 US$0.27 US$0.79 31.3 $10 - - - -5% -20% -56%Cleanfield Alternative Energy AIR $1.10 $0.52 $2.85 23.7 $26 - - n.m. 6% 22% -52%Gamesa Corp Tecnologica GAM €29.63 €21.30 €36.44 243.3 $11,227 47% 14% 1.2x -6% -8% 10%General Electric GE US$29.80 US$25.60 US$42.15 9,948.0 $314,105 470% 66% 15.7x 6% -7% -22%Nordex NDX1 €22.32 €17.50 €39.60 66.8 $2,324 6% 2% 0.3x 17% -29% -6%REpow er Systems RPW €201.96 €93.31 €243.54 9.0 $2,829 3% 1% - -1% -8% 98%Siemens SIE €76.32 €64.89 €109.96 914.2 $108,658 48% 16% 1.6x 7% 0% -13%Suzlon Energy SUEL Rp241.10 Rp174.50 Rp460.00 1,498.3 $8,828 123% 37% 5.1x 23% -22% 3%Vergnet ALVER €10.38 €8.96 €18.29 6.4 $103 - - - -1% -13% -38%Vestas Wind Systems VWS DKK629 DKK285 DKK700 185.2 $24,324 6% 2% - 3% 5% 107%Average $42,950 100% 20% 4.8x 4% -12% -1%
Enterprise Value to EBITDA Price to Earnings Price to Sales Price to Cash Flow
Company Name 2008E 2009E 2010E 2008E 2009E 2010E 2008E 2009E 2010E 2008E 2009E 2010E(x) (x) (x) (x) (x) (x) (x) (x) (x) (x) (x) (x)
AAER - 1.8x - - 6.0x - 0.4x 0.1x - - - -Americas Wind Energy - - - - - - - - - - - -Cleanfield Alternative Energy - - - - - - - - - - - -Gamesa Corp Tecnologica 13.4x 10.9x 8.9x 26.7x 20.4x 16.6x 2.0x 1.7x 1.5x 16.3x 14.1x 11.0xGeneral Electric 19.7x 18.5x 17.2x 13.5x 12.8x 11.6x 1.6x 1.5x 1.4x 8.7x 8.1x 7.3xNordex 15.3x 10.5x 6.7x 31.0x 20.8x 13.9x 1.4x 1.0x 0.7x 20.1x 15.8x 12.4xREpow er Systems 22.6x 12.7x 7.8x 43.9x 31.7x 21.7x 1.8x 1.4x 0.9x - - -Siemens 8.7x 7.1x 6.1x 17.2x 11.4x 9.4x 0.9x 0.9x 0.8x 9.4x 8.0x 6.6xSuzlon Energy 14.6x 10.4x 7.7x 21.3x 14.3x 10.1x 1.8x 1.3x 1.0x 16.0x 11.7x 5.4xVergnet - 7.2x 2.7x - n.m. 12.5x 1.6x 1.0x 0.6x n.m. 13.8x 4.9xVestas Wind Systems 18.4x 13.8x 11.1x 32.9x 24.4x 19.0x 2.6x 2.1x 1.8x 25.4x 18.7x 14.7xAverage 16.1x 10.3x 8.5x 26.6x 17.7x 14.4x 1.6x 1.2x 1.1x 16.0x 12.9x 8.9x
Source: Bloomberg; Scotia Capital.
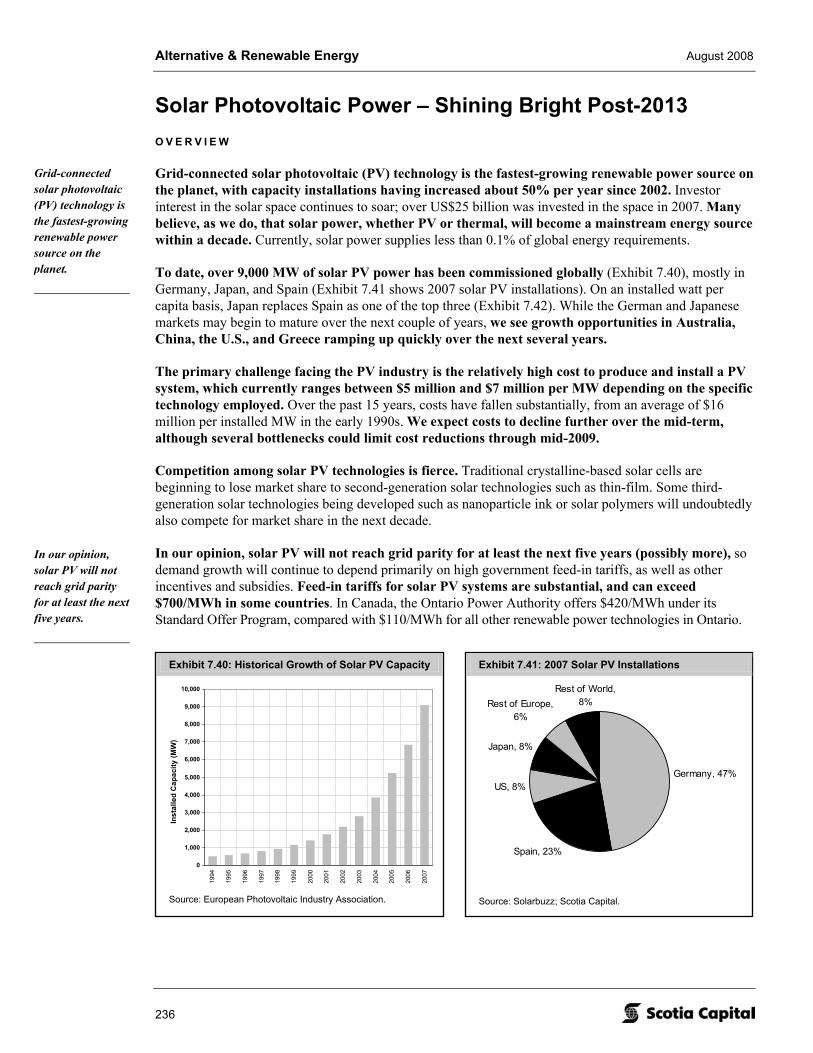
Alternative & Renewable Energy August 2008
236
Exhibit 7.41: 2007 Solar PV Installations
Germany, 47%
Spain, 23%
US, 8%
Japan, 8%
Rest of Europe, 6%
Rest of World, 8%
Source: Solarbuzz; Scotia Capital.
Exhibit 7.40: Historical Growth of Solar PV Capacity
Inst
alle
d C
apac
ity (M
W)
0
1,000
2,000
3,000
4,000
5,000
6,000
7,000
8,000
9,000
10,000
1994
1995
1996
1997
1998
1999
2000
2001
2002
2003
2004
2005
2006
2007
Source: European Photovoltaic Industry Association.
Solar Photovoltaic Power – Shining Bright Post-2013O V E R V I E W
Grid-connected solar photovoltaic (PV) technology is the fastest-growing renewable power source on the planet, with capacity installations having increased about 50% per year since 2002. Investor interest in the solar space continues to soar; over US$25 billion was invested in the space in 2007. Many believe, as we do, that solar power, whether PV or thermal, will become a mainstream energy source within a decade. Currently, solar power supplies less than 0.1% of global energy requirements.
To date, over 9,000 MW of solar PV power has been commissioned globally (Exhibit 7.40), mostly in Germany, Japan, and Spain (Exhibit 7.41 shows 2007 solar PV installations). On an installed watt per capita basis, Japan replaces Spain as one of the top three (Exhibit 7.42). While the German and Japanese markets may begin to mature over the next couple of years, we see growth opportunities in Australia, China, the U.S., and Greece ramping up quickly over the next several years.
The primary challenge facing the PV industry is the relatively high cost to produce and install a PV system, which currently ranges between $5 million and $7 million per MW depending on the specific technology employed. Over the past 15 years, costs have fallen substantially, from an average of $16 million per installed MW in the early 1990s. We expect costs to decline further over the mid-term, although several bottlenecks could limit cost reductions through mid-2009.
Competition among solar PV technologies is fierce. Traditional crystalline-based solar cells are beginning to lose market share to second-generation solar technologies such as thin-film. Some third-generation solar technologies being developed such as nanoparticle ink or solar polymers will undoubtedly also compete for market share in the next decade.
In our opinion, solar PV will not reach grid parity for at least the next five years (possibly more), so demand growth will continue to depend primarily on high government feed-in tariffs, as well as other incentives and subsidies. Feed-in tariffs for solar PV systems are substantial, and can exceed $700/MWh in some countries. In Canada, the Ontario Power Authority offers $420/MWh under its Standard Offer Program, compared with $110/MWh for all other renewable power technologies in Ontario.
Grid-connected solar photovoltaic (PV) technology is the fastest-growing renewable power source on the planet.
In our opinion, solar PV will not reach grid parity for at least the next five years.

The Choice of a New Generation August 2008
237
Exhibit 7.42: Installed Watt per Capita
0.6
0.7
0.7
0.8
2.1
2.6
3.1
3.2
3.3
4.0
6.5
13.4
0 2 4 6 8 10 12 14 16
Canada
France
South Korea
Italy
United States
Spain
Austria
Netherlands
Australia
Sw itzerland
EU
Japan
Germany
Luxembourg
Installed Solar PV Watts per Capita
Less than 50 MW installed
Maturing solar PV markets
We expect these markets to grow
rapidly through 2012
€450/MWh feed-in tariff, down from €550/MWh in 2004.
Ended solar incentives in 2005, but may reinstate
in 2009
50.5
34.8
Source: Company reports; Scotia Capital estimates.
Exhibit 7.43: Forecast Crystalline Cost Curve
$0
$1
$2
$3
$4
$5
$6
$7
$8
2007 2010E 2013E 2016E 2019E 2022E 2025E
Inst
alle
d C
ost (
$M/M
W)
$0
$50
$100
$150
$200
$250
$300
$350
$400
$450
$500
Leve
lized
Cos
t ($/
MW
h)Estimated installed capital costs for crystalline silicon PV ($M/MW)
Estimated levelized cost range for crystalline silicon PV ($/MWh)
Source: Company reports; Scotia Capital estimates.
Exhibit 7.44: Forecast Thin-Film Cost Curve
$0
$1
$2
$3
$4
$5
$6
$7
2007 2010E 2013E 2016E 2019E 2022E 2025E
Inst
alle
d C
ost (
$M/M
W)
$0
$50
$100
$150
$200
$250
$300
$350
$400
$450
$500
Leve
lized
Cos
t ($/
MW
h)
Estimated installed capital costs for thin-film ($M/MW)
Estimated levelized cost range for thin-film ($/MWh)
Source: Company reports; Scotia Capital estimates.
We see both costs and selling prices for installed crystalline and thin-film solar systems falling over the next several years, as shown in Exhibits 7.43 and 7.44. Our view is based on the following beliefs:
• Economies of scale in solar manufacturing processes are increasing. Solar modules are quickly becoming commodities, despite slight variations in each manufacturer’s solar PV system.
• The supply shortage of solar-grade silicon will be over imminently with a surge of new production capacity expected to come online by 2010.
• Technological advancements are accelerating.
• Feed-in tariff rates are declining, forcing cost reductions for margin preservation.

Alternative & Renewable Energy August 2008
238
Exhibit 7.45: Solar PV Technology Efficiencies Are Improving
University of Maine
Boeing
Boeing
Boeing
BoeingARCO
NREL
BoeingEuro-CIS
200019951990198519801975
NREL/Spectrolab
NRELNREL
JapanEnergy
Spire
No. CarolinaState University
Multijunction ConcentratorsThree-junction (2-terminal, monolithic)Two-junction (2-terminal, monolithic)
Crystalline Si CellsSingle crystalMulticrystallineThin Si
Thin Film TechnologiesCu(In,Ga)Se2CdTeAmorphous Si:H (stabilized)
Emerging PVOrganic cells Varian
RCA
Solarex
UNSW
UNSW
ARCO
UNSWUNSW
UNSWSpire Stanford
Westing-house
UNSWGeorgia TechGeorgia Tech Sharp
AstroPower
NREL
AstroPower
Spectrolab
NREL
Masushita MonosolarKodak
KodakAMETEK
PhotonEnergy
UniversitySo. Florida
NREL
NREL
Princeton UniversityKonstanz NREL
NRELCu(In,Ga)Se2
14x concentration
NREL
UnitedSolar
United Solar
RCA
RCARCA
RCA RCARCA
Spectrolab
University CaliforniaBerkeley
Solarex12
8
4
0
16
20
24
28
32
36
Effic
iency
(%)
Source: National Renewable Energy Laboratory.
W H A T W E L I K E A B O U T T H E P O T E N T I A L F O R U T I L I T Y - S C A L E S O L A R P V
• Solar power acts as a hedge against volatile and increasing costs for fossil-fuel resources such as natural gas and coal.
• Provided government support continues, solar power will eventually become cost-competitive as a peak-generation resource. Unlike wind power, the output of PV systems correlates highly with electricity demand, especially in hot regions where air conditioning use is high throughout the day. Today, solar power can compete in regions that offer high power prices and offer various financial incentives such as tax credits or subsidies.
• No fuel costs and very low operating and maintenance costs (there are typically no moving parts), unlike other renewable technologies such as wind power.
• Carbon credits can be earned and sold as an incremental revenue source for power developers, similar to other renewables.
• Utilities can use solar power to meet their renewable portfolio standards.
• Scalability. Solar systems range in size from less than 0.1 MW to 500+ MW for a utility-scale system.
• Efficiency improvements are inevitable. Commercial solar PV equipment efficiency is about half the efficiency of lab-tested equipment, and far below theoretical limits. From 1990 through 2006, the mean efficiency value for solar plants with crystalline cell modules increased to 12.9% from 11.6%. Exhibit 7.45 summarizes PV efficiency improvements since 1975.
On August 14, PG&E placed an order for 800 MW of solar PV capacity, which is due to be commissioned between 2010 and 2011. The project is dependent on an extension of the U.S. Production Tax Credit.
Unlike wind power, the output of PV systems correlates highly with electricity demand.

The Choice of a New Generation August 2008
239
Exhibit 7.46: SunPower Plans to Achieve a 60% PV Cost Reduction by 2012
$0
$1
$2
$3
$4
$5
$6
$7
$8
$9
$10
2006 Downstream Cell/Panel Silicon Efficiency 2012E
Cos
t per
Wat
t 25%
10%
10%
15%
60% Reduction
Source: SunPower.
P V ’ S C H A L L E N G E S : C O S T R E D U C T I O N S N E E D E D I N M A N Y A R E A S
Silicon, the primary material used to develop most solar PV systems, has been in short supply over the past several years, as it competes with demand from semiconductor chip manufacturers. In 2007, and for the first time, the solar industry used more silicon than the semiconductor industry. As a result of tight silicon supply, the decline of the solar PV module cost curve decline has stalled for now. On the bright side, solar-grade silicon suppliers have begun to respond to the supply/demand imbalance. New factories are coming online, which in our opinion, will ease the solar-grade silicon supply shortage by 2010. However, many solar panel producers have locked in fixed-price contracts with silicon suppliers at prices well above the spot market. In our view, until these fixed-price supply contracts expire, panel manufacturer margins will suffer at the expense of silicon suppliers. Other challenges to solar PV include the following:
• Some solar systems become less efficient over their lifetime;
• Efficiency (i.e., capacity factor) is poorer than other renewable technologies;
• Sunlight is an intermittent fuel source, similar to wind;
• Production of PV cells are energy intensive; and
• PV systems require a (costly) power conditioning system (i.e., DC AC).
SunPower provides a good example of how industry-wide solar PV cost reductions may occur. The company anticipates a 60% cost reduction by 2012, or to about $3.5 to $4 per installed watt (Exhibit 7.46). Specifically, SunPower aims to reduce wafer thickness to 145 um from 250 um currently, increase its production scale to 250 MW, and open more dealers in the U.S. (150+).

Alternative & Renewable Energy August 2008
240
S O L A R E Q U I T I E S : T H E R I S E …
As energy prices soared throughout 2007, so did the value of most public companies that offer alternatives to fossil fuel-based power, and global solar equities were no exception. Government, media, and investor interested peaked in 2007. Solar index performance charts closely resembled those during the dot-com bubble … before it burst. Wall Street darlings First Solar and SunPower Corporation rose about 800% and 250% in 2007, respectively. We see the following reasons for the success of solar-based public companies in 2007:
• Global solar panel demand in 2007 far exceeded manufacturing capacity.
• Solar public market investment globally hit US$9.4 billion in 2007, over 2x and 4x the levels achieved in 2006 and 2005, respectively. Many of the solar IPOs in 2007 came from China where inexpensive labour and manufacturing subsidies are offered.
• Government support for solar power continued throughout 2006 and 2007, primarily with renewable portfolio standard carve-outs for solar (e.g., the Ontario Power Authority’s $420/MWh Standard Offer Contract that started in 2006).
• Talk (and hype) continued about the grid-potential of solar power, which if and/or when occurs on a material and near-incentive/subsidy-free basis, will cause solar PV demand to skyrocket.
• U.S. presidential candidate Barack Obama continued to speak out that solar power is the primary way that the U.S. can reduce its reliance on foreign oil. A poll conducted by Kelton Research in mid-2008 suggested that 94% of Americans feel “it is important for the U.S. to develop and use solar energy.”
… A N D F A L L
Solar stocks are down 24% on average since the start of the year, despite fossil-fuel prices continuing to rise. The S&P/TSX Composite Index, Dow Jones Industrial Average, S&P 500, and Nasdaq are down 5.3%, 12.1%, 11.6%, and 7.5%, respectively. We see several reasons why these stocks are down, as follows:
• Some institutional investors rotated out of the first wave of solar stocks and into IPOs of the second and third waves of solar stocks, primarily to capture 2007 gains, and to take advantage of new opportunities.
• Emerging industries tend be volatile until markets “figure out” reasonable multiples they are willing to pay on forward earnings.
• Fears of global recessions and credit tightening likely postponed many consumers’ decisions to invest in solar installations, despite the soaring costs of energy.
• Margins at most stages of the solar value chain are trending or are forecast to trend downward as solar products begin the early stages of commoditization.
• Thin-film solar market share is increasing, at the expense of crystalline silicon-based solar manufacturers. Average thin-film efficiency levels are now in the 11% area, compared with 8.5% at the end of 2006.
• Spain has proposed reduced feed-in tariffs of €330/MWh for roof-top solar installations and €290/MWh for ground-based installations. To make matters worse, the Secretary General for Energy also proposed a 300 MW solar cap for 2009, broken down as 200 MW for roof-top capacity and 100 MW for ground capacity. Some industry observers thought a 3,000 MW cap on the solar space in Spain for 2009 would be a negative.

The Choice of a New Generation August 2008
241
Exhibit 7.47: Solar Supply Chain Capital Costs
$1.25
$0.80
$1.25
$0.40
$2.75
$0
$1
$2
$3
$4
$5
$6
$7
Silicon Ingot &Wafer
CellProduction
ModuleProduction
System &Installation
Cap
ital C
ost (
$M/M
W)
Source: Company reports; Scotia Capital estimates.
Exhibit 7.48: Solar Supply Chain Gross Margins
55%
30%
17%
6%
18%
0%
10%
20%
30%
40%
50%
60%
70%
Silicon Ingot &Wafer
CellProduction
ModuleProduction
System &Installation
Gro
ss M
argi
n (%
)
Source: Company reports; Scotia Capital estimates.
• In our opinion, investment in the solar sector carries more political risk (i.e., unpredictable) than other renewable technologies, simply because it is the least cost-effective technology, as well as the furthest away from grid-parity.
• There are rumours swirling that some regulatory bodies may not be “on board” with the use of Cadmium Telluride (CdTe) to produce thin-film solar. Cadmium is an extremely toxic metal, even in low concentrations.
• Although it was recently reversed, the U.S. Bureau of Land Management implemented a 22-month moratorium on new applications for solar energy development on public lands in six western states.
• The 30% U.S. investment tax credit on residential solar technologies is set to expire at the end of 2008. Perhaps more importantly, the U.S. Production Tax Credit (US$20/MWh for solar) is also set to expire at the end of the year.
Solar PV (levelized) costs are driven by (1) the amount of sunlight available at a site; (2) the efficiency of the PV system to convert the sunlight into electricity (i.e., capacity factor); (3) the cost of panels/modules and other parts of the system (i.e., mounting, installation, etc.); (4) the cost of money; (5) operating and parts replacement costs; and (6) the costs of development (i.e., permitting, land leases, etc.). Capital costs for traditional solar PV systems (i.e., crystalline) range from $5 million to $7 million per MW. Exhibit 7.47 breaks down the approximate capital costs for a typical installed system, while Exhibit 7.48 shows the range of gross margins achieved in 2007 by players in the solar space.
Our solar comps table is shown in Exhibit 7.70.
242
T E S T I N G O N T A R I O ’ S S T A N D A R D O F F E R C O N T R A C T : M O D E L L I N G & S E N S I T I V I T Y A N A L Y S E S O F A S O L A R P R O J E C T
Our financial modelling and analysis of generic Ontario-based solar PV power projects indicates that equity IRRs typically are fairly low, as expected. We modelled numerous scenarios and sensitized for variations in (1) installed capital cost per MW; (2) PPA prices and escalations rates; (3) capital costs and costs of capital; (3) the federal ecoENERGY incentive payment; (4) operating & maintenance costs; (5) cell efficiencies factors; (6) tax rates; and (7) carbon credits/offsets/RECs. Our average generic solar project yielded a 6.2% equity IRR. To arrive at this, we made the following assumptions:
• 15% gross cell efficiency. There are many variations of solar PV cell technologies and cell efficiencies are improving quickly. We chose a 15% gross cell efficiency as our base case. We then assumed a 95% power conditioning efficiency, a 90% system efficiency, and a 90% temperature correction.
• $6 million per MW installed cost. We picked the average of the most recent installed costs we have seen throughout 2008 to date.
• Insolation of 2.4 kWh/m2 per day, based on an insolation map of Ontario (Rupprecht & Pataschnick Co., Inc.).
• Starting PPA @ $420/MWh. This is the only solar-specific Standard Offer Contract in Canada. The PPA price is not eligible for inflation increases or peak-performance pricing.
• Starting O&M @ $5.50/MWh + 1.5% p.a. Operating and maintenance costs, on a per MWh basis, generally range between $5/MWh and $8/MWh. We found that on average, a good approximation for annual solar PV O&M is 0.12% of installed capital cost.
• Federal ecoENERGY Incentive @ $5/MWh. In Canada, we have seen qualified projects receive none, some, or all of the $10/MWh federal ecoENERGY incentive payment, as PPA providers may demand the incentive payment to partially offset the higher-than-normal power prices being offered to developers. In Ontario, the ecoENERGY incentive payment of $10/MWh is shared equally between the IPP and the Ontario Power Authority.
• Debt to equity split 75%/25%. We have seen project debt as a percentage of total capital invested, range between 65% and 85%. We chose the midpoint for our project capital structure, and assume that the debt is non-recourse (project specific).
• Other. For solar projects, PPA terms in Ontario are for 20 years. We also matched the term of debt financing to this 20-year PPA term, and assumed no merchant tail.
In Exhibit 7.49 on the following page, we provide our equity investment IRR sensitivity analyses to changes in the factors listed above.
Our generic Ontario-based solar PV project yielded a 6.2% equity IRR.
Alternative & Renewable Energy August 2008

243
The Choice of a N
ew G
eneration A
ugust 2008
Exhibit 7.49: Solar Project Equity IRRs Are Improving
$40$90
$140$190$240$290$340$390$440$490
50 45 40 35 30 25 20 15
Expected Facility Life (Years)
Levl
ized
Cos
t of P
ower
($
/MW
h)
15% g.c.e.
25% g.c.e.
10% g.c.e.
$30
$130
$230
$330
$430
$530
$630
5% 6% 7% 8% 9% 10% 11% 12% 13% 14% 15%
Capitalization Rate (%)Le
vliz
ed C
ost o
f Pow
er
($/M
Wh)
15% g.c.e.
25% g.c.e.
10% g.c.e.
$40
$90
$140
$190
$240
$290
$340
$390
$440
$2.00 $3.00 $4.00 $5.00 $6.00 $7.00 $8.00
Cost per Installed MW ($M)
Levl
ized
Cos
t of P
ower
($
/MW
h)
15% g.c.e.
25% g.c.e.
10% gross cell efficiency (g.c.e.)
0%
5%
10%
15%
20%
25%
30%
$7.5 $7.0 $6.5 $6.0 $5.5 $5.0 $4.5
Cost per Installed MW ($M)
IRR
10% g.c.e.
15% g.c.e.
25% gross cell efficiency (g.c.e.)
Base Case
0%
2%
4%
6%
8%
10%
12%
14%
$270 $320 $370 $420 $470 $520 $570
Initial Power Price ($/MWh)
IRR
Base Case O&M @
$5.50/MWhO&M @
$15/MWh
O&M @ $0/MWh
5.75%
6.00%
6.25%
6.50%
6.75%
$0.00 $1.67 $3.33 $5.00 $6.67 $8.33 $10.00
Carbon Credit ($/MWh)
IRR No
ecoEnergy
Base Case - ecoEnergy split 50:50 with PPA
provider.
Full ecoEnergy
Source: Scotia Capital estimates.

Alternative & Renewable Energy August 2008
244
Exhibit 7.50: Solar Project Equity IRRs Are Improving
6.2% $270 $320 $370 $420 $470 $520 $570$15 - 2.0% 4.0% 5.9% 7.8% 9.7% 11.7%$12 - 2.1% 4.1% 6.0% 7.9% 9.8% 11.8%$9 - 2.2% 4.2% 6.1% 8.0% 9.9% 11.9%$6 - 2.3% 4.3% 6.2% 8.1% 10.1% 12.0%$5 - 2.4% 4.3% 6.2% 8.2% 10.1% 12.0%$4 - 2.4% 4.4% 6.3% 8.2% 10.1% 12.1%$0 - 2.5% 4.5% 6.4% 8.3% 10.3% 12.2%
6.22% $7.5 $7.0 $6.5 $6.0 $5.5 $5.0 $4.55% - - - - - - -
10% - - - - 1.7% 2.9% 4.4%15% 2.9% 3.9% 5.0% 6.2% 7.7% 9.5% 11.6%20% 7.3% 8.5% 10.0% 11.6% 13.7% 16.2% 19.4%25% 11.6% 13.2% 15.1% 17.4% 20.1% 23.5% 27.7%30% 16.2% 18.2% 20.6% 23.5% 26.9% 31.2% 36.5%35% 21.0% 23.5% 26.4% 29.9% 34.1% 39.2% 45.5%
6.2% 8.00% 7.50% 7.00% 6.50% 6.00% 5.50% 5.00%35% 2.8% 3.5% 4.1% 4.8% 5.5% 6.3% 7.0%30% 3.3% 3.9% 4.6% 5.3% 6.0% 6.8% 7.6%25% 3.7% 4.4% 5.1% 5.8% 6.5% 7.3% 8.1%20% 4.1% 4.8% 5.5% 6.2% 7.0% 7.8% 8.6%15% 4.5% 5.2% 5.9% 6.6% 7.4% 8.2% 9.1%10% 4.8% 5.5% 6.3% 7.0% 7.8% 8.7% 9.5%5% 5.2% 5.9% 6.6% 7.4% 8.3% 9.1% 10.0%
6.2% $0.00 $1.67 $3.33 $5.00 $6.67 $8.33 $10.00$0.0 6.1% 6.1% 6.2% 6.2% 6.3% 6.3% 6.4%$2.5 6.1% 6.2% 6.3% 6.3% 6.4% 6.4% 6.5%$5.0 6.2% 6.3% 6.3% 6.4% 6.4% 6.5% 6.5%$7.5 6.3% 6.3% 6.4% 6.5% 6.5% 6.6% 6.6%
$10.0 6.4% 6.4% 6.5% 6.5% 6.6% 6.6% 6.7%
Starting PPA Price ($/MWh)
Installed Capital Cost ($M/MW)
Cost of Debt (%)
Carbon price ($/REC or $/ERC or $/MWh)
Starting O&M Cost ($/MWh)
Gross Cell Efficiency
(%)
Effective Cash Tax Rate (%)
ecoEnergy ($/MWh)
Source: Scotia Capital estimates.

The Choice of a New Generation August 2008
245
Exhibit 7.51: Over 90% of Installed Solar Power Capacity in Canada Is Off-Grid
0
2
4
6
8
10
12
14
16
18
20
22
24
1992 1993 1994 1995 1996 1997 1998 1999 2000 2001 2002 2003 2004 2005 2006
Inst
alle
d C
apac
ity (M
W)
-20%
0%
20%
40%
60%
80%
100%
120%
140%
160%
Inst
alle
d C
apac
ity G
row
th (%
)
Off-Grid Solar PV Capacity (MW)
Grid-Connected Solar PV Capacity
Growth (%)
Off-Grid Solar PV Capacity Growth (%)
Grid-Connected Solar PV Capacity (MW)
Source: International Energy Agency; Scotia Capital.
C A N A D I A N C O N T E N T
Installed grid-connected PV systems in Canada have grown an average of 25% per year since 1995. While the growth rate is half that of the global average, the Canadian market seems to be more interested in off-grid PV applications, which represents over 90% of the total installed PV capacity in Canada (Exhibit 7.51).
Canada has been slow to adopt grid-connected solar power, primarily due to two reasons:
1. The federal and provincial governments of Canada have not offered solar-specific feed-in tariff rates to attract substantial investment in the sector. Ontario is the exception, having offered $420/MWh for solar power since 2006, through its Renewable Energy Standard Offer Program.
2. On average, the levelized cost to produce a MWh of solar PV power in Canada is higher than in southern U.S. states. Why: insolation is lower in Canada than in much of the U.S., requiring more modules to produce an equivalent amount of electricity (Exhibit 7.53).
As at May 31, 2008, there were 198 Ontario Power Authority SOCs issued for solar projects, totalling 470 MW. In Canada, solar projects are considered easier than wind farms to grind through the approvals process as they do not require an environmental assessment. While municipality approval is needed, solar farms are currently allowed to be placed on agricultural- or industrial-zoned land.
In April 2008, SkyPower and SunEdison Canada announced the official groundbreaking of First Light, a 19 MW Ontario-based solar farm that will be one of the largest solar PV parks in North America. With an anticipated commissioning date of Q4/09, First Light will sell its power under an OPA 20-year standard offer contract at $420/MWh.
There are about 200 Ontario Power Authority SOCs issued for solar projects, totalling 470 MW.

Alternative & Renewable Energy August 2008
246
Exhibit 7.52: Insolation Map – North America
Source: Rupprecht & Patashnick Co., Inc.
OptiSolar Canada is developing three Ontario-based solar projects with a combined capacity of 90 MW. Each of the three solar farms (Petrolia @ 20 MW, Sarnia @ 50 MW, and Tillbury @ 20 MW) are expected to be operational in 2010. OptiSolar has an additional 60 MW of signed OPA contracts, although no project announcements have been made to date for these contracts.
Pod Generating Group is developing several Ontario solar projects with a total capacity of 60 MW, primarily near Sault Ste. Marie. The expected installed capital cost of the project is $360 million, or $6 million per MW.
On the supply side, we have provided brief summaries at the end of this section on public Canadian companies involved in the solar supply chain.
E X P E C T S O L A R P V G R I D P A R I T Y I N F I V E T O S E V E N Y E A R S
We see solar PV prices declining quickly over the next decade, while capital costs for fossil fuel-fired and nuclear power plants continue to escalate. Grid parity, the point where the cost of producing PV power becomes equivalent to the cost to produce power from conventional sources, could be achieved by 2013 to 2015. Logically, grid parity will first be achieved in those markets with higher-than-average power prices. Exhibits 7.53 and 7.54 show U.S. locations that may achieve solar PV power grid parity first, assuming that solar costs decline as expected, and that power prices there rise close to 2% per year.

The Choice of a New Generation August 2008
247
Exhibit 7.53: U.S. Retail Power Prices vs. PV (2007)
7.5
9.5
11.7
12.7
12.9
13.2
15.4
16.0
16.3
18.3
19.5
20.2
39.8
0 10 20 30 40 50
Phoenix
Las Vegas
Reno
Santa Monica
San Francisco
Baltimore
Delaw are
Long Island
San Diego
New Haven
New York
Boston
Kauai
US Cents/kWh
Levelized solar PV
cost
Source: Clean Edge; Scotia Capital.
Exhibit 7.54: U.S. Retail Power Prices vs. PV (2015E)
9.5
12.1
14.3
15.4
16.1
16.7
19.5
20.3
20.6
23.2
24.7
25.5
50.4
0 10 20 30 40 50 60
Phoenix
Las Vegas
Reno
Santa Monica
San Francisco
Baltimore
Delaw are
Long Island
San Diego
New Haven
New York
Boston
Kauai
US Cents/kWh
Levelized solar PV
cost
Source: Clean Edge; Scotia Capital.
Exhibit 7.55: We Expect Thin-Film Technologies to Gain Market Share
40%
45%
50%
55%
60%
65%
70%
75%
80%
85%
90%
95%
100%
2000A 2005A 2010E 2015E 2020E
c-Si (mono, multi, ribbon, sheet) CdTe CIS/CIGS a-Si/mc-Si Emerging
Source: CanSia; SEIA; PV Taiwan; Photon Consulting; Solarbuzz; The Solar Trade Association (UK); European Photovoltaic Industry Association; Scotia Capital estimates.
S O L A R P V T R E N D S & O B S E R V A T I O N S
PV companies are moving to thinner silicon wafers and solar cells with higher efficiencies, primarily to reduce silicon costs per kW.
Thin-film solar technologies are regaining market share on crystalline-based technologies, and we expect this trend to continue through the mid-term. Exhibit 7.55 shows the average change over time in solar technology market share based on various consultant and trade association forecasts. If all announced thin-film production capacity increases are realized, almost 6,000 MW of thin-film production could be reached by 2010.
Thin-film solar technologies are regaining market share on crystalline-based technologies.

Alternative & Renewable Energy August 2008
248
Solar PV feed-in tariff rates are declining to force cost reductions for margin preservation. As solar power has not reached grid parity, the market for PV-based electricity is to a large extent dependent on the political framework of a given country.
Some solar PV optimists believe that a massive switch from fossil fuel and nuclear plants to solar power plants could supply over 65% of the U.S.’s electricity and over 35% of its total energy (including transportation) requirements by 2050. Highlights: (1) massive amounts of desert land in the U.S. southwest would be covered with PV panels and solar heating troughs, replacing 300 coal-fired plants and 300 natural gas plants; (2) a direct-current (DC) transmission system would be required to send the energy across the nation; (3) the federal government would need to spend $400 billion to $500 billion over the next 40 years; and (4) cadmium telluride efficiency would need to rise to 14% and installed capital costs to decline to $1.2 million per MW. These modules currently have an efficiency rate of 10% (up 1% over the past year) and have an average installed capital cost of $4 million per MW. Ohio-based First Solar managed to increase the efficiency of the technology to 10% from 6% since 2005. Their goal is to achieve an 11.5% efficiency rate by 2010.
S O L A R S U P P L Y / D E M A N D O U T L O O K : T O O M A N Y ( S I L I C O N ) C O O K S S P O I L T H E ( I N V E S T M E N T ) B R O T H
In our view, the supply/demand imbalance surrounding the tight silicon market of the past several years will likely come to end next year, with a surplus position emerging in 2010. Capacity addition announcements from many suppliers have been driven primarily by a surge in the spot price for solar-grade polysilicon. In 2008, spot prices for polysilicon soared past US$500/kg, and over 16x the US$30/kg level seen in 2004.
The top five polysilicon producers have announced production capacity expansions of over 54,000 tonnes, or more than double current capacity. Additionally, we see at least a further 40,000 tonnes of potential new capacity coming from new entrants and companies that have proposed blended polysilicon solutions.
On the demand side, feed-in tariff price decreases in Germany and Spain, coupled with a 300 MW solar cap in Spain for 2009, will likely stabilize to lower demand growth next year. In 2007, Spain and Germany were the two hottest markets for installed solar PV capacity installations.
In addition to capacity ramp-ups from existing players, new entrant capacity is expected to come online as well, over the next several years. Elkem in Norway, Dow Corning in Brazil, and Timminco are all expected to increase production by blending metals with virgin polysilicon. At a blended rate of 30%, Timminco’s plans alone will account for over 14,000 tonnes of solar grade silicon.
Exhibit 7.56 shows our supply/demand outlook over the next several years.
Solar PV feed-in tariff rates are declining to force cost reductions for margin preservation.

The Choice of a New Generation August 2008
249
Exhibit 7.56: Supply/Demand Outlook for Solar PV Capacity
0
3
6
9
12
15
18
21
24
2003 2004 2005 2006 2007 2008E 2009E 2010E 2011E 2012E
(GW
)
0%
10%
20%
30%
40%
50%
60%
Forecast PV Supply
PV Demand
(High)
PV Demand
(Low)
PV Supply Growth
(%)
Feed-in tariffprices rising
Feed-in tariff prices
declining
Source: CanSia; SEIA; PV Taiwan; Photon Consulting; Solarbuzz; The Solar Trade Association (UK); European Photovoltaic Industry Association; Scotia Capital estimates.
P H O T O V O L T A I C S S C I E N C E & T E C H N O L O G Y 1 0 1
Simply put, photovoltaic technology converts the sun’s energy into electricity, unlike a solar thermal system that generates electricity from hot water. Solar panels, which can be seen on rooftops, the sides of highways, or in solar parks, are packages of interconnected devices known as solar cells. Within a solar cell lies a semiconductor material, traditionally silicon-based, which when hit by photons from the sun, knocks loose electrons that flow through the cell to create electricity.
The solar photovoltaic value chain consists of seven parts: (1) production of a solar-grade semiconductor material such as silicon; (2) casting of ingots; (3) cutting/slicing of ingots into wafers; (4) production of a solar cell; (5) the interconnection of numerous cells to form a module; (6) the packaging or casing of a module, which becomes a solar array; and (7) the installation, testing, and commissioning of the solar PV system. While the above list is representative of a typical solar PV value chain, there are numerous variations to this. Exhibit 7.58 shows a typical production process of a crystalline-based solar system.
Crystalline
Until the turn of the century, the majority of solar cells were made from pure monocrystalline silicon (c-Si), having virtually no defects or impurities. Using the Czochralski process, c-Si is grown from a small crystal that is slowly pulled out of a molten mass (Exhibit 7.57). Polycrystalline silicon (poly-Si), which contains randomly packed grains of c-Si, is produced by slowly cooling a container filled with molten silicon. Cube-shaped ingots are then cut using fine wire saws into thin square wafers. Poly-Si PV cells are easier and less expensive to manufacture than c-Si cells, but are also less efficient.

Alternative & Renewable Energy August 2008
250
Exhibit 7.57: Czochralski Process for Growing Monocrystalline Silicon
Melting of polysilicon; doping.
Introduction of the seed crystal.
Beginning of the crystal growth.
Crystal pulling. Formed Crystal w ith a residue of melted
silicon.
Source: Wikipedia; Scotia Capital.
Edge-defined, film-fed growth (EFG) involves drawing thin ribbons or sheets of multicrystalline silicon (mc-Si). Thin, hollow polygonal tubes of mc-Si are slowly pulled through a die from a “melt” of pure silicon, then cut by laser into individual cells. As the sawing requirements for c-Si, poly-Si, and multi-Si are eliminated, material use/waste is reduced, lowering costs.

The Choice of a New Generation August 2008
251
Exhibit 7.58: Typical Solar PV Panel Production Process
Source: Renewable Energy: Power for a Sustainable Future; Second Edition.

Alternative & Renewable Energy August 2008
252
Exhibit 7.59: Thin-Film Solar Cell Technology
Source: Howstuffworks.com
Exhibit 7.60: A Large Solar Concentrator
Source: Stirling Energy.
Thin-Films
Solar thin-film modules, which typically use one-micron-thick films of materials, are cheaper to manufacture relative to crystalline-based modules. Why: (1) thin-films can generally be much more efficient at absorbing sunlight than “thick” wafers; (2) relatively less PV material is needed, greatly reducing costs; and (3) the production techniques of thin-films are well suited for mass production.
While amorphous silicon (a-Si) has received the most attention to date, performance typically degrades during the first year of operation, stabilizing between 4% and 8%. Some of the most promising thin-film technologies are those based on compound materials such as copper indium diselenide (CIS), copper indium gallium diselenide (CIGS), and cadmium telluride (CdTe). In early 2008, Global Solar Inc. claimed it had achieved a 10% average efficiency rate on a CIGS-based thin-film module. Exhibit 7.59 shows a schematic of typical thin-film solar technology.
Solar Concentrator Systems
Solar concentrator systems likely hold the most promise for utility-scale, grid-connected photovoltaic systems. Why: (1) concentrators reduce the amount of solar cells required to generate an equivalent amount of output; (2) capital
costs are less expensive on a per watt basis; (3) solar concentrators can use a much larger part of the light spectrum than standard solar cells; and (4) the potential exists for relatively larger module sizes than traditional solar PV modules.
In 2007, over 70 MW of new CSP systems were installed globally, and hundreds of CSP-based megawatts are currently being developed. According to the Solar Industries Association (SEIA), more
than 4,000 MW of CSP plants are in the pipeline with signed PPAs, half of which are in Europe.
Concentrator systems use mirrors or lenses to focus incoming solar radiation onto solar cells. Concentration ratios can vary from two to several hundred to 2,500x that of a solar cell. However, in concentrating PV systems, the cells need to be cooled to prevent overheating. High-ratio concentrators use motors that allow the device to track the sun on two axes, ensuring that the cells always receive the maximum amount of solar radiation. One shortfall of concentrator systems is that direct sunlight is required to utilize the system, unlike crystalline technologies. In countries such as Canada, Germany, and the U.K., where a large part of solar radiation is diffuse, solar concentrators may be impractical.

The Choice of a New Generation August 2008
253
Exhibit 7.61: EnviroMission’s Solar Tower
Source: EnviroMission.
Exhibit 7.62: CSEM’s Solar Island Prototype
Source: Solarislands.com; Cleantechnica.com.
E M E R G I N G P H O T O V O L T A I C T E C H N O L O G I E S & C O N C E P T S
Most solar technology R&D is primarily focused on reducing production costs while also increasing energy efficiency levels. The majority of the R&D work that we have seen is chemical based, with new and less expensive materials beginning to replace polysilicon. Here we summarize select emerging solar PV technologies.
Nanoparticle Ink
Nanoparticle ink provides material advantages over both thin-film and crystalline technologies as it reduces material waste, allows production economies of scale, and does not require capital intensive clean-room technology. NanoSolar, a private U.S.-based company, has reportedly achieved 1 GW of production using its proprietary nanoparticle ink that the company says can achieve efficiencies of 14%. It uses a printing press-like technology and deploys ink at over 100 feet per minute.
Solar Paints/Polymers
The New Jersey Institute of Technology has developed a solar cell that can be painted or printed on flexible plastic sheets. The technology is not directed towards large utilities for grid-connection, but the commercialization potential of this low-cost process appears strong. Carbon nanotubes that are combined with technology developed by Konarka Technologies have demonstrated the ability to manufacture solar cells by inkjet printing. Konarka’s technology uses roll-to-roll methods similar to that used by the newspaper industry to print newspapers, which are then printed onto flexible ribbon materials.
Organic Solar Cells
Organic solar cell R&D is booming. However, we do not expect the flexible technology to compete with classic silicon cells as they are not nearly as efficient, for now.
Other Solar Concepts
EnviroMission, an Australia-based public company, is in the process of developing a kilometre-high solar tower that could generate up to 200 MW by using solar thermal energy to turn 34 turbines (Exhibit 7.61). The expected cost of the project has been estimated at $1 billion.
The Swiss Center for Electronics (CSEM) has proposed a solar-island concept, designed to improve the performance of CPV technologies. The island would be up to 5 km wide and supported by a floatation device similar to a very large air mattress. To improve on the limitations of current tracking technology, the entire island would rotate to track the sun. A prototype is currently being developed in the United Arab Emirates and is expected to be completed in Q4/08 (Exhibit 7.62).

Alternative & Renewable Energy August 2008
254
Exhibit 7.63: 5N Plus – Stock Performance
$3.00$5.00$7.00
$9.00$11.00$13.00$15.00$17.00
$19.00$21.00
Dec-07 Feb-08 Apr-08 Jun-08
Pric
e
0
500
1,000
1,500
2,000
2,500
3,000
3,500
4,000
Daily
Vol
ume
(000
s)
VNP (Volume) VNP (Price) SOLEXP (rebased) SPTSX (rebased)
$358.1M
VNP$7.87
$13.49$3.9045.5M
Ticker:Last Price:Market Cap:52 Wk High:52 Wk Low :Shares O/S:
Source: Bloomberg; Scotia Capital.
5 N P L U S I N C .
5N Plus (VNP-T) is a manufacturer of refined metals for use in several applications (primarily solar panels) and is the key supplier of cadmium telluride (CdTe) to one of the leading producers of thin-film technologies, First Solar. In addition to supplying cadmium and telluride, VNP also produces zinc, antimony, and bismuth. VNP has secured long-term supply agreements with several customers, which over the next three years are expected by the company to comprise about 50% of its revenue. One of the key risks of 5N Plus remains its dependence on First Solar, which accounts for over 50% of its current revenue base. VNP’s agreements with First Solar represent the potential to earn up to $37 million per year, depending on volume supplied and other services provided (e.g., recycling). On July 29, VNP announced the opening of its new German facility that will begin shipping cadmium telluride and other products.
A R I S E T E C H N O L O G I E S C O R P O R A T I O N
Arise Technologies (APV-T) operates three business units in the solar value chain: (1) PV Cell Technology; (2) PV Silicon Technology; and (3) PV System Solutions. APV has proprietary technologies in both the cell and silicon divisions and aims to achieve thin-film cell efficiencies between 15% and 20%.
Its proprietary manufacturing process removes several steps from the typical (Siemens) process, which it claims reduces capital and operating costs by more than 50%. Its silicon manufacturing division is not expected to reach 10,400 tonnes per year of capacity until at least 2011. The capital cost of its planned 10,000 tonne per year plant is estimated by the company to range between $0.5 billion to $0.7 billion. In its cell division, Arise anticipates achieving capacity of 560 MW by 2012.
APV’s PV System Solutions unit is focused on Ontario’s Standard Offer Program. The firm intends to implement a vertical integration strategy and use its position at the back end of the solar chain to take advantage of what it sees as a major supply demand imbalance between electricity prices and solar operating costs by 2011/12.

The Choice of a New Generation August 2008
255
Exhibit 7.64: Arise Technologies – Stock Performance
$1.00
$1.50
$2.00
$2.50
$3.00
$3.50
$4.00
$4.50
Dec-07 Feb-08 Apr-08 Jun-08
Pric
e
01,0002,0003,0004,0005,0006,0007,0008,0009,00010,000
Dai
ly V
olum
e (0
00s)
APV (Volume) APV (Price) SOLEXP (rebased) SPTSX (rebased)
$174.4M
APV$1.38
$2.90$1.00
126.4M
Ticker:Last Price:Market Cap:52 Wk High:52 Wk Low :Shares O/S:
Source: Bloomberg; Scotia Capital.
Exhibit 7.65: ATS Automation – Stock Performance
$2.00
$4.00
$6.00
$8.00
$10.00
$12.00
$14.00
Dec-07 Feb-08 Apr-08 Jun-08
Pric
e
02004006008001,0001,2001,4001,6001,8002,000
Daily
Vol
ume
(000
s)
ATA (Volume) ATA (Price) SOLEXP (rebased) SPTSX (rebased)
$563.4M
ATA$7.29
$8.45$3.7177.3M
Ticker:Last Price:Market Cap:52 Wk High:52 Wk Low :Shares O/S:
Source: Bloomberg; Scotia Capital.
A T S A U T O M A T I O N T O O L I N G S Y S T E M I N C .
ATS Automation (ATA-T), through its fully owned subsidiary Photowatt Technologies, manufactures ingots, wafers, cells, and solar modules for the crystalline solar market. The company’s solar division currently operates 60 MW and has capacity expansion plans over the coming years. Higher cell efficiency and lower manufacturing costs returned Photowatt to profitability in its most recent quarter. Additionally, PV Alliance, a JV between Photowatt and a subsidiary of Electricite de France, was formed to increase cell efficiency by a further 2%.
ATS intends to separate its solar division into a stand-alone company upon the implementation of the following initiatives: (1) fix operations in the existing facility in France (i.e., cell efficiency, yield, and profitability); (2) secure silicon feedstock; and (3) prepare for increased scale. Our analyst that covers ATA believes it is difficult to assess the timing of this separation/divesture.

Alternative & Renewable Energy August 2008
256
Exhibit 7.66: Carmanah Technologies – Stock Performance
$0.50
$0.70
$0.90
$1.10
$1.30
$1.50
$1.70
$1.90
Dec-07 Feb-08 Apr-08 Jun-08
Pric
e
01002003004005006007008009001,000
Dai
ly V
olum
e (0
00s)
CMH (Volume) CMH (Price) SOLEXP (rebased) SPTSX (rebased)
$50.7M
CMH$1.20
$1.84$0.7842.2M
Ticker:Last Price:Market Cap:52 Wk High:52 Wk Low :Shares O/S:
Source: Bloomberg; Scotia Capital.
C A R M A N A H T E C H N O L O G I E S C O R P O R A T I O N
Carmanah Technologies (CMH-T) is primarily a solar integrator, delivering stand-alone solar lighting and solar power systems for industrial applications. The company underwent explosive growth from 2001 to 2006, with sales increasing by 20x to $60 million over the five-year period. Since then, CMH has restructured its business, and has divested certain product lines. Part of this restructuring also included the hiring of a new management team as well as the installation of a new board of directors. Going forward, the company plans to focus on: (1) solar LED lighting – used in the marine, aviation, industrial, and traffic markets; and (2) solar power systems, for the oil and gas, telecom, and security markets. Twenty of the top 25 grid-tie solar installations in Canada were completed by Carmanah.
D A Y 4 E N E R G Y I N C .
Day4 Energy (DFE-T) manufactures multicrystalline silicon-based solar PV modules. The company also engages in R&D in support of its Day4 proprietary technology that increases the efficiency of solar modules by reducing the resistance of normal solar panels. Day4 Energy’s cell design has demonstrated 18.5% efficiency, compared with the industry average of 16%.
Since Q3/07, Day4 has operated at full capacity (12 MW), and has a backlog of 153 MW. The backlog is split as follows: 32 MW due in 2008, 55 MW in 2009, and 66 MW in 2010. To meet the surge in demand for its products, Day4 expects to reach 90 MW of capacity by the end of the year. On July 15, DFE announced that it had increased its production capacity by almost 300% to 47 MW, well on its way to meeting its 90 MW target by the end of 2008. DFE has entered into multiple panel supply agreements to meet most of its contracted sales for 2008 and 2009.

The Choice of a New Generation August 2008
257
Exhibit 7.67: Day4 Energy – Stock Performance
$2.00$3.00$4.00$5.00$6.00$7.00$8.00$9.00
$10.00$11.00$12.00
Dec-07 Feb-08 Apr-08 Jun-08
Pri
ce
02004006008001,0001,2001,4001,6001,8002,000
Dai
ly V
olum
e (0
00s)
DFE (Volume) DFE (Price) SOLEXP (rebased) SPTSX (rebased)
$146.7M
DFE$4.00
$7.20$2.9536.7M
Ticker:Last Price:Market Cap:52 Wk High:52 Wk Low :Shares O/S:
Source: Bloomberg; Scotia Capital.
Exhibit 7.68: Opel International – Stock Performance
$0.00
$0.50
$1.00
$1.50
$2.00
$2.50
$3.00
$3.50
$4.00
Dec-07 Feb-08 Apr-08 Jun-08
Pric
e
0
500
1,000
1,500
2,000
2,500
3,000
Dai
ly V
olum
e (0
00s)
OPL (Volume) OPL (Price) SOLEXP (rebased) SPTSX (rebased)
$23.2M
OPL$0.43
$2.48$0.3854.0M
Ticker:Last Price:Market Cap:52 Wk High:52 Wk Low :Shares O/S:
Source: Bloomberg; Scotia Capital.
O P E L I N T E R N A T I O N A L I N C .
Opel International (OPL-V) is a developer of solar concentrating systems and infrared sensor products used in military and industrial applications. OPL’s CPV systems generate up to 40% more kWh than conventional fixed solar panels. Additionally, OPL is developing gallium arsenide processes and semi-conductor microchip products.
The company is still in its infancy, with less than $1 million of revenue in 2007 and no profits to date. However, OPL expects to transition to profitability in 2008. OPL has entered into a long-term supply contract with Boeing-Spectrolab for volume supply of its triple-junction high efficiency solar cells. Additionally, the company recently shipped its first trial installations of its high-density concentrator systems to customers in California and the Czech Republic.

Alternative & Renewable Energy August 2008
258
Exhibit 7.69: Timminco – Stock Performance
$10.00
$15.00
$20.00
$25.00
$30.00
$35.00
$40.00
Dec-07 Feb-08 Apr-08 Jun-08
Pri
ce
02,0004,0006,0008,00010,00012,00014,00016,00018,00020,000
Dai
ly V
olum
e (0
00s)
TIM (Volume) TIM (Price) SOLEXP (rebased) SPTSX (rebased)
$1353.7
TIM$13.00
$35.69$4.95
104.1M
Ticker:Last Price:Market Cap:52 Wk High:52 Wk Low :Shares O/S:
Source: Bloomberg; Scotia Capital.
T I M M I N C O L I M I T E D
Timminco (TIM-T) is a light metals producer with magnesium and silicon operations in Canada, the U.S., Australia, Mexico and Norway. Historically, TIM focused on only magnesium production, but in 2004 entered the solar market with the acquisition of Becancour Silicon. The company has a patented technology that produces a somewhat impure silicon metal that materially reduces the cost of producing solar grade silicon when blended with polysilicon. Timminco is positioning its magnesium business and aluminum wheels investment for divestures as it wants to focus entirely on the solar market.
The Becancour plant, located 125 km southwest of Quebec City, is one of North America's largest silicon production plants. The company’s patented Silbec process produces silicon at substantially lower cost than typical plants, with an expected nominal cost of $10 to $15/kg. TIM has a backlog for all of 2008 production and aims to expand its production capacity to over 14,000 tonnes per year by Q3/09.

The Choice of a New Generation August 2008
259
Exhibit 7.70: Solar PV Chain Valuation Metrics
Sub Sector Company Name TickerLast Price
52-Wk Low
52-Wk High
Shares O/S
Market Cap
Debt/ Equity
Debt/ Assets
Debt/ EBITDA
1-MonthROR
3-MonthROR
1-Year ROR
(8/15/2008) (M) (C$M) (%) (%) (x) (%) (%) (%)
Silicon 5N Plus VNP $7.87 $3.00 $13.49 45.5 $358 3% 2% - -23% -30% -Silicon Timminco TIM $13.00 $4.95 $35.69 104.1 $1,354 6% 4% n.m. -47% -54% 139%Silicon Wacker Chemie WCH €118.73 €110.48 €199.07 52.2 $9,643 12% 5% 0.2x -4% -29% -14%Wafers AXT AXTI US$3.49 US$3.37 US$7.20 30.4 $113 7% 5% 0.7x -22% -28% -25%Wafers LDK Solar LDK US$42.80 US$19.64 US$76.75 106.0 $4,809 125% 36% 5.4x 21% 15% 4%Wafers MEMC WFR US$49.86 US$41.58 US$96.08 225.9 $11,934 1% 1% 0.0x -7% -32% -8%Wafers PV Crystalox PVCS £1.63 £1.03 £2.02 416.7 $1,343 - - - -2% -2% 55%Upstream Canadian Solar CSIQ US$28.26 US$7.08 US$51.80 35.6 $1,067 56% 29% - -10% -37% 289%Upstream Renew able Energy Corp. REC NOK152.75 NOK108.25 NOK306.50 494.3 $14,762 24% 15% 0.9x 6% -13% -21%Cells China Sunergy CSUN US$9.05 US$4.83 US$19.23 39.6 $379 64% 37% 7.2x 22% -37% 26%Cells E-Ton 3452 NT$275.00 NT$137.52 NT$294.50 100.9 $938 190% 63% 14.2x 5% 4% 28%Cells JA Solar JASO US$16.50 US$9.66 US$27.00 154.4 $2,699 39% 25% - 3% -34% 62%Cells Q-Cells QCE €60.03 €44.59 €102.85 112.6 $10,527 23% 16% 1.6x 0% -22% 2%Midstream Daystar Technologies DSTI US$3.27 US$2.35 US$7.71 33.4 $116 - - n.m. 4% -30% -17%Midstream Energy Conversion Devices ENER US$70.07 US$20.47 US$83.33 45.1 $3,345 5% 4% 4.3x 3% 23% 132%Midstream Evergreen Solar ESLR US$9.58 US$7.52 US$18.85 164.7 $1,672 18% 13% n.m. -7% 1% 8%Midstream Motech 6244 NT$171.00 NT$139.63 NT$333.02 249.5 $1,441 21% 16% 1.0x -5% -26% -21%Midstream Solarfun Pow er SOLF US$15.17 US$8.95 US$40.19 53.8 $865 120% 48% - 2% -34% 49%Midstream Suntech Pow er STP US$37.38 US$28.19 US$90.00 153.1 $6,065 159% 56% - 2% -19% 8%Midstream Sunw ays SWW €6.70 €5.90 €10.49 11.4 $119 21% 10% 1.1x -6% -1% -15%Midstream Trina Solar TSL US$30.98 US$25.33 US$68.26 25.6 $841 68% 37% - 1% -37% -32%Modules Carmanah Technologies CMH $1.20 $0.78 $1.84 42.2 $51 - - n.m. 14% 17% -25%Modules Day4 Energy DFE $4.00 $2.95 $7.25 36.7 $147 1% 1% - 8% -32% -Modules First Solar FSLR US$264.92 US$79.23 US$317.00 80.0 $22,468 11% 8% 0.4x -5% -15% 211%Modules XSunX XSNX US$0.38 US$0.29 US$0.74 182.3 $72 - - n.m. -4% -6% 25%Dow nstream Conergy CGY €9.63 €7.85 €69.91 35.1 $526 n.m. 62% n.m. -9% -24% -82%Dow nstream OPEL International OPL $0.43 $0.38 $2.48 54.0 $23 - - n.m. 2% -67% -57%Dow nstream Solar Fabrik SFX €8.95 €8.17 €19.98 11.7 $163 12% 8% 2.3x 1% -17% -47%Dow nstream Solon SOO1 €41.83 €35.00 €94.45 12.5 $816 73% 35% 4.9x -1% -13% -11%Dow nstream SunPow er SPWR US$92.52 US$53.18 US$164.49 85.1 $8,340 44% 23% 3.1x 23% -1% 42%Integrated ARISE Technologies APV $1.38 $0.60 $3.30 126.4 $174 34% 20% n.m. 15% -33% 126%Integrated ATS Automation ATA $7.29 $3.71 $8.45 77.3 $563 6% 4% 0.8x 18% 12% 26%Integrated Ersol Solar Energy ES6 €101.23 €38.79 €105.00 10.7 $1,691 45% 22% 3.0x 1% 57% 64%Integrated Solarw orld SWV €30.25 €21.00 €48.81 111.7 $5,263 90% 37% 2.5x 7% -14% -7%Integrated Yingli Green Energy YGE US$15.64 US$13.11 US$41.50 126.9 $2,103 63% 33% 3.2x -6% -37% 8%
Silicon Average $3,785 7% 4% 0.2x -25% -38% 62%Wafers Average $4,550 45% 14% 2.1x -3% -12% 6%Upstream Average $7,915 40% 22% 0.9x -2% -25% 134%Cells Average $3,636 79% 35% 7.7x 7% -22% 30%Midstream Average $1,808 59% 26% 2.1x -1% -15% 14%Modules Average $5,685 6% 4% 0.4x 3% -9% 70%Downstream Average $1,974 43% 32% 3.5x 3% -24% -31%Integrated Average $1,959 48% 23% 2.4x 7% -3% 43%Total Average $3,337 46% 23% 3.0x 0% -17% 28%
Source: Bloomberg; Scotia Capital.

Alternative & Renewable Energy August 2008
260
Exhibit 7.70 (cont’d): Solar PV Chain Valuation Metrics
Enterprise Value to EBITDA Price to Earnings Price to Sales Price to Cash Flow
Sub Sector Company Name 2008E 2009E 2010E 2008E 2009E 2010E 2008E 2009E 2010E 2008E 2009E 2010E(x) (x) (x) (x) (x) (x) (x) (x) (x) (x) (x) (x)
Silicon 5N Plus 31.3x 14.6x 10.6x 60.2x 24.6x 17.8x 12.0x 6.4x 4.7x n.m. n.m. n.m.Silicon Timminco 27.2x 4.1x 2.6x 60.5x 7.8x 4.8x 5.4x 2.2x 1.6x 35.1x 5.7x 3.8xSilicon Wacker Chemie 5.2x 4.9x 4.3x 11.6x 11.1x 8.8x 1.4x 1.3x 1.2x 6.5x 6.3x 5.4xWafers AXT - - - 18.4x 12.7x - 1.3x 1.1x - - - -Wafers LDK Solar 16.5x 7.9x 5.5x 16.6x 9.9x 5.5x 2.9x 1.9x 1.4x 24.6x 13.5x 9.0xWafers MEMC 8.4x 6.7x 6.4x 12.1x 9.7x 8.7x 4.9x 3.9x 3.6x 10.9x 9.3x 8.2xWafers PV Crystalox 7.5x 5.7x 4.9x 15.2x 13.3x 11.5x 3.4x 2.7x 2.3x n.m. 17.2x 14.8xUpstream Canadian Solar 10.1x 6.6x - 10.4x 7.5x 6.0x 1.0x 0.6x 0.5x n.m. 20.8x -Upstream Renew able Energy Corp. 21.2x 10.6x 6.6x 41.1x 19.9x 12.3x 8.8x 5.1x 3.5x 28.5x 14.6x 9.1xCells China Sunergy 45.4x 11.4x - n.m. 13.7x - 0.9x 0.6x - - - -Cells E-Ton 22.5x 15.2x 12.2x 18.5x 12.4x 9.2x 2.2x 1.5x 1.2x 13.5x 9.5x 8.1xCells JA Solar 13.0x 8.1x 7.4x 17.2x 10.1x 10.9x 2.4x 1.3x 1.2x 14.7x 8.8x -Cells Q-Cells 21.6x 14.3x 10.0x 31.1x 18.7x 13.6x 5.2x 3.2x 2.4x 26.5x 16.6x 11.4xMidstream Daystar Technologies - - - - - - - 8.7x 3.0x - - -Midstream Energy Conversion Devices n.m. 32.3x 20.9x n.m. 46.0x 26.9x 12.6x 7.1x 5.1x n.m. 35.1x 21.6xMidstream Evergreen Solar - 16.6x 7.9x - 22.2x 9.2x 13.7x 3.7x 2.2x n.m. 10.3x 7.5xMidstream Motech 10.7x 7.5x 6.3x 15.0x 10.3x 9.1x 1.8x 1.4x 1.1x 16.7x 8.7x 6.5xMidstream Solarfun Pow er 14.1x 10.3x 7.0x 16.3x 12.5x 9.0x 1.1x 0.8x 0.6x - - -Midstream Suntech Pow er 18.0x 10.8x 7.6x 23.4x 14.2x 10.8x 2.7x 1.9x 1.4x 21.5x 15.6x 8.0xMidstream Sunw ays 5.9x 3.0x 1.9x 16.9x 6.4x 4.3x 0.3x 0.2x 0.2x 12.2x 4.0x -Midstream Trina Solar 8.0x 4.9x 3.5x 10.0x 7.3x 3.9x 1.0x 0.6x 0.5x 7.0x 6.6x 7.1xModules Carmanah Technologies 22.5x 9.3x 7.5x n.m. 15.0x 10.3x 0.9x 0.8x 0.7x 8.3x 10.0x 10.9xModules Day4 Energy - 3.0x 1.6x - 14.7x 4.5x 1.1x 0.4x 0.3x n.m. 13.8x 17.4xModules First Solar 45.8x 24.0x 16.7x 71.3x 38.5x 26.7x 17.4x 9.7x 7.2x 57.8x 30.6x 24.4xModules XSunX - - - - - - - - - - - -Dow nstream Conergy - 10.6x 6.5x - 41.0x 10.2x 0.3x 0.3x 0.2x n.m. 8.4x 5.6xDow nstream OPEL International n.m. n.m. n.m. 31.2x 3.7x 2.4x 0.8x 0.3x 0.2x n.m. 5.8x 2.9xDow nstream Solar Fabrik 6.3x 3.8x 2.9x 10.1x 9.4x 6.1x 0.4x 0.3x 0.3x 8.1x 6.1x 2.5xDow nstream Solon 9.4x 7.3x 6.0x 14.0x 10.6x 8.5x 0.6x 0.4x 0.4x 9.0x 8.1x 9.0xDow nstream SunPow er 29.5x 18.0x 13.5x 41.1x 26.4x 19.9x 5.5x 3.8x 2.8x 80.3x 34.9x 19.0xIntegrated ARISE Technologies - 32.0x 2.9x - - 4.7x 3.9x 0.7x 0.4x n.m. n.m. 4.6xIntegrated ATS Automation 7.9x 6.1x - 17.0x 12.4x - 0.7x 0.6x - 11.8x 8.3x -Integrated Ersol Solar Energy 12.2x 9.3x 7.3x 25.9x 21.1x 17.7x 3.5x 2.6x 1.9x 16.7x 12.1x 12.4xIntegrated Solarw orld 10.5x 8.0x 6.2x 21.9x 16.6x 12.8x 3.8x 2.7x 2.1x 15.8x 12.5x 9.8xIntegrated Yingli Green Energy 10.7x 6.1x 5.0x 15.8x 9.4x 7.4x 1.8x 1.1x 1.1x 14.5x 8.5x 6.4x
Silicon Average 21.2x 7.9x 5.8x 44.1x 14.5x 10.5x 6.3x 3.3x 2.5x 20.8x 6.0x 4.6xWafers Average 10.8x 6.8x 5.6x 15.6x 11.4x 8.6x 3.1x 2.4x 2.4x 17.7x 13.3x 10.7xUpstream Average 15.6x 8.6x 6.6x 25.7x 13.7x 9.2x 4.9x 2.9x 2.0x 28.5x 17.7x 9.1xCells Average 25.6x 12.2x 9.9x 22.3x 13.7x 11.2x 2.7x 1.7x 1.6x 18.3x 11.6x 9.7xMidstream Average 11.3x 12.2x 7.9x 16.3x 17.0x 10.5x 4.8x 3.1x 1.8x 14.3x 13.4x 10.1xModules Average 34.1x 12.1x 8.6x 71.3x 22.7x 13.8x 6.4x 3.6x 2.7x 33.1x 18.1x 17.6xDownstream Average 15.1x 9.9x 7.2x 24.1x 18.2x 9.4x 1.5x 1.0x 0.8x 32.5x 12.7x 7.8xIntegrated Average 10.3x 12.3x 5.3x 20.2x 14.9x 10.6x 2.7x 1.6x 1.4x 14.7x 10.3x 8.3xTotal Average 17.0x 10.7x 7.2x 24.7x 15.9x 10.4x 3.8x 2.4x 1.8x 21.0x 12.9x 9.8x
Source: Bloomberg; Scotia Capital.

The Choice of a New Generation August 2008
261
Exhibit 7.71: Map of Water Power Licences in British Columbia
Source: www.ippwatch.com
Run-of-River – Focus on B.C. O V E R V I E W
BC Hydro estimates there are more than 8,200 commercially viable run-of-river sites in British Columbia with a potential installed capacity of over 12,000 MW, which could generate nearly 50,000 GWh of power per year. However, according to the study commissioned by BC Hydro and the BC Transmission Corporation (BCTC), only 121 of those potential sites would cost less than $100/MWh. About 450 sites would cost between $100/MWh to $150/MWh, while the remaining 7,650+ would produce power at a cost greater than $150/MWh. The development of new transmission lines and road infrastructure could greatly improve the cost effectiveness of many of these projects.
Currently, there are 34 operating run-of-river projects in B.C. (~3,700 GWh/y), 119 granted licences, and 546 licence applications under review at the B.C. Integrated Land Management Bureau (Exhibit 7.71). We estimate that 95% of ILMB waterpower applications are approved.
In the 2006 BC Hydro Call for Tender, the utility awarded 38 electricity purchase agreements (EPAs or PPAs) totalling an estimated 7,350 GWh/y, or 170% more than its initial request. Twenty-nine of the 38 PPAs went to run-of-river projects. Details of the 2006 BC Hydro CFT can be reviewed in Appendix 3.
In 2006, 29 of 38 awarded power purchase contracts in B.C. went to run-of-river hydro.

Alternative & Renewable Energy August 2008
262
Exhibit 7.72: Run-of-River Cost Breakdown
Cost Metric Low Average HighConstruction per MW $2.00M $2.65M $3.30M
" per GWh/y $0.60M $0.80M $1.00MOperating per GWh $7,000 $11,500 $16,000Maintenance per GWh $800 $2,100 $3,400Levelized per MWh $65 $98 $130
Source: Scotia Capital estimates.
T E R R I F I C O U T L O O K F O R B . C . R U N - O F - R I V E R P R O J E C T S
In the 2007 B.C. Energy Plan, several policy action items stood out as favourable for the growth of renewable power in the province: (1) electricity self-sufficiency by 2016, plus “insurance” power to supply unexpected demand thereafter; (2) ensure clean or renewable generation continues to represent at least 90% of total generation; (3) no nuclear power; (4) establish a standing offer contract for sub-10 MW clean energy projects; and (5) all new electricity generating facilities constructed in B.C. will be required to achieve net zero green house gas emissions.
As a result of the 2007 B.C. Energy Plan, the following initiatives are either under way, or we believe will be announced within the next 12 months:
• 2008 BC Hydro Clean Power Call 5,000 GWh/y
• 2009/10 BC Hydro Clean Power Call 5,000 GWh/y?
• Standing Offer Program No limit and no expiry date. The need for total or annual volume caps will be reviewed after the first two years of the program. Additionally, BC Hydro will provide a one-year notice to developers prior to the program being cancelled.
• BC Hydro Bioenergy Call for Power 1,000 GWh/y for Phase I, and an undetermined amount for Phase II. While this call is not directly applicable to run-of-river, it is important to note that bioenergy-based IPPs that might have otherwise bid against run-of-river projects in Clean Power Calls or the Standing Offer Program have essentially been removed as direct run-of-river project competition.
R U N - O F - R I V E R P R O J E C T E C O N O M I C S : D I S T I N G U I S H I N G T H E G O O D F R O M T H E N O T S O G O O D
Excluding soft costs such as insurance, transmission, and financing, the average capital cost of building a run-of-river generating facility in B.C. is approximately $2.65 million per MW. Installed capital costs can come in as high as $3.3 million or as low as $2 million per MW. Plutonic Power has set an early estimate for its two bids into the Clean Power Call at about $4 billion for 1,047 MW, or $3.82 million per MW, which includes all infrastructure and soft costs.
While capital cost per installed MW is an industry standard metric widely used for evaluating back-of-the-envelope project economics, we believe that a more accurate metric is installed capital costs per GWh per year, as projects have wide-ranging capacity factors. According to Plutonic Power, a good run-of-river project will cost in the $0.6 million area per GWh/y, while a project costing $1 million per GWh/y is considered expensive.
Operating costs, including water rental, property taxes, insurance, etc., but excluding First Nations royalty payments, average about $11,500/GWh, in a range from $7,000 to $16,000/GWh. First Nations payment structures are company-specific or even project-specific and vary substantially.
While maintenance costs vary throughout the year, $2,100/GWh is a reasonable point estimate. On the low end, maintenance costs can drop to $800/GWh. Conversely, these costs can reach as high as $3,400/GWh.
A good run-of-river project will cost about $0.6 to $0.8 million per GWh/y.

The Choice of a New Generation August 2008
263
On an “all-in” basis, the average levelized cost per MWh for a run-of-river project is just under $100/MWh. Excluding outliers, the lower and upper bounds of levelized costs for run-of-river projects range between $65/MWh and $130/MWh (Exhibit 7.72). This compares quite favourably with other sources of renewable power generation.
R U N - O F - R I V E R E Q U I T Y R E T U R N S A R E Q U I T E S T R O N G : M O D E L L I N G & S E N S I T I V I T Y A N A L Y S E S O F A R U N - O F - R I V E R P R O J E C T
In our opinion, run-of-river power projects offer equity investors IRRs slightly below that of geothermal power projects, but in line with its lower technology risk. We modelled a generic run-of-river project, and sensitized for variations in (1) PPA prices and escalation rates; (2) capital costs and costs of capital; (3) emission reduction credits or offsets; (4) the federal ecoENERGY incentive payment; (5) operating & maintenance costs; (6) capacity factor; and (7) tax rates. Our average generic run-of-river project yielded a 14.9% equity IRR. To arrive at this, we made the following assumptions:
• 50% capacity factor. Our research results revealed a wide run-of-river capacity factor range of 35% to 65%, much lower than geothermal’s 90% to 95% average capacity, but almost double the average capacity factor of wind power in Canada. While our 50% assumption is higher than Plutonic Power’s weighted average forecast capacity of just under 40%, we chose to use the midpoint of the range.
• $4 million per MW installed cost. In our $4 million estimate, we have included costs associated with transmission access as well as other soft costs. Capital costs generally range from $2 million per MW to $3.3 million per MW, although we expect these costs to rise slightly over time. For now, we have used Plutonic’s early estimate of $4 billion for its ~1,000 MW of run-of-river projects it intends to submit into the Clean Power Call.
• Starting PPA @ $120/MWh + 1.25% p.a. For PPAs issued in the BC Hydro 2008 Clean Power Call, we estimate the average inflation-adjusted starting power price in a project’s first full year of operations will range between $110/MWh and $120/MWh ($2009E). We chose the upper end of the range.
• Starting O&M @ $12/MWh + 1.25% p.a. Operating and maintenance cost estimates (and actuals) have ranged between $7/MWh to $20/MWh. We used a weighted average cost of $12/MWh.
• Federal ecoENERGY incentive. We applied a $10/MWh ecoENERGY federal incentive payment on our generic project’s first 10 years of operation, with no adjustments for inflation, and to a maximum of $80 million.
• Emission reduction credits @ $0/MWh. In the BC Clean Power, all green attributes (i.e., ERCs) will go to BC Hydro, with no credit going to the IPP.
• Debt to equity split 75%/25%. This is in line with most current and proposed run-of-river project capital structures that we have seen. We assume the debt is non-recourse (project specific). Equity investors in renewable projects (excluding geothermal) have historically required 10% annual returns, with most falling in the 8% to 12% range. We use 10%.
• Other. We matched the term of debt financing to a 30-year PPA term.
In Exhibit 7.73, we provide our equity investment IRR sensitivity analyses to changes in the factors listed above.
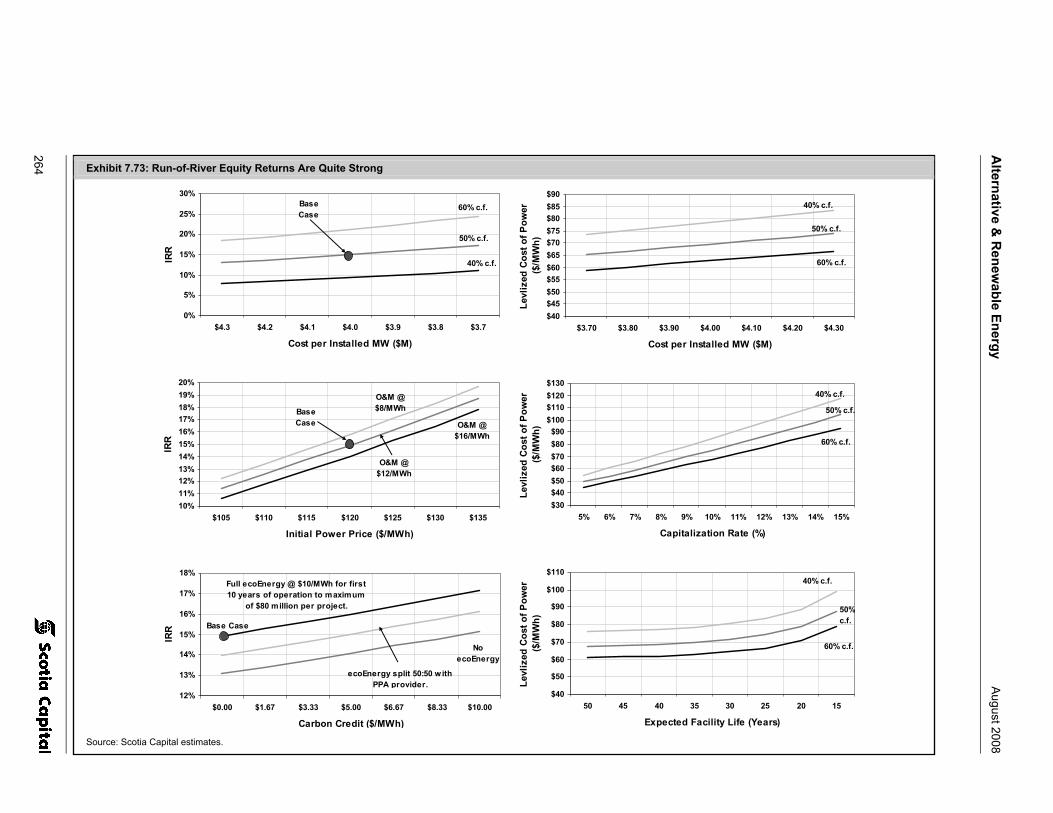
Alternative &
Renew
able Energy A
ugust 2008
264 Exhibit 7.73: Run-of-River Equity Returns Are Quite Strong
0%
5%
10%
15%
20%
25%
30%
$4.3 $4.2 $4.1 $4.0 $3.9 $3.8 $3.7
Cost per Installed MW ($M)
IRR
40% c.f.
50% c.f.
60% c.f.Base Case
10%11%12%13%14%15%16%17%18%19%20%
$105 $110 $115 $120 $125 $130 $135
Initial Power Price ($/MWh)
IRR
Base Case O&M @
$16/MWh
O&M @ $8/MWh
O&M @ $12/MWh
12%
13%
14%
15%
16%
17%
18%
$0.00 $1.67 $3.33 $5.00 $6.67 $8.33 $10.00
Carbon Credit ($/MWh)
IRR
ecoEnergy split 50:50 with PPA provider.
No ecoEnergy
Full ecoEnergy @ $10/MWh for first 10 years of operation to maximum
of $80 million per project.
Base Case
$40$45$50$55$60$65$70$75$80$85$90
$3.70 $3.80 $3.90 $4.00 $4.10 $4.20 $4.30
Cost per Installed MW ($M)
Levl
ized
Cos
t of P
ower
($
/MW
h)
50% c.f.
60% c.f.
40% c.f.
$30$40$50$60$70$80$90
$100$110$120$130
5% 6% 7% 8% 9% 10% 11% 12% 13% 14% 15%
Capitalization Rate (%)Le
vliz
ed C
ost o
f Pow
er
($/M
Wh)
50% c.f.
60% c.f.
40% c.f.
$40
$50
$60
$70
$80
$90
$100
$110
50 45 40 35 30 25 20 15
Expected Facility Life (Years)
Levl
ized
Cos
t of P
ower
($
/MW
h)
50% c.f.
60% c.f.
40% c.f.
Source: Scotia Capital estimates.

The Choice of a New Generation August 2008
265
Exhibit 7.74: Run-of-River Equity Returns Are Quite Strong
14.9% $105 $110 $115 $120 $125 $130 $135$18 10.3% 11.4% 12.5% 13.7% 14.8% 16.1% 17.3%$16 10.7% 11.8% 12.9% 14.1% 15.3% 16.5% 17.8%$14 11.0% 12.2% 13.3% 14.5% 15.7% 17.0% 18.2%$12 11.4% 12.6% 13.7% 14.9% 16.2% 17.4% 18.7%$10 11.8% 13.0% 14.1% 15.4% 16.6% 17.9% 19.2%$8 12.2% 13.4% 14.6% 15.8% 17.1% 18.4% 19.7%$6 12.6% 13.8% 15.0% 16.2% 17.5% 18.8% 20.2%
##### $4.3 $4.2 $4.1 $4.0 $3.9 $3.8 $3.735% 5.6% 6.0% 6.4% 6.8% 7.3% 7.8% 8.3%40% 7.9% 8.4% 8.9% 9.4% 9.9% 10.5% 11.1%45% 10.4% 10.9% 11.5% 12.1% 12.7% 13.4% 14.1%50% 12.9% 13.5% 14.2% 14.9% 15.7% 16.5% 17.3%55% 15.6% 16.3% 17.1% 17.9% 18.8% 19.8% 20.8%60% 18.4% 19.3% 20.2% 21.1% 22.2% 23.2% 24.4%65% 21.4% 22.4% 23.4% 24.5% 25.7% 26.9% 28.2%
14.9% 8.00% 7.50% 7.00% 6.50% 6.00% 5.50% 5.00%35% 8.8% 9.8% 10.9% 12.1% 13.3% 14.6% 15.9%30% 9.6% 10.7% 11.8% 13.0% 14.3% 15.7% 17.1%25% 10.4% 11.5% 12.7% 14.0% 15.3% 16.8% 18.2%20% 11.2% 12.3% 13.6% 14.9% 16.3% 17.8% 19.4%15% 11.9% 13.1% 14.4% 15.8% 17.3% 18.9% 20.5%10% 12.6% 13.9% 15.3% 16.7% 18.3% 19.9% 21.7%5% 13.3% 14.7% 16.1% 17.7% 19.3% 21.0% 22.8%
14.9% $0.00 $1.67 $3.33 $5.00 $6.67 $8.33 $10.00$0.0 13.1% 13.4% 13.7% 14.1% 14.4% 14.8% 15.1%$2.5 13.5% 13.9% 14.2% 14.5% 14.9% 15.3% 15.6%$5.0 14.0% 14.3% 14.7% 15.0% 15.4% 15.7% 16.1%$7.5 14.4% 14.8% 15.2% 15.5% 15.9% 16.2% 16.6%
$10.0 14.9% 15.3% 15.6% 16.0% 16.4% 16.8% 17.1%
Starting PPA Price ($/MWh)
Installed Capital Cost ($M/MW)
Cost of Debt (%)
Carbon price ($/REC or $/ERC or $/MWh)
Starting O&M Cost ($/MWh)
Capacity Factor (%)
Effective Cash Tax Rate (%)
ecoEnergy ($/MWh)
Source: Scotia Capital estimates.

Alternative & Renewable Energy August 2008
266
Exhibit 7.75: Run-of-River Capital Costs Are 10%-30% Cheaper than Wind Power, per MWh
-0.4 $1.50 $1.75 $2.00 $2.25 $2.50 $2.75 $3.0040.0% 60% 37% 20% 7% -4% -13% -20%37.5% 50% 29% 13% 0% -10% -18% -25%35.0% 40% 20% 5% -7% -16% -24% -30%32.5% 30% 11% -3% -13% -22% -29% -35%30.0% 20% 3% -10% -20% -28% -35% -40%27.5% 10% -6% -18% -27% -34% -40% -45%25.0% 0% -14% -25% -33% -40% -45% -50%22.5% -10% -23% -33% -40% -46% -51% -55%20.0% -20% -31% -40% -47% -52% -56% -60%
Wind Capacity
Factor (%)
Wind Installed Capital Cost ($M/MW)
Source: Scotia Capital estimates.
Exhibit 7.76: Run-of-River Installed Capital Cost Breakout
Construction & Materials
75%
Working Capital4%
Financing10%
Development4% Other
7%
Source: Company reports; Scotia Capital estimates.
R U N - O F - R I V E R C A P I T A L C O S T S P E R M W H A R E A M O N G T H E L E A S T E X P E N S I V E
Run-of-river capital costs generally range between $2.5 million to $3 million per MW, depending on project size, transmission requirements, site accessibility, and infrastructure costs. We have seen outliers as high as $3.5 million per installed MW, and as low as $2 million per installed MW. Increasing labour,
commodity, and material costs will likely put pressure on installed capital costs in the near term. Plutonic estimates its project could cost about $4 million per MW.
In our opinion, run-of-river installed capital costs (including transmission access) are 10% to 30% less expensive than wind power, when comparing expected annual generation per technology. Exhibit 7.75 sensitizes the run-of-river discount relative to wind power that has a materially lower capacity factor. Using a mid-point installed capital cost of $2.125 million per MW and a 27.5% average capacity factor, we see that run-of-river is 22% less expensive than wind, on a per GWh/y basis.
We estimate that up to 80% of run-of-river installed capital costs go towards equipment, construction, and infrastructure (including transmission access). The remainder is spread among financing costs, working capital requirements, as well as contingencies, property taxes, royalty payments, land lease, and insurance costs (Exhibit 7.76).
The levelized cost for run-of-river power production ranges from as low as $30/MWh to as high as $130/MWh, averaging over $70/MWh, although we expect this to increase in the near term.
I N V E S T M E N T P O S I T I V E S
• Reliability. Unplanned outage rates for run-of-river hydro plants are among the lowest in the electricity generating industry. Typical small hydro equipment has very few moving parts, resulting in a long asset life with low maintenance requirements when compared with other technologies.
• Low and predictable operating costs with no fuel risk. With no fuel costs, the cost structure of run-of-river facilities are significantly different and less expensive (on a per MWh basis) than fossil-fueled power plants. Additionally, most facilities can be operated remotely from a control centre.
• Higher capacity factor than wind power. Run-of-river capacity factors generally range between 40% and 60%, while wind power capacity factors range between 25% and 35%. Wind power capacity factors are rising with the emergence of more efficient technologies, while run-of-river capacity factors are flat.
• Low environmental impact. Small hydro generation produces almost no greenhouse gas emissions that can have harmful effects on the environment. Also, as run-of-river facilities typically do not have significant storage capacity, there is no risk of upstream flooding or the possibility that the seasonality of water flow within a given area may change.
Run-of-river installed capital costs per GWh/y are 10% to 30% less expensive than that of wind power.
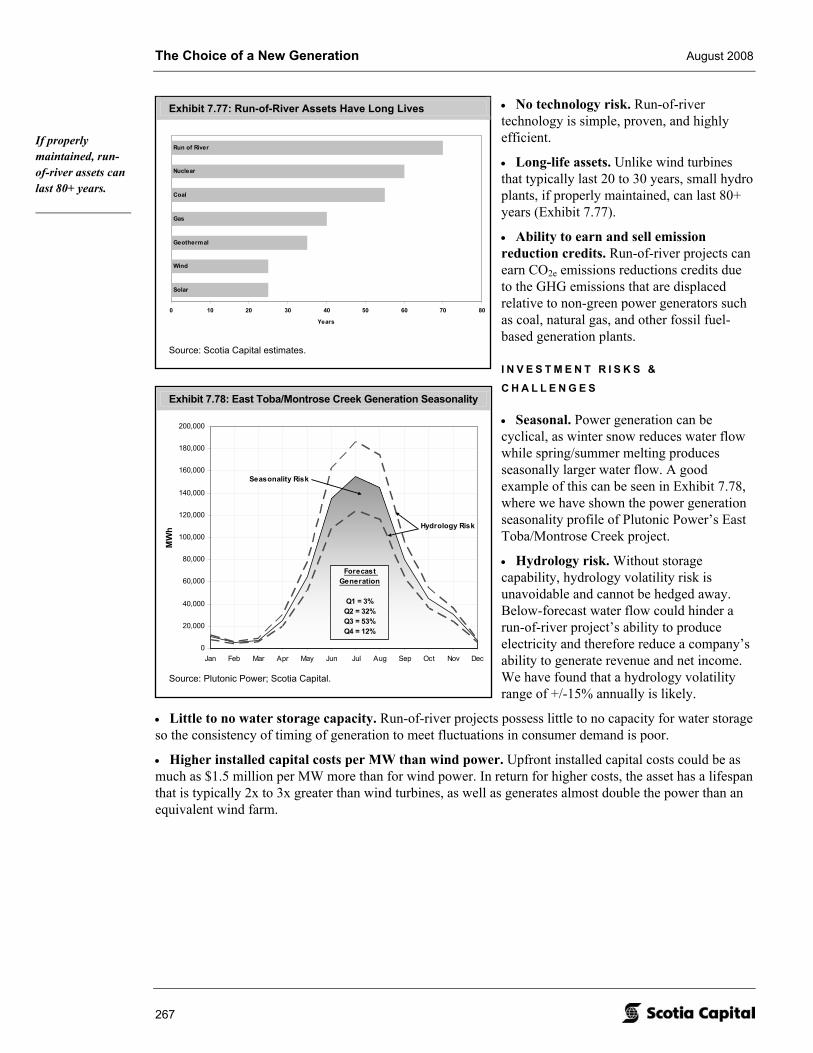
The Choice of a New Generation August 2008
267
Exhibit 7.78: East Toba/Montrose Creek Generation Seasonality
0
20,000
40,000
60,000
80,000
100,000
120,000
140,000
160,000
180,000
200,000
Jan Feb Mar Apr May Jun Jul Aug Sep Oct Nov Dec
MW
h Hydrology Risk
Forecast Generation
Q1 = 3%Q2 = 32%Q3 = 53%Q4 = 12%
Seasonality Risk
Source: Plutonic Power; Scotia Capital.
Exhibit 7.77: Run-of-River Assets Have Long Lives
Solar
Wind
Geothermal
Gas
Coal
Nuclear
Run of River
0 10 20 30 40 50 60 70 80
Years
Source: Scotia Capital estimates.
• No technology risk. Run-of-river technology is simple, proven, and highly efficient.
• Long-life assets. Unlike wind turbines that typically last 20 to 30 years, small hydro plants, if properly maintained, can last 80+ years (Exhibit 7.77).
• Ability to earn and sell emission reduction credits. Run-of-river projects can earn CO2e emissions reductions credits due to the GHG emissions that are displaced relative to non-green power generators such as coal, natural gas, and other fossil fuel-based generation plants.
I N V E S T M E N T R I S K S &
C H A L L E N G E S
• Seasonal. Power generation can be cyclical, as winter snow reduces water flow while spring/summer melting produces seasonally larger water flow. A good example of this can be seen in Exhibit 7.78, where we have shown the power generation seasonality profile of Plutonic Power’s East Toba/Montrose Creek project.
• Hydrology risk. Without storage capability, hydrology volatility risk is unavoidable and cannot be hedged away. Below-forecast water flow could hinder a run-of-river project’s ability to produce electricity and therefore reduce a company’s ability to generate revenue and net income. We have found that a hydrology volatility range of +/-15% annually is likely.
• Little to no water storage capacity. Run-of-river projects possess little to no capacity for water storage so the consistency of timing of generation to meet fluctuations in consumer demand is poor.
• Higher installed capital costs per MW than wind power. Upfront installed capital costs could be as much as $1.5 million per MW more than for wind power. In return for higher costs, the asset has a lifespan that is typically 2x to 3x greater than wind turbines, as well as generates almost double the power than an equivalent wind farm.
If properly maintained, run-of-river assets can last 80+ years.

Alternative & Renewable Energy August 2008
268
Exhibit 7.79: Schematic of a Typical Run-of-River Facility
Source: Plutonic Power.
H O W Q U I C K L Y A G R E A T P R O J E C T C A N F A L L A P A R T
Run-of-River Power’s 180 MW Pitt River project was effectively terminated earlier this year due to B.C. Minister Barry Penner’s decision not to issue a park boundary adjustment that was required for the project to proceed. ROR’s CEO previously stated that the project would not proceed without a park boundary adjustment, as there was no other feasible (i.e., economic) alternative. Additionally, while the project is still awaiting an environmental approval certificate, the Outdoor Recreation Council recently named the Upper Pitt the most endangered river in B.C. in 2008 due to threat to the local fish habitat. We note that project itself was not rejected, just the power line route through a provincial park, which environmentalists strongly opposed. If the project is ever reshaped and proceeds, the seven sites of the project are expected by the company to generate 557 GWh/y. Following the announcement by the B.C. Minister, ROR’s stock fell by 60%+ from its previous 2008 high of 58¢ per share.
R U N - O F - R I V E R S C I E N C E & T E C H N O L O G Y 1 0 1
Simply put, a run-of-river power facility diverts some of a river’s flow to power-producing turbines, returning the water back to the river, downstream of the turbines (Exhibit 7.79). Most run-of-river hydro projects include the following:
• Headpond. A small dam that floods a sufficient area to ensure that the intake to the penstock is under water. Headponds typically do not store water.
• Penstock. A buried pipe system that delivers water from the headpond to the lower-elevation turbines. Penstocks can range from two kilometres to 10 kilometres long, but are generally three to four kilometres.
• Powerhouse. A building that contains one or more turbines. The moving water turns the turbine blades that spin electromagnets inside a collar of conductors, which generates power.
• Tailrace. A channel that returns the diverted water back to the river system.
Unlike large-scale hydro, run-of-river technology is flexible enough that it can be constructed around difficult terrain, rather than the other way around.

The Choice of a New Generation August 2008
269
R U N - O F - R I V E R C A P A C I T Y D E V E L O P M E N T P R O C E S S & T I M E L I N E
Constructing a run-of-river project into a cash generating operational asset typically takes two dry seasons, but varies on the size of the project as well as infrastructure requirements. Before construction of a run-of-river facility can commence, a PPA is required, as well as over 50 permits and approvals from multiple government agencies. These permits, approvals, and reviews can include water and land licences, environmental evaluations such as the impact on local fish habitat, and conflicts with wildlife. The entire process is complex. As an example, we have outlined in Appendix 2 the 10 steps required by Land and Water British Columbia (LWBC) to develop a run-of-river power project. Additionally, Appendix 1 shows the environmental assessment process. Generally, the sequence of steps are as follows:
1. Site selection. When selecting a site for run-of-river power project development, the following factors are favoured: (1) a large and divertible water stream; (2) a high head that results in less flow required; (3) close proximity to transmission lines; and (4) site accessibility. Determining the feasibility of developing a site consists of reviewing topographic maps, conducting detailed hydrology studies and stream flow measurements, determining water quality, and in-stream fish flow requirements.
2. Costs. Costs for developing a run-of-river project generally fall into three categories: (1) development; (2) construction; and (3) annual. Initial development costs typically include feasibility studies, and application fees and related expenses. Construction costs include engineering, equipment, infrastructure, owner’s costs, and contingency costs (about 10%). Annual costs include financing, land leases, property taxes, water rental, insurance premiums, transmission line maintenance, and general administration costs.
3. Permitting process. Permitting and licensing requirements can involve a wide variety of issues such as legal, compliance, public safety, environmental concerns, and First Nations consultation. Permitting can take a year or longer, depending on the project’s complexity and location. Before a run-of-river hydro project can be built, it typically requires over 50 permits, licences, reviews, and approvals, from up to 14 regulatory bodies, including federal, provincial, local, and aboriginal.
4. Grid interconnection. Interconnection refers to the connection of a generation source to a transmission network. All IPPs must have an interconnection agreement, which provides the technical and legal requirements of physical connection. Essentially, the utility is attempting to ensure that connections to its system are made in a manner that: (1) provides adequate protection from electrical faults; (2) ensures the quality of power provided meets industry standards; (3) follows established notification protocols; and (4) meets its requirements in terms of power quantity.
5. Energy sales. To sell power in most provinces, an IPP must enter into a power purchase agreement with either a provincial utility or another energy purchaser, such as TransAlta. Contracting for the sale of energy output is typically focused on price, quantity, and duration. An IPP can find a buyer for its electricity in two ways: (1) an unsolicited proposal; or (2) a response to a request for proposal (RFP).
6. Construction. The construction phase of a project is usually completed under a fixed-price contract and can average between two to three years, depending on the size of the project and infrastructure requirements.
7. Operation and maintenance. Ongoing operation, maintenance, and surveillance are required to keep a plant running smoothly.
On the following pages, we have summarized pure-play, or mostly pure-play, run-of-river public and private companies that are currently not under Scotia Capital research coverage.
Constructing a run-of-river project into a cash generating operational asset typically takes two dry seasons.

Alternative & Renewable Energy August 2008
270
Exhibit 7.80: 7.6 MW Brandywine Project
Source: Run of River Power Inc.
Exhibit 7.81: Run Of River Power – Stock Performance
$0.10$0.20$0.30$0.40$0.50$0.60$0.70$0.80$0.90$1.00$1.10
Dec-07 Feb-08 Apr-08 Jun-08
Pri
ce
01002003004005006007008009001,000
Dai
ly V
olum
e (0
00s)
ROR (Volume) ROR (Price) STUTIL (rebased) SPTSX (rebased)
$14.1M
ROR$0.215
$0.60$0.2065.7M
Ticker:Last Price:Market Cap:52 Wk High:52 Wk Low :Shares O/S:
Source: Bloomberg; Scotia Capital.
R U N O F R I V E R P O W E R I N C . ( R O R - V )
In 2005, Run of River Power Inc. (ROR) began operating its first B.C.-based run-of-river project, the 7.6 MW Brandywine Creek project. Producing over 40 GWh/y of electricity, the project’s capacity factor is about 60%, and produces over $2 million in annual revenue. Additionally, Brandywine Creek displaces over 12,000 tonnes of CO2e annually. The company has a current market capitalization of about $14 million. ROR hopes to build its portfolio to almost 700 MW of installed renewable capacity in B.C.
Projects Worth Watching
First, the company is developing a three-project cluster, known as the Mamquam Projects, located about 70 km from Vancouver, that could total 40 MW of installed capacity. Second, Run of River Power could bid its Pitt River Project into BC Hydro’s Clean Power Call, with an estimated potential installed capacity of 180 MW. Third, and further down the pipeline, is the 6 MW Dewdney Creek prospect, estimated to generate 28 GWh/y, as well as the 10 MW Gott Creek project, forecast by Run of River Power to produce up to 53 GWh/y.

The Choice of a New Generation August 2008
271
Exhibit 7.82: Synex’s Project Portfolio
Source: Synex Energy.
S Y N E X I N T E R N A T I O N A L I N C . ( S X I - T )
Synex Energy, a wholly owned subsidiary of Synex International, has been developing energy projects for 25 years. It currently owns and operates a 3.8 MW run-of-river facility at Mears Creek that was constructed in 2003 for less than $7 million, or about $1.8 million per installed MW. Also, Synex holds a 12.5% interest in the 6.5 MW China Creek power plant, and owns the recently completed Kyuquot regulated utility, which is a mixed overhead/submarine cable connecting the Kyuquot region to the BC Hydro integrated grid. Over the past few years, Synex has also developed and sold several projects in both Canada and the U.S.
Projects Worth Watching
Construction is under way on the 100% owned, 2.8 MW Cypress Creek project, located near Gold River on Vancouver Island. Synex also received two BC Hydro 2006 CFP EPAs for its 4 MW Barr Creek hydro project and for its 10 MW Victoria Lake project. Commercial operation dates for these projects range between 2009 to 2010. Additionally, the company intends on submitting various developments such as its 5 MW McKelvie Creek hydro project into BC Hydro’s Standing Offer Program for sub-10 MW projects. Exhibit 7.82 shows a map of the company’s present and future operations.

Alternative & Renewable Energy August 2008
272
Exhibit 7.83: Synex International – Stock Performance
$0.50
$0.55
$0.60
$0.65
$0.70
$0.75
Dec-07 Feb-08 Apr-08 Jun-08
Pri
ce
020406080100120140160180200
Dai
ly V
olum
e (0
00s)
SXI (Volume) SXI (Price) STUTIL (rebased) SPTSX (rebased)
$16.0M
SXI$0.57
$0.66$0.5028.0M
Ticker:Last Price:Market Cap:52 Wk High:52 Wk Low :Shares O/S:
Source: Bloomberg; Scotia Capital.
C L O U D W O R K S E N E R G Y I N C .
Formed in 1999, Cloudworks Energy is a private, Vancouver-based company engaged in the development, ownership, and operation of run-of-river energy projects. In July 2006, Cloudworks was awarded EPAs for six projects in the 2006 BC Hydro Call for Power. The awarded projects, grouped under the name Harrison Hydro LP, are all run-of-river facilities that are forecast by management to produce up to 530 GWh/y of electricity. Additionally, the company has numerous water licence applications for other B.C. run-of-river projects. Completion of the Harrison Hydro portfolio is slated for late 2010.
H Y D R O M A X E N E R G Y L T D .
Hydromax is a wholly owned subsidiary of ENMAX Corporation that develops potential run-of-river hydro projects. In the 2006 BC Hydro CFP, Hydromax was awarded long-term EPAs for its 10 MW Lower Clowhom and 10 MW Upper Clowhom projects. Total generation is expected to be 93 GWh/y, representing a 53% capacity factor. Commissioning of the projects is expected to occur in late 2009.
N O V A G R E E N P O W E R I N C .
In August 2006, NovaGold acquired Coast Mountain Power, a run-of-river developer with 335 MW of projects under development. The company’s largest asset is the Forrest Kerr run-of-river project, designed to generate and transmit up to 115 MW (600 GWh/y) of power onto the grid. In addition to a 15-year BC Hydro EPA, the project has received all approvals and permits required for construction. In mid-2008, NovaGreenPower determined that its Forrest Kerr project capacity could be increased to 195 MW. As a result, the company intends to submit up to 80 MW in the BC Hydro Clean Power Call.
On July 31, AltaGas Income Trust acquired 100% of NovaGreen Power Inc. for approximately $40 million.
R E G I O N A L P O W E R I N C .
Regional Power, a subsidiary of Manulife Financial, has been developing, building, refurbishing, and operating hydro power plants for over 20 years. Currently, Regional operates six hydro plants with a total capacity of 36 MW. The company also has six projects with PPAs that total over 120 MW (three in B.C., two in Ontario, and one in Quebec). Additionally, Regional has the rights to five other sites with an aggregate capacity of 207 MW.

The Choice of a New Generation August 2008
273
Exhibit 7.84: World Geothermal Regions
Source: U.S. Geological Survey.
Geothermal Power – Mining for Heat O V E R V I E W
The global geothermal energy potential is enormous, and represents about 35 billion times the world’s annual energy consumption. However, current economics limit geothermal exploitation to a maximum depth of 6 km below the surface of the earth, which corresponds to a much smaller amount of recoverable energy. Exhibit 7.84 shows the primary regions of the world where total heat flow and the concentration of geothermal energy are highest.
Western U.S. states boast about 3,000 MW of installed geothermal capacity, or about one-third of global capacity. Of this amount, California has over 2,500 MW of capacity, meeting 5% of the state’s electricity generation requirements. There are 13,000 MW of known and exploitable geothermal resources in western U.S. states, 5,600 MW of which are located in California and Nevada.
The cost of geothermal energy is dropping fast. Since 1980, geothermal generation facility capital costs have declined by 50%, or at a much faster rate than that of coal-fired plants. The U.S. Energy Information Administration (EIA) places geothermal energy at a lower levelized cost than natural gas, wind, biomass, nuclear, and solar (both thermal and photovoltaic).
Geothermal power development is accelerating. We see over 3,300 MW of U.S. geothermal generation capacity at various development stages. Of this amount, 251 MW of capacity is under construction, and another 20 to 30 projects totalling between 700 MW and 1,000 MW are in the process of either securing PPAs or under final drilling and facility construction.
Geothermal development in the U.S. is accelerating while development in Canada has been disappointing to date.

Alternative & Renewable Energy August 2008
274
Exhibit 7.85: Ring of Fire
Source: U.S. Geological Survey.
Exhibit 7.86: Canada’s Geothermal Potential
Source: Geological Survey of Canada.
C A N A D I A N G E O T H E R M A L D E V E L O P M E N T D I S A P P O I N T I N G T O D A T E
Canada remains the only country in the Ring of Fire not to exploit geothermal-based power generation (Exhibit 7.85). Only a couple of companies have geothermal exploration rights in Canada, but
no clear date remains as to when these projects will become commercial. Over the past several decades, federal and provincial governments, B.C. in particular, did not bother with geothermal power development due to a readily available and inexpensive power supply. Today B.C. is a net importer of electricity.
The Meager Mountain area in B.C. is the most significant geothermal energy discovery in Canada. In addition to Western GeoPower’s South Meager project, which could result in 30 MW to 35 MW of installed capacity, Gaea Energy, a privately held geothermal development company, holds three exploration permits near Pebble Creek, B.C., which were acquired in 2002 to 2004.
The Canadian Geothermal Energy Association (CanGEA) believes geothermal projects in B.C. alone could amount to between 3,000 MW to 5,000 MW. Additionally, Alberta, Yukon, and the Northwest Territories have a further 1,000 MW to 2,500 MW of economic geothermal capacity available for potential exploitation (Exhibit 7.86). We think this is optimistic.
Geothermal power qualifies for the federal ecoENERGY incentive of $10/MWh. However, the incentive is not indexed to inflation, and falls short of similar programs such as the US$20/MWh PTC that are indexed to inflation.
The Meager Mountain area in B.C. is the most significant geothermal energy discovery in Canada.

The Choice of a New Generation August 2008
275
In our opinion, the success of future geothermal energy development in Canada depends more on sustained government policies and initiatives, as well as adequate funding sources, than on geological factors.
P R O J E C T E Q U I T Y R E T U R N S A R E R E A S O N A B L E : M O D E L L I N G & S E N S I T I V I T Y A N A L Y S E S O F A G E O T H E R M A L P O W E R P R O J E C T
Our financial modelling and analysis of geothermal power projects indicates that equity investors will be reasonably satisfied with investment returns. We modelled numerous scenarios and sensitized for variations in (1) PPA prices and escalations rates; (2) capital costs and costs of capital; (3) RECs, U.S. PTCs, and other renewable incentives; (4) operating & maintenance costs; (5) capacity factor; and (6) tax rates. Our generic geothermal project yielded an 18.8% equity IRR. To arrive at this, we made the following assumptions:
• 93% capacity factor. Our research revealed a geothermal capacity factor range of 90% to 95%, the highest among all power technologies that we have seen, including renewables, fossil fuels, and other alternatives such as nuclear. Several geothermal development companies we looked at stated capacity factor expectations that ranged from 96% to 98%. We chose 93%.
• US$4 million per MW installed cost. The majority of our research led us to assume an installed capital cost of US$4 million per MW, although several developers have forecast installed costs as low as US$3.5 million per MW.
• Starting PPA @ US$83/MWh + 1.5% p.a. We took the average U.S. PPA price of several states that ranged from the mid-US$60s/MWh (Nevada) to US$98/MWh (California). We tacked on an annual escalation rate of 1.5% per year.
• Starting O&M @ US$24/MWh + 1.5% p.a. Operating and maintenance cost estimates (and actuals) have ranged between US$15/MWh to US$30/MWh. We used a median cost of US$24/MWh.
• U.S. PTC intact. We applied an initial U.S. production tax credit at US$20/MWh, adjusted annually for inflation. We also assumed the PTC is extended throughout the life of the project.
• Starting RECs @ US$5/REC. This is our most speculative model assumption, as we do not know how RECs will trade among Western Climate Initiative member states and provinces. We added US$0.50/REC per year to US$20/REC by the end of the plant’s 30-year life. We note that global REC prices vary widely, from US$4/MtCO2e on the Chicago Climate Exchange to ~US$35/tonne CO2e on the EU ETS.
• Debt to equity split 80%/20%. This is in line with most current and proposed geothermal project capital structures that we have seen. We assume the debt is non-recourse (project specific) and at the current U.S. Treasury bond rate plus 3%. Equity investors in geothermal projects have historically required 17% annual returns, with most falling in the 16% to 20% range. We use 17%.
• Other. Most geothermal PPAs in California and Nevada are for a 20-year term. We matched the term of debt financing to this 20-year PPA term. We then assumed that the PPA would roll over for a further 10 years to match a 30-year plant life.
In Exhibit 7.87 on the following page, we provide our equity investment IRR sensitivity analyses to changes in the factors listed above.

Alternative &
Renew
able Energy A
ugust 2008
276 Exhibit 7.87: Geothermal Project Equity IRRs Seem Reasonable
0%
5%
10%
15%
20%
25%
30%
35%
40%
$4.75 $4.50 $4.25 $4.00 $3.75 $3.50 $3.25
Cost per Installed MW (US$M)
IRR
80% c.f.
90% c.f.
100% c.f.Base Case
10%
14%
18%
22%
26%
30%
$70 $75 $80 $85 $90 $95 $100
Initial Power Price (US$/MWh)
IRR
Base Case O&M @
US$28/MWh
O&M @ US$20/MWh
O&M @ US$24/MWh
0%
5%
10%
15%
20%
25%
30%
35%
$0 $5 $10 $15 $20 $25 $30
RECs (US$/MWh)
IRR
No U.S. PTC
Base Case
U.S. PTC @ US$20/MWh
$55
$60
$65
$70
$75
$80
$85
$90
$95
$3.25 $3.50 $3.75 $4.00 $4.25 $4.50 $4.75
Cost per Installed MW (US$M)
Levl
ized
Cos
t of P
ower
(U
S$/M
Wh)
90% c.f.
100% c.f.
80% c.f.
$50
$60
$70
$80
$90
$100
$110
$120
5% 6% 7% 8% 9% 10% 11% 12% 13% 14% 15%
Capitalization Rate (%)Le
vliz
ed C
ost o
f Pow
er
(US
$/M
Wh)
90% c.f.
100% c.f.
80% c.f.
$60
$80
$100
$120
$140
$160
$180
40 35 30 25 20 15 10 5
Expected Facility Life (Years)
Levl
ized
Cos
t of P
ower
(U
S$/
MW
h)
90% c.f.
100% c.f.
80% c.f.
Source: Scotia Capital estimates.

The Choice of a New Generation August 2008
277
Exhibit 7.88: Geothermal Project Equity IRRs Seem Reasonable
18.8% $70 $75 $80 $85 $90 $95 $100$30 10.4% 12.2% 14.2% 16.2% 18.5% 20.9% 23.6%$28 11.1% 12.9% 14.9% 17.1% 19.4% 21.9% 24.6%$26 11.7% 13.6% 15.7% 17.9% 20.3% 22.9% 25.7%$24 12.4% 14.4% 16.5% 18.8% 21.3% 23.9% 26.8%$22 13.1% 15.1% 17.3% 19.7% 22.3% 25.0% 27.9%$20 13.8% 15.9% 18.2% 20.6% 23.3% 26.1% 29.1%$18 14.6% 16.7% 19.1% 21.6% 24.3% 27.2% 30.3%
##### $4.75 $4.50 $4.25 $4.00 $3.75 $3.50 $3.2570% 6.9% 7.9% 9.2% 10.6% 12.3% 14.4% 17.0%75% 8.2% 9.4% 10.8% 12.5% 14.4% 16.8% 19.9%80% 9.7% 11.0% 12.6% 14.4% 16.7% 19.5% 23.0%85% 11.2% 12.7% 14.4% 16.5% 19.1% 22.3% 26.3%90% 12.8% 14.4% 16.4% 18.8% 21.7% 25.3% 29.8%95% 14.4% 16.3% 18.5% 21.2% 24.5% 28.5% 33.5%
100% 16.2% 18.3% 20.8% 23.8% 27.4% 31.9% 37.4%
18.8% 9.50% 9.00% 8.50% 8.00% 7.50% 7.00% 6.50%35% 11.5% 12.7% 13.9% 15.2% 16.6% 18.1% 19.7%30% 12.5% 13.7% 15.0% 16.4% 17.9% 19.5% 21.2%25% 13.5% 14.7% 16.1% 17.6% 19.2% 20.9% 22.7%20% 14.4% 15.8% 17.2% 18.8% 20.5% 22.3% 24.2%15% 15.4% 16.8% 18.3% 20.0% 21.8% 23.7% 25.8%10% 16.3% 17.8% 19.4% 21.2% 23.1% 25.1% 27.3%5% 17.2% 18.8% 20.5% 22.4% 24.4% 26.5% 28.8%
18.8% $0 $5 $10 $15 $20 $25 $30$0 10.5% 12.0% 13.7% 15.5% 17.5% 19.7% 22.1%
$20 16.7% 18.8% 21.1% 23.6% 26.3% 29.2% 32.2%Initial PTC (US$/MWh)
Starting PPA Price (US$/MWh)
Installed Capital Cost (US$M/MW)
Cost of Debt (%)
Carbon price (US$/REC or US$/ERC or US$/MWh)
Starting O&M Cost (US$/MWh)
Capacity Factor (%)
Effective Cash Tax Rate (%)
Source: Scotia Capital estimates.
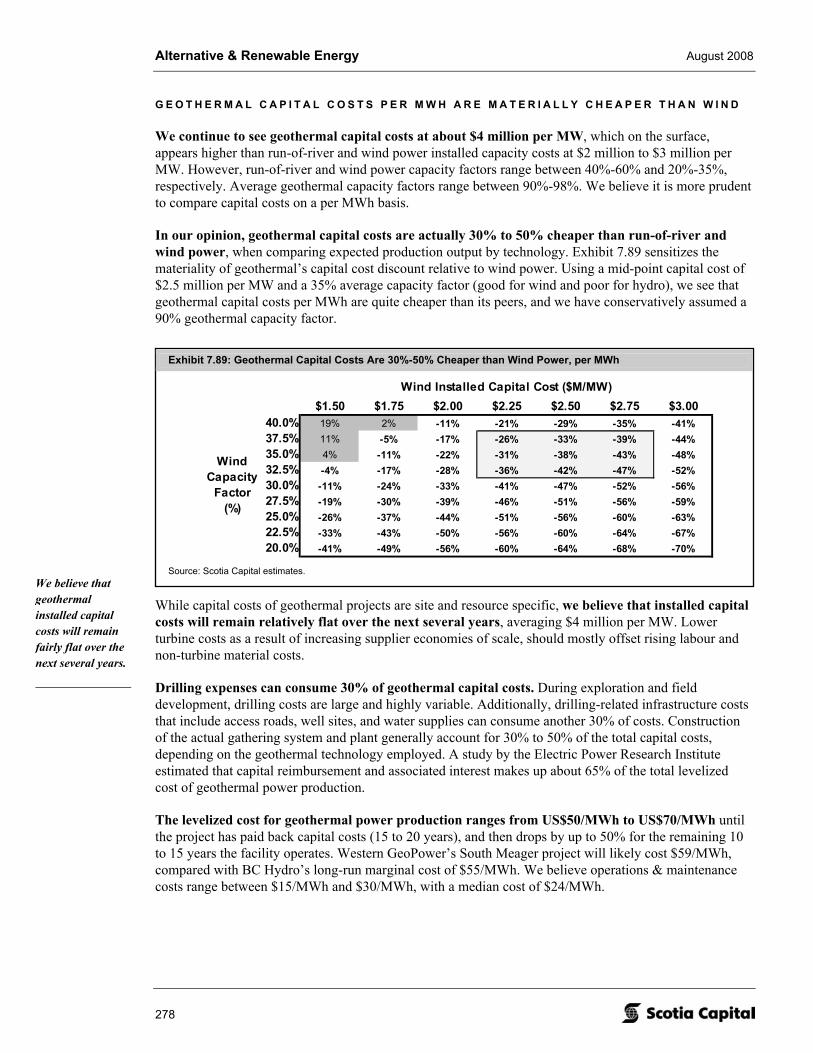
Alternative & Renewable Energy August 2008
278
Exhibit 7.89: Geothermal Capital Costs Are 30%-50% Cheaper than Wind Power, per MWh
-0.56 $1.50 $1.75 $2.00 $2.25 $2.50 $2.75 $3.0040.0% 19% 2% -11% -21% -29% -35% -41%37.5% 11% -5% -17% -26% -33% -39% -44%35.0% 4% -11% -22% -31% -38% -43% -48%32.5% -4% -17% -28% -36% -42% -47% -52%30.0% -11% -24% -33% -41% -47% -52% -56%27.5% -19% -30% -39% -46% -51% -56% -59%25.0% -26% -37% -44% -51% -56% -60% -63%22.5% -33% -43% -50% -56% -60% -64% -67%20.0% -41% -49% -56% -60% -64% -68% -70%
Wind Capacity
Factor (%)
Wind Installed Capital Cost ($M/MW)
Source: Scotia Capital estimates.
G E O T H E R M A L C A P I T A L C O S T S P E R M W H A R E M A T E R I A L L Y C H E A P E R T H A N W I N D
We continue to see geothermal capital costs at about $4 million per MW, which on the surface, appears higher than run-of-river and wind power installed capacity costs at $2 million to $3 million per MW. However, run-of-river and wind power capacity factors range between 40%-60% and 20%-35%, respectively. Average geothermal capacity factors range between 90%-98%. We believe it is more prudent to compare capital costs on a per MWh basis.
In our opinion, geothermal capital costs are actually 30% to 50% cheaper than run-of-river and wind power, when comparing expected production output by technology. Exhibit 7.89 sensitizes the materiality of geothermal’s capital cost discount relative to wind power. Using a mid-point capital cost of $2.5 million per MW and a 35% average capacity factor (good for wind and poor for hydro), we see that geothermal capital costs per MWh are quite cheaper than its peers, and we have conservatively assumed a 90% geothermal capacity factor.
While capital costs of geothermal projects are site and resource specific, we believe that installed capital costs will remain relatively flat over the next several years, averaging $4 million per MW. Lower turbine costs as a result of increasing supplier economies of scale, should mostly offset rising labour and non-turbine material costs.
Drilling expenses can consume 30% of geothermal capital costs. During exploration and field development, drilling costs are large and highly variable. Additionally, drilling-related infrastructure costs that include access roads, well sites, and water supplies can consume another 30% of costs. Construction of the actual gathering system and plant generally account for 30% to 50% of the total capital costs, depending on the geothermal technology employed. A study by the Electric Power Research Institute estimated that capital reimbursement and associated interest makes up about 65% of the total levelized cost of geothermal power production.
The levelized cost for geothermal power production ranges from US$50/MWh to US$70/MWh until the project has paid back capital costs (15 to 20 years), and then drops by up to 50% for the remaining 10 to 15 years the facility operates. Western GeoPower’s South Meager project will likely cost $59/MWh, compared with BC Hydro’s long-run marginal cost of $55/MWh. We believe operations & maintenance costs range between $15/MWh and $30/MWh, with a median cost of $24/MWh.
We believe that geothermal installed capital costs will remain fairly flat over the next several years.

The Choice of a New Generation August 2008
279
I N V E S T M E N T P O S I T I V E S
• Demanding renewable portfolio standards support geothermal growth. California requires 20% of its energy to come from renewable sources by 2010, while Nevada (20% by 2015), Oregon (25% by 2015), and Washington (15% by 2020) also have tall standards. We believe that incremental geothermal generation capacity will play a significant role to help these particular states achieve their targets. Idaho and Utah currently do not have renewable portfolio standards, although geothermal energy exploration and development is occurring in these states as well.
• High reliability = baseload power. Geothermal energy is the only continuously available renewable energy source, and is commonly used as baseload power due to its high predictability over a 24-hour period. Unlike almost all other renewable power technologies, geothermal production is unaffected by changing weather conditions.
• Incentives, incentives, incentives. Similar to other renewable power producers, geothermal energy developers somewhat rely on economic incentives to yield reasonable investment returns. In the U.S., the production tax credit of US$20/MWh, coupled with an unknown value for emission reduction credits, support prospective geothermal developers in their investment decisions. Canada’s ecoENERGY incentive of $10/MWh that is not indexed to inflation is a start, but not enough to attract material attention by geothermal developers to date.
• Capital costs could fall further. Technological advances have reduced geothermal generation costs by over 25% during the past decade. Many consultants forecast that generation costs could fall an additional 20% by 2020 (over 2000 levels), while operation and maintenance costs could decline by up to 30% by 2020.
• Price stabilizer. With zero fuel costs, geothermal energy acts as a power price stabilizer that partly offsets dependence on the highly volatile fossil fuel-based power market.
• Minimal environmental impact. While geothermal energy production is considered a clean form of electricity generation, some geothermal plants produce small amounts of CO2, or about 1,000x to 2,000x less than an average fossil fuel plant. Additionally, geothermal power stations have a very low land area requirement.
I N V E S T M E N T R I S K S & C H A L L E N G E S
• Renewable…at a cost. While a geothermal reservoir can be depleted of water or grow too cool, this can take decades to centuries to occur, if at all. Typically, a natural rejuvenation period exists that will return a geothermal field to economically exploitable levels. Also, many current technologies re-inject geothermal fluids back into the reservoir, which can extend reservoir life almost indefinitely, although further capital costs are required for re-injection equipment. The best example of this is at the world’s first geothermal power plant (Larderello, Italy) that began operating a 0.25 MW facility in 1913. Today the geothermal boasts a 700 MW capacity that is expected to rise to 1,200 MW over the next several years.
• Turbine supply delays. Similar to the wind power industry, demand growth for geothermal turbines has caused a two-year backlog for delivery of most types of turbines. Fuji, Mitsubishi, and Toshiba are the primary turbine suppliers. Italian utility company Enel recently placed a five- to six-turbine order with Toshiba, adding to the backlog for North American geothermal-focused IPPs. One company we spoke with recently bucked this trend by securing a 16-month delivery timeframe for a turbine.
Unlike almost all other renewable power technologies, geothermal production is unaffected by changing weather conditions.

Alternative & Renewable Energy August 2008
280
Exhibit 7.90: Geothermal Production Is Seasonal
10
12
14
16
18
20
22
24
26
28
Jan Feb Mar Apr May Jun Jul Aug Sep Oct Nov Dec
MW
Maximum power delivery takes place during the coolest hours
Minimum power delivery takes place during the hottest hours
Rated capacity
Average monthly power output
Source: Geothermal Energy Association; Scotia Capital estimates.
• Seasonality still a concern. Unlike wind, solar, and run-of-river power, geothermal energy generation is unaffected by changing weather conditions. However, air-cooled binary power plants located in desert
terrain such as California and Nevada, have material power output variations both on a daily basis, and seasonally, which can meaningfully change the project’s earnings profile. Maximum power delivery typically occurs during the coolest hours of the day while lower power production happens during the hottest hours of day. Exhibit 7.90 presents an example of seasonal output variation for a 20 MW air-cooled binary power plant.
• Subsidence. While the risk is small, the potential for geothermal-based subsidence or hydrothermal eruptions exists, which if it occurs, could materially impair a project’s expected future cash flow.
G E O T H E R M A L P O W E R S C I E N C E & T E C H N O L O G Y 1 0 1
Geothermal energy is the only source of renewable power that is independent of the sun. For the most part, geothermal power producers attempt to capture and use heat energy created under the Earth’s crust. Similar to oil & gas exploration, boreholes are drilled into a reservoir, so that hot geothermal fluid either flows or is pumped to the surface. This fluid is then employed by conventional steam turbines for electric power generation.
Enthalpy is critical to assessing the quality of geothermal resources, and is defined as heat content per unit of mass, which is a function of pressure and volume as well as temperature. High enthalpy is classified as temperatures above 180°C-200°C, with medium enthalpy at 100°C-180°C, and low enthalpy at less than 100°C. High enthalpy resources, including all those currently exploited for geothermal electric power production, are confined to volcanically active plate margins or localized hot spots such as the Hawaiian Islands.
Traditional geothermal power production technologies depend not only on fluid temperature and pressure, but also on the nature of the resource, including its salinity and content of other gases. Therefore, we believe that a majority of western U.S. geothermal development projects will utilize binary cycle power plants for power production. The main advantage of binary cycle technology is that lower-temperature resources can be developed where single flash systems have proven unsatisfactory. Additionally, the surface loop is closed, which results in zero emissions into the environment.
The primary challenge for geothermal power production is the turbine’s consumption of 30% of the overall power output that is lost to keeping geothermal fluid under pressure as well as re-pressurizing secondary working fluids (i.e., pentane or butane). There are three main types of geothermal electrical production technologies that we review in Exhibit 7.91.

281
The Choice of a N
ew G
eneration A
ugust 2008
Exhibit 7.91: First Generation Geothermal Technologies
Dry Steam Flash Steam Binary Cycle
Process
Steam goes directly to a turbine, w hich drives a generator that produces electricity. Low exhaust steam is vented directly to the atmosphere.
High enthalpy f luids can be used in f lash plants to generate pow er. The f luid is sprayed into a tank held at a much low er pressure than the f luid, causing some of the f luid to rapidly vapourize, or "f lash". The vapour then drives a turbine, w hich drives a generator. If any liquid remains in the tank, it can be f lashed again in a second tank to extract even more energy.
Binary cycle plants use a secondary w orking f luid w ith a low er boiling point than w ater, such as pentane or butane, w hich is then vapourized to drive a turbine.
Postitives
Ideal for vapour-denominated resources w here steam production is not contaminated w ith liquid. Modern dry steam plants can achieve 6.5 kg of steam per kWh, dow n from 15 kg per kWh in the 1960s.
Geothermal f luid reaching the surface may be either steam or hot w ater at a high pressure.
Low er temperature resources can be exploited w here f lash-based systems have proven unsatisfactory. The surface loop is closed and no emissions to the environment occur.
Negatives
While the units are simple, they are very ineff icient. As a result, their main use is as temporary transportable units during the development of a new geothermal f ield. The plants emit minor amounts of non-condensable gases such as carbon dioxide and hydrogen sulphide.
Plant typically requires more steam than a dry steam plant, around 8 kg per kWh. Additionally, the bulk of the f luid, often up to 80%, may remain as unflashed brine that is then re-injected.
Keeping the geothermal f luid under pressure and re-pressurizing the secondary f luid can consume up to 30% of the overall pow er output of the system.
Source: U.S. Department of Energy; Scotia Capital.

Alternative & Renewable Energy August 2008
282
E M E R G I N G G E O T H E R M A L T E C H N O L O G I E S
Enhanced Geothermal Systems (EGS) are fundamentally different from traditional systems, as EGS attempts to capture heat directly from hot rocks rather than relying on water circulation around those hot rocks. To accomplish this, chemically treated water is pumped into rock fractures (hydraulic fracturing – used widely in the oil and gas industry) to open, extend, and interconnect areas of low permeability. The fluid is then forced out of a borehole and converted into electricity using traditional plant technologies. A 2006 MIT study estimated 100,000 MW of resources are available for EGS exploitation over the coming decades within the U.S. Ormat Technologies, an Israeli company that is considered the world leader in geothermal power development, has begun work on the first application of enhanced geothermal systems in the U.S.
There is also a growing interest in producing electricity from geothermal fluid flowing out of oil and gas wells. In general, medium-grade heat from a conventional well could run a 250 kW micro turbine. There are hundreds of thousands of wells in Alberta and B.C.
The Kalina Cycle, which utilizes an ammonia-water working fluid with a varying composition throughout the production cycle, is expected to increase net generating efficiency by 20% to 40% over a binary cycle power plant. Additionally, capital costs are forecast by consultants to be materially lower than Organic Ranking Cycle (binary) plants.
O U T L O O K
In our opinion, the outlook for geothermal energy development in western U.S. states over the next several years is very positive. The incorporation of (1) tough U.S. renewable portfolio standards; (2) incentives at federal and state levels; (3) significant untapped economical geothermal fields; (4) increasingly efficient turbine and exploration technologies, and (5) a successful operational track record as a base load provider, will benefit geothermal developers with U.S. projects.
Some geothermal experts at the University of British Columbia estimate 3,000 MW of high-temperature geothermal power will be established in B.C. “within the next 10 to 15 years.” While possible, we think this is highly optimistic due to moderate federal and provincial government support. Additionally, strong U.S. incentives have attracted all Canadian geothermal producers to develop geothermal projects in California, Nevada, and various Pacific Northwest states rather than in their home country. Western GeoPower is a partial exception, as it enters its sixth year of exploring the feasibility of its South Meager project.
S T R O N G G E O T H E R M A L S H O W I N G A T T H E 2 0 0 8 P D A C
We attended presentations by five TSX-listed geothermal power developers at the 2008 Prospectors & Developers Association of Canada (PDAC) conference. On the following pages, we highlight these companies and provide brief summaries of the status of their main projects.
In our opinion, the outlook for geothermal development in western U.S. states is very positive.

The Choice of a New Generation August 2008
283
Exhibit 7.92: Select Sierra Geothermal Projects
Project Land Production OwnershipName Size Low (P90) High (P50) Low High Target Interest Tier
Reese River 25 km2 26 MW 58 MW US$104M US$232M 2011 100% IPumpernickel 27 km2 10 MW 15 MW US$40M US$60M 2011 50% ISilver Peak 29 km2 15 MW 30 MW US$60M US$120M 2012 100% IWilson 23 km2 55 MW 117 MW US$220M US$468M 2013 100% IAlum 29 km2 40 MW 90 MW US$160M US$360M 2013 100% ISalt Wells 34 km2 10 MW 20 MW US$40M US$80M - - IIHawthorne 12 km2 10 MW 15 MW US$40M US$60M - - IIGerlach 7 km2 5 MW 10 MW US$20M US$40M - - IISoda Lake 4 km2 - - - - - - II
Capital CostNet Capacity
Source: Company reports.
Exhibit 7.93: Sierra Geothermal – Stock Performance
$0.25
$0.45
$0.65
$0.85
$1.05
$1.25
$1.45
Dec-07 Feb-08 Apr-08 Jun-08
Pric
e
01002003004005006007008009001,000
Dai
ly V
olum
e (0
00s)
SRA (Volume) SRA (Price) STUTIL (rebased) SPTSX (rebased)
$26.6M
SRA$0.39
$0.90$0.2968.3M
Ticker:Last Price:Market Cap:52 Wk High:52 Wk Low :Shares O/S:
Source: Bloomberg; Scotia Capital.
S I E R R A G E O T H E R M A L P O W E R C O R P O R A T I O N
Sierra Geothermal (SRA-V) is focused on North American geothermal exploration and development using binary plant technology. The company currently has an interest in 16 geothermal projects in Nevada and one project in California, which cover a combined 88,000 acres. Sierra aims to commission 50 MW per year of installed capacity to its portfolio beginning in 2013. With a market capitalization of $27 million, it is one of the smallest among the five Canadian listed geothermal companies.
Projects Worth Watching
Sierra’s 100%-owned Reese River project has a production target of 2011 with a nameplate capacity range between 26 MW (P90) and 58 MW (P50). Capital costs are estimated at US$100 million to US$230 million, or US$4 million per MW, and in line with other U.S.-based geothermal projects. We believe the PPA contract is for a 20-year period and in a range between US$60/MWh and US$70/MWh that escalates at about 1% per year. In 2009, Sierra intends to finalize an EPC contract for the construction of the geothermal plant.
Pumpernickel, a 20 MW (P90) to 30 MW (P50) project that is 50% owned by SRA, is also slated to be commissioned in 2011, although its progress is further behind the Reese River project. Sierra and its partner plan to begin production drilling, and financing the US$80 million to US$120 million project in 2009. SRA acquired the 50% interest in Pumpernickel in mid-2005. Phase II permitting is in progress for three shallow gradient holds to locate its first production assessment well. Exhibit 7.92 shows a list of Sierra’s five Tier-I geothermal projects as well as several of its 11 other Tier II potential development properties.

Alternative & Renewable Energy August 2008
284
Exhibit 7.94: Polaris Geothermal – Stock Performance
$0.90$1.00$1.10$1.20$1.30$1.40$1.50$1.60$1.70$1.80$1.90
Dec-07 Feb-08 Apr-08 Jun-08
Pri
ce
01002003004005006007008009001,000
Dai
ly V
olum
e (0
00s)
GEO (Volume) GEO (Price) STUTIL (rebased) SPTSX (rebased)
$90.4M
GEO$1.20
$1.69$0.9075.4M
Ticker:Last Price:Market Cap:52 Wk High:52 Wk Low :Shares O/S:
Source: Bloomberg; Scotia Capital.
P O L A R I S G E O T H E R M A L I N C .
Unlike many of its peers, which focus their geothermal exploration and development efforts in Nevada, Polaris Geothermal (GEO-T) is attempting to build a 72 MW facility in Nicaragua. The company was founded in June 2004 and has since completed construction of a 10 MW facility at its site.
Projects Worth Watching
The 40 km2 San Jacinto-Tizate geothermal concession is located 90 km northwest Managua, and has a resource base confirmed at 203 MW (P90), with a 50% probability of exceeding 270 MW. Polaris signed a 20-year “take-or-pay” PPA with Union Fenosa, a Spanish utility that is committed to purchasing 66 MW of power from the facility at an initial price of US$60.10/MWh, and which will escalate at about 1% per year. The PPA is backed and guaranteed by the Government of Nicaragua and enables Polaris to sell its excess power to the grid. By early 2010, an 18-month delay, Polaris hopes to have completed the first phase of the project, the installation of one 24 MW modular condensing turbine (MCT). Phase II, to be completed by 2H/10, will add two more 24 MW MCTs upon successful drilling of production and injection wells to bring total capacity to 72 MW. Phase III will consist of the additional installation of two 60 MW condensing turbines. Polaris intends to retain and sell Emission Reduction Credits from the project.
GEO’s other key project includes a 137 MW (P90) geothermal concession located at Casita, Nicaragua. The San Jacinto–Tizate and Casita concessions are both 87.6% owned by Polaris, with the remaining ownership held by a Daimler Chrysler subsidiary, debis Industriehandel GmbH (10%), and Consorcio Electrico de Centroamericano S.A. de C.V. (2.4%).

The Choice of a New Generation August 2008
285
Exhibit 7.96: Nevada Geothermal Power – Stock Performance
$0.90$1.00$1.10$1.20$1.30$1.40$1.50$1.60$1.70$1.80$1.90
Dec-07 Feb-08 Apr-08 Jun-08
Pric
e
0
500
1,000
1,500
2,000
2,500
3,000
Dai
ly V
olum
e (0
00s)
NGP (Volume) NGP (Price) STUTIL (rebased) SPTSX (rebased)
$97.0M
NGP$1.03
$1.60$0.7094.2M
Ticker:Last Price:Market Cap:52 Wk High:52 Wk Low :Shares O/S:
Source: Bloomberg; Scotia Capital.
Exhibit 7.95: Nevada Geothermal’s Project Portfolio
Source: Nevada Geothermal.
N E V A D A G E O T H E R M A L P O W E R I N C .
Nevada Geothermal (NGP-V) is developing three geothermal properties in Nevada, and one in Oregon. In addition to seeking PPAs for its projects, NGP is also negotiating with mining companies for the direct sale of its power.
Projects Worth Watching
NGP’s primary undertaking is the development of Blue Mountain, a 100%-owned 49.5 MW geothermal project. The project has a net 31.25 MW 20-year PPA with Nevada Power Company and is projected to generate power by Q4/09. The PPA will pay NGP between US$60/MWh to US$70/MWh with a fixed annual escalator. Additionally, the project is expected to earn incremental EBITDA from the U.S. PTC as well as from the sale of RECs. GeothermEx, a large global geothermal energy consulting firm, stated that the inferred resource of the Blue Mountain project is 110 MW. As a result, Nevada Geothermal recently submitted a second Blue Mountain PPA bid for an additional 30 MW. An interconnection agreement (20-mile transmission line required) and environmental permitting have been approved. Just recently, the
company entered into an EPC with Ormat for the construction of the Blue Mountain Faulkner I project. Construction is anticipated to begin by late 2008.
Other notable projects include: (1) Crump Geyser, a 40 MW (P90) to 60 MW (P50) project located in Oregon; (2) Pumpernickel, a 50:50 JV project with Sierra Geothermal for 20 MW (P90) to 30 MW (P50); and (4) Black Warrior, a 37 MW (P90) to 50 MW (P50) project over 21 km2 located in western Nevada that would likely deliver power to California. Exhibit 7.95 shows the location of the company’s project portfolio relative to other development fields and current geothermal operating plants.

Alternative & Renewable Energy August 2008
286
Exhibit 7.97: Western GeoPower – Stock Performance
$0.25
$0.30
$0.35
$0.40
$0.45
$0.50
$0.55
$0.60
$0.65
$0.70
Dec-07 Feb-08 Apr-08 Jun-08
Pric
e
0
500
1,000
1,500
2,000
2,500
3,000
Dai
ly V
olum
e (0
00s)
WGP (Volume) WGP (Price) STUTIL (rebased) SPTSX (rebased)
$50.9M
WGP$0.27
$0.50$0.25
188.4M
Ticker:Last Price:Market Cap:52 Wk High:52 Wk Low :Shares O/S:
Source: Bloomberg; Scotia Capital.
W E S T E R N G E O P O W E R C O R P .
Western GeoPower Corp. (WGP-V) is focused on the development of two geothermal projects in North America. The company has the only geothermal lease in Canada for the commercial production of geothermal energy.
Projects Worth Watching
WGP is developing a 35 MW geothermal plant at Geysers Field in northern California, with a planned start-up of early 2010. The Geysers is the largest geothermal field on the planet and has been in operation since 1960, with a current installed capacity of 900 MW. Capital costs for the project are estimated by WGP at US$4 million per MW. The project’s drilling program is expected to continue until December 2009. A signed PPA agreement with Pacific Gas & Electric (PG&E) in mid-2007 was terminated by WGP in February 2008 as California Public Utilities Commission approval was not received within the stipulated time-frame. WGP’s CEO stated that the termination of the PPA “will not affect the projected start of commercial operations in early 2010.” In May 2008 the company signed a PPA for 265,000 MWh/y with the Northern California Power Agency. The PPA is for 20 years at a price of US$98/MWh and is not subject to further approvals.
Western GeoPower is in the early stages of testing commercial viability at its South Meager, B.C., geothermal project. Preliminary test drilling was initiated in 2004, and GeothermEx has since classified the project as having between 100 MW and 200 MW of capacity. If development of the project continues on time, WGP estimates commercial production will commence in 2012. The site location is 83 km from the grid and 170 km from Vancouver.
WGP is also exploring geothermal opportunities in Chile and launched operations there in April 2008.

The Choice of a New Generation August 2008
287
Exhibit 7.98: U.S. Geothermal – Stock Performance
$2.00
$2.50
$3.00
$3.50
$4.00
$4.50
$5.00
$5.50
$6.00
Dec-07 Feb-08 Apr-08 Jun-08
Pric
e
01002003004005006007008009001,000
Dai
ly V
olum
e (0
00s)
GTH (Volume) GTH (Price) STUTIL (rebased) SPTSX (rebased)
$147.0M
GTH$2.37
$4.75$2.0062.0M
Ticker:Last Price:Market Cap:52 Wk High:52 Wk Low :Shares O/S:
Source: Bloomberg; Scotia Capital.
U . S . G E O T H E R M A L I N C .
U.S. Geothermal (GTH-T) is developing its geothermal assets in Idaho, Oregon, and Nevada. The company began trading on the TSX in September 2007, and currently has a market capitalization of $147 million. PPAs for 65 MW have either been completed or are in an advanced stage of negotiation.
Projects Worth Watching
GTH’s 15.6 MW (P50) Raft River project is located about 200 miles southeast of Boise, Idaho, at the site of a former U.S. Department of Energy geothermal installation. Based on estimates provided by GeothermEx, the site may be capable of producing up to 110 MW. The project was acquired by U.S. Geothermal in 2002 and power plant construction began in mid-2006, with commercial production achieved in January 2008. Power production will be sold to Idaho Power Company under a 13 MW, 25-year PPA. Additionally, the company signed a 25-year PPA for 16 MW of capacity with the Eugene Water and Electric Board. A total of 36 MW of transmission has been reserved on a 138 kV transmission line that is located adjacent to the project that ensures accessibility to western power markets.
The Neal Hot Springs development project, located in Oregon, about 90 miles northwest of Boise, Idaho, anticipates 26 MW of power production. The project has already been selected by Idaho Power Company for the negotiation of a PURPA contract. In early 2008, a drilling permit was issued to GTH followed by the commencement of drilling in May. The expected commercial operation date for the project is Q3/11.
The San Emidio project, acquired in April of 2008, has a net capacity of 3.6 MW and is located in Washoe County, Nevada. GTH recently received drilling permits for the project and is currently in the process of adding 27 MW with commercial operations expected by the end of 2010. The project has the potential for up to 44 MW (P90) and has a PPA in place for current production that continues until 2017.

Alternative &
Renew
able Energy A
ugust 2008
288 Exhibit 7.99: Geothermal Comps
Company Name TickerLast Price
52-Wk Low
52-Wk High
Shares O/S
Market Cap
Debt/ Equity
Debt/ Assets
Debt/ EBITDA
1-MonthROR
3-MonthROR
1-Year ROR
(8/15/2008) (M) (C$M) (%) (%) (x) (%) (%) (%)
Nevada Geothermal Pow er NGP $1.03 $0.68 $1.60 94.2 $97 45% 24% n.m. -2% -6% 43%Polaris Geothermal GEO $1.20 $0.90 $1.69 75.4 $90 15% 11% n.m. 2% 4% 4%Sierra Geothermal Pow er SRA $0.39 $0.29 $0.90 68.3 $27 - - - 3% -22% -22%US Geothermal GTH $2.37 $2.00 $4.75 62.0 $147 - - n.m. 0% 4% 1%Western GeoPow er WGP $0.27 $0.25 $0.50 188.4 $51 2% 2% - -13% -33% 4%Average $82 20% 12% - -2% -11% 6%
Enterprise Value to EBITDA Price to Earnings Price to Sales Price to Cash Flow
Company Name 2008E 2009E 2010E 2008E 2009E 2010E 2008E 2009E 2010E 2008E 2009E 2010E(x) (x) (x) (x) (x) (x) (x) (x) (x) (x) (x) (x)
Nevada Geothermal Pow er - - - - - 20.6x - - 13.3x n.m. n.m. -Polaris Geothermal - - - - - - - - - - - -Sierra Geothermal Pow er - - - - - - - - - - - -US Geothermal n.m. 9.9x 3.7x - 74.4x 14.0x 39.9x 15.5x 8.9x n.m. - -Western GeoPow er - - - - - - - - - - - -Average - 9.9x 3.7x - 74.4x 17.3x 39.9x 15.5x 11.1x - - -
Source: Bloomberg; Scotia Capital.

The Choice of a New Generation August 2008
289
Exhibit 7.100: U.S Wood-Residue Capacity Growth Has Been Flat
05
1015
2025
3035
4045
2002 2003 2004 2005 2006 2007
Pow
er P
rodu
ctio
n (G
Wh/
y)
Wood-Residue Wind
About 3 MW of w ind capacity at a 30% capacity factor produces the same amount of electricity as 1 MW of
wood-residue biomass at a 90% capacity factor. So, the difference shown between wind and biomass is
actually about 3x greater on a per MW basis.
Source: Energy Information Administration; Scotia Capital.
Wood-Residue Biomass– Losing Value on High Fuel CostsO V E R V I E W
In our view, the outlook for wood-residue biomass capacity investment in Canada remains lukewarm. B.C. appears to be the only materially active province developing its substantial biomass resource, through BC Hydro’s 1,000 GWh/y Bioenergy Call for Power. Ontario has seen minimal capacity additions from wood-residue plants since 2003. Why: Wood-residue power facilities typically require (1) a partnership with a mill (poor outlook) to procure cheap wood; and/or (2) diesel-intensive logging and transportation (costs soaring).
Despite accelerated growth of renewable energy projects across Canada and the world, wood-residue capacity has remained fairly flat since 2002. Only a handful of greenfield wood-residue plants have been constructed in North America since then with the majority of “bio-dollars” going towards biodiesel and biomass-to-ethanol plants. In our opinion, and when compared to a free and renewable fuel source such as wind, wood-residue based power generation (renewable, but not free fuel) has typically not been able to earn quality economic returns. Further exacerbating the situation, at least in the U.S., is the Production Tax Credit that offers open-loop biomass developers only 50% of the incentive that wind developers are offered. As a result, wood-residue biomass power capacity growth has suffered over the past five years, partially at the expense of an explosion of wind power capacity growth (Exhibit 7.100).
At current commodity prices, the cost of obtaining wood-residue is such that project returns (excluding renewable energy incentives) are fairly unattractive.
C O N S I D E R I N V E S T I N G B I O M A S S D O L L A R S I N R E C M A R K E T S
In our opinion, the most lucrative wood-residue biomass investment is one where an idle biomass or coal plant is purchased by an IPP for a fraction of its original cost, retrofitted to meet local renewable portfolio standard requirements, and commissioned primarily to collect and sell Renewable Energy Certificates (RECs), as well as the U.S. Production Tax Credit. Connecticut and Massachusetts are among the best U.S. states to do this, as those states’ RECs are currently priced in the US$30/MWh to US$50/MWh range, with a strong short- to mid-term outlook. Our long-term view on wood-residue biomass is that renewable power investment dollars could be better spent elsewhere.
Our overall long-term view on wood-residue biomass is that renewable power investment dollars could be better spent elsewhere.
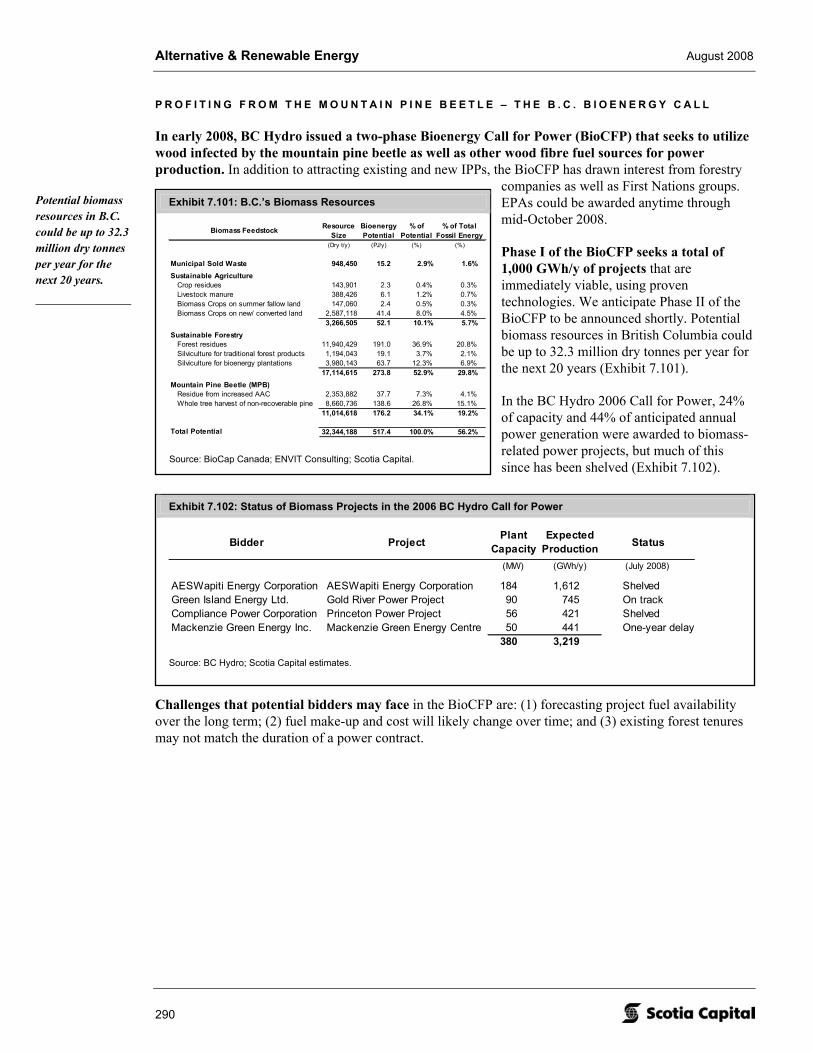
Alternative & Renewable Energy August 2008
290
Exhibit 7.101: B.C.’s Biomass Resources
Biomass Feedstock Resource Size
Bioenergy Potential
% of Potential
% of Total Fossil Energy
(Dry t/y) (PJ/y) (%) (%)
Municipal Sold Waste 948,450 15.2 2.9% 1.6%Sustainable Agriculture
Crop residues 143,901 2.3 0.4% 0.3%Livestock manure 388,426 6.1 1.2% 0.7%Biomass Crops on summer fallow land 147,060 2.4 0.5% 0.3%Biomass Crops on new/ converted land 2,587,118 41.4 8.0% 4.5%
3,266,505 52.1 10.1% 5.7%Sustainable Forestry
Forest residues 11,940,429 191.0 36.9% 20.8%Silviculture for traditional forest products 1,194,043 19.1 3.7% 2.1%Silviculture for bioenergy plantations 3,980,143 63.7 12.3% 6.9%
17,114,615 273.8 52.9% 29.8%Mountain Pine Beetle (MPB)
Residue from increased AAC 2,353,882 37.7 7.3% 4.1%Whole tree harvest of non-recoverable pine 8,660,736 138.6 26.8% 15.1%
11,014,618 176.2 34.1% 19.2%
Total Potential 32,344,188 517.4 100.0% 56.2%
Source: BioCap Canada; ENVIT Consulting; Scotia Capital.
Exhibit 7.102: Status of Biomass Projects in the 2006 BC Hydro Call for Power
Bidder ProjectPlant
CapacityExpected
Production Status
(MW) (GWh/y) (July 2008)
AESWapiti Energy Corporation AESWapiti Energy Corporation 184 1,612 ShelvedGreen Island Energy Ltd. Gold River Power Project 90 745 On trackCompliance Power Corporation Princeton Power Project 56 421 ShelvedMackenzie Green Energy Inc. Mackenzie Green Energy Centre 50 441 One-year delay
380 3,219
Source: BC Hydro; Scotia Capital estimates.
P R O F I T I N G F R O M T H E M O U N T A I N P I N E B E E T L E – T H E B . C . B I O E N E R G Y C A L L
In early 2008, BC Hydro issued a two-phase Bioenergy Call for Power (BioCFP) that seeks to utilize wood infected by the mountain pine beetle as well as other wood fibre fuel sources for power production. In addition to attracting existing and new IPPs, the BioCFP has drawn interest from forestry
companies as well as First Nations groups. EPAs could be awarded anytime through mid-October 2008.
Phase I of the BioCFP seeks a total of 1,000 GWh/y of projects that are immediately viable, using proven technologies. We anticipate Phase II of the BioCFP to be announced shortly. Potential biomass resources in British Columbia could be up to 32.3 million dry tonnes per year for the next 20 years (Exhibit 7.101).
In the BC Hydro 2006 Call for Power, 24% of capacity and 44% of anticipated annual power generation were awarded to biomass-related power projects, but much of this since has been shelved (Exhibit 7.102).
Challenges that potential bidders may face in the BioCFP are: (1) forecasting project fuel availability over the long term; (2) fuel make-up and cost will likely change over time; and (3) existing forest tenures may not match the duration of a power contract.
Potential biomass resources in B.C. could be up to 32.3 million dry tonnes per year for the next 20 years.

The Choice of a New Generation August 2008
291
Exhibit 7.103: Diesel Prices Have Increased over 60% in the Past Year
$2.00
$2.50
$3.00
$3.50
$4.00
$4.50
$5.00
Dec-05 Mar-06 Jun-06 Sep-06 Dec-06 Mar-07 Jun-07 Sep-07 Dec-07 Mar-08 Jun-08
Die
sel (
US$/
gallo
n)
+ 1 SD
+ 2 SD
- 1 SD
Avg.
Quarterly Average
+ 63%
Source: Bloomberg; Scotia Capital.
C A P I T A L C O S T S A R E R E A S O N A B L E , B U T O & M C O S T S A R E S O A R I N G
The average installed capital cost for greenfield wood-residue plants, at about US$3 million per MW, is in line with other renewable energy technologies, and slightly less expensive than its peers on a per GWh/y basis. However, wood-residue facilities are materially more expensive to operate than wind, solar, hydro, or geothermal as the cost of fuel is not free.
Up to 50% of wood-residue operating costs are associated with wood transportation. The U.S. average diesel price over the past year has increased by over 60%, crushing operating margins for many wood-residue biomass operators (Exhibit 7.103). As an example, Boralex’s operating cost per MWh has increased about 30% per year since mid-2006, or by half the growth of U.S. diesel prices (Exhibit 7.104).
With most analysts forecasting oil prices to remain above US$100/bbl through 2012, we continue to see wood-residue biomass facility operating costs as a major challenge for further capacity growth.
I N V E S T M E N T P O S I T I V E S
Proven, simple technology. Wood is one of the oldest fuel sources for energy generation and requires one of the least complex conversion technologies to produce power. Wood-residue biomass facilities are similar to coal-fired plants and require only a boiler and a steam turbine as primary capital equipment investments.
Reliable. Provided that an ample supply of wood-residue inventory is available, these facilities are not impacted by seasonality, as are wind farms and hydro facilities, nor are biomass plants an intermittent power source. However, procuring wood during winter months from snow-covered areas can materially impact the cost of fuel.
High capacity factor. Biomass plant capacity factors are materially higher than for wind, solar, and run-of-river due to a constant fuel supply. A typical wood-residue facility will operate at a capacity factor of 75%.
Ability to earn incentives. While provincial, state, and federal laws/regulations vary, wood-residue biomass power plants typically qualify for renewable power financial incentives such as the U.S. Production Tax Credit or the ecoENERGY program in Canada. Additionally, some form of carbon credits such as Renewable Energy Certificates can usually be earned and sold, which in some cases can materially change the economics of a project. Boralex is one the best examples of this that we have seen.
I N V E S T M E N T R I S K S
High commodity risk. Whether purchasing wood residue from third parties or obtaining wood in house, the wood-residue must be transported via truck, making costs heavily dependent on the price of diesel and indirectly the price of oil. Depending on a plant’s proximity to its wood supply, diesel-related costs can exceed 25% of total operating costs.

Alternative & Renewable Energy August 2008
292
Exhibit 7.104: Boralex’s Wood-Residue Plants Have Not Been Immune to Rising Diesel Costs
40
45
50
55
60
65
70
75
80
85
Q1-05A
Q2-05A
Q3-05A
Q4-05A
Q1-06A
Q2-06A
Q3-06A
Q4-06A
Q1-07A
Q2-07A
Q3-07A
Q4-07A
Q1-08A
Q2-08A
O&
M C
osts
(US
$/M
Wh)
+ 30% per year since
2H/06
Maintenance and repairs
Source: Boralex; Scotia Capital.
High operating & maintenance costs. Wood-residue biomass plants require an operational team to constantly source, procure, prepare, and store wood, as well as supply the fuel to the facility. In contrast, wind and run-of-river projects require minimal on-site involvement and can easily be run remotely.
U N E X C I T I N G E Q U I T Y R E T U R N S : M O D E L L I N G & S E N S I T I V I T Y A N A L Y S E S O F A W O O D R E S I D U E B I O M A S S P R O J E C T
On a stand-alone basis (i.e., excluding financial incentives), wood-residue projects offer investors one of the least attractive returns compared to other renewable technologies. We modelled several generic wood-residue project scenarios and sensitized for variations in (1) PPA prices and escalation rates; (2) capital costs and costs of capital; (3) various financial incentives, including Renewable Energy Certificates (RECs), the U.S. Production Tax Credit (PTC), and the ecoENERGY incentive payment, among others; (4) operating and maintenance costs; (5) capacity factors; and (6) tax rates. Our generic open-loop wood-residue biomass project yielded a 7.5% IRR. To arrive at this, we made the following assumptions:
• 75% capacity factor. Capacity factors for wood-residue power plants vary widely, from as low as 35% to as high as 95%. Typically, well maintained plants range from 70% to 85%. We chose 75%.
• US$3 million per MW installed cost. The installed capital cost for an average greenfield wood-residue biomass facility in North American is US$3 million. We have seen installed capital costs range between US$2.5 million and US$3.8 million.
• Starting PPA @ US$90/MWh + 1.5% p.a. We took the weighted-average U.S. renewable PPA price of several states that ranged from the mid-US$60s/MWh to US$98/MWh. We tacked on an annual escalation rate of 1.5% per year.
• Starting O&M @ US$65/MWh + 1.5% p.a. Operating and maintenance cost estimates (and actuals) have ranged widely between US$45/MWh and US$75/MWh. We used a cost of US$65/MWh to reflect rising wood-residue and transportation (diesel) costs.

The Choice of a New Generation August 2008
293
• U.S. PTC @ US$10/MWh. We placed our generic wood-residue biomass facility in the U.S., which as an open-loop facility, qualifies for a U.S Production Tax Credit of $10/MWh. Note that closed-loop facilities receive twice this amount (i.e., the same as qualified wind farms).
• No REC sales. While some U.S. states such as Connecticut and Massachusetts have REC prices in the US$30/MWh to US$50/MWh range, many states have REC values worth less than US$1/MWh, and over half of the U.S states don’t offer RECs.
• Debt to equity split 75%/25%. This is in line with most current and proposed wood-residue project capital structures that we have seen.
• Other. Most wood residue plants operate for 30 years or more. We assume a project life of 40 years given the reliability of the technology.
In Exhibits 7.105 and 7.106 on the following pages, we provide sensitivity analyses to changes in the factors listed above.

Alternative &
Renew
able Energy A
ugust 2008
294 Exhibit 7.105: Wood-Residue Biomass Equity Returns Are Fairly Unattractive
$60
$70
$80
$90
$100
$110
$2.25 $2.50 $2.75 $3.00 $3.25 $3.50 $3.75
Cost per Installed MW (US$M)
Levl
ized
Cos
t of P
ower
(U
S$/M
Wh) 75% c.f.
85% c.f.
65% c.f.
$60
$80
$100
$120
$140
5% 6% 7% 8% 9% 10% 11% 12% 13% 14% 15%
Capitalization Rate (%)Le
vliz
ed C
ost o
f Pow
er
(US$
/MW
h) 75% c.f.
85% c.f.
65% c.f.
$60
$80
$100
$120
$140
$160
$180
$200
40 35 30 25 20 15 10 5
Expected Facility Life (Years)
Levl
ized
Cos
t of P
ower
(U
S$/M
Wh)
75% c.f.
85% c.f.
65% c.f.
0%2%4%6%8%
10%12%14%16%18%
$3.75 $3.50 $3.25 $3.00 $2.75 $2.50 $2.25
Cost per Installed MW (US$M)
IRR
65% c.f.
75% c.f.
85% c.f.
Base Case
0%2%4%6%8%
10%12%14%16%18%
$75 $80 $85 $90 $95 $100 $105
Initial Power Price (US$/MWh)
IRR
Base Case O&M @
US$70/MWh
O&M @ US$60/MWh
O&M @ US$65/MWh
0%5%
10%15%20%25%30%35%40%45%
$0 $10 $20 $30 $40 $50 $60
Carbon Credit (US$/MWh)
IRR
Open-Loop Biomass (U.S. PTC @ US$10/MWh)
No U.S. PTC
Closed-Loop Biomass (U.S. PTC @ US$20/MWh)
Base Case
Source: Scotia Capital estimates.

The Choice of a New Generation August 2008
295
Exhibit 7.106: Wood-Residue Biomass Equity Returns Are Fairly Unattractive
7.5% $75 $80 $85 $90 $95 $100 $105$70.0 - 2.7% 4.3% 6.0% 7.7% 9.5% 11.5%$67.5 - 3.4% 5.1% 6.8% 8.5% 10.4% 12.4%$65.0 2.4% 4.1% 5.8% 7.5% 9.3% 11.3% 13.3%$62.5 3.1% 4.8% 6.5% 8.3% 10.2% 12.2% 14.3%$60.0 3.8% 5.5% 7.3% 9.1% 11.1% 13.1% 15.3%$57.5 4.6% 6.3% 8.1% 10.0% 12.0% 14.1% 16.4%$55.0 5.3% 7.1% 8.9% 10.9% 12.9% 15.1% 17.5%
7.52% $3.75 $3.50 $3.25 $3.00 $2.75 $2.50 $2.2560.0% - 2.3% 3.2% 4.3% 5.5% 6.9% 8.6%65.0% 2.4% 3.3% 4.3% 5.4% 6.6% 8.2% 10.0%70.0% 3.4% 4.3% 5.3% 6.4% 7.8% 9.5% 11.5%75.0% 4.3% 5.2% 6.3% 7.5% 9.0% 10.8% 13.0%80.0% 5.1% 6.1% 7.3% 8.6% 10.2% 12.1% 14.5%85.0% 6.0% 7.1% 8.3% 9.7% 11.3% 13.4% 16.0%90.0% 6.9% 8.0% 9.3% 10.8% 12.5% 14.8% 17.6%
7.5% 8.00% 7.50% 7.00% 6.50% 6.00% 5.50% 5.00%30% 4.0% 4.7% 5.4% 6.2% 7.0% 7.9% 8.8%25% 4.4% 5.1% 5.9% 6.7% 7.5% 8.4% 9.4%20% 4.8% 5.5% 6.3% 7.1% 8.0% 8.9% 9.9%15% 5.2% 5.9% 6.7% 7.5% 8.4% 9.4% 10.4%10% 5.5% 6.3% 7.1% 7.9% 8.8% 9.8% 10.8%5% 5.8% 6.6% 7.4% 8.3% 9.2% 10.2% 11.3%0% 6.1% 6.9% 7.8% 8.7% 9.6% 10.6% 11.7%
7.5% $0 $10 $20 $30 $40 $50 $60$0.0 4.9% 7.8% 11.2% 15.1% 19.7% 25.0% 31.0%
$10.0 7.5% 10.8% 14.6% 19.2% 24.5% 30.4% 36.8%$20.0 10.5% 14.2% 18.7% 23.9% 29.8% 36.2% 42.9%
Carbon price (US$/REC or US$/ERC or US$/MWh)
Starting PPA Price (US$/MWh)
Installed Capital Cost (US$M/MW)
Cost of Debt (%)
Starting O&M Cost (US$/MWh)
Capacity Factor (%)
Effective Cash Tax Rate (%)
U.S. PTC (US$/MWh)
Source: Scotia Capital estimates.

Alternative & Renewable Energy August 2008
296
Exhibit 7.107: A Typical Biomass Steam Turbine System
Source: U.S. Department of Energy.
W O O D - R E S I D U E B I O M A S S S C I E N C E & T E C H N O L O G Y 1 0 1
Wood-residue plants are similar in concept to coal-fired plants where the fuel is burned in a boiler to create steam that turns a turbine to generate electricity (Exhibit 7.107). Wood-based fuels can take the form of raw wood waste logged from forests or processed wood in the form of chips. Moisture content is one of the most important factors in determining the burn-rate of the wood (i.e., energy conversion efficiency). Exhibit 7.108 shows the average energy content of most biomass fuel sources relative to the major fossil fuels. Unlike fossil fuels, plant matter often has a high water content, which adds to mass but contributes no energy. In general, each 10% increase in moisture content reduces the low heat value (i.e., the heat value per kilogram) of the fuel by about 11%.
The combustion of wood releases the same amount of CO2 as had the wood decomposed naturally. Whether or not wood residue plants are truly carbon neutral remains a debatable topic as burning wood accelerates the carbon cycle and also requires transportation operations that are CO2 and GHG intensive. To meet local emissions standards and qualify to earn Renewable Energy Certificates (RECs), standard burners are typically retrofitted with a bubbling fluidized bed, which provides a cleaner burn by injecting oxygen into the floor of the boiler.
The permitting and building of a wood residue plant typically takes 24 to 28 months, but varies by size and location of the proposed facility. Studies must be conducted to ensure that enough wood fuel exists to support the plant over its lifetime, typically 20 to 40 years. Site selection must consider road access given the significant transportation demands required to supply fuel to the plant.
C O A L - T O - W O O D B I O M A S S P L A N T C O N V E R S I O N
U.S. Renewables Group (USRG), a California-based private equity fund, recently acquired the Niagara Generating Facility from WPS Resources for US$31 million. USRG is now spending an additional US$25 million to convert the facility from burning coal to burning wood biomass. Once converted, the total
capital cost for the 45 MW project will come in at less than US$1.5 million per MW, or at least 50% less than a greenfield wood-residue biomass project. USRG has targeted Pennsylvania for further coal-to-biomass conversion projects.
Exhibits 7.109 and 7.110 show prominent biomass fuel source regions in both Canada and the U.S.

The Choice of a New Generation August 2008
297
Exhibit 7.108: Average Heat Content of Fuels
46
915151616171718
2830
4255
0 5 10 15 20 25 30 35 40 45 50 55 60
Grass (fresh-cut)
Wood (green, 60% moisture)
Domestic refuse (as collected)
Wood (air-dried, 20% moisture)
Straw (harvested and baled)
Dung (dried)
Commercial Waste
Paper (stacked new spapers)
Sugar cane residue
Wood (oven-dried, 0% moisture)
Coal (average)
Charcoal
Oil (petroleum)
Natural gas (at supply pressure)
GJ t-1
Fossil fuels
Typical moisture content for wood-residue biomass plants.
Source: Company reports; Scotia Capital estimates.

Alternative &
Renew
able Energy A
ugust 2008
298 Exhibit 7.109: Land Cover in Canada
Source: Statistics Canada.

299
The Choice of a N
ew G
eneration A
ugust 2008
Exhibit 7.110: Biomass Resources in the U.S.
This study estimates the technical biomass resources currently available in the United States by country. It includes the following feedstock categories: - Agricultural residues (crops and animal manure) - Wood residues (forest, primary mill, secondary mill, and urban wood) - Municipal discards (methane emissions from landfills and domestic wastewater treatment - Dedicated energy crops (on Conservation Reserve Program and Abandoned Mine Lands)
Source: National Renewable Energy Laboratory.
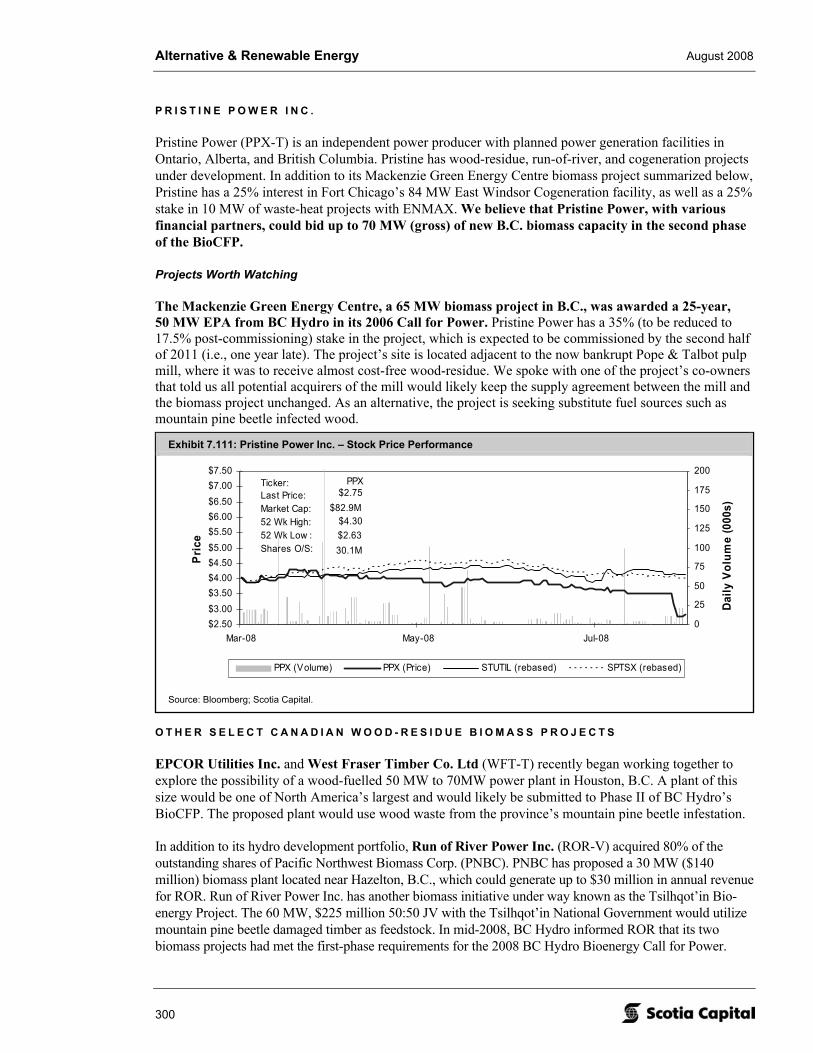
Alternative & Renewable Energy August 2008
300
Exhibit 7.111: Pristine Power Inc. – Stock Price Performance
$2.50$3.00$3.50$4.00$4.50$5.00$5.50$6.00$6.50$7.00$7.50
Mar-08 May-08 Jul-08
Pric
e
0
25
50
75
100
125
150
175
200
Daily
Vol
ume
(000
s)
PPX (Volume) PPX (Price) STUTIL (rebased) SPTSX (rebased)
$82.9M
PPX$2.75
$4.30$2.6330.1M
Ticker:Last Price:Market Cap:52 Wk High:52 Wk Low :Shares O/S:
Source: Bloomberg; Scotia Capital.
P R I S T I N E P O W E R I N C .
Pristine Power (PPX-T) is an independent power producer with planned power generation facilities in Ontario, Alberta, and British Columbia. Pristine has wood-residue, run-of-river, and cogeneration projects under development. In addition to its Mackenzie Green Energy Centre biomass project summarized below, Pristine has a 25% interest in Fort Chicago’s 84 MW East Windsor Cogeneration facility, as well as a 25% stake in 10 MW of waste-heat projects with ENMAX. We believe that Pristine Power, with various financial partners, could bid up to 70 MW (gross) of new B.C. biomass capacity in the second phase of the BioCFP.
Projects Worth Watching
The Mackenzie Green Energy Centre, a 65 MW biomass project in B.C., was awarded a 25-year, 50 MW EPA from BC Hydro in its 2006 Call for Power. Pristine Power has a 35% (to be reduced to 17.5% post-commissioning) stake in the project, which is expected to be commissioned by the second half of 2011 (i.e., one year late). The project’s site is located adjacent to the now bankrupt Pope & Talbot pulp mill, where it was to receive almost cost-free wood-residue. We spoke with one of the project’s co-owners that told us all potential acquirers of the mill would likely keep the supply agreement between the mill and the biomass project unchanged. As an alternative, the project is seeking substitute fuel sources such as mountain pine beetle infected wood.
O T H E R S E L E C T C A N A D I A N W O O D - R E S I D U E B I O M A S S P R O J E C T S
EPCOR Utilities Inc. and West Fraser Timber Co. Ltd (WFT-T) recently began working together to explore the possibility of a wood-fuelled 50 MW to 70MW power plant in Houston, B.C. A plant of this size would be one of North America’s largest and would likely be submitted to Phase II of BC Hydro’s BioCFP. The proposed plant would use wood waste from the province’s mountain pine beetle infestation.
In addition to its hydro development portfolio, Run of River Power Inc. (ROR-V) acquired 80% of the outstanding shares of Pacific Northwest Biomass Corp. (PNBC). PNBC has proposed a 30 MW ($140 million) biomass plant located near Hazelton, B.C., which could generate up to $30 million in annual revenue for ROR. Run of River Power Inc. has another biomass initiative under way known as the Tsilhqot’in Bio-energy Project. The 60 MW, $225 million 50:50 JV with the Tsilhqot’in National Government would utilize mountain pine beetle damaged timber as feedstock. In mid-2008, BC Hydro informed ROR that its two biomass projects had met the first-phase requirements for the 2008 BC Hydro Bioenergy Call for Power.

The Choice of a New Generation August 2008
301
Exhibit 7.112: Minas Basin
Source: Globe & Mail.
Tidal Power – The Next Renewable Play? O V E R V I E W
While few countries have completed tidal resource assessments, industry observers believe there are over 100,000 MW of commercially viable tidal power on the planet, representing a $300 billion to $400 billion market. Tidal power growth has mostly been limited to pilot projects in the past due to relatively inexpensive fossil fuel prices.
We believe that tidal power growth will skyrocket over the next decade, similar to the growth in installed wind power capacity over the past 10 years. A subsidiary of Russia’s Unified Energy Systems is developing two massive tidal-power projects with a total installed capacity of 11,800 MW, due online by 2020. Numerous other projects and pilot projects are popping up all over the map, all much smaller in scale than the colossal undertaking in Russia. We describe some of the key projects below.
Globally, only one utility-scale tidal-power generating station is in use, located at the mouth of the La Rance River along France’s northern coast. Built in 1966, the 240 MW power plant generates 600 GWh/y, or at a capacity factor of 28.5%. The plant’s costs have been fully recovered, and electricity production costs are lower than for nuclear power generation, at under $20/MWh.
Tidal power generation is predictable, as the ocean’s currents flow constantly. We believe that operating and maintenance costs are quite low, averaging about 0.5% per year of a project’s installed capital cost. But, capital costs are high, currently averaging $4.5 million per MW, although we think this will fall as technologies improve and economies of scale emerge.
T I D A L P O W E R P O T E N T I A L I N C A N A D A I S H U G E
With its massive coastline, Canada’s tidal power potential is about 42,000 MW, according to National Research Council, which includes 30,000 MW in Nunavut, 2,500 MW in B.C., and 2,700 MW at Nova Scotia’s Bay of Fundy. Nunavut’s large tidal resources exist as tidal ranges are greater the further an ocean shore is from the equator. No plans have been made to exploit these resources since climate conditions do not favour current infrastructure.
In early 2008, Nova Scotia’s government became the first provincial government in Canada to approve the commercial development of tidal energy. Three companies were selected to install turbines near the entrance to the Minas Basin (Exhibit 7.112). We anticipate production will commence in 2010.
B.C. is now exploring the possibility of tidal power sites around Vancouver Island.
There may be over 100,000 MW of commercially viable tidal power.
Capital costs are high, currently averaging $4.5 million per installed MW.

Alternative & Renewable Energy August 2008
302
Q U A L I T Y E Q U I T Y L I K E L Y 5 + Y E A R S A W A Y : M O D E L L I N G & S E N S I T I V I T Y A N A L Y S E S O F A T I D A L P R O J E C T
Our financial modelling and analysis of tidal power projects indicates that equity investors will be somewhat disappointed with investment returns, as expected. We modelled numerous scenarios and sensitized for variations in (1) PPA prices and escalations rates; (2) capital costs and costs of capital; (3) renewable power incentives; (4) operating & maintenance costs; (5) capacity factor; and (6) tax rates. Our average generic project yielded a sub-5% equity IRR. To arrive at this, we made the following assumptions:
• 30% capacity factor. Our research revealed that tidal capacity factors are quite similar to wind, possibly a little higher. We used 30% to be conservative.
• $4 million per MW installed cost. For the most part, pilot project costs per installed MW varied widely from about $3 million to $6 million per MW. We took the midpoint of $4.5 million and then rounded down to $4 million per MW as we assume economies of scale and technological advances will prevail soon.
• Starting PPA @ $95/MWh. We chose to use a starting PPA price below Ontario’s Standard Offer Contract price of $110/MWh as we rounded down our installed capital cost to $4 million per MW.
• Starting O&M @ $8/MWh. Various project plans we reviewed indicated that annual O&M costs would average about 0.5% of installed capital costs. Using a $4 million per MW installed capital cost, coupled with a 30% capacity factor, we rounded up to $8/MWh.
• Federal ecoENERGY incentive @ $10/MWh. We applied a $10/MWh ecoENERGY federal incentive payment on our generic project’s first 10 years of operation, with no adjustments for inflation, and to a maximum of $80 million for the project.
• Emission reduction credits @ $5/MWh. This is a highly speculative model assumption, as we do not know how ERCs will trade in the future. We decided to be conservative and keep our ERC price of $5/MWh flat for the life of the project.
• Debt to equity split 60%/40%. We chose to use a lower debt to equity ratio at 60%/40% as technologies are still unproven. Wind and run-of-river power projects can be 75% to 85% debt financed. Equity investors in renewable projects (excluding geothermal) have historically required 10% annual returns, with most falling in the 8% to 12% range. We use 14%, slightly less than geothermal projects, but more than run-of-river and onshore wind power projects.
• Other. We matched the term of debt financing to a 30-year PPA term.

303
The Choice of a N
ew G
eneration A
ugust 2008
Exhibit 7.113: Quality Tidal Power Equity Returns Are 5+ Years Away
$50$75
$100$125$150$175$200$225$250$275$300
$3.25 $3.50 $3.75 $4.00 $4.25 $4.50 $4.75
Cost per Installed MW ($M)
Levl
ized
Cos
t of P
ower
($
/MW
h) 30% c.f.
40% c.f.
20% c.f.
$30
$80
$130
$180
$230
$280
$330
$380
5% 6% 7% 8% 9% 10% 11% 12% 13% 14% 15%
Capitalization Rate (%)Le
vliz
ed C
ost o
f Pow
er
($/M
Wh)
30% c.f.
40% c.f.
20% c.f.
$0
$100
$200
$300
$400
$500
$600
$700
40 35 30 25 20 15 10 5
Expected Facility Life (Years)
Levl
ized
Cos
t of P
ower
($
/MW
h) 30% c.f.
40% c.f.
20% c.f.
0%
2%
4%
6%
8%
10%
12%
$4.75 $4.50 $4.25 $4.00 $3.75 $3.50 $3.25
Cost per Installed MW ($M)
IRR
25% c.f.
30% c.f.
40% c.f.
Base Case
0%
1%
2%
3%
4%
5%
6%
$80 $85 $90 $95 $100 $105 $110
Initial Power Price ($/MWh)
IRR
Base Case
O&M @ $12/MWh
O&M @ $4/MWh
O&M @ $8/MWh
0%
1%
2%
3%
4%
5%
6%
$0 $5 $10 $15 $20 $25 $30
ERCs ($/MWh)
IRR
No federal ecoEnergy incentive
Base Case
ecoEnergy incentive @
$10/MWh
ecoEnergy incentive @
$5/MWh
Source: Scotia Capital estimates.

Alternative & Renewable Energy August 2008
304
Exhibit 7.114: Quality Tidal Power Equity Returns Are 5+ Years Away
3.1% $80 $85 $90 $95 $100 $105 $110$14 - 1.4% 2.0% 2.6% 3.2% 3.8% 4.3%$12 - 1.6% 2.2% 2.8% 3.4% 3.9% 4.5%$10 - 1.7% 2.4% 3.0% 3.5% 4.1% 4.7%$8 1.3% 1.9% 2.5% 3.1% 3.7% 4.3% 4.9%$6 1.5% 2.1% 2.7% 3.3% 3.9% 4.5% 5.1%$4 1.7% 2.3% 2.9% 3.5% 4.1% 4.7% 5.2%$2 1.9% 2.5% 3.1% 3.7% 4.3% 4.9% 5.4%
3.15% $4.75 $4.50 $4.25 $4.00 $3.75 $3.50 $3.2515% - - - - - - -20% - - - - - 0.0% -25% - - - - 1.7% 2.5% 3.5%30% - 1.7% 2.4% 3.1% 4.0% 4.9% 5.9%35% 2.9% 3.6% 4.3% 5.2% 6.1% 7.1% 8.3%40% 4.6% 5.4% 6.2% 7.1% 8.1% 9.3% 10.6%45% 6.3% 7.1% 8.0% 9.0% 10.1% 11.4% 12.9%
3.1% 8.00% 7.50% 7.00% 6.50% 6.00% 5.50% 5.00%35% - - 1.5% 2.0% 2.7% 3.3% 3.9%30% - 1.3% 1.8% 2.4% 3.1% 3.7% 4.3%25% - 1.6% 2.2% 2.8% 3.4% 4.1% 4.7%20% - 1.9% 2.5% 3.1% 3.8% 4.4% 5.1%15% 1.7% 2.2% 2.8% 3.5% 4.1% 4.8% 5.5%10% 1.9% 2.5% 3.1% 3.8% 4.4% 5.1% 5.8%5% 2.2% 2.8% 3.4% 4.1% 4.7% 5.4% 6.1%
3.1% $0 $5 $10 $15 $20 $25 $30$0 1.9% 2.3% 2.8% 3.2% 3.7% 4.2% 4.6%$5 2.3% 2.7% 3.2% 3.6% 4.1% 4.6% 5.0%
$10 2.7% 3.1% 3.6% 4.1% 4.5% 5.0% 5.4%
Starting O&M Cost ($/MWh)
Capacity Factor (%)
Effective Cash Tax Rate (%)
ecoEnergy Incentive ($/MWh)
Starting PPA Price ($/MWh)
Installed Capital Cost ($M/MW)
Cost of Debt (%)
Carbon price ($/REC or $/ERC or $/MWh)
Source: Scotia Capital estimates.

The Choice of a New Generation August 2008
305
Exhibit 7.115: Select Areas with Mean Tidal Range >5 Metres
Country Location
Mean Tidal
RangeArea of Basin
Potential Capacity
(m) (km2) (MW)
Argentina San Jose 5.9 - 6,800Australia Secure Bay 10.9 - -Canada Cobequid 12.4 240 5,338
Cumberland 10.9 90 1,400Shepody 10.0 115 1,800Passamaquoddy 5.5 - -
India Kutch 5.3 170 900Cambay 6.8 1,970 7,000
Mexico Rio Colorado 6.5 - -United Kingdom Severn 7.8 450 8,640
Mersey 6.5 61 700Conwy 5.2 6 33
United States Passamaquoddy Bay, Maine 5.5 - -Knik Arm, Alaska 7.5 - 2,900Turnagain Arm, Alaska 7.5 - 6,501
Russia Mezen 9.1 2,300 19,200Penzhinskaya Bay 6.0 20,500 87,000
Source: Company reports; Scotia Capital.
Exhibit 7.116: A Generic Tidal Barrage Schematic
Source: Energy Authority of New South Wales.
T I D A L P O W E R S C I E N C E & T E C H N O L O G Y 1 0 1
Tidal power generating systems typically operate 10 hours a day, during the time the tides are in motion. Unlike wind patterns, tidal patterns are extremely predictable, therefore reducing the implications of intermittency.
Exploitable sites require a mean tidal range exceeding three metres, a requirement that can be met by only 20 to 40 site locations globally.
Two methods exist to generate electricity through tidal resources: one is through a barrage tidal system, and the other is a tidal stream power system, both explained below.
Barrage Tidal Power
Only about 20 locations worldwide have sufficient resources to construct a tidal barrage. Tidal barrages are built across estuaries and are designed to capture energy through the rise and fall of tides. Provided there is a large enough difference in the water levels on either side of the barrage, water is allowed to flow through the turbines. As the tide comes in, water passes through the barrage and is held in an estuary or basin. Once the tide wanes, the barrage’s sluice gates open, driving turbines and generating electrical power. Currently, a minimum difference of five metres between high and low tide is required to economically implement a tidal barrage. Exhibit 7.115 lists select regions where the mean tidal range is greater than 5 metres, while Exhibit 7.116 shows a tidal barrage schematic.
Tidal Stream Power
A second method to capturing tidal energy is through tidal streams, which is quickly gaining in popularity. This approach captures energy through turbines, similar to wind turbines, the primary difference being that the turbines are submerged underneath the water (Exhibit 7.117). Unlike barrages, these turbines are relatively simple to construct and are fairly inexpensive.
Exploitable tidal sites require a mean tidal range exceeding three metres.
Tidal power investment is gaining in popularity.

Alternative & Renewable Energy August 2008
306
Exhibit 7.117: A Tidal Stream Power System
Source: Aviation Enterprises Ltd.
Exhibit 7.118: The Bay of Fundy Has the Highest Tides in the World
Source: Hopewell Rocks.
P A S S I N G T H E B A Y O F F U N D Y T E S T
In the world of tidal power, if an underwater tidal stream facility can successfully operate in Nova Scotia’s fierce Bay of Fundy, it will almost certainly function in any other tidal stream on the planet. The Bay of Fundy has the world’s highest tides, with a peak tidal range of 16 metres (Exhibit 7.118).
In January 2008, the government of Nova Scotia picked three firms to establish tidal stream demonstration projects in the Bay of Fundy that will cost $40 million in total. The three companies selected were Clean Current Power Systems, Emera’s Nova Scotia Power (NSPI), and Minas Basin Pulp and Paper. Minas Basin Pulp and Paper will also construct the infrastructure required to connect all of the projects to the province’s electric grid.
Nova Scotia’s Bay of Fundy has the world’s highest tides.

The Choice of a New Generation August 2008
307
Exhibit 7.119: Clean Current’s Mark III
Source: Clean Current Power Systems.
Exhibit 7.121: UEK’s Turbine for Minas Basin Pulp & Paper’s Pilot Project
Source: UEK.
Exhibit 7.120: NSPI Will Use OpenHydro’s Turbine
Source: Open Hydro.
Clean Current Power Systems
Based in Vancouver, Clean Current Power Systems is one of three companies selected by the Nova Scotia government to install pilot project tidal turbines at the Bay of Fundy. The company’s 2.2 MW Mark III turbines have only one moving part and no drive shaft or gearbox (Exhibit 7.119). The model is designed for tidal currents peaking at 4.5 m/s, and will deliver about 4 GWh of electricity per year, representing a capacity factor of 20.8%. This turbine model successfully tested near Race Rock, B.C. for three months in 2006, and is expected to have a service life of 25 to 30 years, similar to wind turbines. The project will cost $4 million per MW, split 75% for the turbines and 25% for installation.
Nova Scotia Power Inc.
Emera’s NSPI already owns and operates the 20 MW Annapolis tidal power facility, which generates about 30 GWh/y, using tidal barrage technology. In its tidal stream pilot project, NSPI selected OpenHydro’s turbine technology, which is fairly similar to Clean Current Power System’s Mark III turbine (Exhibit 7.120). In early 2008, NSPI purchased a 7% interest in OpenHydro for $15 million.
Minas Basin Pulp & Paper
Minas Basin Pulp and Paper plans to install UEK’s hydrokinetic buoyant turbine with a cost estimate of $5 million to $7 million. The 0.5 MW turbine is unique in that, instead of being secured to the ocean floor, it will function similar to a kite by floating to the point with the greatest current; refer to Exhibit 7.121.

Alternative & Renewable Energy August 2008
308
S E L E C T G L O B A L T I D A L P O W E R P R O J E C T S
The United Kingdom appears to be the world leader in tidal power development with about as many pilot projects as the rest of the world combined. The reason for this is simple: government incentives. In the U.K., and beginning in 2009, twice as many Renewable Obligation Certificates (ROCs) per MWh will be granted to tidal stream power projects than for onshore wind projects. Additionally, the 2008 U.K. Energy Bill awarded tidal projects the greatest level of financial support among all renewable technologies. Below, we have summarized some key tidal power project developments over the past year.
1. China. Chinese officials from Liaoning province are building a 300 MW tidal power project based on artificial tidal lagoons, known as the Yalu project. Tidal Electric Ltd. of the United Kingdom will supply the turbines and construct the project. According to Modern Power Systems, since the 2004 agreement was signed, little has happened. With a stated cost of US$600 million, or US$2 million per MW, we believe the estimate is for the turbines only.
2. India. The West Bengal Renewable Energy Development Agency is developing a 4 MW tidal power project that is expected to cost US$12.6 million, or US$3.15 million per installed MW. 100% of the funding is from the central (90%) and the state governments (10%). The project is scheduled online in 2010.
3. Scotland. In mid-2007, Scottish Power (owned by Iberdrola – the world’s largest wind farm developer) formed a JV with Norway’s Statoil to test tidal stream technology off the coast of Britain. A project manager stated if the pilot is commercialized, the cost to produce power will range between US$80/MWh to US$130/MWh. Project commissioning is expected in 2009.
4. South Korea. Daewoo Engineering & Construction recently ordered tidal barrage equipment rated at 260 MW from an Austrian manufacturer, to construct its Lake Sihwa project, expected to be the world’s largest tidal power plant. Daewoo has a turnkey contract for the plant at US$250 million, with an estimated commissioning date of 1H/09.
5. United Kingdom. The British government has launched a study into building a massive tidal barrage across the Severn Estuary between England and Wales. The potential capacity of the project at 8,600 MW is astounding, and could provide 5% of the U.K.’s power requirements, as well as help the nation reach its goal of cutting its CO2 emissions 20% below 1990 levels by 2020. The estuary has the second highest tidal range in the world at 14 metres. The cost is £15 billion, or approximately US$3.5 million per MW.
6. United Kingdom. Marine Current Turbines and Npower Renewables have established a JV to develop a 10.5 MW commercial tidal power stream project off the coast of North Wales. Seven turbines, rated 1.5 MW each, are expected to be commissioned by 2012. If operationally successful, the project would be one of the world’s largest tidal stream power facilities. Financing for the project remains incomplete. The total installed cost is estimated at US$3.8 million to US$5.7 million per MW.
7. United Kingdom. A subsidiary of German utility E.ON AG, along with JV partner Lunar Energy, intends to construct an 8 MW tidal stream power plant off the coast of Wales. If approved, the facility would be operational by 2011 at the latest.
8. United States. The Roosevelt Island Tidal Energy project is installing six tidal turbines in New York’s East River to demonstrate the potential of tidal stream power. The US$8 million pilot project will be operational for 18 months. Verdant Power (Canada), the project developer, hopes that a successful project will result in a 10 MW commercial tidal farm at a cost of US$2.5 million to US$3 million per MW.
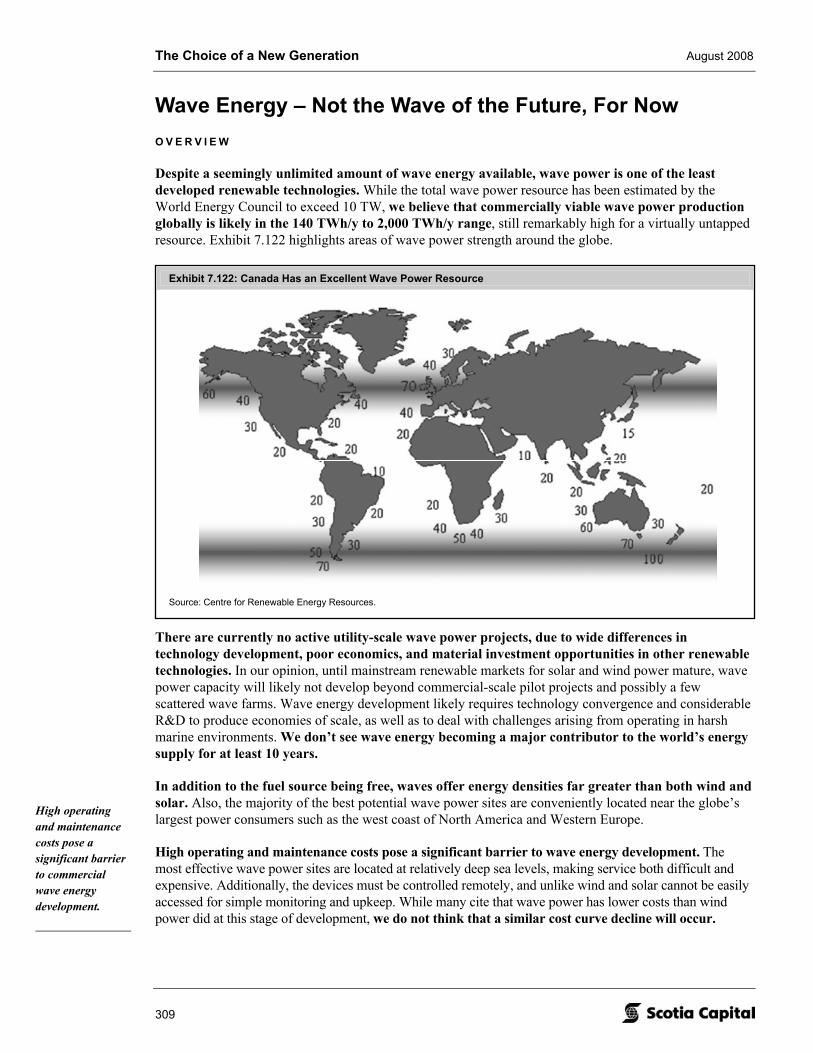
The Choice of a New Generation August 2008
309
Exhibit 7.122: Canada Has an Excellent Wave Power Resource
Source: Centre for Renewable Energy Resources.
Wave Energy – Not the Wave of the Future, For Now O V E R V I E W
Despite a seemingly unlimited amount of wave energy available, wave power is one of the least developed renewable technologies. While the total wave power resource has been estimated by the World Energy Council to exceed 10 TW, we believe that commercially viable wave power production globally is likely in the 140 TWh/y to 2,000 TWh/y range, still remarkably high for a virtually untapped resource. Exhibit 7.122 highlights areas of wave power strength around the globe.
There are currently no active utility-scale wave power projects, due to wide differences in technology development, poor economics, and material investment opportunities in other renewable technologies. In our opinion, until mainstream renewable markets for solar and wind power mature, wave power capacity will likely not develop beyond commercial-scale pilot projects and possibly a few scattered wave farms. Wave energy development likely requires technology convergence and considerable R&D to produce economies of scale, as well as to deal with challenges arising from operating in harsh marine environments. We don’t see wave energy becoming a major contributor to the world’s energy supply for at least 10 years.
In addition to the fuel source being free, waves offer energy densities far greater than both wind and solar. Also, the majority of the best potential wave power sites are conveniently located near the globe’s largest power consumers such as the west coast of North America and Western Europe.
High operating and maintenance costs pose a significant barrier to wave energy development. The most effective wave power sites are located at relatively deep sea levels, making service both difficult and expensive. Additionally, the devices must be controlled remotely, and unlike wind and solar cannot be easily accessed for simple monitoring and upkeep. While many cite that wave power has lower costs than wind power did at this stage of development, we do not think that a similar cost curve decline will occur.
High operating and maintenance costs pose a significant barrier to commercial wave energy development.

Alternative & Renewable Energy August 2008
310
Exhibit 7.124: Mean Annual Wave Power in B.C.
Source: Ocean Renewable Energy Group.
Exhibit 7.125: Wave Power off Canada’s East Coast
Source: Ocean Renewable Energy Group.
Exhibit 7.123: Seasonal Wave Power Flux
0
20
40
60
80
100
Jan Feb Mar Apr May Jun Jul Aug Sep Oct Nov Dec
Wav
e P
ower
(kW
/m)
B.C. Atlantic B.C. Average Atlantic Average
Wave flux in w inter is as much as 9 times more than during summer months.
Annual flux of 48 kW/m and 36 kW/m.
Source: Natural Resource Council.
Wave energy is highly seasonal, and wave power flux during winter months can measure 9x more than during summer months (Exhibit 7.123). The seasonal variation of wave power generation makes grid integration difficult, and limits operators to selling the majority of their power in winter months. However, on a daily basis, wave power is less variable than both solar and wind power.
In our view, wave energy development is likely 10 to 15 years behind wind power and will not make up a significant part of the world’s energy supply until at least 2030.
L I M I T E D D E V E L O P M E N T I N C A N A D A , B U T T H E P O T E N T I A L I S P R O M I S I N G
B.C. has over 37,000 MW of potential wave power. Wave flux on some of B.C.’s coastline has been measured as high as 54 kW/m, making this region one of the most abundant wave power sources in the world (Exhibit 7.124). Despite mild climates, the strong wave energy off the B.C. coast is attributable to significant ocean exposure and to favourable bathymetry (sea-bed shape).While wave fluxes greater than 70 kW/m do exist in Europe, the resource is located much further away from the coast than compared to B.C.

The Choice of a New Generation August 2008
311
Exhibit 7.128: Finavera Wave Technology
Source: Finavera.
Exhibit 7.126: Wave Power Capital Cost Breakdown
Device, 20%
Moorings, 2%
Transmission, 21%
Installation, 25%
Commissioning, 5%
Decommissioning, 21%
Design, engineering, and management, 4%
Insurance, 2%
Source: Carbon Trust.
Exhibit 7.127: Wave Power O&M Breakdown
Monitoring, 4%
Planned maintenance,
29%
Unplanned maintenance,
28%
Insurance, 14%
Refit, 24%
Licences, 1%
Source: Carbon Trust.
W A V E P O W E R S C I E N C E & T E C H N O L O G Y 1 0 1
Wave energy is a concentrated form of solar energy, generated when wind passes over water, transferring energy to the water in the form of waves. Wave energy is mainly a function of wind speed, as well as the distance over which the wind blows. Wave-based power is substantially reduced as it approaches shore, primarily due to the friction that develops between the wave and the sea bed. Ideal sea beds are those with material depth close to shore.
A variety of wave power technologies are in development, and have been so for almost 20 years. Exhibit 7.130 (on page 318) compares four of the most common technologies that we have seen. We believe that future wave power development is likely to gravitate towards deep water installations to take advantage of the higher wave power away from shore.
F I N A V E R A – C A N A D A ’ S W A V E P O W E R L E A D E R
Finavera (FVR-V), a Canadian renewable energy company with both wind and wave energy projects, is the only Canadian company that offers investors exposure to wave energy. While FVR is slowly advancing its wave projects, the company’s short- to mid-term stock performance is heavily dependent on its wind power progress. FVR has three wave projects under development in North America, a PPA signed for a future project in California, and an early-stage project in South Africa.
We believe that future wave power development is likely to gravitate towards deepwater installations.

Alternative & Renewable Energy August 2008
312
Exhibit 7.129: Finavera Renewables – Stock Performance
$0.10$0.15$0.20$0.25$0.30$0.35$0.40$0.45$0.50$0.55$0.60
Dec-07 Feb-08 Apr-08 Jun-08
Pric
e
02004006008001,0001,2001,4001,6001,8002,000
Dai
ly V
olum
e (0
00s)
FVR (Volume) FVR (Price) STUTIL (rebased) SPTSX (rebased)
$35.5M
FVR$0.18
$0.52$0.10
202.9M
Ticker:Last Price:Market Cap:52 Wk High:52 Wk Low :Shares O/S:
Source: Bloomberg; Scotia Capital.
Trinidad, California Project
Pacific Gas and Electric issued FVR a PPA for a 2 MW wave farm to be located off the shore of northern California. The project is set to begin delivering power in 2012 and has the potential to expand its capacity by up to 100 MW. The expected capacity factor of the project is 22%, on the lower end of the 20% to 45% range that we have seen.
Makah Bay, Ucluelet, and Coos Projects
FVR’s Makah Bay project is located off the coast of Neah Bay, Washington, and is a 1 MW demonstration project with an expected capacity factor of 17% (i.e., ~1,500 MWh/y). Off the coast of Ucluelet, B.C., FVR is planning a 5 MW project, and a preliminary permit has been granted for a 100 MW wave farm near Coos Bay, Oregon.
S E L E C T G L O B A L W A V E P O W E R P R O J E C T S
Similar to tidal power, the U.K. is also a leader in wave power development, accounting for many of the world’s wave projects. Government incentives for wave power development there are identical to tidal power, at two ROCs per MWh. Below we summarize select wave power project development.
1. United Kingdom. The Wave Hub, a demonstration project that will include four different wave power conversion technologies, was recently delayed until 2010, or one year later than expected. Within the Wave Hub will be a 5 MW installation using Pelamis technology, and three other technologies contributed by Fred Olsen, Ocean Power Technologies, and Oceanlinx.
2. Ireland. In April 2007, Wave Dragon submitted its environmental impact statement for a 70 MW wave power plant in the Celtic Sea. The project will begin with the deployment of a 7 MW pre-commercial demonstrator.
3. Scotland. In September 2007, ScottishPower was granted permission for a 3 MW wave facility using four Pelamis devices off the west coast of the Orkney mainland, Scotland. The project is expected to be operating by the end of 2008, as underwater cabling, licensing, and funding is complete. The installed capital cost is estimated at $6.7 million per MW.

The Choice of a New Generation August 2008
313
4. Hawaii. In February 2008, Oceanlinx signed an MoU with Renewable Hawaii, where three of Oceanlinx’s wave energy converters will be installed providing 2.7 MW of power. Oceanlinx’s technology is a floating oscillating water column device. The company already has a 450 kW PPA signed in Port Kembla, Australia, and is obtaining the necessary environmental permits for a 27 MW wave project, made up of 18 1.5 MW units, located near Victoria, Australia.
5. Portugal. Enersis, a Spanish company, will use Pelamis Wave Power technology to launch one of the world’s first commercial wave farms. The project will begin with three “sea snakes,” which if successful, could eventually increase to hundreds, producing enough electricity to power about 350,000 homes. Portugal aims to one day supply 20% of its electricity needs by wave power.

Alternative &
Renew
able Energy A
ugust 2008
314 Exhibit 7.130: Select Wave Power Technologies
Point Absorption Attenuator Oscillating Water Column Overtopping
Process
Point absorbers are f loating structures w here the vertical motion of the w aves is converted to energy. The relative motion is used to drive w ater up a vertical shaft into a buoy, w hich then turns a turbine. Individual devices range from 100 kW to 750 kW.
The 140m long device is made up of several sections, w hich ride the w aves transferring energy through the use of hydraulic motors in betw een the articulating sections.
OWC devices use w ater to compress air in a closed chamber, w hich then turns a bi-directional Wells turbine. Challenges w ith OWC systems include low turbine eff iciencies and the inability for the device to self start. OWC devices can be installed either onshore or offshore.
This system uses a w ave reflector to drive w ater tow ards a ramp and onto reservoir that is above the normal sea level. The raised w ater is then dropped over turbines to create electricity.
Postitives
The technology is scalable, and due to its small size, the buoy can ride out violent storms. The buoys can also absorb w ave energy regardless of the direction of the w aves.
Scalable, and does not need to be grounded to the ocean f loor. One of the most developed w ave pow er technologies that operates at capacity factors betw een 25-40%.
All of the moving parts operate above w ater w ith the compression chamber being the only component operating below w ater. The technology is mechanically simple. The onshore location for some devices eliminates the challenge of offshore maintenance.
Can be located offshore as the device must only be slack-moored to ocean bed. Given the large physical size the device can undergo maintenance w hile at sea.
Negatives
The small size of the device requires on shore maintenance.
At extremely long w avelengths the system can become unstable, making use in large storms diff icult. The device must alw ays be oriented perpendicular to the w ave front in order to operate, and must also be moored to the sea bed.
Onshore devices capture smaller amounts of the potential w ave pow er that is available offshore. Given the reduced w ave pow er, operating costs per MWh are estimated to be higher than other w ave technologies.
Given its large size, the devices do not scale w ell into a w ave farm.
Source: Company reports.

The Choice of a New Generation August 2008
315
Exhibit 7.131: Wave Power Potential Is Greatest Near the Equator
Source: National Renewable Energy Laboratory.
Ocean Thermal Energy Conversion – Using Earth’s Largest Solar Panel
O V E R V I E W
The ocean surface, effectively a massive solar panel, has several times more potential power than either wave or tidal power. The majority of the resource is focused around the equator where water temperature gradients are the greatest (Exhibit 7.131). Despite the size and availability of the resource, Ocean Thermal Energy Conversion (OTEC) is mostly still in the R&D phase, with only a handful of projects having been demonstrated over the last 50 years.
In our view, Canada and many of the States will not see significant OTEC development given the lack of access to favourable ocean temperature differentials. According to the National Renewable Energy Laboratory, only four markets will likely support OTEC over the next 10 years, three of which are located near the central or southern Pacific Ocean. The fourth is an obscure concept for a floating energy island that would support not only OTEC power, but also other renewables such as wind and solar.
Major positives for OTEC beyond its resource size include the ability for the technology to operate all day without suffering from major power fluctuations or variability, and that the process can generate useful byproducts such as fresh water. The ocean’s surface temperature is fairly stable within a few degrees over a 24-hour period, providing the potential for base load power. Further, a standard open-cycle OTEC process brings up cool water that can be used for air conditioning, and that also produces fresh water.
A lack of working projects, high capital costs, and limited government incentives will likely keep OTEC on the backburner for up to 20 years. Only recently have some demonstration project proposals gained enough momentum to become funded. The U.S. government has proposed a 13 MW facility near Diego Garcia while the U.S. Army wants a facility in the Marshall Islands. We note that these areas and Hawaii, the centre for OTEC research, are minor consumers of electricity and are fairly isolated, resulting in high power prices that could make OTEC power economical there before most other places.
OTEC facilities require substantial capital costs, not only for the pipe material to bring water up from 1,000+ metres below the surface, but also for a strong pump to bring water to the surface.
O T E C S C I E N C E & T E C H N O L O G Y 1 0 1
OTEC is an indirect form of solar power that extracts thermal energy from water based on ocean temperature differences between sun-heated surface waters and cool subsurface waters. The hot surface water is used to turn a turbine, while the cool water piped up from 1 km below the ocean’s surface is used for condensing the steam. The process normally requires a temperature difference of 20°C.
In our view, Canada and the U.S. will not see significant OTEC development, given the lack of access to favourable ocean temperature differentials.
The ocean’s surface temperature is fairly stable over a 24-hour period, providing the potential for base load power.

Alternative & Renewable Energy August 2008
316
Exhibit 7.132: Closed Cycle OTEC Device
Source: Saga University.
Closed-Cycle OTEC
A closed-cycle system relies on vapour created by the hot surface water to drive a turbine. Surface water is pumped through a heat exchanger where it heats a liquid with a low boiling point such as ammonia. Cool subsurface waters then pass through a second heat exchanger to condense the vapour back into liquid form. A visual representation of a closed-cycle system is in Exhibit 7.132.
Open-Cycle OTEC
In an open-cycle process, which is very similar to a closed cycle process, the cycle uses ocean water instead of ammonia to create a vapour. This process produces fresh water as a byproduct when the steam is condensed by the cooler sub-sea water.

The Choice of a New Generation August 2008
317
Detailed B.C. Environmental Assessment Steps
Source: B.C. Environmental Assessment Office.
Appendix 1
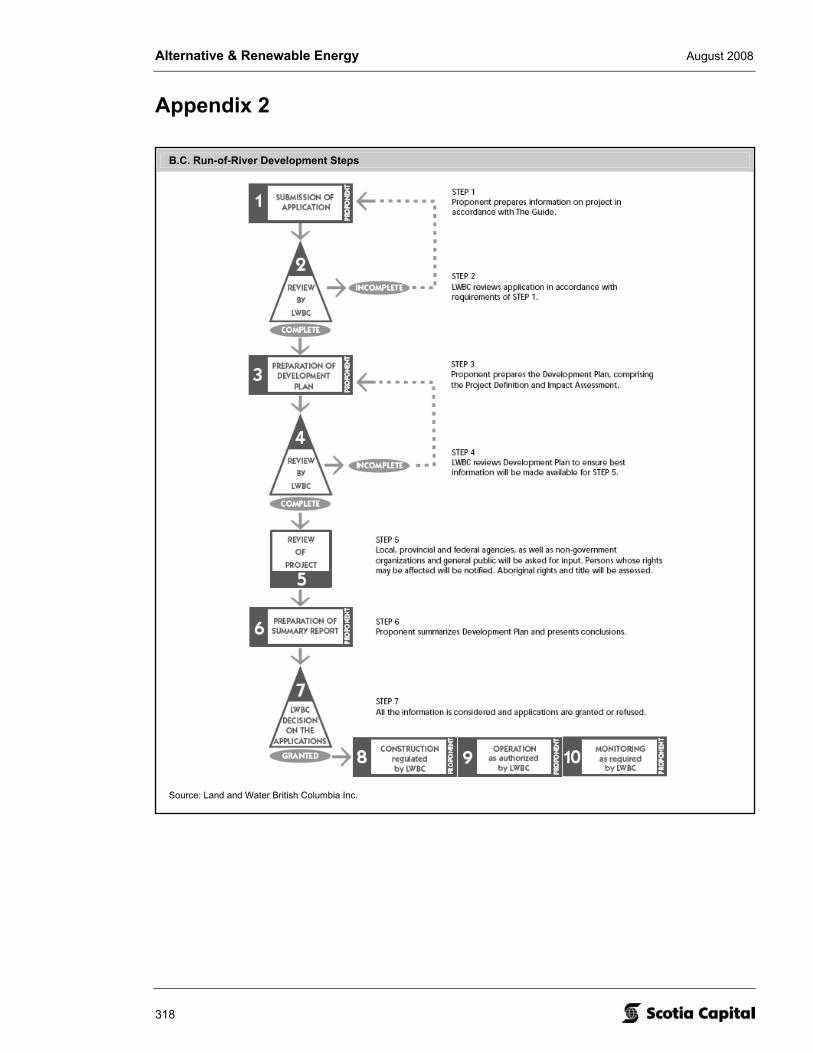
Alternative & Renewable Energy August 2008
318
B.C. Run-of-River Development Steps
Source: Land and Water British Columbia Inc.
Appendix 2

The Choice of a New Generation August 2008
319
BC Hydro 2006 Results Call for Power
Bidder Name Project Name Nearby City Energy Source Capacity (MW) Energy (GWh/yr)
Plutonic Pow er Corporation East Toba and Montrose Hydroelectric Project Pow ell River Water 196 702*AESWapiti Energy Corporation AESWapiti Energy Corporation Tumbler Ridge Coal / Biomass 184 1,612Dokie Wind Energy Inc. Dokie Wind Project Chetw ynd Wind 180 536Bear Mountain Wind Limited Partnership Bear Mountain Wind Park Daw son Creek Wind 120 3713986314 Canada Inc. Canada - Glacier / How ser / East - Project Nelson Water 91 341Green Island Energy Ltd. Gold River Pow er Project Gold River Biomass 90 745Kw alsa Energy Limited Partnership Kw alsa Energy Project Mission Water 86 384Anyox Hydro Electric Corp. Anyox and Kitsault River Hydroelectric Projects Alice Arm Water 57 242Compliance Pow er Corporation Princeton Pow er Project Princeton Coal / Biomass 56 421Upper Stave Energy Limited Partnership Upper Stave Energy Project Mission Water 55 264Mackenzie Green Energy Inc. Mackenzie Green Energy Centre Mackenzie Biomass / Other 50 441Kw oiek Creek Resources Limited Partnership Kw oiek Creek Hydroelectric Project Lytton Water 50 147Mount Hays Wind Farm Limited Partnership Mount Hays Wind Farm Prince Rupert Wind 25 72Canadian Hydro Developers, Inc. Bone Creek Hydro Project Kamloops Water 20 81Songhees Creek Hydro Inc. Songhees Creek Hydro Project Port Hardy Water 15 61Plutonic Pow er Corporation Rainy River Hydroelectric Project Gibson Water 15 51*Hydromax Energy Ltd. Low er Clow hom Sechelt Water 10 48Hydromax Energy Ltd. Upper Clow hom Sechelt Water 10 45Global Cogenix Industrial Corporation Kookipi Creek Hydroelectric Project Boston Bar Water 10 39Cogenix Pow er Corporation Log Creek Hydroelectric Project Boston Bar Water 10 38Canadian Hydro Developers, Inc. Clemina Creek Hydro Project Kamloops Water 10 31KMC Energy Corp. Tamihi Creek Hydro Project Chilliw ack Water 10 52Valisa Energy Incorporated Serpentine Creek Hydro Project Blue River Water 10 29Synex Energy Resources Ltd. Victoria Lake Hydroelectric Project Port Alice Water 10 39Second Reality Effects Inc. Fries Creek Project Squamish Water 9 41Renew able Pow er Corp. Tyson Creek Hydro Project Sechelt Water 8 48Hupacasath First Nation Franklin River Hydro Project Port Alberni Water 7 19Axiom Pow er Inc. Clint Creek Hydro Project Woss Water 6 27EnPow er Green Energy Generation Inc. Savona ERG Project Savona Waste Heat 6 41EnPow er Green Energy Generation Inc. 150 Mile House ERG Project 150 Mile House Waste Heat 6 34Maroon Creek Hydro Partnership Maroon Creek Hydro Project Terrace Water 5 25Spuzzum Creek Pow er Corp. Sakw i Creek Run of River Project Agassiz Water 5 21Canadian Hydro Developers, Inc. English Creek Hydro Project Revelstoke Water 5 19Synex Energy Resources Ltd. Barr Creek Hydroelectric Project Tahsis Water 4 15Raging River Pow er & Mining Inc. Raging River 2 Port Alice Water 4 13Synex Energy Resources Ltd. McKelvie Creek Hydroelectric Project Tahsis Water 3 14Advanced Energy Systems Ltd. Cranberry Creek Pow er Project Revelstoke Water 3 11District of Lake Country Eldorado Reservoir Kelow na Water 1 4Subtotal 1,439 7,125Brilliant Expansion Pow er Corporation Brilliant Expansion Project (2) Castlegar Water 120 226Total 1,559 7,351* Engineering optimization later increased the expected output to 745 GWh/y for the Toba/Montrose Creek project and to 53 GWh/y for the Rainy River project.
Source: BC Hydro; Scotia Capital.
Appendix 3 • Winning bids and details of BC Hydro’s 2006 Call for Tender are summarized as follows:
• Sixteen large stream projects for 5,700 GWh/y of Firm Energy and 750 GWh/y of Non-Firm Energy. These projects were awarded at an average bid price of $74/MWh;
• Twenty-two small stream projects at an average starting power price of $70/MWh for an estimated 650 GWh/y of energy;
• A 230 GWh/y contract to Brilliant Expansion Power Corporation, an affiliate of the Columbia Power Corporation; and
• An average EPA term of 30 years, with an average completion date set between 2010 and 2011.
• Clean energy represented 73% of the capacity awarded in the 2006 BC Hydro CFP. This included 29 hydro, three wind, two biomass, and two waste heat projects.

Appendix A: Important Disclosures Company Ticker Disclosures* ATS Automation Tooling Systems Inc. ATA P, U, U8 Boralex Inc. BLX T Canadian Hydro Developers Inc. KHD U Cascades Inc. CAS B2 EarthFirst Canada Inc. EF U The following analysts certify that (1) the views expressed in this report in connection with securities or issuers they analyze accurately reflect their personal views and (2) no part of their compensation was, is, or will be directly or indirectly, related to the specific recommendations or views expressed by them in this report: Ben Isaacson, Tony Courtright, Benoît Laprade, and David Tyerman. The Research Analyst's compensation is based on various performance and market criteria and is charged as an expense to certain departments of Scotia Capital Inc., including investment banking. Scotia Capital Inc. and/or its affiliates: expects to receive or intends to seek compensation for investment banking services from issuers covered in this report within the next three months; and has or seeks a business relationship with the issuers referred to herein which involves providing services, other than securities underwriting or advisory services, for which compensation is or may be received. These may include services relating to lending, cash management, foreign exchange, securities trading, derivatives, structured finance or precious metals. For Scotia Capital Research analyst standards and disclosure policies, please visit http://www.scotiacapital.com/disclosures * Legend B2 The Executive Vice-Chairman of Cascades Inc. is a director of The Bank of Nova Scotia. P This issuer paid a portion of the travel-related expenses incurred by the Fundamental Research
Analyst/Associate to visit material operations of this issuer. U Within the last 12 months, Scotia Capital Inc. and/or its affiliates have undertaken an underwriting
liability with respect to equity or debt securities of, or have provided advice for a fee with respect to, this issuer.
U8 Scotia Capital Inc has been retained by ATS Automation Tooling Systems Inc. to assist in identifying and evaluating strategic alternatives available for its PCG operations, including divesture.
T The Fundamental Research Analyst/Associate has visited material operations of this issuer.

Definition of Scotia Capital Equity Research Ratings & Risk Rankings We have a three-tiered rating system, with ratings of 1-Sector Outperform, 2-Sector Perform, and 3-Sector Underperform. Each analyst assigns a rating that is relative to his or her coverage universe. Our risk ranking system provides transparency as to the underlying financial and operational risk of each stockcovered. Statistical and judgmental factors considered are: historical financial results, share price volatility, liquidity ofthe shares, credit ratings, analyst forecasts, consistency and predictability of earnings, EPS growth, dividends, cashflow from operations, and strength of balance sheet. The Director of Research and the Supervisory Analyst jointly make the final determination of all risk rankings. Ratings
1-Sector Outperform The stock is expected to outperform the average total return of the analyst’s coverage universe by sector over the next 12 months. 2-Sector Perform The stock is expected to perform approximately in line with the average total return of the analyst’s coverage universe by sector over the next 12 months. 3-Sector Underperform The stock is expected to underperform the average total return of the analyst’s coverage universe by sector over the next 12 months. Other Ratings Tender – Investors are guided to tender to the terms of the takeover offer. Under Review – The rating has been temporarily placed under review, until sufficient information has been received and assessed by the analyst.
Risk Rankings
Low Low financial and operational risk, high predictability of financial results, low stock volatility. Medium Moderate financial and operational risk, moderate predictability of financial results, moderate stock volatility. High High financial and/or operational risk, low predictability of financial results, high stock volatility. Caution Warranted Exceptionally high financial and/or operational risk, exceptionally low predictability of financial results, exceptionally high stock volatility. For risk-tolerant investors only. Venture Risk and return consistent with Venture Capital. For risk-tolerant investors only.
Scotia Capital Equity Research Ratings Distribution*
Distribution by Ratings and Equity and Equity-Related Financings* Percentage of companies covered by Scotia Capital Equity Research within each rating category. Percentage of companies within each rating category for which Scotia Capital has undertaken an underwriting liability or has provided advice for a fee within the last 12 months.
Source: Scotia Capital.
For the purposes of the ratings distribution disclosure the NASD requires members who use a ratings system with terms different than “buy,” “hold/neutral” and “sell,” to equate their own ratings into these categories. Our 1-Sector Outperform, 2-Sector Perform, and 3-Sector Underperform ratings are based on the criteria above, but for this purpose could be equated to buy, neutral and sell ratings, respectively.
Scotia Capital Equity Research Team HEAD OF EQUITY RESEARCH Greg Pardy, CFA..........................................(416) 945-7393 [email protected] SUPERVISORY ANALYST Claude King, CFA.........................................(416) 863-7985 [email protected] DIRECTOR OF ADMINISTRATION Erika Osmond...............................................(416) 945-4529 [email protected] CHINA STRATEGY Na Liu, CFA..................................................(416) 945-4235 [email protected] CONSUMER DISCRETIONARY Autos & Components David Tyerman .............................................(416) 863-7108 [email protected] Cable John Henderson, P.Eng ...............................(416) 863-7780 [email protected] Hotels, Restaurants & Leisure Turan Quettawala, CFA................................(416) 863-7065 [email protected] Media Paul Steep....................................................(416) 945-4310 [email protected] CONSUMER STAPLES Food Products Cherilyn Radbourne, CA, CFA .....................(416) 863-2899 [email protected] Retailing Ryan Balgopal, CFA.....................................(416) 863-7902 [email protected] ENERGY Energy Equipment & Services Peter Doig, CFA ...........................................(403) 213-7331 [email protected] Oil & Gas – Integrated and E&P Mark Polak, CFA ..........................................(403) 213-7349 [email protected] Oil & Gas – International Gavin Wylie ..................................................(403) 213-7333 [email protected] Oil & Gas – Junior E&P Peter Doig, CFA........................................... (403) 213-7331 [email protected] George Toriola, P.Eng. ................................(403) 213-7345 [email protected] FINANCIALS Banks & Diversified Financials Kevin Choquette, CFA, CMA........................(416) 863-2874 [email protected] Diversified Financials – Small Cap Phil Hardie, CFA, P.Eng...............................(416) 863-7430 [email protected] Insurance Tom MacKinnon, FSA, FCIA, MAAA............(416) 863-7299 [email protected]
HEALTH CARE John Maletic, BSc Pharm, CFA ....................(416) 863-7708 [email protected] INCOME TRUSTS Diversified Business Trusts Navdeep Malik..............................................(416) 863-7499 [email protected] Turan Quettawala, CFA................................(416) 863-7065 [email protected] Power & Energy Infrastructure Trusts Tony Courtright, CA......................................(416) 945-4536 [email protected] REITs Mario Saric, CA, CFA ...................................(416) 863-7824 [email protected] Pammi Bir, CA, CFA.....................................(416) 863-7218 [email protected] INDUSTRIALS Transportation & Aerospace David Tyerman .............................................(416) 863-7108 [email protected] Cherilyn Radbourne, CA, CFA .....................(416) 863-2899 [email protected] INFORMATION TECHNOLOGY Hardware & Equipment Gus Papageorgiou, CFA ..............................(416) 863-7552 [email protected] Software & Services Paul Steep ....................................................(416) 945-4310 [email protected] MATERIALS Chemicals Sam Kanes, CA, CFA...................................(416) 863-7798 [email protected] Gold & Precious Minerals Trevor Turnbull, MSc ....................................(416) 863-7427 [email protected] David Christie, P.Geo ...................................(416) 863-7141 [email protected] Metals & Mining Lawrence Smith, CFA...................................(416) 945-4526 [email protected] Paper & Forest Products Benoît Laprade, CA, CFA.............................(514) 287-3627 [email protected] PORTFOLIO STRATEGY Vincent Delisle, CFA.....................................(514) 287-3628 [email protected] QUANTITATIVE STRATEGY Darwin McGrath, CFA ..................................(416) 863-7293 [email protected] REAL ESTATE Mario Saric, CA, CFA ...................................(416) 863-7824 [email protected] Pammi Bir, CA, CFA.....................................(416) 863-7218 [email protected] SPECIAL SITUATIONS Anthony Zicha...............................................(514) 350-7748 [email protected]
Cherilyn Radbourne, CA, CFA..................... (416) 863-2899 [email protected] David Tyerman ............................................ (416) 863-7108 [email protected] TELECOMMUNICATION SERVICES John Henderson, P.Eng. ............................ (416) 863-7780 [email protected] UTILITIES Pipelines, Energy Utilities & IPPs Sam Kanes, CA, CFA.................................. (416) 863-7798 [email protected] Alternative & Renewable Energy Ben Isaacson, CFA...................................... (416) 945-5310 [email protected] ECONOMICS Warren Jestin .............................................. (416) 866-6136 Aron Gampel ............................................... (416) 866-6259 Mary Webb .................................................. (416) 866-4202 Derek Holt.................................................... (416) 863-7707 PORTFOLIO ADVISORY GROUP (SCOTIAMCLEOD) Managing Director: Stewart Hunt ................................................ (416) 863-2855 Trading Elliott Fishman ............................................. (416) 863-7860 Angelo Rizzo ............................................... (416) 863-7521 Dave Stephens ............................................ (416) 862-3115 Portfolio Manager: Stephen Uzielli............................................. (416) 863-7939 Equity Advisory Paul Danesi ................................................. (416) 863-7735 Gareth Watson, CFA ................................... (416) 863-7604 Katie Tabesh, CA ........................................ (416) 945-5332 Institutional Equity Sales & Trading Toronto ........................................................ (416) 863-2885 1-888-251-4484 Montreal....................................................... (514) 287-4513 Vancouver ................................................... (604) 661-7411 1-888-926-2288 New York ................................................ (212) 225-6605/04 1-800-262-4060 Boston ........................................................ (617) 330-1477 London, U.K. .................................... 011-44-207-826-5919

Equity research reports published by Scotia Capital are available electronically via: Bloomberg, Thomson Financial/First Call - Research Direct,Reuters, Capital IQ, and FactSet. Institutional clients with questions regarding distribution of equity research should contact us at 1-800-208-7666.
This report has been prepared by SCOTIA CAPITAL INC. (SCI), a subsidiary of the Bank of Nova Scotia. Opinions, estimates and projections contained herein are our own as of the date hereof and are subject to change without notice. The information and opinions contained herein have been compiled or arrived at from sources believed reliable but no representation or warranty, express or implied, is made as to their accuracy or completeness. Neither SCI nor its affiliates accepts any liability whatsoever for any loss arising from any use of this report or its contents. This report isnot, and is not to be construed as, an offer to sell or solicitation of an offer to buy any securities and/or commodity futures contracts. The securities mentioned in this report may not be suitable for all investors nor eligible for sale in some jurisdictions. This research and all the information, opinions, and conclusions contained in it are protected by copyright. This report may not be reproduced in whole or in part, or referred to inany manner whatsoever, nor may the information, opinions, and conclusions contained in it be referred to without the prior express consent of SCI. SCI is authorized and regulated by The Financial Services Authority. U.S. Residents: Scotia Capital (USA) Inc., a wholly owned subsidiary of SCI, accepts responsibility for the contents herein, subject to the terms and limitations set out above. Any U.S. person wishing further information or toeffect transactions in any security discussed herein should contact Scotia Capital (USA) Inc. at 212-225-6500.
TM Trademark of The Bank of Nova Scotia. The Scotia Capital trademark represents the corporate and investment banking businesses of The Bank ofNova Scotia, Scotiabank Europe plc, Scotia Capital Inc. and Scotia Capital (USA) Inc. - all members of the Scotiabank Group and authorized users ofthe mark. Scotia Capital Inc. is a member of CIPF.
Products. Industry Knowledge. Relationships.
www.scotiacapital.com
TM
Alternatives_Cover_2008:Layout 1 8/22/2008 11:13 AM Page 2