alternative bacteria source identification using colilert®/quanti-tray 2000 test ... 17 final...
TRANSCRIPT

Alternative Bacteria Source Identification using Colilert®/Quanti-Tray 2000 Test Method in
Irrigated Agricultural Watersheds
by
Gregory Bohn
Washington State Department of Ecology
Water Quality Program
Olympia, Washington 98504-7710
and
Elaine Brouillard
Roza-Sunnyside Board of Joint Control
Sunnyside, WA 98944
July 8, 2011

2 of 52
This report is the final requirement of Contract C0900151 between the Washington Department of Ecology and the Roza-Sunnyside Board of Joint Control
in compliance with the Environmental Protection Agency demonstration project: EPA-R10-08-OWW-WU.
Any use of product or firm names in this publication is for descriptive purposes only
and does not imply endorsement by the author or the Department of Ecology.
If you need this publication in an alternate format, call Carol Norsen at (360) 407-7486.
Persons with hearing loss can call 711 for Washington Relay Service.
Persons with a speech disability can call (877) 833-6341.

3 of 52
Table of Contents
Page
Abstract………………………………………………………………………………………....… 5
Background…………………………………………………………………………………..….... 6
General Description……………………………………………………………………..… 6
Land-uses………………………………………………………………………..….…….. 6
Bacterial Problem……………………………………………………………………….… 7
Project Components………………………………………………………………………………. 9
General Description…………………………………………………………………...….. 9
E. coli as a Surrogate for FC Indicator of Bacterial Pollution………………………….... 9
IDEXX Methodology……………………………………………………………………… 11
Objectives and Desired Outcomes…………………………………………….…..…..….. 11
Results of IDEXX Methodology Quality Assurance Testing…………………………….. 11
Results of Methodology Comparison Testing…………………………………………...... 13
Results of Sampling within the Lower Sub-basin JD 33.4……………………………….. 15
Conclusions…………………………………………………………………………………….….. 18
Project Goal #1……………………………………………………………………….……. 18
Project Goal #2……………………………………………………………………………. 18
Project Goal #3……………………………………………………………………………. 19
References…………………………………………………………………………………..……. 20
Appendix A: Colilert®/Quanti-Tray 2000 Accuracy Quality Assurance Tests.………….……. 23
Appendix B: Colilert®/Quanti-Tray 2000 Precision Quality Assurance Tests…..……….……. 24
Appendix C: Comparison Data of IDEXX vs MF Methodologies for E. coli.………………... 25
Appendix D: Comparison Data of IDEXX Methodology for E. coli vs MF Methodology
for FC….................................................................................................................. 26
Appendix E: Comparison Data of MF Methodology for E. coli vs MF methodology for FC…. 27
Appendix F: E. coli Sampling Data throughout the Lower Sub-basin JD 33.4……………...…. 28
Appendix G: Quality Assurance Project Plan………………………………………………..…. 32
Appendix H: Average Time Difference between IDEXX and MF Methodologies…………..…. 52

4 of 52
Tables and Figures
Table 1 Irrigation Season Geomean FC Bacteria Densities in SCW Sub-basins,
1999-2005……………………………………………….………….…………..... 8
Table 2 Non-irrigation Season Geomean FC Bacteria Densities in SCW
Sub-basins, 1999-2005……………………………………………………………. 8
Table 3 E. coli Geometric Mean and 90% Values at Lower Sub-basin JD 33.4
Sampling Sites…………...……………………………………………………..... 16
Table 4 E. coli Geometric Mean and 90% Values within the Different Drainages
in the Lower Sub-basin JD 33.4………………………………………………..... 17
Figure 1 Sub-basins within the Sulphur Creek Wasteway Watershed………………..…... 7
Figure 2 Sampling Sites within the Lower Sub-basin JD 33.4………….………………… 10
Figure 3 Log10 IDEXX E. coli Densities vs. Log10 MF E. coli Densities……………….… 13
Figure 4 Log10 IDEXX E. coli Densities vs. Log10 MF Fecal Coliform Densities………… 14
Figure 5 Log10 MF E. coli Densities vs. Log10 MF Fecal Coliform Densities…………..… 15

5 of 52
Abstract
The Washington State Department of Ecology (Ecology) received grant funds for Innovative
TMDL Development Projects from the United States Environmental Protection Agency (EPA),
Region 10. This demonstration project is one of several Ecology projects that received such
funding. The goals of this project were: (1) to allow extensive monitoring of bacterial pollution
throughout a large agricultural watershed by a staff-limited and space-limited local agency; (2) to
determine if the use of E. coli monitoring can be an acceptable surrogate for FC bacteria in
watersheds; and (3) to accelerate the development of required bacterial TMDLs and, thereby,
accelerate the improvement of an agricultural watershed’s water quality.
The Sulphur Creek Wasteway (SCW) watershed is located in south-central Washington State and
is divided into seven sub-basins based on its various tributaries (Figure 1). The Roza-Sunnyside
Board of Joint Control (RSBOJC) has conducted extensive FC bacteria monitoring throughout
all of the sub-basins of the SCW. All but one of the sub-basins had significantly greater FC
bacteria densities during the irrigation season “critical condition”, which suggests a
predominance of “diffuse non-point sources” of bacteria. The lower sub-basin JD 33.4,
however, showed year-round high bacteria densities, which suggests that the predominant
bacteria sources are “discrete point sources”.
Several water samples needed to be analyzed throughout the lower sub-basin JD 33.4 in order to
locate more precisely the suspected point sources of bacteria. However, the RSBOJC, like many
rural agencies, has limited laboratory staff and floor-space. This demonstration project
specifically utilized alternative technologies, Colilert®/Quanti-Tray 2000 (IDEXX
methodology), for the analysis of E. coli as a substitute for the more labor-intensive membrane
filtration (MF) analysis for FC bacteria. The EPA officially approved the Colilert® method for
testing ambient waters on July 21, 2003.
The alternative technologies allowed the RSBOJC’s 2-person laboratory to analyze 200+
additional water samples, without the need to increase laboratory staff or floor-space. This
demonstration project successfully determined that the greatest sources of FC pollution in the
lower sub-basin JD 33.4 are due to discrete point sources, as was hypothesized. The additional
samples helped identify and locate previously unknown inputs of sanitary sewage within the
boundaries of the city of Sunnyside and which were quickly repaired.
It is the authors’ opinion that the three goals of this demonstration project were successfully
achieved.

6 of 52
Background
General Description
The Sulphur Creek Wasteway (SCW) watershed is located in Yakima County within the State of
Washington (State), approximately 35 miles southeast of the city of Yakima and 45 miles
northwest of the Tri-Cities area (Richland/Kennewick/Pasco). The SCW is situated within
Water Resource Inventory Area (WRIA) 37 with its center-point at Latitude: 46.27861 and
Longitude: -120.00056. The watershed contains the majority of the city of Sunnyside and a vast
amount of surrounding irrigated agricultural lands, which includes 40 concentrated animal
feeding operations (CAFOs).
The 96,000-acre (150 square miles) watershed lies in the Yakima River valley and is bounded by
the Horse Heaven Hills anticline to the south and the Rattlesnake Hills anticline to the north.
The soil is deep, well-drained, fertile silt loam (Zuroske, 2004). The natural vegetation of the
SCW watershed is categorized as shrub-steppe, consisting of various sagebrushes and
bunchgrasses. However, when the land is cleared and irrigation water is applied, an unlimited
variety of crops can be grown in the SCW watershed.
The climate of the area is generally characterized as mild and dry. Summer air temperatures
range from 85 to over 100 degrees Fahrenheit. Winters are generally cool with air temperatures
often falling below freezing from November through January, sometimes reaching 20 degrees
below zero Fahrenheit. Annual snowfall is light and averages 10 to 15 inches. The SCW
watershed receives 6 to 8 inches of annual precipitation, with the principle growing season (June,
July and August) receiving less than one inch of measurable precipitation. The general weather
conditions throughout the project reflected the typical year-round conditions of the area.
The SCW is a man-made drainage canal (7.5 miles in length) that ultimately collects all of the
irrigation return flows, municipal stormwater, and some State-permitted municipal and industrial
discharges that occur within the watershed. It was constructed in 1908-1910 and serves as the
Sunnyside Division’s principal man-made drainage canal. The drainage canal system is owned
by the United States Bureau of Reclamation and is part of that agency’s Yakima Project.
Land-uses
In addition to approximately 1,500 acres of irrigated agricultural lands, the lower sub-basin JD
33.4 includes: seven CAFOs, urban residential and industrial sections, “hobby farms” and
several rural residences. The drainage from the sub-basin is a complex combination of runoff
from irrigated agriculture and rural properties, stormwater flows from the central business
district of the city of Sunnyside, effluent discharges from the city’s wastewater treatment facility
(Publicly-owned Treatment Works; AKA: POTW), and discharges from the Port of Sunnyside
industrial property.

7 of 52
Bacterial Problem
Analysis of water quality data from 1968 through 1985 by the United States Geological Survey
(USGS) found that the SCW watershed fecal coliform (FC) bacteria densities were “among the
largest observed throughout the Yakima River Basin” (Embry, 1992). Morace et al. (1999)
determined that agricultural practices caused increased fecal-indicator bacteria in streams that
receive irrigation return flows throughout the lower Yakima River basin. Fuhrer et al. (2004)
suggested that the excessive FC bacteria densities in the SCW were related to the watershed’s
high density of livestock. The Washington State Department of Ecology (Ecology) water quality
monitoring near the mouth of the SCW found FC geometric means of 1,237 cfu/100mL and
1,437 cfu/100mL during 1993 and 1994, respectively. The SCW has historically exceeded the
State’s FC surface water quality dual criterion of 200/400 cfu/100mL (geometric mean/90%
value) for that specific waterway. All of the other waterways in the watershed are required to
comply with the State’s FC surface water quality dual criteria of 100/200 cfu/100mL
Figure 1 shows the seven sub-basins composing the SCW watershed.
Figure 1. Sub-basins within the Sulphur Creek Wasteway Watershed

8 of 52
Table 1 details the annual geometric mean FC bacteria densities found during the irrigation
season (April 1 – October 31) at each of the seven SCW sub-basins from 1999 through 2005.
Table 1. Irrigation Season Geometric Mean FC Bacteria
Densities in SCW Sub-basins, 1999-2005
Sub-basin # Lower
JD 33.4
Upper
JD 33.4
JD
43.9
JD
40.2
JD
35.4
JD
37.9
Mainstem
Year of Sampling SCW
1999 3,726 1,092 1,130 1,436 508 359 800
2000 815 715 801 1,181 251 353 457
2001 507 344 610 860 134 221 361
2002 1,540 No Data 301 580 172 196 410
2003 775 243 301 592 160 249 285
2004 1,003 319 451 633 250 136 364
2005 1,327 309 333 791 218 299 369
Table 2 details the annual geometric mean FC bacteria densities found during the non-irrigation
season (November 1 – March 31) at each of the seven SCW sub-basins from 1999 through 2005.
Table 2. Non-irrigation Season Geometric Mean FC Bacteria
Densities in SCW Sub-basins, 1999-2005
Sub-basin # Lower
JD 33.4
Upper
JD 33.4
JD
43.9
JD
40.2
JD
35.4
JD
37.9
Mainstem
Year of Sampling SCW
1999 833 370 314 272 200 120 278
2000 1,937 251 164 129 100 72 383
2001 3,047 340 256 193 135 43 333
2002 1,117 No Data 209 268 520 247 355
2003 1,169 61 186 121 62 28 329
2004 1,350 112 135 190 433 83 283
2005 3,600 70 170 140 136 62 632
During both the irrigation and non-irrigation seasons, the greatest FC densities in the SCW
watershed occurred within the lower sub-basin JD 33.4. Coincidentally, it is the smallest of the
seven sub-basins and includes the largest percentage of municipal/urban areas. All of the other
SCW sub-basins have significantly lower FC pollution during the agricultural non-irrigation
season. In fact, those sub-basins’ non-irrigation FC densities averaged only 59% of their
respective irrigation season densities. Whereas, the non-irrigation season bacteria densities in
the lower sub-basin JD 33.4 averaged 213% of its irrigation season densities. The latter increase
in bacteria densities is in part a consequence of less dilution due to a 28.2% reduction in that sub-
basin’s flows during the non-irrigation season.
Ecology hypothesized that the year-round occurrence of high FC bacteria densities indicates that
the predominant sources of bacterial pollution in the lower sub-basin JD 33.4 are probably
“discrete point sources” rather than “diffuse non-point sources”. For purposes of this
demonstration project, the terms “point source” and “non-point source” have no relationship to
any State or federal permit system or requirement. They only refer to whether any specific
discharge is physically “discrete” (i.e. a pipe) or “diffuse” (i.e. agricultural return flow).

9 of 52
Project Components
General Description
Ecology received grant funds (EPA-R10-08-OWW-WU) for Innovative TMDL Development
Projects from the United States Environmental Protection Agency (EPA), Region 10. Ecology
subsequently contracted with the Roza-Sunnyside Board of Joint Control (RSBOJC) to conduct a
demonstration project (Contract #C0900151) with the following goals: (1) to allow extensive
monitoring of bacterial pollution throughout a large agricultural watershed by a staff-limited and
space-limited local agency; (2) to determine if the use of E. coli monitoring can be an acceptable
surrogate for FC bacteria in watersheds; and (3) to accelerate the development of required
bacterial TMDLs and, thereby, accelerate the improvement of an agricultural watershed’s water.
This demonstration project required the collection of a minimum of eight water samples at each
of twenty-five different sampling sites (total of 200 samples), all of which are located throughout
the lower sub-basin JD 33.4 (Figure 2). Thirty of those samples were required to be either split
in the field or in the laboratory for quality assurance (QA) purposes. Additional samples were
also analyzed using membrane filtration for FC bacteria and for E. coli, for method comparison.
Under normal workload conditions, the RSBOJC’s small water quality laboratory would not be
able to collect and analyze all of the additional samples required by this demonstration project if
its present membrane filtration (MF) methodology were to be utilized. This demonstration
project was proposed specifically to utilize a more rapid alternative bacteria analysis
methodology that has already been approved by the EPA. The alternative methodology is a
combination of the Colilert® and Quanti-Tray 20001 technologies, which will be herein referred
to as the IDEXX methodology.
E. coli as a Surrogate for FC Indicator of Bacterial Pollution
The use of E. coli as a surrogate for FC bacteria is logical as the prior species typically composes
95-98% of the latter bacterial group in freshwater samples collected throughout the State (Hicks,
2002). The RSBOJC specifically analyzed water samples collected throughout the SCW (2002-
2006) for both E. coli and FC bacteria densities using MF methodologies. Analysis of that data
(n = 285) indicated a geometric mean E. coli/FC ratio of 1.18. A ratio of 1.00 would indicate
equivalent densities.
In addition, several researchers have previously determined that the IDEXX methodology
produces statistically equivalent results to those obtained by the MF methodology (Lewis and
Mak, 1989; Olson et al., 1991; Clark, 1991; Eckner, 1998; Chao et al., 2004, Buckalew, 2005).
The use of the IDEXX methodology was suggested as a better choice for smaller water quality
laboratories than the typical MF methodology, since it requires substantially less “hands-on”
time to run. The ability to conduct a greater number of analyses would hypothetically accelerate
the development of required bacterial TMDLs and, thereby, accelerate the improvement of an
agricultural watershed’s water quality.
1 Colilert® and Quanti-Tray 2000
are registered trademarks of the IDEXX Laboratories, Westbrook, Maine.

10 of 52
Figure 2. Sampling Sites within the Lower Sub-basin JD 33.4
/
Oleys Lake
Sulphur Creek Wasteway
0 0.75 1.50.375 Miles
Sampling Sites within Lower Sub-basin JD 33.4
#14
#12
#19
#20
#25
#18
#24
JD 33.4
JD 33.4
#23#17
#22
#21
#16
#15
#1
#3
#4
#5
#7#6
#8
#13
#2
#9
#11#10
I-82
SR 241
City of Sunnyside

11 of 52
IDEXX Methodology
The IDEXX methodology is used for the detection, confirmation and enumeration of E. coli in
surface waters within 28 hours. It is based on IDEXX’s patented Defined Substrate
Technology (DST ). When E. coli metabolize the nutrient indicator (MUG) by the enzyme ß-
D-glucuronidase, a fluorescent compound (MUF) is released. EPA officially approved2 the
Colilert® technology for testing ambient waters, which is the same as enzyme substrate test as
SM 9223B.
100 milliliters of each water sample is added to a pre-sterilized vial. Each vial then receives the
contents of one Colilert®-MUG substrate packet. The vial is quickly resealed, shaken until
contents are dissolved and then poured into a Quanti-Tray 2000 enumeration tray. The Quanti-
Tray is then sealed and placed into an incubator at 35°C for 24 hours. An ultraviolet light is used
to make the actual counts of the fluorescent yellow E. coli colonies. Each Quanti-Tray contains
97 wells of two different sizes to achieve bacterial counts of 1 to 2,419 MPN/100mL, with a 95%
confidence limit.
Objectives and Desired Outcomes
This demonstration project’s goals are:
To allow extensive monitoring of bacterial pollution throughout a large agricultural
watershed by a staff-limited and space-limited local agency;
To determine if the use of E. coli monitoring can be an acceptable surrogate for FC
bacteria; and
To accelerate the development of required bacteria TMDLs and, thereby, accelerate the
improvement of an agricultural watershed’s water quality.
This demonstration project’s anticipated outputs are:
An extensive set of E. coli monitoring data which will allow Ecology to locate suspected
point sources of bacteria pollution within the lower sub-basin JD 33.4;
A final project report that will be disseminated to Ecology and the various conservation
districts throughout the State and that will also be posted on the RSBOJC internet website
for educational purposes; and
Obtaining State-accreditation for the IDEXX methodology at the RSBOJC laboratory.
Results of IDEXX Methodology Quality Assurance Testing
Sampling, laboratory analysis, and data evaluation steps have several sources of error that should
be addressed by data quality objectives. The primary determinants for data QA for this
demonstration project are accuracy and precision. QA testing was only conducted on the
IDEXX methodology as the RSBOJC laboratory already performs QA for its MF methodologies
for both E. coli and FC bacteria in order to maintain State accreditation.
2 Published in Federal Register dated July 21, 2003.

12 of 52
Accuracy:
Accuracy measures how close laboratory results are to a true or expected value. It is usually
measured by analyzing a sample “spiked” with a known concentration, or by measuring directly
a known amount if “spikes” are not applicable. The accuracy of bacteria samples are normally
handled differently from chemical pollution as a bacterial “spike” is not typically available.
Thus, the MQO established in this project’s QAPP was stated as “<25% Relative Percent
Difference (RPD)”.
It was not known until after the project had started that bacterial “spikes” were indeed available.
MicroBiologics® Epower
pellets (Lot # 483711) were utilized as a known amount (7,800
cfu/100mL) of E. coli bacteria. The pellets are lyophilized, quantitative microorganism
preparations used in industrial laboratories for QA purposes. One pellet was dissolved in 100mL
of a 7.2 buffer solution (according to manufacturer’s instructions) and then split into 10 replicate
samples.
Due to the inherent variability of bacteria measurements, Ecology later suggested that “25% to
175% Recovery” would be the more appropriate MQO. % Recovery = ((Xs – Xo)/Xo) x 100%,
where: Xs = spike sample result, and Xo = original sample amount. The calculated %
Recoveries ranged from 118% to 181.2% (Appendix A). The average % Recovery was 143.6%.
Another accuracy test was also performed using Environmental Resource Associates (ERA) WP
WasteWatRTM
Coliform MicrobETM
product which similarly contains lyophilized E. coli
bacteria. The IDEXX methodology using the “spike” of 859 MPN/100mL recovered 866.4
MPN/100mL which was within the manufacturer’s acceptable limits of recovery (393 – 1,880
MPN/100mL). The % Recovery using this product was 100.9%.
The difference in % Recoveries between the two commercial products may have to do with the
amount of E. coli contained within the products. The latter product which contains significantly
less bacteria gave the best recovery. This may indicate that the IDEXX methodology is more
precise for lower concentrations (<5,000 cfu/100mL) of E. coli.
Precision:
Precision, expressed as RPD and obtained from analysis of field sample splits, is a measure of
the reproducibility of a result while subject to random error. Random error may occur during
sample handling, preservation, storage, and analysis stages. Precision was estimated by the RPD
of the actual data obtained from analysis of the field-split samples (Appendix B). RPD = ((S –
D)/((S+D)/2)) x 100%, where: S = analytical result of sample of origin, and D = analytical result
of the duplicate sample.
The original precision RPD was listed in the QAPP as “<25% RPD of log-normalized data”.
However, subsequent revision by Ecology’s Environmental Assessment Program (EAP)
indicated that “<40% RPD of actual data” would be more appropriate. The calculated RPDs of
twenty paired field-split analyses ranged from 0.0% to 51.7% (Appendix B). The average RPD
was 17.7%.

13 of 52
Results of Methodology Comparison Testing
E. coli densities using both the IDEXX and MF (m-ColiBlue24®) methodologies:
This demonstration project analyzed 21 split samples for a comparison between the IDEXX
(Colilert®/Quanti-Tray 2000) and MF (m-ColiBlue24®)3 methodologies. A simple regression
analysis of the log-normalized data from both methodologies is presented in Figure 3.
3 m-ColiBlue24® is a registered trademark of the Hach Company, Loveland, Colorado.
The resultant Pearson correlation coefficient (R) of 0.957 (p < 0.0000) indicates a very strong
significant correlation between the two methodologies. The IDEXX methodology data is
expressed in MPN; while the MF methodology data is expressed in cfu/100mL. The formula for
the regression line is: Log10 IDEXX E. coli = 0.215683 + 1.03*Log10 MF E. coli.
Figure 3. Log10 IDEXX E. coli Densities vs. Log10 MF E. coli Densities
The E. coli densities obtained from the IDEXX methodology were generally greater than the
densities obtained from the MF (m-ColiBlue24® media) methodology. The geometric mean %
Error between the actual bacteria density data of the two methodologies was 41.4%. This should
be interpreted as the IDEXX methodology enumerating significantly greater E. coli densities
than the MF (m-ColiBlue24® media) methodology.

14 of 52
E. coli densities using the IDEXX methodology vs FC densities using the MF (m-FC media
with rosolic acid) methodology:
This demonstration project analyzed 21 split samples for a comparison between E. coli densities
obtained from the IDEXX methodology and FC bacteria densities obtained from the MF
methodology using m-FC media (with rosolic acid). A simple regression analysis of the log-
normalized data is presented in Figure 4, below. The resultant Pearson correlation coefficient of
0.984 (p < 0.0000) indicates a very strong significant correlation between the two methodologies.
The IDEXX methodology data is expressed MPN; while the MF methodology data is expressed
in cfu/100mL. The formula for the regression line is: Log10 IDEXX E. coli = 0.0552704 +
1.19857*(Log10 MF fecal coliform).
Figure 4. Log10 IDEXX E. coli Densities vs. Log10 MF Fecal Coliform Densities
The E. coli densities obtained from the IDEXX methodology were consistently greater than the FC
densities obtained from the MF (m-FC media with rosolic acid) methodology. The geometric
mean % Error between the actual density data of the two methodologies was 206.0%. This should
be interpreted as the IDEXX methodology enumerating significantly greater E. coli densities than
the fecal coliform bacteria densities enumerated by the MF (m-FC media with rosolic acid)
methodology.
E. coli densities using the MF (m-ColiBlue24®) methodology vs FC densities using the
MF (m-FC media with rosolic acid) methodology:
This demonstration project analyzed 19 split samples for a comparison between E. coli densities
obtained from the MF (m-ColiBlue24® media) methodology and FC bacteria densities obtained
from the MF (m-FC media with rosolic acid) methodology. A simple regression analysis of the
log-normalized data is presented in Figure 5, below. The resultant Pearson correlation coefficient

15 of 52
of 0.963 (p < 0.0000) indicates a very strong significant correlation between the two
methodologies. Both methodologies are expressed in cfu/100mL. The formula for the regression
line is: Log10 MF m-ColiBlue24® E. coli = -0.00580088 + 1.13157*(Log10 MF fecal coliform).
The E. coli densities obtained from the MF (m-ColiBlue24® media) methodology were
generally greater than the FC densities obtained from the MF (m-FC media with rosolic acid)
methodology. The geometric mean % Error between the actual density data of the two
methodologies was 43.3%. This should be interpreted as the MF (m-ColiBlue24® media)
methodology enumerating significantly greater E. coli densities than the fecal coliform densities
enumerated by the MF (m-FC media with rosolic acid) methodology.
Figure 5. Log10 MF E. coli Densities vs. Log10 MF Fecal Coliform Densities
Results of Sampling within the Lower Sub-basin JD 33.4
The RSBOJC performed sampling from January 2009 through February 2010 and consisted of a
minimum of eight samples per sampling site. Of a total of 25 sites, 23 sampling sites were
located within the lower sub-basin JD 33.4. The samples were then analyzed for E. coli by the
IDEXX methodology in conformance with this demonstration project’s QAPP. The raw data is
presented in Appendix F.
Table 3, below, presents the geometric mean (geomean) and 90% value E. coli densities at each
sampling site, as well as their pollution rankings and locations. A least mean square statistical
analysis determined that sites 1, 6 and 7 had the lowest bacteria densities. Site 10 had the
greatest bacteria densities. The second greatest and statistically equivalent bacteria densities
were collected from sites 11, 14, 15, 16, 17, 18 and 19. The second lowest and statistically
equivalent bacteria densities were collected from sites 21, 22, 23, 24 and 25.

16 of 52
The 90% value E. coli densities were calculated in specific compliance with second part of the
dual criterion for fecal coliform bacteria established in the State of Washington Surface Water
Quality Standards (Chapter 173-201A WAC). That part is written as “with not more than 10
percent of all samples obtained for calculating the geometric mean value exceeding 200
colonies/100 mL.” The statistical “90th
percentile” does not comply with the above wording. A
90% value density is, therefore, defined as: (1) the largest value in a dataset of less than 20
values; (2) the second largest value in a dataset of 20-29 values; (3) the third largest value in a
dataset of 30-39 values; etc.
The lower sub-basin JD 33.4 contains eight smaller drainage basins, most of which were
represented by multiple sampling sites. Table 4, below, presents the geometric mean and 90%
value E. coli densities, as well as their pollution rankings and drainage descriptions.
Table 3. E. coli Geomean and 90% Values at Lower Sub-basin JD 33.4 Sampling Sites
Sampling
Site N
Geomean
(MPN)
90%
Value
(MPN)
E. coli
Pollution
Ranking4
Location
1 8 3.4 1,413.6 11 1410 Rouse Rd.
2 8 303.3 3,255.0 7 Rouse Rd. across from Star Trailer Court #30
3 8 511.0 9,208.0 6 North Ave. & Rouse Rd., eastern-most manhole
4 8 1,318.2 6,131.0 5 Yakima Valley Highway & 9th St. (Carwash)
5 8 1,440.4 4,225.0 4 Nobel's parking lot, YVH between S. 6th St. & S. 9th St.
6 8 1.2 3.1 11 Warehouse Ave. between 6th St. & 7th St.; undeveloped
7 8 20.7 1,986.3 11 E. Blaine Ave. near alley
8 8 1,817.0 19,683.0 3 DR 3 past Edison in the alley by railroad
9 8 2,029.4 24,196.0 3 Decature & S. 9th St.
10 8 13,386.3 241,960.0 1 Decature Ave. between S. 9th St. & S. 8th St.
11 9 5,060.0 241,960.0 2 Decature Ave. between S. 8th St. & S. 7th St.
12 8 292.6 1,986.3 7 RSBOJC Site 25.15 at S. 1st St. & Zillah Ave.
13 8 264.1 2,419.6 7 E. Edison Ave. backyard (at Zillah Ave/Flower St)
14 8 6,747.7 19,863.0 2 Lincoln Ave. & S. 4th St.
15 8 5,945.6 12,997.0 2 JD 33.4 near Otis upstream of POTW discharge
16 8 5,840.5 9,804.0 2 JD 33.4 at S. 1st St. between S. Hill Rd. and E. Parkland
17 8 5,541.0 17,329.0 2 Midvale near Alexander Blvd.
18 8 2,982.9 9,208.0 2 Midvale near old rendering plant
19 8 3,663.5 19,863.0 2 RSBOJC Site 25.10 at Duffy Road
20 8 236.1 2,419.6 8 SCW at Duffy Rd.
21 9 113.7 2,613.0 9 South Hill Rd., Yakima Chief plant, in field by fence
22 8 94.0 866.4 9 South of I-82 in pasture with longhorn cattle
23 8 96.7 613.1 9 Emerald Rd. & Wells Rd.
24 8 172.6 2,419.6 9 DR 3 at Midvale, across from last hexed manhole
25 8 39.2 435.2 10 DR 3 at Port of Sunnyside lagoon

17 of 52
Table 4. E. coli Geomean and 90% Values at Lower Sub-basin JD 33.4 Drainages
Drainage N Sampling Sites Drainage
Description
Geomeean
Mean
90%
Value
E. coli
Pollution
Ranking4
1 64 1, 2, 3, 4, 5, 6, 7, 8 DR 3 - North 120.2 4,225.0 2
2 25 9, 10, 11 DR 3 – Decature 5,156.8 241,960.0 1
3 33 21, 22, 23, 24 DR 3 - West 115.5 2,419.6 2
4 8 25 DR 3 - East 39.2 435.2 2
5 8 12 JD 33.4 - West 292.6 1,986.3 2
6 32 13, 14, 15, 16 JD 33.4 - Middle 2,804.8 11,119.0 1
7 27 17, 18 19 JD 33.4 - South 3,926.8 17,329.0 1
8 8 20 SCW 236.1 2,419.6 2
4 The pollution rankings are listed in numerical order, with the sites of greatest pollution being represented by the
value 1. All sampling sites (Table 3) and drainages (Table 4) having the same numerical ranking are statistically
equivalent by the “least mean squares” analysis.
A “least mean square” statistical analysis determined that least bacterial densities were found in
drainage basin #1 (DR 3 – Upstream), which represents the uppermost areas of the lower Sub-
basin JD 33.4, and in drainage basin #5 (DR 3 – East), which represents the eastern-most portion
of the sub-basin. Drainage basins #2 (DR 3 – North) and #4 (DR 3 – West) all contained
significantly greater bacterial densities, which would be expected as those areas each represent a
significant increase in urban and agricultural activities, respectively.
Of special interest to this project is drainage basin #3 (DR 3 – Decature), since it the first
drainage basin when moving downstream through the sub-basin that contains excessive bacterial
densities. This drainage basin contains a large portion of downtown city of Sunnyside
(Sunnyside) and contained the greatest geometric mean E. coli density. City of Sunnyside
management was alerted by the RSBOJC to the results of bacterial sampling and the
municipality subsequently repaired several sanitary sewage leaks along Decature Ave., which
discharged directly into the stormwater sewer system. Such leaks were indeed found to be
“discrete point sources” of high-strength bacterial discharges. Sunnyside management should
consider an ongoing investigation of its sanitary sewer system for leaks and possible illicit
connections.
The remaining areas of excessive E. coli bacterial densities (#6, #7 and #8) represent the
drainage basins “JD 33.4 – Middle”, “JD 33.4 – South” and “JD 33.4 – Downstream”,
respectively. The excessive bacterial densities in these last three drainage basins are suspected
of primarily due to the result of carry-over from the upstream drainage. Once the city of
Sunnyside has completed its leak/illicit connection survey of the municipal sewer system, then
the excessive bacterial densities in these later drainage basins are expected to decrease
substantially.

18 of 52
Conclusions
Project Goal #1:
The goal of “allowing extensive monitoring of bacterial pollution throughout a large agricultural
watershed by a staff-limited and space-limited local agency” was successfully accomplished.
During this demonstration project, the 2-person RSBOJC laboratory completed analysis of 220
additional samples with minimal impacts on their normal work load or work schedule. The total
“hands-on” time required per sample was determined to be 15 minutes with the IDEXX
methodology, as compared to 42 minutes with the MF methodologies (Appendix H). Although
such per-sample times are greater than previously cited in the scientific literature, they are
considered to be more exact as they include all “hands-on” procedures from set-up through
clean-up. During this demonstration project, the use of the IDEXX methodology saved 27
minutes of “hands-on” time per sample, or approximately a total of 100 work hours.
Other scientific investigators have found the IDEXX methodology to be similarly rapid.
Buckalew et al. (2006) stated that: “Colilert DST presents a laboratory protocol that is simpler to
manage, quicker to process, and easier to quantify results than MF. These factors, plus the
enhanced precision and versatility of Colilert DST over the span of this three-year study attests
to its suitability for testing ambient surface waters.” Yakub et al. (2002) stated that: “…for the
most part, the DSM techniques provided a faster and less expensive alternative to traditional
methods of bacterial enumeration.” Finally, Macy et al. (2005) stated that: “Colilert is simpler
to use, allows greater throughput, and requires less time to standardize than standard methods.”
Project Goal #2:
The goal of “determining if the use of E. coli monitoring can be an acceptable surrogate for FC
bacteria in watersheds” was successfully accomplished. Various researchers determined that the
enumeration of E. coli by the IDEXX methodology is very strongly correlated to enumeration by
the MF methodology for E. coli. Chang et al. (1989), Shadix and Rice (1991), Fricker et al.
(1997), Ekner (1998), Hanko (2000), Jackson et al. (2002), Hargett and Goyn (2004), Hamilton
et al. (2005), Dinkins (2006), Hörman and Häninnen (2006), Pitkänen et al. (2007), and Al-Turki
and El-Ziney (2009) all discussed similar findings concerning Colilert®’s enumeration
capability.
It should be noted that most of the above researchers also concluded that enzyme-specific media
technologies (i.e. IDEXX) enumerated greater bacteria densities than MF technologies. In
particular, Lifshitz and Joshi (1997) determined a regression coefficient of 0.98 and an average
45% greater enumeration with IDEXX methodology than that found with the MF methodology.
The Ministry of the Environment, Canada (unpublished data) determined a regression coefficient
of 0.95 and an average 32% greater enumeration than the MF methodology. During this project,
the IDEXX methodology for E. coli produced a regression correlation of 0.984 and an average
41% greater enumeration than the MF (m-FC media with rosolic acid) methodology for fecal
coliform. In a similar side-by-side comparison, Kloot et al. (2006) also found an average of 41%
greater E.coli densities than fecal coliform densities.

19 of 52
Some researchers have suggested that the greater enumeration results obtained from the IDEXX
methodology may be the result of a greater-than-average false-positive rate. However, Eccles et
al. (2004) has determined a false-positive rate of only 1.59% and a false-negative rate of 3.81%
with the IDEXX methodology. Other researchers have determined similarly low rates and
hypothesized that the methodology actually is more “sensitive”. Bonadonna et al (2007) stated
that Colilert was a more appropriate procedure for the identification of E. coli than the traditional
MF methodologies (i.e. m-ColiBlue®), as more than 35% of the species are now known to be
lactose negative.
The increased “sensitivity” of the enzyme-based methodologies (i.e. IDEXX) is also suspected of
being indirectly due to the high number of false negatives associated with the MF
methodologies. Schauer et al. (2005) compared ten USEPA approved enzyme-based E. coli
analysis methodologies at the University of Wisconsin on spiked water samples. They
determined that the IDEXX methodology had a 0% failure rate to detect the presence or absence
of the bacteria; whereas, the MF (m-ColiBlue24® media) exhibited a 23% failure rate. Garcia-
Armisen et al. (2005) suggested that underestimation of fecal coliform in the MF methodology
may be due to a high proportion of injured and of viable but non-culturable (VBNC) bacterial
cells, which represent substantial false negatives (Wutor et al., 2007).
The concept of injured and VBNC bacteria cells not being enumerated by MF methodologies has
been discussed by researchers since the 1980’s. McFeters et al. (1982) concluded: “Most of the
media commonly used in water analysis recovered less than 30% of injured cells.” and that:
“Injury is an important factor in underestimating numbers of waterborne indicator bacteria which
may lead to inaccurate public health assessments.” Rompré at al. (2002) determined that it is not
possible to recover injured or VBNC bacteria colonies while using the standard agar media in
common use for MF methodologies.
From all of the above results and discussion, this demonstration project has determined that the
IDEXX methodology for E. coli analysis is an acceptable surrogate for analysis of FC bacteria
by the MF methodology. This determination is similar to that made by the Slovenia Equivalence
Verification Study of July 2007, which concluded that the IDEXX methodology is “…easier,
more sensitive and reliable, and quicker to use than the reference (MF) methodology” and that it
is “an acceptable and indeed more sensitive method for recovery of E. coli from water”.
Project Goal #3:
The goal of “accelerating the development of required bacterial TMDLs and, thereby, accelerate
the improvement of an agricultural watershed’s water quality” was successfully accomplished.
This demonstration project has shown that the IDEXX methodology successfully allowed a small
rural water quality laboratory to locate potential several “discrete point sources” of high-strength
bacterial pollution within a combined agricultural/urban sub-basin. The sampling located several
municipal sanitary sewer leaks discharging into JD 33.4, which were quickly repaired by the City
of Sunnyside. The repair of the sewer leaks most assuredly accelerated water quality
improvement in the SCW watershed. However, only future long-term effectiveness monitoring
in the SCW will be able to ultimately determine the actual degree of such improvement.

20 of 52
Referrences
Al-Turki, A. and M.G. El-Ziney. (2009) Evaluation of Commercial Colilert18-Quantitray® Method
by ISO Techniques for Enumeration and Quantification of Total Coliforms and Escherichia coli
in Drinking-water of Buraidah, Saudi Arabia. Journal of Applied Sciences. Volume 9, Number
18: 3357-3363.
Bonadonna, L., C. Cataldo and M. Semproni. (2007) Comparison of Methods and Confirmation
Tests for the Recovery Escherichia coli in Water. Desalination. Volume 213, 18-23.
Buckalew, D.W., L.J. Hartman, G.A. Grimsley, A.E. Martin, and K.M. Register. (2006) A Long-
term Study Comparing Membrane Filtration with Colilert® Defined Substrates in Detecting
Fecal Coliforms and Escherichia coli in Natural Waters. Journal of Environmental
Management. Volume 80, Number 3: 191-197.
Chang, G.W., Brill, J., Lum, R. (1989) Proportion of Beta-D-glucuronidase-negative Escherichia
coli in Human Fecal Samples. Applied and Environmental Microbiology. Volume 55, Number
1: 335–339.
Chao, Kuo-Kuang, Chen-Ching Chao, and Wei-Lang Chao. (2004) Evaluation of Colilert-18 for
Detection of Coliforms and Escherichia coli in Subtropical Freshwater. Applied and
Environmental Microbiology. Volume 70, Number 2: 1242-1244.\
Clark, D.L., B.B. Milner, M.H. Stewart, R.L. Wolfe, and B.H. Olson. (1991) Comparative Study of
Commercial 4-Methylumbrellifuyl-ß-D-Glucuronide Preparations with the Standard Methods
Membrane Filtration Fecal Coliform Test for the Detection of Escherichia coli in Water
Samples. Applied and Environmental Microbiology. Volume 57, Number 5: 1528-1534.
Dinkins, S.A. (2006) Comparing E. coli Results Analyzed by Colilert® and Membrane Filtration.
Ohio River Valley Water sanitation Commission. 2006 National monitoring Conference. May
7-11, 2006. Powerpoint presentation.
Eccles, J.P., R. Searle, D. Holt and P.J. Dennis. (2004) A Comparison of Methods used to
Enumerate Escherhia coli in Conventionally Treated Sewage Sludge. Journal of Applied
Microbiology. Volume 96: 375-383.
Eckner, K.F. (1998) Comparison of Membrane Filtration and Multiple-Tube Fermentation by the
Colilert and Enterolert Methods for Detection of Waterborne Coliform Bacteria, Escherichia
coli, and Enterococci Used in Drinking and Bathing Water Quality Monitoring in Southern
Sweden. Applied and Environmental Microbiology. Volume 64, Number 8: 3079-3083.
Fricker, E.J., K.S. Illingworth, and C.R. Fricker. (1997) Use of Two Formulations of Colilert and
QuantiTray™ for Assessment of the Bacteriological Quality of Water. Water Research. Volume
31, Number 10: 2495-2499.

21 of 52
Fuhrer, G.J., J.L. Morace, H.M. Johnson, J.F. Rinella, J.C. Ebbert, S.S. Embry, I.R. Waite, K.D.
Carpenter, D.R. Wise, and C.A. Hughes. (2004) Water Quality in the Yakima River Basin,
Washington, 1999-2000. United States Geological Survey. Circular 1237. 34 pp.
Garcia-Armisen, T., P. Lebaron and P. Servais. (2005) ß-D-glucuronidase Activity Assay to Assess
Viable Escherichia coli Abundance in Freshwaters. Letters in Applied Microbiology. Volume
40: 278-282.
Hamilton, W.P., M. Kim, and E.L. Thackston. (2005) Comparison of Commercially Available
Escherichia coli Enumeration Tests: Implications for Attaining Water Quality Standards. Water
Resources. Volume 39, Number 20: 4869-4878.
Hanko, E. (2000) Colilert: What’s All the Fuss About? Paper Presentation. 63rd Annual Water
Industry Engineers and Operators Conference. Brauer College. Warrnambool, Australia.
September 6-7, 2000. 5 pp.
Hargett, E. and L. Goyn. (2004) Modified mTEC Agar, Colilert®, and M-FC Agar – Field Trial
Comparison of Bacteria Enumeration methods in Surface Waters of Eastern Wyoming.
Wyoming Department of Environmental Quality, Water Quality Division. 12 pp.
Hicks, M. (2002) Setting Standards for the Bacteriological Quality of Washington’s Surface Water
– Draft Discussion Paper and Literature Summary. Washington State Department of Ecology.
Publication 00-10-072. Revised December 2002. 109 pp.
Hörman, A. and M.L. Hänninen. (2006) Evaluation of the Lactose Tergitol-7, m-Endo LES, Colilert
18, Readycult Coliforms 100, Water-Check-100, 3M Petrifilm EC and DryCult Coliform Test
Methods for Detection of Total Coliforms and Escherichia coli in Water Samples. Water
Research. Volume 40, Number 17: 3249-3256.
Jackson, S.A.F., I. Bailey, R. Britz, C. deWet, A. Fortune, A.J. Johnston-Robertson, K.M. Naidoo,
and A. Sundram. (2002) Report on the South African Colilert™ Ring Trial. Paper presented at
the Biennial Conference of the Water Institute of Southern Africa (WISA). May 19-23, 2002.
Durban, South Africa.
Kloot, R.W., B. Radakovich, X. Huang, and D.D. Brantley. (2006) A Comparison of Bacterial
Indicators and Methods in Rural Surface Waters. Environmental Monitoring Assessment.
Volume 121: 275 – 287.
Lewis, C.M. and J.L. Mak. (1989) Comparison of Membrane Filtration and Autoanalysis Colilert
Presence-Absence Techniques for Analysis of Total Coliforms and Escherichia coli in Drinking
Water Samples. Applied and Environmental Microbiology. Volume 55, Number 12: 3091-3094.
Lifshitz, R. and R. Joshi. (1998) Comparison of the Novel ColiPlate™ Kit and the Standard
Membrane Fiter Technique for Enumerating Total Coliforms and Escherichia coli Bacteria in
Water. Environmental Toxicology and Water Quality. Volume 13, Number 2: 157-164.

22 of 52
Macy, J.T., E.F. Dunne, Y.H. Angoran-Benie, Y. Kamelan-Tano, L. Kouadio, K.A. Djai, and S.P.
Luby. (2005) Comparison of Two Methods for Evaluating the Quality of Stored Drinking Water
in Abidjan, Côte d’Ivore, and Review of Other Comparisons in the Literature. Journal of Water
and Health. Volume 3, Number 3: 221 – 228.
McFeters, G.A., S.C. Cameron, M.W. LeChavallier. (1982) Influence of Diluents, Media, and
Membrane Filters on Detection of Injured Waterborne Coliform Bacteria. Applied and
Environmental Microbiology. Volume 43, Number 1: 97-103.
Morace, J., G.J. Fuhrer, J.F. Rinella, and S.W. McKenzie. (1999) Surface-Water-Quality
Assessment of the Yakima River Basin in Washington: Overview of Major Findings, 1987-91.
United States Geological Survey. Water-Resources Investigations Report 98-4113. 31 pp.
Pitkänen, T., P. Paakkari, I. Miettinen, H. Heinonen-Tanski, L. Paulin, and M.L. Hänninen. (2007)
Comparison of Media for Enumeration of Coliform Bacteria and Escherichia coli in Non-
disinfected Water. Journal of Microbiological Methods. Volume 68, Number 3: 522-529.
Olson, B.H., D.L. Clark, B.B. Miller, M. H. Stewart, and R.L. Wolfe. (1991) Total Coliform
Detection in Drinking Water: Comparison of Membrane Filtration with Colilert and Coliquik.
Applied and Environmental Microbiology. Volume 57, Number 5: 1535-1539.
Rompré, A., P. Servais, J. Baudart, M.R. de-Roubin and P. Laurent. (2002) Detection and
Enumeration of Coliforms in Drinking Water: Current Methods and Emerging Approaches.
Journal of Microbiological Methods. Volume 49, 31-54.
Schauer, J.J., J. Olstadt, J. Standridge, and S. Kluender. (2005) A Comparison of Ten USEPA-
Approved Enzyme-Based Total Coliform/E. coli Tests for Microbiological Groundwater
Monitoring and Laboratory Consultation. University of Wisconsin-Madison. State of
Wisconsin Contract. 16 pp.
Shadix, L.C., Rice, E.W. (1991) Evaluation of Beta-glucuronidase Assay for the Detection of
Escherichia coli from Environmental Waters. Canadian Journal of Microbiology. Volume 37,
Number 1: 908–911.
Wutor, V.C., C.A. Togo, J.L. Limson and B.I. Pletschke. (2007) A Novel Biosensor for the
Detection and Monitoring of ß-d-galactosidase of Faecal Origin in Water. Enzyme and
Microbial Technology. Volume 40, Number 6: 1512-1517.
Yakub, G.P., D.A. Castric, K.L. Stadterman-Knauer, M.J. Tobin, M. Blazina, T.N. Heineman, G.Y.
Yee, and L. Frazier. (2002) Evaluation of Colilert and Enterolert Defined Substrate
Methodology for Wastewater Applications. Water Environmental Research. Volume 74,
Number 2: 131-135.
Zuroske, M. (2004) Conservation Practices and Water Quality Trends in Sulphur Creek Wasteway
and Granger Drain Watersheds, 1997 to 2002. South Yakima Conservation District. December
2004. 50 pp.

23 of 52
APPENDIX A
Colilert®/Quanti-Tray 2000 Accuracy Quality Assurance Tests
MicroBiologics® Epower Microorganisms
E. coli known density: 7,800 cfu/pellet
Epower lot number: #483711
Epower expiration date: 2011-03
Date analysis was performed: 6/11/09
One pellet was dissolved in 100mL of pH 7.2 buffer solution and divided evenly among 10
sample replicates. Although the original Measurement Quality Objective (MQO) was listed in
this project’s QAPP as “<25% RPD”, Ecology revisited the issue and suggested using a more
appropriate MQO of 25% to 175% Recovery. The replicates were analyzed in the RSBOJC
water quality laboratory using the IDEXX methodology. Only one of the 10 samples exceeded
the revised % Recovery MQO indicated above.
Percent Recovery
Replicate #
Known
Density
(cfu/100mL)
Analysis
Result
(MPN)
%Recovery
1 7,800 12,997 166.6
2 7,800 14,136 181.2
3 7,800 9,208 118.0
4 7,800 10,462 134.1
5 7,800 11,199 143.6
6 7,800 10,462 134.1
7 7,800 9,804 125.7
8 7,800 10,462 134.1
9 7,800 11,199 143.6
10 7,800 12,033 154.8
Mean 143.6

24 of 52
APPENDIX B
Colilert®/Quanti-Tray 2000 Precision Quality Assurance Tests
Each sample was field-split and then analyzed in the RSBOJC water quality laboratory. The
replicates were analyzed using the IDEXX methodology. The Measurement Quality Objective
for precision was originally set in the QAPP as “<25% RPD of log-normalized data”, but was
subsequently re-established by Ecology’s EAP Program as “<40% RPD” based on the actual
data. Only two of the 20 samples exceeded the revised MQO for precision.
Relative Percent Difference on Actual Data
Sampling Site # Date of
Sample
Replicate A
Analysis
Result
(MPN)
Replicate B
Analysis
Result
(MPN)
RPD
12 2/10/2009 40.8 35.0 15.3
17 3/19/2009 17,329.0 15,531.0 10.9
20 3/23/2009 15.3 14.5 5.4
4 3/25/2009 1,267.0 1,119.0 12.4
22 4/16/2009 133.4 121.1 9.7
11 5/14/2009 2,755.0 1,789.0 42.5
9 6/1/2009 3,968.0 4,352.0 9.2
1 6/10/2009 4.1 4.1 0
18 6/29/2009 9,208.0 11,199.0 19.5
14 8/5/2009 6,876.0 5,172.0 28.3
19 9/29/2009 5,475.0 3,225.0 51.7
22 10/13/2009 112.6 137.4 19.8
13 11/2/2009 112.6 88.6 23.9
22 11/4/2009 69.5 69.1 0.6
23 11/4/2009 63.8 52.8 18.9
15 12/1/2009 7,701.0 7,701.0 0
12 12/9/2009 42.0 37.3 11.9
5 12/10/2009 1,533.1 1,119.9 31.1
24 12/16/2009 313.0 387.3 21.2
25 12/16/2009 5.1 4.1 21.7
Mean 17.7

25 of 52
APPENDIX C
Comparison of IDEXX and MF (ColiBlue24®) Methodologies for E. coli
The IDEXX methodology is composed of the Colilert®/Quanti-Tray 2000 technologies and is
enumerated in MPN. The MF methodology utilizes the ColiBlue24® technology and is
enumerated in cfu/100mL. IDEXX Laboratories, Inc. suggests that their MPN values are
numerically equivalent to cfu/100mL values. % Error = ((Idexx Value – MF Value)/MF Value)
x 100. The % Error results were not normally distributed, which required the use of a geomean
rather than an arithmetic mean.
Sampling
Site #
Date of
Sample
Idexx
Value
(MPN)
MF
Value
(cfu/100mL)
%
Error
12 2/10/2009 40.8 47.4 -13.9
4 3/25/2009 1,267.0 660.0 92.0
14 9/17/2009 5,172.0 400.0 1,193.0
15 9/17/2009 8,164.0 1,200.0 580.3
2 10/8/2009 2,247.0 1,200.0 87.3
17 10/8/2009 4,884.0 3,200.0 52.6
24 10/8/2009 727.0 427.0 70.3
22 10/13/2009 112.6 80.0 40.8
15 10/19/2009 11,199.0 4,700.0 138.3
16 10/19/2009 8,664.0 3,300.0 162.5
19 10/19/2009 3,654.0 2,250.0 62.4
20 10/19/2009 648.8 195.0 232.7
25 10/19/2009 71.2 39.5 80.3
13 11/2/2009 112.6 38.0 196.3
18 11/2/2009 9,208.0 4,400.0 109.3
22 11/4/2009 69.5 70.0 -0.7
23 11/4/2009 63.8 27.0 136.3
8 11/12/2009 19,683.0 14,667.0 34.2
9 11/16/2009 17,329.0 12,000.0 44.4
15 12/1/2009 7,701.0 4,666.0 65.0
12 12/9/2009 42.0 64.0 -34.4
Geomean 41.4

26 of 52
APPENDIX D
Comparison of IDEXX Methodology for E. coli vs MF Methodology for FC
The IDEXX methodology is composed of the Colilert®/Quanti-Tray 2000 technologies and is
enumerated in MPN. The MF methodology utilizes the m-FC (with rosalic acid) technology and
is enumerated in cfu/100mL. % Error = ((Idexx Value – MF Value)/MF Value) x 100. The %
Error results were not normally distributed, which required the use of a geomean rather than an
arithmetic mean.
Sampling
Site #
Date of
Sample
Idexx
Value
(MPN)
MF
Value
(cfu/100mL)
%
Error
12 2/10/2009 40.8 31.6 29.1
4 3/25/2009 1,267.0 280.0 352.5
1 6/10/2009 4.1 3.0 36.7
18 6/29/2009 9,208.0 2,000.0 360.4
2 10/8/2009 2,247.0 222.0 912.2
17 10/8/2009 4,884.0 1,300.0 275.7
24 10/8/2009 727.0 156.0 366.0
22 10/13/2009 112.6 74.0 52.2
15 10/19/2009 11,199.0 4,200.0 166.6
16 10/19/2009 8,664.0 1,725.0 402.3
19 10/19/2009 3,654.0 700.0 422.0
20 10/19/2009 648.8 215.0 201.8
25 10/19/2009 71.2 35.0 103.4
13 11/2/2009 112.6 55.0 104.7
18 11/2/2009 9,208.0 1,744.0 428.0
22 11/4/2009 69.5 28.0 148.2
23 11/4/2009 63.8 22.0 190.0
8 11/12/2009 19,683.0 1,752.0 1,023.5
9 11/16/2009 17,329.0 2,640.0 556.4
15 12/1/2009 7,701.0 2,500.0 208.0
12 12/9/2009 42.0 25.0 68.0
Geomean 206.0

27 of 52
APPENDIX E
Comparison of MF Methodology for E. coli vs MF Methodology for FC
The EC-MF methodology for E. coli utilizes the ColiBlue24® technology and is enumerated in
cfu/100mL. The FC-MF methodology for FC bacteria utilizes the m-FC (with rosalic acid)
technology and is enumerated in cfu/100mL. % Error = ((Idexx Value – MF Value)/MF Value)
x 100. The % Error results were not normally distributed, which required the use of a geomean
rather than an arithmetic mean.
Sampling
Site #
Date of
Sample
EC-MF
Value
(cfu/100mL)
FC-MF
Value
(cfu/100mL)
%
Error
12 2/10/2009 47.4 31.6 50.0
4 3/25/2009 660.0 280.0 135.7
2 10/8/2009 1,200.0 222.0 440.5
17 10/8/2009 3,200.0 1,300.0 146.2
24 10/8/2009 427.0 156.0 173.7
22 10/13/2009 80.0 74.0 8.1
15 10/19/2009 4,700.0 4,200.0 11.9
16 10/19/2009 3,300.0 1,725.0 91.3
19 10/19/2009 2,250.0 700.0 221.4
20 10/19/2009 195.0 215.0 -9.3
25 10/19/2009 39.5 35.0 12.9
13 11/2/2009 38.0 55.0 -30.9
18 11/2/2009 4,400.0 1,744.0 152.3
22 11/4/2009 70.0 28.0 150.0
23 11/4/2009 27.0 22.0 22.7
8 11/12/2009 14,667.0 1,752.0 737.2
9 11/16/2009 12,000.0 2,640.0 354.5
15 12/1/2009 4,666.0 2,500.0 86.6
12 12/9/2009 64.0 25.0 156.0
Geomean 43.3

28 of 52
APPENDIX F
E. coli Sampling Data throughout the Lower Sub-basin JD 33.4
Date of Sampling
Sampling Site #
E. coli (MPN)
02/02/09 1 1.0 03/19/09 1 1.0 05/20/09 1 1.0 06/10/09 1 4.1 07/28/09 1 1,413.6 10/08/09 1 3.1 11/02/09 1 1.0 12/09/09 1 1.0 02/02/09 2 6.2 03/19/09 2 90.9 05/20/09 2 12.1
06/10/09 2 344.8
07/28/09 2 2,419.6
10/08/09 2 2,247.0
11/02/09 2 1,723.0
12/09/09 2 3,255.0
02/02/09 3 90.9
03/19/09 3 285.1
05/20/09 3 23.8
06/10/09 3 613.1
07/28/09 3 9,208.0
09/21/09 3 1,725.0
10/28/09 3 1,413.6
12/10/09 3 547.5
02/02/09 4 172.5
03/25/09 4 1,267.0
04/16/09 4 2,419.6
06/10/09 4 1,553.1
07/28/09 4 6,131.0
09/21/09 4 906.0
10/28/09 4 1,413.6
12/10/09 4 1,413.6
02/02/09 5 178.2
03/25/09 5 4,225.0
04/16/09 5 2,419.6
06/10/09 5 3,448.0
07/28/09 5 1,986.3 09/21/09 5 988.0 10/28/09 5 980.4 12/10/09 5 1,533.1 02/02/09 6 1.0 03/17/09 6 1.0 04/16/09 6 1.0 07/08/09 6 1.0

29 of 52
08/05/09 6 3.1 09/21/09 6 1.0 11/12/09 6 1.0 12/10/09 6 1.0 01/29/09 7 3.0 03/17/09 7 1.0 04/30/09 7 4.0 06/01/09 7 1,986.3 07/22/09 7 93.3 09/21/09 7 73.3 10/28/09 7 209.8 12/10/09 7 1.0 01/29/09 8 2,419.6 03/25/09 8 243.0 04/30/09 8 435.0 06/01/09 8 14,136.0 07/21/09 8 1,723.0 09/21/09 8 6,488.0 11/12/09 8 19,863.0 12/09/09 8 148.0 01/29/09 9 2,419.6 03/25/09 9 813.0 05/14/09 9 44.3 06/01/09 9 1,986.3 07/21/09 9 24,196.0 09/29/09 9 12,997.0 11/16/09 9 17,329.0 12/09/09 9 305.0 01/29/09 10 2,419.6 03/25/09 10 24,196.0 05/14/09 10 19,863.0 06/01/09 10 6,867.0 07/21/09 10 24,196.0 09/29/09 10 241,960.0 10/28/09 10 30,760.0 12/14/09 10 717.0 01/29/09 11 2,419.6 03/25/09 11 2,382.0 05/14/09 11 1,553.1 06/01/09 11 7,270.0 09/29/09 11 241,960.0 12/14/09 11 3,654.0 12/21/09 11 6,131.0 01/04/09 11 2,613.0 02/11/10 11 2,359.0 02/10/09 12 40.8 03/30/09 12 56.3 04/30/09 12 461.1 06/01/09 12 1,119.9 07/22/09 12 1,986.3 09/17/09 12 350.0 11/02/09 12 1,553.1 12/09/09 12 42.0

30 of 52
03/11/09 13 20.4 04/09/09 13 2,419.6 05/07/09 13 203.0 06/29/09 13 1,850.0 07/21/09 13 1,162.0 09/29/09 13 279.0 11/02/09 13 112.6 12/09/09 13 35.0 02/10/09 14 2,419.6 03/23/09 14 19,863.0 04/30/09 14 4,884.0 07/08/09 14 7,270.0 08/05/09 14 6,867.0 09/17/09 14 5,172.0 11/02/09 14 9,208.0 12/01/09 14 7,701.0 02/10/09 15 1,986.3 03/23/09 15 12,997.0 04/30/09 15 4,884.0 07/01/09 15 2,419.6 08/05/09 15 7,270.0 09/17/09 15 8,164.0 10/19/09 15 11,199.0 12/01/09 15 7,701.0 02/10/09 16 2,419.6 03/23/09 16 9,804.0 04/30/09 16 3,873.0 07/01/09 16 6,131.0 08/05/09 16 5,794.0 09/17/09 16 4,884.0 10/19/09 16 8,664.0 12/01/09 16 9,804.0 02/10/09 17 2,419.6 03/19/09 17 17,329.0 04/30/09 17 6,488.0 06/29/09 17 6,131.0 07/22/09 17 4,352.0 10/08/09 17 4,884.0 11/02/09 17 7,701.0 12/16/09 17 3,255.0 03/11/09 18 2,419.6 04/09/09 18 3,255.0 05/07/09 18 292.0 06/29/09 18 9,208.0 07/28/09 18 2,419.6 10/13/09 18 1,725.0 11/02/09 18 9,208.0 12/17/09 18 7,701.0 02/18/09 19 1,413.6 03/23/09 19 1,413.6 04/16/09 19 2,723.0 07/08/09 19 3,448.0 08/10/09 19 19,863.0

31 of 52
09/29/09 19 5,475.0 10/19/09 19 3,654.0 12/16/09 19 4,352.0 02/18/09 20 2,419.6 03/23/09 20 15.3 04/16/09 20 228.2 07/08/09 20 275.5 08/10/09 20 260.3 09/29/09 20 198.9 10/19/09 20 648.8 12/16/09 20 123.6 03/30/09 21 2.0 04/16/09 21 1.0 12/14/09 21 1.0 12/21/09 21 260.3 01/04/10 21 2,419.6 01/14/10 21 1,203.3 01/21/10 21 980.4 01/27/10 21 816.4 02/11/10 21 2,613.0 02/18/09 22 2.0 03/30/09 22 186.0 04/16/09 22 133.4 07/08/09 22 866.4 08/10/09 22 547.5 10/13/09 22 112.6 11/04/09 22 69.5 12/14/09 22 33.2 02/18/09 23 2.0 03/19/09 23 579.4 05/14/09 23 209.8 06/29/09 23 613.1 07/22/09 23 325.5 10/13/09 23 98.5 11/04/09 23 63.8 12/14/09 23 25.0 02/18/09 24 2.0 03/30/09 24 48.7 05/07/09 24 2,419.6 07/15/09 24 214.2 08/05/09 24 305.0 10/08/09 24 727.0 11/12/09 24 224.7 12/16/09 24 313.0 02/18/09 25 1.0 03/30/09 25 44.1 05/07/09 25 98.8 07/15/09 25 435.2 08/05/09 25 68.3 09/17/09 25 117.8 10/19/09 25 71.2 12/16/09 25 5.1

32 of 52
APPENDIX G
Quality Assurance Project Plan

33 of 52
Quality Assurance Project Plan
Alternative Bacteria Source Identification using Colilert®/Quanti-Tray 2000 Test Method in
Irrigated Agricultural Watersheds
Environmental Assessment Program
Olympia, Washington 98504-7710
October 2008
Any use of product or firm names in this publication is for descriptive purposes only
and does not imply endorsement by the author or the Department of Ecology.
If you need this publication in an alternate format, call Carol Norsen at (360) 407-7486.
Persons with hearing loss can call 711 for Washington Relay Service.
Persons with a speech disability can call (877) 833-6341.

34 of 52

35 of 52
Table of Contents
Page
Abstract…………………………………………………………………………………… 5
Background…………………………………………………………………………….…. 6
General Description…………………………………………………………….… 6
Land-uses……………………………………………………………………….… 6
Bacterial Problem……………………………………………………………….… 7
Project Components………………………………………………………………………. 9
General Description……………………………………………………………….. 9
E. coli as a Substitute Indicator of Bacterial Pollution……………………………. 9
Colilert®/Quanti-Tray 2000 Methodologies……………………………………… 9
Objective and Desired Outcome……………………………………………….….. 10
Required Tasks………………………………………………………………….… 10
Project Schedule……………………………………………………………………….….. 10
Organization and Responsibilities……………………………………………………….... 11
Project Budget ………………………………………………………………………….…. 12
Data Quality Objectives………………………………………………………………….... 13
Accuracy…………………………………………………………………………... 13
Precision…………………………………………………………………………... 13
Bias…………………………………………………………………………….….. 13
Sampling Process Design……………………………………………………………….… 14
Sampling Procedures……………………………………………………………………… 14
Laboratory Procedures……………………………………………………………………. 15
Calibration and Quality Control…………………………………………………………... 16
Data Management Procedures………………………………………………………….…. 16
Data Verification and Validation…………………………………………………………. 17
Data Verification……………………………………………………………….…. 17
Data Validation………………………………………………………………….… 17
Data Quality Assessment…………………………………………………………………. 18
References………………………………………………………………………………… 18
Appendix A: Original 10 sampling sites in lower sub-basin JD 33.4……………………. 19

36 of 52
Tables and Figures Table 1 Irrigation Season Geomean FC Bacteria Densities in SCW
Sub-basins, 1999-2005…………………………………………….. …….. 8
Table 2 Non-irrigation Season Geomean FC Bacteria Densities in SCW
Sub-basins, 1999-2005……………………………………………………. 8
Table 3 Project Schedule…………………………………………………………... 11
Table 4 Organization and Responsibilities of Staff……………………………….. 11
Table 5 MQOs for Project…………………………………………………………. 14
Table 6 Field Sampling Procedures……………………………………………….. 15
Table 7 Laboratory Procedures……………………………………………………. 15
Figure 1 Sulphur Creek Watershed Sub-basins …………………………………….. 7

37 of 52
Abstract
The Washington State Department of Ecology (Ecology) received grant funds for Innovative
TMDL Development Projects from the United States Environmental Protection Agency (EPA),
Region 10. The demonstration project will evaluate whether E. coli can be effectively used by a
small rural laboratory as a substitute for fecal coliform (FC) bacteria monitoring for the
identification of bacteria sources in an irrigated agricultural watershed.
The Sulphur Creek Wasteway (SCW) watershed is divided into seven sub-basins based on its
various tributaries (Figure 1). The Roza-Sunnyside Board of Joint Control (RSBOJC) has
conducted extensive FC bacteria monitoring throughout all of the sub-basins of the SCW. All but
one of the sub-basins had significantly greater FC bacteria densities during the irrigation season
“critical condition”. Only the lower sub-basin JD 33.4 showed a year-round “critical condition”,
which suggests the predominant bacteria sources in that sub-basins are “point sources” rather than
“non-point sources”.
Several additional water samples will need to be analyzed throughout the lower sub-basin JD
33.4 in order to locate more precisely the point source discharges of bacterial pollution.
However, the RSBOJC, like various rural agencies, has limited staff and laboratory
footprint/equipment for analyzing water samples. The demonstration project will specifically
utilize an alternative methodology, Colilert®/Quanti-Tray 2000, for the analysis of E. coli as a
substitute for the labor-intensive membrane filtration analysis of FC bacteria.
A positive outcome from the demonstration project will provide an efficient alternative method
for bacteria source identification in primarily irrigated agricultural watersheds. The use of
Colilert®/Quanti-Tray 2000, if successful, is expected to allow future bacterial TMDLs in those
types of watersheds to be completed on an accelerated timeline.

38 of 52
Background
General Description
The Sulphur Creek Wasteway (SCW) watershed is located in Yakima County within Water
Resource Inventory Area (WRIA) 37 with its center located at Latitude: 46.27861 and
Longitude: -120.00056 (Figure 1). The watershed occupies lands surrounding the city of
Sunnyside, which is located on the east side of the Cascade Mountain range alongside Interstate
82, approximately 35 miles southeast of the city of Yakima and 45 miles northwest of the Tri-
cities area (Richland/Kennewick/Pasco).
The 96,000-acre (150 square miles) watershed lies in the Yakima River valley and is bounded by
the Horse Heaven Hills anticline to the south and the Rattlesnake Hills anticline to the north.
The soil is deep, well-drained, fertile silt loam (Zuroske, 2004). The natural vegetation of the
SCW watershed is categorized as shrub-steppe, consisting of various sagebrushes and
bunchgrasses. However, when the land is cleared and irrigation water is applied, an unlimited
variety of crops can be grown in the SCW watershed.
The climate of the area is generally characterized as mild and dry. Summer air temperatures
range from 85 to over 100 degrees Fahrenheit. Winters are generally cool with air temperatures
often falling below freezing from November through January, sometimes reaching 20 degrees
below zero Fahrenheit. Annual snowfall is light and averages 10 to 15 inches. The SCW
watershed receives 6 to 8 inches of annual precipitation, with the principle growing season (June,
July and August) receiving less than one inch of measurable precipitation.
The SCW is a man-made drainage canal (7.5 miles in length) that ultimately collects all of the
irrigation return flows, municipal stormwater, and some point source municipal and industrial
discharges that occur within the watershed. It was constructed in 1908-1910 and serves as the
Sunnyside Division’s principal man-made drainage canal. The drainage canal system is owned by
the United States Bureau of Reclamation and is part of that agency’s Yakima Project.
Land-uses
In addition to approximately 1,500 acres of irrigated agricultural lands, the lower sub-basin JD
33.4 includes two dairies, part of one municipality, several “hobby farms” and rural residences.
The drainage from the sub-basin includes runoff from irrigation agriculture, stormwater flows
from the central business district of the City of Sunnyside, effluent discharges from the City’s
POTW, and discharges from the entire Port of Sunnyside industrial property.

39 of 52
Bacterial Problem
Analysis of water quality data from 1968 through 1985 by the United States Geological Survey
(USGS) found that the SCW watershed FC bacteria densities were “among the largest observed
throughout the Yakima River Basin” (Embry, 1992). Morace et al. (1999) determined that
agricultural practices caused increased fecal-indicator bacteria in streams that receive irrigation
return flows throughout the lower Yakima River basin. That same report and another by Fuhrer
et al. (2004) suggested that the excessive FCB densities in the SCW were related to the
watershed’s high density of livestock. Ecology water quality monitoring near the mouth of the
SCW found FC bacteria geometric means of 1,237 cfu/100mL (2 samples) and 1,437 cfu/100mL
(9 samples) during 1993 and 1994, respectively.
The RSBOJC’s Ecology-certified laboratory has also collected a vast amount of FC bacteria
density data from the SCW and its various tributaries since 1997. Figure 1 shows the seven sub-
basins of the composing the SCW watershed. The greatest bacterial pollution in the watershed is
found in the lower sub-basin JD 33.4. These high densities are found year-round. All of the
other sub-basins have significantly lower bacteria densities during the non-irrigation period
(November 1 – March 31).
Figure 1. Sulphur Creek Watershed Sub-basins

40 of 52
The demonstration project is specifically directed at the lower sub-basin JD 33.4, because its
irrigation season (April 1 – October 31) FC bacteria densities continue to exist throughout the
non-irrigation season. The year-round occurrence of high bacteria densities suggests that the
predominant sources of bacterial pollution in the lower sub-basin JD 33.4 are “point sources”
rather than “non-point sources” as suspected in all of the other SCW sub-basins.
Table 1 details the annual geometric mean (geomean) FC bacteria densities found during the
irrigation season at each of the seven historical RSBOJC sub-basins within the SCW watershed,
from 1999 through 2005. The greatest overall sub-basin irrigation season geomean (1999-2005
data combined) FC density (1,213 cfu/100 mL) occurred in the lower sub-basin JD 33.4.
Table 2 details the annual geometric mean (geomean) FC bacteria densities found during the non-
irrigation season at each of the seven historical RSBOJC sub-basins within the SCW watershed,
from 1999 through 2005. The greatest overall sub-basin non-irrigation season geomean (1999-2005
data combined) FC density (1,663 cfu/100 mL) occurred in the lower sub-basin JD 33.4.
Table 1. Irrigation Season Geomean FC Bacteria Densities in
SCW Sub-basins, 1999-2005
Sub-basin # Lower
JD
33.4
Upper
JD
33.4
JD
43.9
JD
40.2
JD
35.4
JD
37.9
Main
stem
SCW Year of Sampling
1999 3,726 1,092 1,130 1,436 508 359 800
2000 815 715 801 1,181 251 353 457
2001 507 344 610 860 134 221 361
2002 1,540 - 301 580 172 196 410
2003 775 243 301 592 160 249 285
2004 1,003 319 451 633 250 136 364
2005 1,327 309 333 791 218 299 369
Geomean 1,213 448 534 875 244 262 498
Table 2. Non-irrigation Season Geomean FC Bacteria Densities in
SCW Sub-basins, 1999-2005
Sub-basin # Lower
JD
33.4
Upper
JD
33.4
JD
43.9
JD
40.2
JD
35.4
JD
37.9
Main
stem
SCW Year of Sampling
1999 833 370 314 272 200 120 278
2000 1,937 251 164 129 100 72 383
2001 3,047 340 256 193 135 43 333
2002 1,117 - 209 268 520 247 355
2003 1,169 61 186 121 62 28 329
2004 1,350 112 135 190 433 83 283
2005 3,600 70 170 140 136 62 632
Geomean 1,663 139 196 179 175 75 400

41 of 52
Project Components
General Description
The demonstration project has the goal of showing whether numerous water quality samples can
be efficiently analyzed for E. coli using the Colilert®/Quanti-Tray 2000 methodology by a small
rural laboratory, without the concurrent need to increase laboratory staffing or footprint/floor
space.
Numerous additional water quality samples are required to locate the bacteria point sources in
the lower sub-basin JD 33.4. However, the RSBOJC’s water quality laboratory (2 persons and
limited floor space) would be quickly overwhelmed by the influx of numerous samples for the
membrane filtration FC bacteria analysis. The demonstration project will utilize an alternative
methodology that has already been approved by the EPA for conducting multiple E. coli analyses
more rapidly than the laboratory’s present time-consuming membrane filtration methodology.
This QAPP provides a review of the quality assurance (QA) measures associated with the
Colilert®/Quanti-Tray 2000 methodology proposed for the demonstration project. The
demonstration project requires the collection of eight water samples at each of twenty-five
different sampling sites (total of 200 samples), all of which are located throughout the lower sub-
basin JD 33.4. Thirty of those samples are required to be either split in the field or in the
laboratory for QA purposes. All data collection and analyses shall be required to follow the
applicable QA requirements found in this QAPP.
E. coli as a Substitute Indicator of Bacterial Pollution
The various RSBOJC historical paired E. coli and FC bacteria densities collected within the
SCW watershed are numerically nearly equivalent. Use of the substitute bacteria indicator of E.
coli is logical as such species also typically compose 95-98% of the FC bacteria in water samples
collected throughout the State (Hicks, 2002).
Colilert®/Quanti-Tray 2000 Methodologies
The Colilert® methodology is used for the simultaneous detection and confirmation of E. coli in
fresh and marine waters. It is based on IDEXX’s patented Defined Substrate Technology
(DST ). When E.coli metabolize the nutrient indicator, MUG, the sample fluoresces. EPA
officially approved the Colilert® method for testing ambient waters (July 21, 2003 Federal
Register). Same as Standard Methods (SM) enzyme substrate test: SM 9223(B).
Although membrane filtration and Colilert®/Quanti-Tray 2000 methodologies both need 24
hours for bacteria enumeration, the Colilert® methodology is more labor efficient: start to finish
of 6 minutes hands-on time per sample. In addition, an incubator should be purchased that will
easily accommodate several Quanti-Trays at the same time so that laboratory space efficiency
will be maximized.

42 of 52
Each water sample is collected using a Colilert 100-ml pre-sterilized vial. Each vial then
receives the contents of one MUG substrate packet. The vial is quickly resealed, shaken until
contents are dissolved and then poured into a Quanti-Tray 2000 tray. The Quanti-Trays are then
sealed and placed into an incubator at 35°C for 24 hours. An ultraviolet light is used to make the
actual counts of the fluorescent yellow E. coli colonies.
Each Quanti-Tray contains 97 wells of two different sizes to achieve bacterial counts of 1 to
2,419 cfu/100mL, with a 95% confidence limit. For higher densities, it will be necessary to
make dilutions of the collected water samples.
Objective and Desired Outcome
The demonstration project’s objective is to prove whether, or not, the Colilert®/Quanti-Tray
2000 methodology will allow for the rapid analysis of numerous water samples without a
concurrent need for increasing laboratory personnel or square footage. The project’s desired
outcome is to promote the accelerated development of future TMDLs in irrigated agricultural
watersheds, especially those containing a large component of AFOs. A secondary desired
outcome is to gain laboratory accreditation for the Colilert®/Quanti-Tray 2000 methodology, at
the RSBOJC laboratory. Accreditation is required for Ecology to use test results in water
quality-based actions.
Required Tasks
The principal tasks required by the demonstration project of the RSBOJC are as follows:
Purchase all equipment needed for the demonstration project
Determine and identify all sampling sites
Collect water quality samples and conduct bacteria analyses
Review all data for quality and compile qualified data
Deliver all data to Ecology for preparation of final report
Disseminate copies of final report to interested parties and put onto RSBOJC
website
The principal tasks required by the demonstration project of Ecology are as follows:
Obtain signatures for QAPP and Interagency Agreement
Statistically analyze data
Prepare final report for demonstration project
Deliver final report to RSBOJC
Project Schedule
The sampling portion of the demonstration project is expected to commence by January 1, 2009
and continue through December 31 of that same year. It may be necessary, however, to adjust
the timelines presented in Table 3, below, if special circumstances arise.
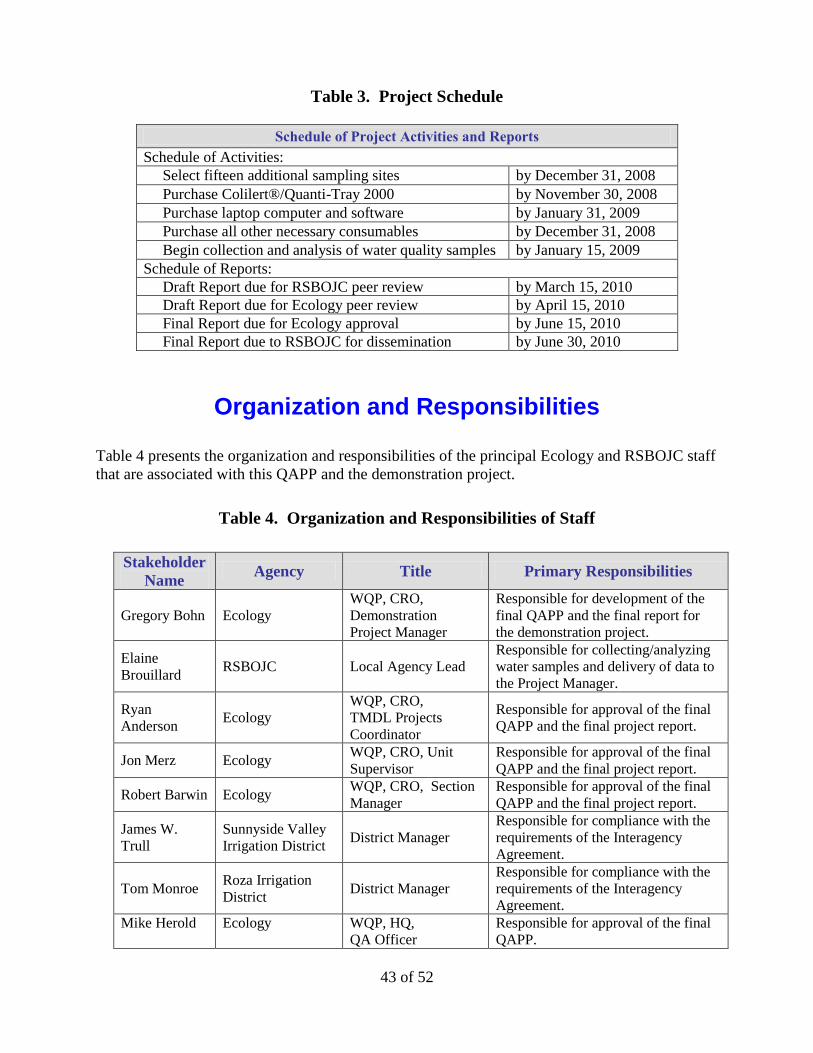
43 of 52
Table 3. Project Schedule
Schedule of Project Activities and Reports
Schedule of Activities:
Select fifteen additional sampling sites by December 31, 2008
Purchase Colilert®/Quanti-Tray 2000 by November 30, 2008
Purchase laptop computer and software by January 31, 2009
Purchase all other necessary consumables by December 31, 2008
Begin collection and analysis of water quality samples by January 15, 2009
Schedule of Reports:
Draft Report due for RSBOJC peer review by March 15, 2010
Draft Report due for Ecology peer review by April 15, 2010
Final Report due for Ecology approval by June 15, 2010
Final Report due to RSBOJC for dissemination by June 30, 2010
Organization and Responsibilities
Table 4 presents the organization and responsibilities of the principal Ecology and RSBOJC staff
that are associated with this QAPP and the demonstration project.
Table 4. Organization and Responsibilities of Staff
Stakeholder
Name Agency Title Primary Responsibilities
Gregory Bohn Ecology
WQP, CRO,
Demonstration
Project Manager
Responsible for development of the
final QAPP and the final report for
the demonstration project.
Elaine
Brouillard RSBOJC Local Agency Lead
Responsible for collecting/analyzing
water samples and delivery of data to
the Project Manager.
Ryan
Anderson Ecology
WQP, CRO,
TMDL Projects
Coordinator
Responsible for approval of the final
QAPP and the final project report.
Jon Merz Ecology WQP, CRO, Unit
Supervisor
Responsible for approval of the final
QAPP and the final project report.
Robert Barwin Ecology WQP, CRO, Section
Manager
Responsible for approval of the final
QAPP and the final project report.
James W.
Trull
Sunnyside Valley
Irrigation District District Manager
Responsible for compliance with the
requirements of the Interagency
Agreement.
Tom Monroe Roza Irrigation
District District Manager
Responsible for compliance with the
requirements of the Interagency
Agreement.
Mike Herold Ecology WQP, HQ,
QA Officer
Responsible for approval of the final
QAPP.

44 of 52
Project Budget
The entire cost of the demonstration project is estimated to be $30,000, the majority of which
represents the Colilert®/Quanti-Tray 2000 equipment and labor costs. The costs associated with
the FCB membrane filtration analyses are only for consumables as the RSBOJC laboratory has
already purchased the required equipment. The RSBOJC will be given an Ecology grant for the
total amount above and will be required to sign an interagency agreement to provide for the
collection and analysis of water quality samples as outlined in this QAPP.
Budget Category
Budget Category Total
Personnel Hourly Wage Hours Sub-totals
Project Manager $35.00 20 $700*
Water Quality Specialist $25.00 220 $5,500
Water Quality Tech $15.00 220 $3,300 $9,500
Fringe Benefits (16% of salaries)
Includes: retirement, health care, annual and sick leave, life insurance $1,520
Transportation ($0.70 per mile)
Includes: depreciation, gas, oil, and maintenance $230
Equipment
Colilert®/Quanti-Tray-2000 $9,525
Supplies Sub-totals
Office supplies: paper, pens, toners for printers and copiers $750
Consumables for Colilert® methodology $900
Consumables for FCB membrane filtration methodology $570
Laptop PC for data collection in the field $1,500
Software for laptop and in-house laboratory PC $825 $4,545
Other
Print and mail project information to agencies and local community $1,700
Total Direct Costs $27,020
Indirect Costs (17% of base)
Base = total direct cost of $27,020 less capital equipment costs $2,974
Total Project Costs $29,994
* Amount will be retained by the RSBOJC for project incidentals, as Project Manager will be paid by Ecology.

45 of 52
Data Quality Objectives
Data quality objectives are statements of the precision, bias, and lower reporting limits necessary
in order to generate data that address project objectives. Sampling, laboratory analysis, and data
evaluation steps have several sources of error that should be addressed by data quality objectives.
The primary determinants for data quality are accuracy, precision and bias.
The RSBOJC laboratory will ultimately obtain accreditation for the Colilert®/Quanti-Tray 2000
methodology, if the demonstration project proves successful. It is acknowledged that such
accreditation would be very beneficial if obtained prior to the bacterial analyses required by this
QAPP, so that the collected data could be placed into Ecology water quality program’s data base.
Accuracy
Accuracy measures how close laboratory results are to a true or expected value. Accuracy is
usually measured by analyzing a sample “spiked” with a known concentration. For purposes of
the project, no “spikes” will be used, but rather the true value is assumed to be that obtained from
FC bacteria membrane filtration analysis. Ten random samples (5% of total samples) will be
split in the laboratory and analyzed by the Colilert®/Quanti-Tray 2000 methodology for E. coli,
as well as the membrane filtration methodology for both E. coli and FC bacteria. Because E. coli
is assumed to make up 95-98% of FC bacteria agricultural watersheds, accuracy will be
estimated by the relative percent difference (RPD) calculated from comparative analysis of the
laboratory split samples. Only log-transformed data will be used to assess accuracy.
Precision
Precision, expressed as RPD and derived from analysis of field sample splits, is a measure of the
reproducibility of a result while subject to random error. Random error can occur during sample
handling, preservation, and storage, as well as during the analytical process. Twenty random
samples (10% of total samples) will be split in the field and analyzed by the Colilert®/Quanti-
Tray 2000 methodology for E. coli. Precision will be estimated by the RPD calculated from
comparative analysis of the field split samples. Only log-transformed data will be used to assess
precision.
Bias
Bias is a statistical measurement of the difference due to systematic errors between the result for
a parameter and the true value. Potential sources of systematic errors include sample collection,
physical and chemical instability of samples, interference effects, instrument calibration, and
contamination. There are no specific numerical levels of bias defined for bacterial analyses.
Bias will be assumed to have been minimized by adherence with established quality control
protocols outlined in this QAPP and in the RSBOJC laboratory’s own standard operating
procedures. Table 5 presents the Measurement Quality Objectives (MQOs) for this QAPP.

46 of 52
Table 5. MQOs for Project
Analysis Method Accuracy Precision Bias Required
Reporting Limits
FCB SM 9222-D n/a <25% RPD* n/a 1 cfu/100mL
E. coli SM 9223-B <25% RPDa <25% RPD
b n/a 1 MPN/100mL
a RPD using log-transformed data compared to laboratory split samples measured by the FC bacteria
membrane filtration methodology. b RPD using log-transformed data comparing field split samples.
Sampling Process Design
The twenty-five sampling sites will be established for the demonstration project, all located
along JD 33.4 in the lower sub-basin, because that area shows a “year-round” bacterial critical
condition. Thus, the demonstration project suspects that the principal bacteria sources in the sub-
basin are “point sources”. Ten easily-accessible monitoring sites (Appendix A) have been pre-
selected by Ecology and RSBOJC in order to divide the entire length of above sub-basin into
easily-accessible segments. The RSBOJC Water Quality Specialist is required to select fifteen
additional sampling sites prior to commencement of sampling in order to further divide the lower
sub-basin JD 33.4.
All twenty-five sampling sites will each be sampled a minimum of eight times for a total of 200
samples to be collected throughout the duration of the project. The samples will be collected on
random days and at random times in order to prevent any potential bias by time-sensitive
discharges. No more than one sample per site shall be collected in any single month. The
RSBOJC may collect and analyze more than 200 samples, but the additional samples should be
distributed equally throughout the various months of the project duration. No sampling shall be
collected within 24 hours after any precipitation (storm) event.
Ten samples of the required minimum of 200 are required to be split in the field and analyzed for
precision QA (See Table 5, above). Ten samples of the required minimum of 200 are required to
be split in the laboratory and analyzed for accuracy QA (See Table 5, above). No more than one
field split sample shall be obtained from any single site.
Sampling Procedures
Safety procedures for field sampling, developed by the RSBOJC, shall be followed at all times.
Field sampling shall be postponed any time personnel determine that driving conditions, site
access, or sampling conditions are unsafe. Field sampling shall resume as soon as possible, but
only after safe conditions have returned. All samples will be collected as grab samples of water
from as near the middle of the stream flow, as possible.

47 of 52
Collected samples shall be immediately placed into pre-cleaned and sterilized glass or plastic
containers (bottles or “whirlpaks”). Containers shall be appropriately labeled (sample ID, date,
time and sampling site), and subsequently transferred to a cooler and placed in crushed or cube
ice (0°C to 4°C) for short-term storage. All cooled samples shall be delivered to the RSBOJC
laboratory within 6 hours after sample collection. At the laboratory, the cooled samples shall be
analyzed for E. coli, or FC bacteria when required, within 24 hours after collection.
Table 6 outlines the details of the required field sampling procedures.
Table 6. Field Sampling Procedures
Parameter Container
Size
Container
Type Preservation
Delivery
Time to
Lab
# of
Sampling
Sites
# of
Samples
per Site
# of Samples
to be Split in
Field for QC
Bacteria 250 or
500 mL
Glass or
Plastic
Cool to 4°C within 6
hours
25 8 10*
* To be collected at the discretion of the sampling personnel from different sites.
Laboratory Procedures
Laboratory analysis of FC bacteria shall be performed in accordance with RSBOJC standard
operating procedures, which utilizes the EPA-approved method: SM9222-D (membrane filter
method). Laboratory analysis of E. coli shall be performed in accordance with the manufacture’s
manual, which utilizes the EPA-approved method: SM9223-B (Colilert®/Quanti-Tray/2000).
Sampling staff will continually communicate with the RSBOJC laboratory to ensure that all
sampling and laboratory analyses will proceed on schedule with a minimum of confusion. The
sampling staff will follow normal RSBOJC procedures for sample notification and scheduling. It
is expected that with adequate communication, sample quantities should not overwhelm the
capacity of the small two-person RSBOJC laboratory. Use of the Colilert®/Quanti-Tray 2000
equipment should allow the RSBOJC laboratory to keep up with the numerous bacterial samples
that would otherwise not be possible.
Table 7 outlines the details of the required laboratory procedures.
Table 7. Laboratory Procedures
Analyte Analytical
Method Expected Range of Results
Maximum
Holding
Time
# of Samples to be
Split in the
Laboratory for QC
FCB SM 9222-D 50 - 5,000 cfu/100mL 24 hours 10*
E. coli SM 9223-B 50 - 5,000 MPN/100mL 24 hours N/A
* To be collected at the discretion of the laboratory personnel. All split samples will be
analyzed for both E. coli and FC bacteria.

48 of 52
Calibration and Quality Control
All equipment utilized for laboratory analyses will be checked and calibrated, if required, as per
the manufacturer’s directions. All laboratory chemicals, reagents and other materials will be
properly stored and checked for expiration dates. All expired materials will be appropriately
discarded and at no time will be used for bacterial analyses.
Total variation for field sampling and analytical variation will be estimated by analysis of field
split samples and comparing such variation to the precision MQO listed in Table 5, above.
Bacteria samples tend to have a high RPD compared to other water quality analyses. Total
variation for field sampling and laboratory analysis of bacterial samples will be estimated by
analyzing twenty field split samples, all collected from different sites. Precision up to a
maximum RPD of 25% of log-transformed data will be considered acceptable for field split
samples.
Ten of the collected samples will be split in the laboratory for measurement of E. coli by both the
Colilert®/Quanti-Tray 2000 and membrane filtration methodologies, as well as for FC bacteria
by the membrane filtration methodology. Accuracy up to a maximum RPD of 25% of log-
transformed data will be considered acceptable for laboratory split samples.
Employing consistent and standard procedures will ensure that individual samples are
representative of the water conditions at the times and places they are collected. The time of day
when sampling sites are visited will be randomized, with no sampling site being visited at the
same time of day. The ambient conditions will be documented at time of sampling so that later
correlations may be made of the data. All samples will be collected in pre-cleaned plastic
sample containers, placed in crushed or cube ice (0°C to 4°C), and delivered to the RSBOJC
laboratory within 6 hours of collection.
Data Management Procedures
Field notes will either be entered directly into the laptop computer or entered into a notebook
with waterproof pen, as soon as possible after the collection of each sample. Such notes shall
include the time of day, date of collection, sample ID, and sampling site location or ID #. As
laboratory analysis data are collected, they will be compiled and entered into an electronic
spreadsheet for analysis. After all samples have been collected, the geometric mean and 90%
values of E. coli (and of FC bacteria when necessary) will be calculated for each sampling site
and compared to the State’s water quality criteria for FC bacteria.
Non-detect values shall be treated as 0 cfu/100 mL, as the lower detection limit of the
Colilert®/Quanti-Tray 2000 methodology is 1 cfu/100 mL. In addition, the RPD values for both
accuracy and precision will be calculated and compared to the maximum value of 25%. All of
the above values represent important aspects of the demonstration project. All field and
laboratory data shall be completed and delivered to the Ecology Project Manager by December
31, 2009.

49 of 52
Data Verification and Validation
Data Verification
Data verification involves examining the data for errors, omissions, and compliance with quality
control (QC) acceptance criteria. The local agency lead (RSBOJC Water Quality Specialist) will
be responsible for performing the following functions:
Reviewing and reporting QC checks on instrument performance such as initial
and continuing calibrations.
Reviewing and reporting the results of field and laboratory QC sampling/analyses.
Explaining flags or qualifiers were assigned, where necessary, to sample results.
Reviewing and assessing the RSBOJC laboratory’s performance in meeting the
conditions and requirements set forth in this QAPP.
Reporting the above information to the Ecology Project Manager.
After measurement results have been recorded and prior to sending such data to the Ecology
Project Manager, such person will verify that:
Data are consistent, correct, and complete, with no errors or omissions.
Established criteria for QC results were met.
Data specified in Sampling Process Design were obtained.
Methods and protocols specified in the QAPP were followed.
Field results will also be verified by RSBOJC staff before leaving the sampling site after each
sample collection event. Detailed field notes will be kept to meet the requirements for
documentation of field measurements. RSBOJC staff is responsible for checking and ensuring
that field data entries are complete and error free.
Data Validation
Data validation is the next step following verification. Data validation involves a detailed
examination of the data using professional judgment to determine whether the MQOs for
precision, bias, and accuracy have been met, as well as whether the data is complete. The
Ecology Project Manager will assess both accuracy and precision of the data, since bias is not
possible to numerically assess. RPD analyses of field split samples (precision) and laboratory
split samples (accuracy) will be conducted. Acceptable accuracy and precision performance is
defined as an RPD of <25% (log-transformed data).
The Ecology Project Manager will examine the completeness of the data by its compliance with
procedures outlined in this QAPP; whereas, the RSBOJC Water Quality Specialist will examine
completeness of the data by its compliance with procedures outlined in the RSBOJC laboratory’s
standard operating procedures. Completeness will be assessed by examining: number of samples
collected compared to sampling plan; correctness of actual sampling sites compared to sampling
plan; number of samples collected by and received in acceptable condition at the RSBOJC
laboratory; the laboratory’s ability to produce usable results for each sample; and sample results
accepted by the Water Quality Specialist.

50 of 52
Data Quality Assessment
After the data have been verified and validated, the following steps will be conducted to assess
the data quality:
Review the data quality objectives and the sampling design.
Conduct a preliminary data review.
Apply appropriate statistical tests to evaluate the bacterial data.
Verify the assumptions of the statistical test.
Draw conclusions from the bacterial data.
Any result that fall outside the accuracy and precision MQO of <25% RPD (log-transformed
data) will be evaluated individually to see if any laboratory or sampling errors were made during
the project. The Project Manager will use best professional judgment in the decision as to
whether these values will be eliminated from the data set. If no such errors have been
determined to have been made, then all such data must be utilized in the project’s calculations.
References
Embrey, S.S. (1992) Surface Water Quality Assessment of the Yakima River Basin, Washington
– Areal Distribution of Fecal-Indicator Bacteria, July 1988. United States Geological Survey.
Open File Report 91-4073. 34 pp.
Fuhrer, G.J., J.L. Morace, H.M. Johnson, J.F. Rinella, J.C. Ebbert, S.S. Embry, I.R. Waite, K.D.
Carpenter, D.R. Wise, and C.A. Hughes. (2004) Water Quality in the Yakima River Basin,
Washington, 1999-2000. United States Geological Survey. Circular 1237. 34 pp.
Hicks, M. (2002) Setting Standards for the Bacteriological Quality of Washington’s Surface
Water – Draft Discussion Paper and Literature Summary. Washington State Department of
Ecology. Publication 00-10-072. Revised December 2002. 109 pp.
Morace, J., G.J. Fuhrer, J.F. Rinella, and S.W. McKenzie. (1999) Surface-Water-Quality
Assessment of the Yakima River Basin in Washington: Overview of Major Findings, 1987-91.
United States Geological Survey. Water-Resources Investigations Report 98-4113. 31 pp.
Zuroske, M. (2004) Conservation Practices and Water Quality Trends in Sulphur Creek
Wasteway and Granger Drain Watersheds, 1997 to 2002. South Yakima Conservation District.
December 2004. 50 pp.

51 of 52
Appendix A. Original 10 sampling sites in lower sub-basin JD 33.4

52 of 52
APPENDIX H
Average Time Difference between IDEXX and MF Methodologies
Laboratory
Proceedure
IDEXX Methodology
per Quanti-Tray1
(minutes)
MF Methodology
per Plate2
(minutes)
Set-up 2 5
Run 4 2
Breakdown 2 5
Read & calculate 1 3
Wash 1 4
Autoclave3 50 50
Total per unit 60 72
1 Times are typical for one IDEXX Quanti-Tray that is diluted 1:10 and includes
the mixing and resting periods for the enzymatic reaction. However, two Quanti-
Trays were frequently used per each water quality sample. Two Quanti-Trays in
tandem would take approximately 65 minutes to acquire an enumerated value.
2 Times are typical for one MF plate. However, three plates were run per each
water quality sample, along with two “before and after” plates for QA/QC. Each
entire 5-plate process would take approximately 92 minutes to acquire an
enumerated value.
3 Times for autoclaving are listed but are included in the calculation of “hands-
on” times.