alternative assets assumptions
TRANSCRIPT
PORTFOLIO INSIGHTS
FOR INSTITUTIONAL/WHOLESALE/PROFESSIONAL CLIENTS AND QUALIFIED INVESTORS ONLY – NOT FOR RETAIL USE OR DISTRIBUTION
A L T E R N A T I V E A S S E T S A S S U M P T I O N S
Reaching investment objectives when traditional assets may not be enough
Anthony Werley, Chief Investment Officer, Endowments & Foundations Group
Pulkit Sharma, CFA, CAIA, Head of Alternatives Investment Strategy and Solutions
Nicolas Aguirre, CFA, Head of Portfolio Construction & Risk, Endowments & Foundations Group
Shay Chen, CFA, CAIA, Alternatives Strategist, Alternatives Investment Strategy and Solutions
I N B R I E F
A fertile environment for alpha generation drives our estimates for financial alternatives. Real asset assumptions are flat to slightly lower than last year’s, due in part to a more advanced economic recovery. Our return assumptions are for the median manager; due diligence is key to realizing the full potential of an allocation.
• Private equity (PE): Return assumptions increase slightly. Continuing innovation and transformation, expanding PE markets globally and new, potentially return-enhancing investment tools energize alpha.
• Direct lending: Return estimates are stable year on year, even as underwriting disciplines and yield premiums vs. public debt hold steady and asset growth rises.
• Hedge funds: Assumptions are raised for most major strategies on expectations for an alpha upturn. Our outlook anticipates reductions in fees, asset flows and competition, along with rising rates, volatility, return dispersion and allocations to private investments.
• Real estate: Return estimates decline slightly across regions, given lower or flat starting yields partially offset by stronger net cash flow growth. We expect continued performance dispersion among sectors and improvement in rental rates. REITs returns are also down, reflecting less upside potential following their recent strong recovery.
• Infrastructure: Return estimates are unchanged. We expect stronger GDP growth, inflation and accommodating fiscal policy to support stable, income-driven returns from these essential assets.
• Transport: Return projections are down slightly, but our outlook remains strong, driven near term by positive supply/demand conditions and longer term by these assets’ vital role in global economic growth.
• Commodities: Return assumptions increase despite the past year’s substantial rise in commodity prices. We project a premium above inflation, on average, over the remainder of the cycle, yielding a strong full-cycle return. The return premium for gold vs. broad commodities narrows.

2 LONG-TERM CAPITAL MARKET ASSUMPTIONS | J .P. MORGAN ASSET MANAGEMENT
OVERVIEWThe past year’s significant equity outperformance and continued low rate environment, despite a strengthening economic cycle and heightened inflation expectations, reinforce the essential and expanded role we see for alternatives in a diversified multi-asset portfolio. EXHIBIT 1 summarizes our 2022 and 2021 return assumptions for median managers across selected alternative strategies. As always, thoughtful allocation and prudent selection of top-tier managers remain critical in realizing the potential for alpha, income and diversification that alternative investing can provide.
EXHIBIT 1: SELECTED ALTERNATIVE STRATEGIES – RETURN ASSUMPTIONS (LEVERED,* NET OF FEES, %)
FINANCIAL ALTERNATIVES 2022 2021
PRIVATE EQUITY (USD)
Cap-weighted composite** 8.10 7.80
Small cap 7.40 7.30
Mid cap 7.60 7.40
Large/mega cap 8.40 8.00
PRIVATE DEBT (USD)
Direct lending† 6.90 6.80
HEDGE FUNDS (USD)
Equity long bias 3.30 3.40
Event-driven 3.20 3.10
Relative value 3.80 3.60
Macro 2.70 2.20
Diversified†† 3.60 3.30
Conservative†† 3.30 3.10
REAL ASSETS 2022 2021
REAL ESTATE – DIRECT (LOCAL CURRENCY)
U.S. core‡ 5.80 5.90
U.S. value-added 7.70 8.10
European core‡‡, 4.80 5.00
European value-added 6.80 7.70
Asia-Pacific core‡‡ 6.50 6.60
REITS (LOCAL CURRENCY)
U.S. REITs 5.70 6.50
European REITs 5.10 5.90
Asia-Pacific REITs^ 5.00 6.40
Global REITs^^ 5.40 6.40
INFRASTRUCTURE (USD)
Global core 6.10 6.10
TRANSPORT (USD)
Global core 7.40 7.60
COMMODITIES (USD)
Broad commodities 2.60 2.30
Gold 3.00 2.90
Source: J.P. Morgan Asset Management; estimates as of September 30, 2020, and September 30, 2021.* All return assumptions incorporate leverage, except for commodities, where it does not apply.** The private equity composite is AUM-weighted: 65% large cap and mega cap, 25% mid cap and 10% small cap. Capitalization size categories refer to the size of the asset pool, which
has a direct correlation to the size of companies acquired, except in the case of mega cap.† Direct lending assumptions for 2022 and 2021 are not directly comparable. See footnotes in direct lending section for a detailed explanation.†† The diversified assumption represents the projected return for multi-strategy hedge funds. The conservative assumption represents the projected return for multi-strategy hedge
funds that seek to achieve consistent returns and low overall portfolio volatility by primarily investing in lower volatility strategies such as equity market neutral and fixed income arbitrage.
‡ U.S. core real estate in our assumptions comprises 90% prime high quality real estate assets and 10% value-added development assets. This exposure is consistent with the composition of the benchmark NFI-ODCE Index.
‡‡ Our 2022 assumptions are not directly comparable to our 2021 assumptions due to a change in methodology: For our 2022 estimates, to improve consistency across regions, we match the composition of European and Asia-Pacific core real estate to that of the U.S. (90% prime core and 10% value-added risk exposure). Previously, our European and Asia-Pacific core real estate assumptions included only prime core exposure.
This year, we combine previously separate assumptions, for European ex-UK and the UK, into our European assumptions for both core and value-added real estate. As with core real estate, in 2022 we have combined two previously separate assumptions, European ex-UK and UK REITs, into a single European REITs assumption.^ Asia-Pacific REITs follow a developed market construct and cover a slightly different geographic exposure from that of Asia-Pacific core real estate.^^ The global composite is built assuming the following weights: roughly 60% U.S., 20% Europe and 20% Asia-Pacific.
A LT E R N AT I V E A S S E T S A S S U M P T I O N S | R E A C H I N G I N V E S T M E N T O B J E C T I V E S W H E N T R A D I T I O N A L A S S E T S M AY N O T B E E N O U G H
3 LONG-TERM CAPITAL MARKET ASSUMPTIONS | J .P. MORGAN ASSET MANAGEMENT
FINANCIAL ALTERNATIVES: AN IMPROVING ALPHA OUTLOOK
We anticipate improving opportunities for alpha generation within private equity and hedge funds, and continuing yield premiums for direct
lending over public markets.
In the case of private equity, digital transformation extending well beyond new economy sectors; changing consumer preferences; and
environmental, social and governance (ESG) mandates draw some parallels to other periods of substantial change that resulted in intervals of
elevated alpha. For hedge funds, as the financial cycle matures, the opportunity for greater dispersion within equity and credit markets
increases, driving the alpha outlook even as the potential portfolio risk-return benefits of allocating to hedge funds likely improve on the margin.
In direct lending, underwriting discipline, declining defaults and steady yield premiums vs. public credit markets bode well for delaying the
expected decline in private to public market return spreads.
No financial strategies outlook is complete without highlighting the wide dispersion in manager performance around our median industry return
projections, especially within the private equity space.
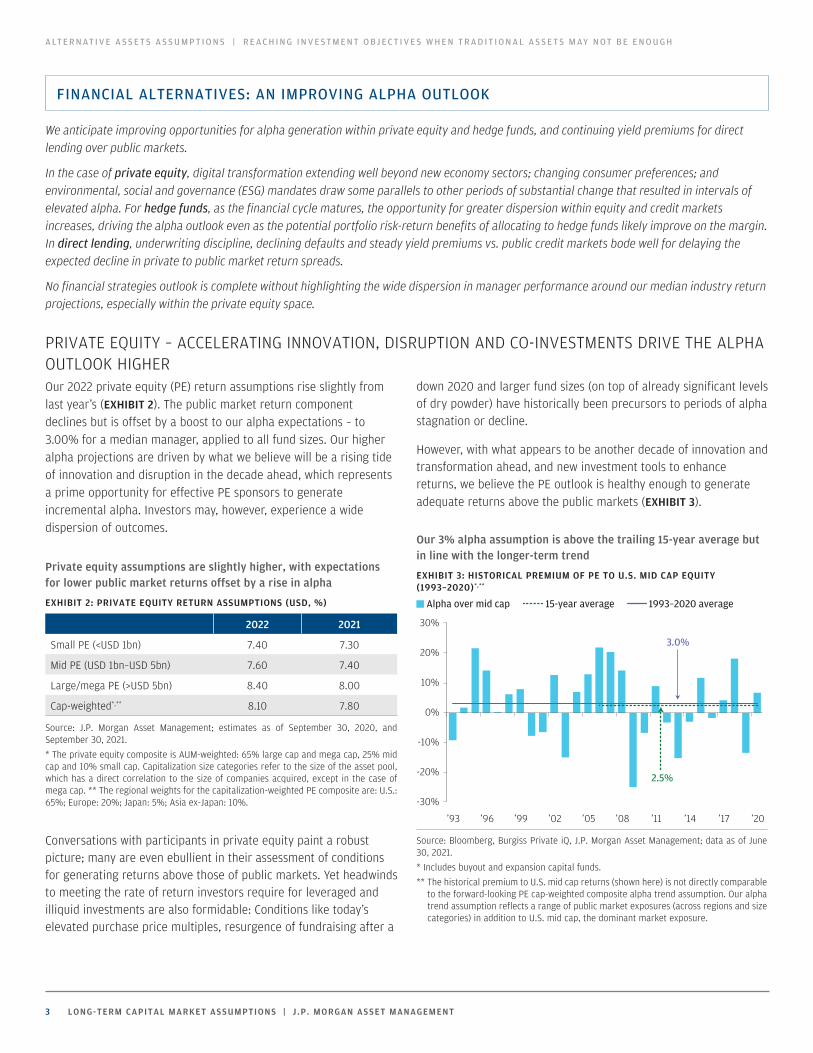
PRIVATE EQUITY – ACCELERATING INNOVATION, DISRUPTION AND CO-INVESTMENTS DRIVE THE ALPHA OUTLOOK HIGHEROur 2022 private equity (PE) return assumptions rise slightly from last year’s (EXHIBIT 2). The public market return component declines but is offset by a boost to our alpha expectations – to 3.00% for a median manager, applied to all fund sizes. Our higher alpha projections are driven by what we believe will be a rising tide of innovation and disruption in the decade ahead, which represents a prime opportunity for effective PE sponsors to generate incremental alpha. Investors may, however, experience a wide dispersion of outcomes.
Private equity assumptions are slightly higher, with expectations for lower public market returns offset by a rise in alpha
EXHIBIT 2: PRIVATE EQUITY RETURN ASSUMPTIONS (USD, %)
2022 2021
Small PE (<USD 1bn) 7.40 7.30
Mid PE (USD 1bn–USD 5bn) 7.60 7.40
Large/mega PE (>USD 5bn) 8.40 8.00
Cap-weighted*,** 8.10 7.80
Source: J.P. Morgan Asset Management; estimates as of September 30, 2020, and September 30, 2021.* The private equity composite is AUM-weighted: 65% large cap and mega cap, 25% mid cap and 10% small cap. Capitalization size categories refer to the size of the asset pool, which has a direct correlation to the size of companies acquired, except in the case of mega cap. ** The regional weights for the capitalization-weighted PE composite are: U.S.: 65%; Europe: 20%; Japan: 5%; Asia ex-Japan: 10%.
Conversations with participants in private equity paint a robust picture; many are even ebullient in their assessment of conditions for generating returns above those of public markets. Yet headwinds to meeting the rate of return investors require for leveraged and illiquid investments are also formidable: Conditions like today’s elevated purchase price multiples, resurgence of fundraising after a
down 2020 and larger fund sizes (on top of already significant levels of dry powder) have historically been precursors to periods of alpha stagnation or decline.
However, with what appears to be another decade of innovation and transformation ahead, and new investment tools to enhance returns, we believe the PE outlook is healthy enough to generate adequate returns above the public markets (EXHIBIT 3).
Our 3% alpha assumption is above the trailing 15-year average but in line with the longer-term trend
EXHIBIT 3: HISTORICAL PREMIUM OF PE TO U.S. MID CAP EQUITY (1993–2020)*,**
-30%
-20%
-10%
0%
10%
20%
30%
’93 ’96 ’99 ’02 ’05 ’08 ’11 ’14 ’17 ’20
Alpha over mid cap 15-year average 1993–2020 average
3.0%
2.5%
Source: Bloomberg, Burgiss Private iQ, J.P. Morgan Asset Management; data as of June 30, 2021.* Includes buyout and expansion capital funds. ** The historical premium to U.S. mid cap returns (shown here) is not directly comparable
to the forward-looking PE cap-weighted composite alpha trend assumption. Our alpha trend assumption reflects a range of public market exposures (across regions and size categories) in addition to U.S. mid cap, the dominant market exposure.
A LT E R N AT I V E A S S E T S A S S U M P T I O N S | R E A C H I N G I N V E S T M E N T O B J E C T I V E S W H E N T R A D I T I O N A L A S S E T S M AY N O T B E E N O U G H

4 LONG-TERM CAPITAL MARKET ASSUMPTIONS | J .P. MORGAN ASSET MANAGEMENT
“All sectors are game on”Our assumptions are premised on increasing innovation and disruption across many sectors, not simply those that are part of the new economy. Just as the private equity industry helped bring about the sectoral transformations of public markets toward technology and communication services over the past 10 to 15 years, we expect it to continue to act as a change agent, helping to enable growth and operational efficiency in many areas of the economy.
While technology and health care generate most of the transformation and growth headlines, PE-driven change is also occurring in sectors such as retail and industrials. A breadth of deal activity and an enthusiastic tone prevail across the economy. In the words of one market participant, while software deals at 20x price-to-EBITDA1 are still easier to get done than industrials at 8x, “All sectors are game on.”
1 Earnings before interest, tax, depreciation and amortization.
Comparing excess returns to the 1990s’ period of change and transformationIn the 1990s, a transformative economic regime coincided with an elevated period of private equity alpha – a concurrence we see as reasonably consistent with the PE industry’s contributions of value-additive capital, flexible operational strategies and long-term focus on corporate value creation. Is a similar situation likely now? Conditions for the private equity industry were materially different then in key ways, including lower levels of dry powder – absolutely and relative to the size of the economy. But there were also similarities, such as elevated valuations in the public and private equity markets.
We constructed a generalized innovation index covering the past 30 years that, while simple in composition, gives a reasonable macro perspective on the magnitude of economic change taking place. Conditions in the 1990s stand out as the closest to what we expect over our 10- to 15-year assumption horizon (EXHIBIT 4).
A likely tide of innovation and disruption ahead, similar in many ways to the 1990s, supports our constructive alpha outlookEXHIBIT 4: THE INNOVATION INDEX
0.0
1.0
2.0
3.0
4.0
5.0
6.0
’90 ’95 ’00 ’05 ’10 ’15 ’20
Index Mean +1 Std. dev. –1 Std. dev.
Index components Weight
Software, intellectual property and processing equipment capex as a % of potential GDP 30%
U.S. FDA drug approvals 30%
Information technology weight in the S&P 500 30%
Pharma and biotech R&D as a % of sales 5%
New U.S. patents (inventions) 5%
Source: U.S. Bureau of Economic Analysis, Congressional Budget Office, Empirical Research Partners, Standard & Poor’s, U.S. Food and Drug Administration, U.S. Patent Office, J.P. Morgan Asset Management; data as of June 30, 2021.
A LT E R N AT I V E A S S E T S A S S U M P T I O N S | R E A C H I N G I N V E S T M E N T O B J E C T I V E S W H E N T R A D I T I O N A L A S S E T S M AY N O T B E E N O U G H

5 LONG-TERM CAPITAL MARKET ASSUMPTIONS | J .P. MORGAN ASSET MANAGEMENT
Alpha potentially rises with geographic diversification, co-investments and subscription LoCsGeographic investment diversification beyond the U.S. – in particular, in Asia ex-Japan – is playing an increasingly important role in driving our PE return assumptions (EXHIBIT 5). Another important driver of our outlook is the growing presence of co-investments in private equity allocations. According to a proprietary J.P. Morgan study, these direct investments have net median internal rates of return (IRRs) that are approximately 4% higher than for primary funds.2 Assuming a 10% weight in PE portfolios, these investments may translate to 0.40% of incremental alpha. Finally, while not embedded in our PE assumptions, the use of subscription lines of credit (LoCs) are increasingly commonplace throughout the industry and may also support returns.
Greater overseas participation in private equity helps drive our 2022 return assumptions
EXHIBIT 5: DRY POWDER BY PRIMARY GEOGRAPHIC FOCUS (USD BN)
0.5%
1.0%
1.5%
2.0%
0
200
400
600
800
1,000
1,200
1,400
1,600
’00 ’02 ’04 ’06 ’08 ’10 ’12 ’14 ’16 ’18 ’20
North America Europe AsiaRest of world % of Global GDP (RHS)
Source: International Monetary Fund, Preqin; data as of December 31, 2020.
2 Michael Cembalest, “Food Fight: An update on private equity performance vs public equity markets,” Eye on the Market, J.P. Morgan Asset Management, June 2021. Direct investment return premiums are partially discounted in our assumptions.
Dispersion of manager returns and execution strategies potentially widen outcomesWith historically wide dispersion in manager performance, an inherent factor in private equity investing has been the ability to identify and access above-average managers. Recently, peer group dispersion has compressed somewhat, but manager selection remains a crucial element in achieving an adequate return premium (EXHIBIT 6).
Manager selection remains critical to realizing the full potential of a private equity allocationEXHIBIT 6: HISTORICAL RETURNS BY MANAGER PERCENTILE RANKING (IRR, USD)*
23.2% 23.7%
26.4%
14.0% 14.5%
17.4%
6.5%8.0%
9.6%
0%
5%
10%
15%
20%
25%
30%
Small PE(<USD 1bn)
Mid PE(USD 1bn–5bn)
Large/mega PE(>USD 5bn)
Top quartile Median Bottom quartile
Source: Burgiss Private iQ, J.P. Morgan Asset Management; data as of June 30, 2021.* Includes buyout and expansion capital funds for vintages 2005–19.
A LT E R N AT I V E A S S E T S A S S U M P T I O N S | R E A C H I N G I N V E S T M E N T O B J E C T I V E S W H E N T R A D I T I O N A L A S S E T S M AY N O T B E E N O U G H

6 LONG-TERM CAPITAL MARKET ASSUMPTIONS | J .P. MORGAN ASSET MANAGEMENT
DIRECT LENDING – DEMONSTRATING RESILIENCE THROUGH THE ECONOMIC CYCLEOur 2022 long-term levered return estimate for direct lending is 6.90%, down from 7.39% in 20213 but still considerably above estimates for public fixed income markets, including U.S. high yield at 3.90%.
The reduction reflects our view that weighted-average coupon spreads are likely to decline as competition within the direct lending space continues to increase, evidenced by new market entrants and sizable capital inflows.4 The lower return assumption also anticipates an increase in the cost of financing as the risk-free base rate rises.
A reassuring response to the pandemicWhile the long-term influence of the COVID-19 crisis on the direct lending market is still playing out, the strategy has proven to be resilient despite short-term dislocations caused by the pandemic. Signs of that resiliency include:
• Unrealized gains across portfolios through 2Q 2021 that have offset and reversed an early 2020 spike in unrealized credit losses5
• A healthy liquidity premium of approximately 130 basis points (bps) over public debt and broadly syndicated loans6
• Stronger credit protections in loan documentation vs. loans originated prior to the pandemic
• A tick downward from 2020 highs in nonaccruals7 as the U.S. economy continues to recover and companies take advantage of lower 2021 borrowing costs to refinance debt and accelerate repayments to direct lenders
3 The LTCMA methodology for direct lending has been enhanced; credit cost and subsequent charges are applied to levered yield. Using this methodology to derive the 2021 levered return assumption yields an 8.19% return, which is approximately 139 basis points (bps) higher than the previously published 2021 levered return assumption of 6.80%. In addition, the 2022 estimate for cost of financing uses the current cost of debt for direct lending managers, adjusted for the expected increase in cash rates between the current three-month LIBOR rate and the future LTCMA cash rate. If the methodology used to derive the 2022 estimate for cost of financing were used in 2021, the 2021 levered return assumption would have been 7.39%, roughly 59bps higher than the previously published 2021 levered return assumption of 6.80%.
4 Over USD 72 billion of new capital was raised in the first half of 2021, in line with the USD 151 billion raised in all of 2020 (PitchBook Global Private Debt Report; data as of June 30, 2021).
5 J.P. Morgan Asset Management, based on S&P industry data, Wells Fargo Business Development Company Index and Cliffwater Direct Lending Index; data as of June 30, 2021.
6 S&P LCD Q2 2021 Middle Market Review; data as of June 30, 2021. References yield spread of institutional middle market loans over large corporate loans.
7 Nonaccruals are typically defined as cash-interest bearing loans with payments 90 days or more overdue.
DEAL FLOW has been strong and is projected to increase as middle market deal volumes rebound from 2020 lows and business development companies (the main drivers of direct lending activity) continue to grow their total assets. Several sectors – notably health care and tech – have demonstrated continued strength and are driving both new loan origination and private equity sponsor deal flow (another key growth engine for direct lending). Private equity sponsors remain optimistic and have resumed fundraising, thus increasing their dry powder for buyout and portfolio company mergers and acquisitions activity. Finally, a significant volume of outstanding loans in the S&P Leveraged Loan Index will mature in 2025, which is likely to drive future refinancing deal flow for upper middle market direct lenders that compete with the broadly syndicated loan market.
PORTFOLIO PERFORMANCE has relied heavily on sector exposure, asset seniority within the capital structure (evidenced by many managers choosing to originate a larger percentage of transactions as senior secured first lien debt) and the ability to select assets with business models that are inherently resilient to the knock-on effects of the COVID-19 virus.
Direct lending has begun to show its potential as a resilient asset class. We expect both assets under management and direct lending deal flow to grow as investors continue to search for yield and as the asset class evolves from a core holding in most institutional portfolios to a core staple of insurance and retail investment portfolios as well.
A LT E R N AT I V E A S S E T S A S S U M P T I O N S | R E A C H I N G I N V E S T M E N T O B J E C T I V E S W H E N T R A D I T I O N A L A S S E T S M AY N O T B E E N O U G H

7 LONG-TERM CAPITAL MARKET ASSUMPTIONS | J .P. MORGAN ASSET MANAGEMENT
HEDGE FUNDS – A STABLE OUTLOOK WITH POTENTIAL FOR ENHANCED ALPHA OPPORTUNITIES Our hedge fund assumptions are raised modestly from last year’s across most major strategy groups. Estimates are bounded by our assumptions for public market beta but strengthened by our outlook for invigorated alpha. Expectations for rising market volatility and inter- and intramarket dispersion, coupled with the increasing role of private and niche strategies, inform our view (EXHIBIT 7).
The market conditions and performance of 2020, while unlikely to recur with great frequency, illustrate the potential for at least periodically strong hedge fund returns. Our multi-asset class risk and return assumptions call for a diversified hedge fund strategy to be additive from a portfolio optimization perspective, if not stellar on an absolute return basis.
An improving environment for alpha boosts our assumptionsEXHIBIT 7: HEDGE FUND RETURN ASSUMPTIONS (USD, %)
STRATEGY 2022 2021
Equity long bias 3.30 3.40
Event-driven 3.20 3.10
Relative value 3.80 3.60
Macro 2.70 2.20
Diversified* 3.60 3.30
Conservative** 3.30 3.10
Source: J.P. Morgan Asset Management; estimates as of September 30, 2020, and September 30, 2021.* The diversified assumption represents the projected return for multi-strategy hedge
funds. ** The conservative assumption represents the projected return for multi-strategy hedge
funds that seek to achieve consistent returns and low overall portfolio volatility by primarily investing in lower volatility strategies such as equity market neutral and fixed income arbitrage.
Short- and long-term contributors to the alpha outlookOur historical trend analysis suggests alpha may have bottomed and is showing signs of a potential upturn (EXHIBIT 8). Additionally, several sets of factors support our expectations for improving alpha conditions over the long term:
BETTER INVESTOR CONDITIONS: We expect further decreases in average fees on both the management and the performance sides, muted flows and a continued reduction in the number of managers competing for still-scarce alpha (EXHIBIT 9).
IMPROVING INVESTMENT CONDITIONS: Our assumptions call for rising interest rates, volatility and dispersion of returns – basic longer-term building blocks of the alpha outlook.
INCREASING ALLOCATION TO PRIVATE OR HYBRID INVESTMENTS: We expect these allocations to continue to increase steadily and, over the course of our evaluation time frame, to exceed the low to mid single-digit allocations estimated last year. We believe private investments have the potential to generate a return profile superior to the base case hedge fund outlook and more in line with our average manager private debt and equity projections of 6.9% and 8.10%, respectively.
Alpha trends appear to have troughedEXHIBIT 8: MODEL-ESTIMATED, ANNUALIZED ALPHA*
-5%
0%
5%
10%
15%
’03 ’05 ’07 ’09 ’11 ’13 ’15 ’17 ’19 ’21
Equity long bias Event-driven Relative value Macro
Source: J.P. Morgan Asset and Wealth Management; estimates as of June 30, 2021.* The annualized alpha estimates are based on the unexplained residuals from a
proprietary monthly multi-factor regression model used to derive the betas that guide our forecasts.
Industry trends are supportive of enhanced alpha generationEXHIBIT 9: HEDGE FUND NET ASSET FLOW AND NUMBER OF FUNDS
0
2,000
4,000
6,000
8,000
10,000
-200
-100
0
100
200
USD
’90 ’95 ’00 ’05 ’10 ’15 ’20
Est. asset flow (USD bn, LHS) Est. # of funds ex-FoF (RHS)
Source: HFR; data as of June 30, 2021.
A LT E R N AT I V E A S S E T S A S S U M P T I O N S | R E A C H I N G I N V E S T M E N T O B J E C T I V E S W H E N T R A D I T I O N A L A S S E T S M AY N O T B E E N O U G H

8 LONG-TERM CAPITAL MARKET ASSUMPTIONS | J .P. MORGAN ASSET MANAGEMENT
In the short term, SPACs, IPOs and other capital markets activities can enhance the environment for alpha generation, but we believe they represent somewhat ephemeral windows of opportunity vs. long-term alpha trends.8 Niche strategies (such as statistical and convertible arbitrage and equity capital markets trading) able to capture these short-term opportunities may be capable of generating returns above the average outlook for relative value and event-driven strategies, for example.
Macro and relative value outlooks marginally improved vs. the average strategyMacro returns are modestly upgraded from last year’s assumption, consistent with our Long-Term Capital Market Assumptions (LTCMA) outlook for a number of return drivers. Those drivers include rising volatility vs. trailing longer-term averages; a rising rate outlook for the next three to seven years, depending on the region and investment tenor; and a continuation of the upward price phase of the commodity cycle for another few years, based on average cycles. Other likely contributors to improved macro returns: an upgrade to the outlook for some cross-asset factor returns, intra-asset opportunities – particularly within foreign exchange – and, to a limited extent, value spreads generally.
The outlooks for many of the core strategies within relative value are lackluster, based on the projections for investment grade and high yield markets. As previously noted, however, the significantly above-public market return outlook for private debt, well captured within the relative value space, adds to our return assessment of the broad strategy class.
8 A special purpose acquisition company (SPAC) is essentially a shell company that is established to raise capital in an initial public offering (IPO) with the purpose of using the proceeds to acquire an existing company sometime in the next two years. Being acquired by a SPAC is a way for a private company to go public and access liquidity without going through the more traditional IPO process.
Hedge funds in a portfolio context and the importance of dispersion in determining an allocation On an absolute basis, the diversified strategy return assumption of 3.60% compares favorably with the outlooks for both core global fixed income and U.S. fixed income, and is equivalent to that of a 55/45 global stock-bond mix or a 50/50 U.S. mix. More importantly, our return, volatility and correlation projections, used within an optimization framework, suggest hedge funds can play an additive role in full spectrum investing.9 This potential may be materially augmented when hedge fund strategies can be executed above the median returns modeled in our assumptions (EXHIBIT 10).
Manager selection is vital to achieving the potential benefits of a hedge fund allocationEXHIBIT 10: DISPERSION OF ANNUALIZED MANAGER RETURNS (%), JULY 2016 TO JUNE 2021*
15.5%
10.3%
8.1%
5.6%
9.2%7.4%
5.3%
2.3%
5.2% 4.6%3.1%
-0.4%
-4%
0%
4%
8%
12%
16%
20%
Equity long bias Event-driven Relative value Macro
Top quartile Median Bottom quartile
Source: HFR, J.P. Morgan Asset Management; data as of June 30, 2021.* Returns adjusted for survivorship bias.
9 Jared Gross, Paul Kennedy and Grace Koo, “Portfolio Implications: Portfolio construction – Moving toward a new architecture,” 2022 Long-Term Capital Market Assumptions, J.P. Morgan Asset Management, November 2021.
A LT E R N AT I V E A S S E T S A S S U M P T I O N S | R E A C H I N G I N V E S T M E N T O B J E C T I V E S W H E N T R A D I T I O N A L A S S E T S M AY N O T B E E N O U G H

9 LONG-TERM CAPITAL MARKET ASSUMPTIONS | J .P. MORGAN ASSET MANAGEMENT
REAL ASSETS: ATTRACTIVE INCOME-DRIVEN RETURNS IN A CHALLENGING PUBLIC MARKET ENVIRONMENT
Our long-term assumptions for real asset returns have declined slightly from last year’s assumptions, as the economic recovery has advanced to
a more mature stage. However, our risk-adjusted return estimates remain attractive in the context of the outlook for most traditional assets.
Relative to other asset classes, core real assets have exhibited resilience during the pandemic, with many sectors generating stable income and
downside protection through their exposure to long-dated contractual cash flows. In the post-pandemic recovery, we expect continued resilience
from tech and COVID-19-enabled sectors such as industrial, logistics, single/multi-family and residential within real estate; renewables and
utilities within infrastructure; and energy logistics and maritime within transport. The recovery of sectors negatively impacted by the pandemic,
such as retail and aircraft, may find renewed support as the reopening advances and the movement of people and goods picks up.
Real assets are well positioned for a potential rise in inflation, since many sectors have implicit or explicit inflation linkage characteristics. Other
attributes of real assets that may support their performance in an inflationary environment include an inherently slow supply response, accretive
leverage in a low interest rate environment, the potential for rising replacement costs and improved rental/lease rates.
Finally, we expect ESG considerations to become an increasingly integral component of asset management, creating opportunities for value
improvement in real assets through sustainable investments.
GLOBAL REAL ESTATE – RETURNS DECLINE MODESTLY AS THE CYCLE PROCEEDS; SECTOR DISPERSION CONTINUESOur 2022 assumptions for core and value-added real estate decline slightly across regions, given flat or lower starting yields, partially offset by stronger net cash flows (EXHIBIT 11). We expect continued divergence in sector performance in the near to medium term. As noted below, we have implemented a few changes to our methodology this year to improve the consistency of core asset definitions across geographies.
Our 2022 assumptions for core and value-added real estate are lowered slightly across regionsEXHIBIT 11: REAL ESTATE RETURN ASSUMPTIONS (LOCAL CURRENCY, %)
REAL ESTATE – DIRECT 2022 2021
U.S. core* 5.80 5.90
U.S. value-added 7.70 8.10
European core**,† 4.80 5.00
European value-added† 6.80 7.70
Asia-Pacific core** 6.50 6.60
Source: J.P. Morgan Asset Management; estimates as of September 30, 2020, and September 30, 2021.* U.S. core real estate in our assumptions comprises 90% prime high quality real estate
assets and 10% value-added development assets. This exposure is consistent with the composition of the benchmark NFI-ODCE Index.
** Our 2022 assumptions are not directly comparable to our 2021 assumptions due to a change in methodology: For our 2022 estimates, to improve consistency across regions, we match the composition of European and Asia-Pacific core real estate to that of the U.S. (90% prime core and 10% value-added risk exposure). Previously, our European and Asia-Pacific core real estate assumptions included only prime core exposure.
† This year, we combine previously separate assumptions, for European ex-UK and the UK, into our European assumptions for both core and value-added real estate.
U.S. real estateOur return assumption for U.S. core real estate declines slightly, to 5.80% from 5.90% last year, reflecting a higher starting point due to a reversal of the dislocation at the height of the COVID-19 pandemic. The net operating income (NOI) yield10 is lower vs. last year, given the tightening of lending rate spreads and improved liquidity for borrowers seeking loans. However, the lower yield is partially offset by expected faster net cash flow growth over the next 10 to 15 years, driven by underlying supply shortages in industrial and residential real estate, a shift in sector composition (toward faster-growing sectors) and higher inflation expectations.
Our assumption for value-added real estate also declines slightly vs. last year. Value-added real estate’s spreads over core have narrowed moderately from their levels immediately after the sharp pandemic recession in 2020.
We expect tenant demand for warehouse space to remain elevated in the coming years, as tenants’ extraordinary and growing space requirements have been accelerated by the surge in e-commerce. The U.S. residential market is also experiencing significant supply shortages, for both sale and rental properties, that are not expected to be mitigated by new construction for years.
10 Net operating income yield refers to estimated net operating income/asset value at the start of our 10– to 15–year projection period.
A LT E R N AT I V E A S S E T S A S S U M P T I O N S | R E A C H I N G I N V E S T M E N T O B J E C T I V E S W H E N T R A D I T I O N A L A S S E T S M AY N O T B E E N O U G H

10 LONG-TERM CAPITAL MARKET ASSUMPTIONS | J .P. MORGAN ASSET MANAGEMENT
Retail and office sectors present mixed pictures: We continue to see lower quality enclosed malls facing existential problems – 25% of all malls could potentially be shuttered in the next 10 to 15 years. The persistence of work from home will likely be a chronic headwind for offices, joining other chronic issues, such as employee densification to save space and a decline in leasing by traditional tenants, including law and financial firms. However, new economy tenants, such as tech companies and creative industries, are stepping in, continuing to take up a larger share of leases than they have historically. In sum, we expect the office sector to underperform industrial and residential but to outperform retail.
Weightings in the benchmark NFI-ODCE Index have been shifting toward sectors with faster NOI growth – that is, value-added sectors such as the increasingly diverse logistics industry and lab space. This expected shift in sector mix is a tailwind for the return outlook. Over the decades, we have also seen capital expenditures rise as a share of NOI (EXHIBIT 12), a trend we expect to continue, suggesting more risk capital in the benchmark and therefore higher expected returns.
Core real estate’s benchmark index composition is shifting toward riskier capital, supported by two decades of rising capital expenditureEXHIBIT 12: EVIDENCE OF RISING VALUE-ADDED SECTORS IN NFI-ODCE
0%
10%
20%
30%
40%
50%
60%
’97 ’00 ’03 ’06 ’09 ’12 ’15 ’18 ’21
Cape
x sh
are
of N
OI in
ODC
E
Source: NCREIF, J.P. Morgan Asset Management; data as of June 30, 2021.
European real estate Our 2022 European core real estate return assumption declines slightly from last year. While we make only a smaller downward adjustment to exit yield,11 it is offset by a lower benefit from leverage (as borrowing costs have risen since our 2021 projections)
11 Exit yield is measured as the net operating income at the end of the projection period (10–15 years) divided by the sale price.
and by lower starting yields vs. last year. Value-added properties’ risk premium over core properties shrinks slightly as the European real estate market moves further into the cycle.
European real estate returns continue to see dispersion among sectors (EXHIBIT 13). Retail’s weakness has persisted with the growth of e-commerce, leading it to underperform other real estate sectors. Ongoing strength in the industrial and logistics sectors, amid strong demand for warehouse space, has led to higher returns in those sectors. This polarization in returns – industrial outperformance vs. retail weakness – became more pronounced during the pandemic; however, we anticipate return dispersion among sectors to narrow toward the end of our forecast period.
While we anticipate return dispersion among sectors narrowing, the growth of e-commerce should continue to hurt retail in the near term, particularly in continental Europe. Meanwhile, retail properties’ accelerated obsolescence will likely undermine rental and capital values. The industrial sector’s outlook is more favorable: While industrial yields have fallen materially, tightening supply should support rental income growth and property appreciation.
In contrast, we expect long-term office and residential returns to stay close to the European all-sector historical average. While the office sector will likely feel the impact of the shift to a hybrid working model, that shift should disproportionately affect poorer quality assets in marginal locations. We expect strong investor demand for residential assets largely because they provide portfolio diversification; however, returns will likely be constrained by low yields and policy-based restrictions on rental income growth.
Return dispersion by sector in European real estate is unprecedented EXHIBIT 13: EUROPEAN REAL ESTATE QUARTERLY ANNUALIZED RETURNS BY SECTOR, 2008–21
Min - max range
-20%
-10%
0%
10%
20%
30%
’08 ’09 ’10 ’11 ’12 ’13 ’14 ’15 ’16 ’17 ’18 ’19 ’20 ’21
O�ce Retail Industrial Residential
Source: MSCI, J.P. Morgan Asset Management; data as of June 30, 2021.
A LT E R N AT I V E A S S E T S A S S U M P T I O N S | R E A C H I N G I N V E S T M E N T O B J E C T I V E S W H E N T R A D I T I O N A L A S S E T S M AY N O T B E E N O U G H

11 LONG-TERM CAPITAL MARKET ASSUMPTIONS | J .P. MORGAN ASSET MANAGEMENT
Asia-Pacific real estateOur Asia-Pacific core real estate return assumption decreases slightly from last year but again outpaces the U.S. and Europe. Through much of 2021, Asia-Pacific core real estate yields were largely stable year-over-year, with the exception of yield compression in the industrial sector and, in Japan, in multi-family residential. Over our forecast period, we expect strengthening cash flow growth as Asia-Pacific office and retail rents begin to rebound. We anticipate compression of exit yields due to the secular rise in demand from investors willing to invest at a lower risk premium, despite real estate’s illiquidity as an asset class. Investor confidence was resilient as the pandemic stretched into a second year: Transaction volumes have decreased by only about 7% since our last edition (EXHIBIT 14).
Confidence among Asia-Pacific real estate investors has been resilient into the pandemic’s second yearEXHIBIT 14: ASIA-PACIFIC REAL ESTATE TRANSACTION VOLUME
-20
20
60
100
140
180
0%
20%
40%
60%
80%
100%
’11 ’12 ’13 ’14 ’15 ’16 ’17 ’18 ’19 ’20 ’21
USD (billions)Prop
ortio
n
Industrial O�ce Retail Apartment Total (RHS)
Source: Real Capital Analytics; data as of July 31, 2021. The 2021 value is shown as an annualized estimate. Asia-Pacific transaction volumes comprise office, industrial (manufacturing, R&D, refrigerated and distribution, tech/telecom/data), retail and mid and high rise residential apartments valued at over USD 10 million.
Dispersion among sectors continues. We anticipate attractive risk-adjusted returns for the industrial sector across the region as it benefits from ongoing migration into gateway cities,12 and strength in Japan’s multi-family residential sector. We expect both will be important contributors to Asia-Pacific real estate returns. Meanwhile, headwinds persist in retail.
12 Gateway cities are urban metro areas that serve as economic and industrial hubs for a state, region or country.
REAL ESTATE INVESTMENT TRUSTS (REITS) – PRICED AT A SLIGHT PREMIUM ACROSS REGIONS
Our global REITs return projection is reduced from last year, with reductions across all regions (EXHIBIT 15). The decline reflects less upside potential following the strong recovery in REITs since the onset of the pandemic. With this year’s assumptions, we expand our universe to account for all listed real estate companies, not only REITs, as not all countries have adopted REITs vehicles.
REITs are now priced at a premium, after trading at a discount to underlying real estate last year. During the pandemic, REITs exhibited extreme price volatility. The initial and significant REITs market drawdown in the first quarter of 2020 was followed by a swift recovery; this contrasts with much less dramatic swings in private market valuations. As a result, REITs are generally slightly to modestly expensive relative to the underlying real estate.
Our estimate for U.S. REITs takes into account better cash flow growth for extended sectors (e.g., towers and data centers) that are not captured in our private core real estate underlying returns, the starting point for our REITs projections. European and Asia-Pacific REITs are relatively more expensive than last year, in part reflecting improved growth dynamics, but we expect at least a partial reversion to long-term average valuations. Across markets, REITs returns should continue to benefit from accretive leverage over the near term. Overall, the regional aggregation masks wide sectoral dispersion, with logistics/industrial and other extended sectors more highly priced than more traditional assets, such as offices and retail properties.
Assumptions reflect less upside potential vs. prior year estimates, given a strong REITs reboundEXHIBIT 15: REITS RETURN ASSUMPTIONS (LOCAL CURRENCY, %)
REITS 2022 2021
U.S. 5.70 6.50
European* 5.10 5.90
Asia-Pacific** 5.00 6.40
Global† 5.40 6.40
Source: J.P. Morgan Asset Management; estimates as of September 30, 2020, and September 30, 2021.* As with core real estate, this year we have combined two previously separate
assumptions, European ex-UK and UK REITs, into a single European REITs assumption.** Asia-Pacific REITs follow a developed market construct and cover a slightly different
geographic exposure from that of Asia-Pacific core real estate.† The global composite is built assuming the following weights: roughly 60% U.S., 20%
Europe and 20% Asia-Pacific.
A LT E R N AT I V E A S S E T S A S S U M P T I O N S | R E A C H I N G I N V E S T M E N T O B J E C T I V E S W H E N T R A D I T I O N A L A S S E T S M AY N O T B E E N O U G H

12 LONG-TERM CAPITAL MARKET ASSUMPTIONS | J .P. MORGAN ASSET MANAGEMENT
GLOBAL CORE INFRASTRUCTURE – STEADY RETURNS AND STRONG INVESTOR INFLOWSOur 2022 global core infrastructure long-term return projection is 6.10%, matching last year’s estimate.
Reflecting the essential nature of the services core infrastructure provides, we expect continued relatively stable returns over the next decade, with a high proportion of returns derived from operating yield. Operating yield – the percentage of return coming from income – has declined marginally vs. last year.13 The decline in this estimate reflects price appreciation in the asset class from COVID-19 lows and continued strong investor demand for the high current yield and diversification benefits these assets can potentially provide. Given our expectations for stronger GDP growth, inflation and supportive fiscal policy in the U.S. and Europe, we look for improved cash flow growth and enhanced valuations. However, while we have raised the cash flow growth rate component of our return estimate relative to last year, we have lowered our expectations for annual appreciation over the next decade to reflect that some of this increase in value has already been realized.
We expect ample opportunities to invest in this space, given the historical underinvestment in infrastructure globally (EXHIBIT 16). The ongoing transition to a low carbon economy has created a pressing need for investments to drive renewable energy adoption and continued provisioning of essential services like water and power. The ability of infrastructure assets to directly contribute to ESG efforts also informs our positive outlook for the asset class.
13 Operating yield refers to estimated operating income/asset value at the start of our 10- to 15-year projection period.
Manager challenges as the asset class growsOver the long run, among the greatest challenges managers are likely to face – as competition for core assets grows – will be to maintain underwriting discipline and avoid having the definition of “core infrastructure” expand to encompass investments the category was never intended to include. Those that can deploy capital without taking on undue risk or making aggressive growth assumptions are more likely to deliver attractive cash yields and uncorrelated returns, resulting in strong multiples on invested capital (MOIC).14 Although the performance of the overall asset class is expected to be stable, specific or idiosyncratic operational, regulatory and/or counterparty risks can exist at the asset level. Prudent management with active oversight of the drivers of return and risk is essential to achieving the expected performance.
14 Multiple on invested capital is an investment return metric that states an investment’s current value as a multiple of the amount of the initial investment, regardless of the length of the investment period.
Investor demand remains strong, and investment need far exceeds current deal volumeEXHIBIT 16: TOTAL INFRASTRUCTURE DEAL VOLUME, INVESTMENT NEED AND AUM
Total deal volume Total infrastructure investment need Total private infrastructure fund AUM
0
500
1,000
1,500
2,000
2,500
3,000
3,500
2007 2008 2009 2010 2011 2012 2013 2014 2015 2016 2017 2018 2019 2020 2021
USD
(bill
ions
)
Source: OECD, Preqin, J.P. Morgan Asset Management; data as of September 30, 2021. Infrastructure deal data includes both primary and secondary deals.
A LT E R N AT I V E A S S E T S A S S U M P T I O N S | R E A C H I N G I N V E S T M E N T O B J E C T I V E S W H E N T R A D I T I O N A L A S S E T S M AY N O T B E E N O U G H

13 LONG-TERM CAPITAL MARKET ASSUMPTIONS | J .P. MORGAN ASSET MANAGEMENT
GLOBAL CORE TRANSPORT – AN INCOME STORY SUPPORTED BY GROWTH TAILWINDSOur 2022 long-term return projection for global transport is 7.40%, down from 7.60% last year. Increased operating yields boost the outlook while rising maintenance and depreciation costs detract. Overall, the sector is supported by stable income expectations with continued growth.
In core transportation, long-term lease rates have risen, most notably in the maritime sector, where COVID-19 disruptions, port congestion and a low orderbook for new vessels have contributed to favorable supply/demand dynamics. Although meaningful in the near term, these dynamics will moderate over time. Tempering our estimates, we see an increased focus on de-carbonization leading to higher maintenance costs and shorter useful lives of assets as new emissions regulations come into play.
Essential to and driven by global growthThe essential nature of the asset class informs our outlook. The demand for assets such as ships, aircraft, energy logistics vessels, railcars and vehicles is reinforced by long-term secular trends in economic growth, global trade and the transition to renewable energy. Whether they are moving consumer goods, commodities or passengers, transportation assets are critical components of global trade and consumption. These assets are vital to a thriving global supply chain and integral to a sustainable model of economic growth. In addition, the transportation sector will continue to evolve and adapt as the world’s economy transitions to a more sustainable model of energy efficiency.
While the impact of COVID-19 has varied across transportation sectors, a positive long-term growth outlook appears to remain intact. Maritime and energy logistics have been relatively resilient, with global tonne-mile trade down only 1.6% in 2020 and growth expected to strengthen through 2021 as well as in subsequent years (EXHIBIT 17A). The pandemic created headwinds in the aviation sector as passenger volumes declined precipitously. These challenges persist in long-haul international markets but have begun to wane in domestic markets as passenger volumes exhibit signs of recovery (EXHIBIT 17B).
There is a fundamental, expanding need to move people, products and commodities
EXHIBIT 17A: TOTAL SEABORNE MARITIME & ENERGY LOGISTICS TRADE OUTLOOK EXHIBIT 17B: TOTAL AIR TRAFFIC GROWTH OUTLOOK
Maritime (LHS) Energy logistics (RHS)
0
500
1,000
1,500
2,000
2,500
3,000
3,500
0
20,000
40,000
60,000
80,000
2010 2014 2018 2022 2026
Projections
2030
Est.
bn to
nne-
mile
s Est. bn tonne-miles
Passenger numbers (in millions)
0
1,000
2,000
3,000
4,000
5,000
6,000
1980 1990 2000 2010 2020 2030
2008GFC
COVID-19pandemic
9/11 andSARS
Projections
Source: Clarkson Research, MSI, J.P. Morgan Asset Management; data as of September 30, 2021.
Source: World Bank, IATA, J.P. Morgan Asset Management; data as of September 30, 2021.
A LT E R N AT I V E A S S E T S A S S U M P T I O N S | R E A C H I N G I N V E S T M E N T O B J E C T I V E S W H E N T R A D I T I O N A L A S S E T S M AY N O T B E E N O U G H

14 LONG-TERM CAPITAL MARKET ASSUMPTIONS | J .P. MORGAN ASSET MANAGEMENT
COMMODITIES – A STRONG IF NOT SUPER CYCLE WITH A GROWING CONSENSUS AROUND ESG CONSIDERATIONSOur long-term broad-basket commodity assumption is increased to 2.60%, up from 2.30% last year and marginally above our estimate for U.S. inflation.
The increase is despite a higher starting point for this year’s estimate; the Bloomberg Commodity Total Return Index has seen a roughly 42% rise in the year since September 30, 2020. We see two impactful forces supporting returns through the next few years of this already advanced commodity cycle:
• Consistent with decreasing capital expenditures in the energy and mining sectors as well as the supply constraint estimate embedded in our Commodity Event Index (EXHIBIT 18), we anticipate a strong through-the-cycle return, above the average for post-1982 cycles.
• We believe a growing consensus around the importance of ESG considerations and climate policies will both constrain supply in the front half and eventually reduce demand in the back half of our evaluation time frame.
Our Commodity Event Index attempts to capture producers’ supply constraints and sentimentEXHIBIT 18: THE COMMODITY EVENT INDEX
2022 index Mean
Mean
+1 SD
-1 SD
+2 SD
-2 SD
+3 SD
-3 SD
1.0
2.0
3.0
4.0
5.0
1985 1990 1995 2000 2005 2010 2015 2020
Inde
x va
lue
Tightening supply constraints
Loosening supply constraints
INDEX COMPONENT COMPONENT WEIGHT (%)
Credit ratings 11.1
Age of capital stock 11.1
Financial leverage 11.1
Volume of bankruptcies, takeovers, debt-for-equity swaps
11.1
Capital expenditure to sales 18.5
Oil rig count 18.5
CEO turnover 18.5
Source: Baker Hughes, Bloomberg, FactSet, U.S. Bureau of Economic Analysis, J.P. Morgan Asset Management; data as of June 30, 2021. Components may not sum to 100% due to rounding.
Capex starvation is likely to constrain commodity supplyInvestors are increasingly unwilling to provide expansion capital to the energy and mining sectors, their confidence shaken by subpar corporate governance and financial performance. But access to capital markets is just one of several forces constraining supply and shaping the commodity cycle. Legal action on carbon emissions, as in the case of Shell; shareholder proposals related to climate change, as in the case of ExxonMobil; or corporations’ own assessments of the long-term sustainability of business models, as in the case of Ørsted,15 will weigh on near-term supply even as demand likely continues to grow over the next several years. This downward pressure on production is likely to support oil prices in the near term, as evidenced by the recent rise in energy prices. Beyond the next five years, however, we would expect reductions in demand to match or exceed reductions in supply; that is likely to depress prices. This reduced demand may be driven by increases in the efficiency of renewable energy sources and more aggressive environmental policies.
Environmental uncertaintyThere is a wide range of paths that oil demand could take over the next 10 to 15 years, given ambitious emission reduction targets but lackluster progress thus far. Ahead of the 26th U.N. Climate Change Conference of the Parties (COP26) in Glasgow in November 2021, countries representing over 50% of global GDP announced ambitious environmental targets consistent with limiting global warming to 1.5ºC above pre-industrial levels. However, most of those countries are not even on track to meet their less ambitious 2ºC target, formulated under the Paris Agreement. Evaluating the impact on oil demand of environmental policies and their enforcement may therefore be best served by modeling outcomes under a range of scenarios rather than relying on a specific single-point estimate (EXHIBIT 19).
15 In May 2021, the District Court in the Hague delivered its ruling in the climate change case filed against Royal Dutch Shell plc (“Shell”) by Milieudefensie (Friends of the Earth Netherlands), other nongovernmental organizations and a group of private individuals; the court ruled that Shell must reduce the carbon emissions of Shell group operations and energy-carrying products sold by 45% (net) by the end of 2030 compared with its emissions in 2019. In June 2021, an environmentally driven investment firm engaged in a proxy war to obtain seats on the board of ExxonMobil and steer the company’s long-term strategy away from fossil fuels. In 2012, Denmark’s biggest energy company, Danish Oil and Natural Gas, slid into financial crisis as the price of natural gas plunged and its credit rating was downgraded; the board hired a new CEO, who renamed the company Ørsted and led a transformation that shifted the company’s core business from fossil fuels to green energy.
A LT E R N AT I V E A S S E T S A S S U M P T I O N S | R E A C H I N G I N V E S T M E N T O B J E C T I V E S W H E N T R A D I T I O N A L A S S E T S M AY N O T B E E N O U G H

15 LONG-TERM CAPITAL MARKET ASSUMPTIONS | J .P. MORGAN ASSET MANAGEMENT
Estimating the range of outcomes in light of the Paris AgreementEXHIBIT 19: OIL DEMAND IN MILLION BARRELS PER DAY UNDER DIFFERENT STYLIZED SCENARIOS
Trend(extrapolated)
Our baselinescenario
Aggressive scenario(sensitivity check)
0
20
40
60
80
100
120
140
2000 2005 2010 2015 2020 2025 2030 2035
Source: J.P. Morgan Asset Management; data as of June 30, 2021.Our analysis looks at oil demand increasing along an extrapolated historical trend line (Trend) and two additional scenarios: adherence to environmental targets consistent with limiting global warming to 2ºC above pre-industrial levels (Baseline) and 1.5ºC above pre-industrial levels (Aggressive), assuming a meaningful difference in demand from 2026 forward in both cases. Most forecasts from international organizations and the private sector, even when assuming a faster pace of energy transition, still project oil demand in 2035–40 will not be that different from today’s.
GOLDOur 2022 gold assumption is 3.00%. Continued central bank accumulation and high per capita gold consumption in India and China drive the gold premium to broad commodities. Our assumption for this premium, however, is reduced to 40bps from 50bps last year to reflect cryptocurrencies’ modest structural siphoning of demand away from gold.
A LT E R N AT I V E A S S E T S A S S U M P T I O N S | R E A C H I N G I N V E S T M E N T O B J E C T I V E S W H E N T R A D I T I O N A L A S S E T S M AY N O T B E E N O U G H

NOT FOR RETAIL DISTRIBUTION: This communication has been prepared exclusively for institutional, wholesale, professional clients and qualified investors only, as defined by local laws and regulations.
JPMAM Long-Term Capital Market Assumptions: Given the complex risk-reward trade-offs involved, we advise clients to rely on judgment as well as quantitative optimization approaches in setting strategic allocations. Please note that all information shown is based on qualitative analysis. Exclusive reliance on the above is not advised. This information is not intended as a recommendation to invest in any particular asset class or strategy or as a promise of future performance. Note that these asset class and strategy assumptions are passive only – they do not consider the impact of active management. References to future returns are not promises or even estimates of actual returns a client portfolio may achieve. Assumptions, opinions and estimates are provided for illustrative purposes only. They should not be relied upon as recommendations to buy or sell securities. Forecasts of financial market trends that are based on current market conditions constitute our judgment and are subject to change without notice. We believe the information provided here is reliable, but do not warrant its accuracy or completeness. This material has been prepared for information purposes only and is not intended to provide, and should not be relied on for, accounting, legal or tax advice. The outputs of the assumptions are provided for illustration/discussion purposes only and are subject to significant limitations. “Expected” or “alpha” return estimates are subject to uncertainty and error. For example, changes in the historical data from which it is estimated will result in different implications for asset class returns. Expected returns for each asset class are conditional on an economic scenario; actual returns in the event the scenario comes to pass could be higher or lower, as they have been in the past, so an investor should not expect to achieve returns similar to the outputs shown herein. References to future returns for either asset allocation strategies or asset classes are not promises of actual returns a client portfolio may achieve. Because of the inherent limitations of all models, potential investors should not rely exclusively on the model when making a decision. The model cannot account for the impact that economic, market, and other factors may have on the implementation and ongoing management of an actual investment portfolio. Unlike actual portfolio outcomes, the model outcomes do not reflect actual trading, liquidity constraints, fees, expenses, taxes and other factors that could impact the future returns. The model assumptions are passive only – they do not consider the impact of active management. A manager’s ability to achieve similar outcomes is subject to risk factors over which the manager may have no or limited control. The views contained herein are not to be taken as advice or a recommendation to buy or sell any investment in any jurisdiction, nor is it a commitment from J.P. Morgan Asset Management or any of its subsidiaries to participate in any of the transactions mentioned herein. Any forecasts, figures, opinions or investment techniques and strategies set out are for information purposes only, based on certain assumptions and current market conditions and are subject to change without prior notice. All information presented herein is considered to be accurate at the time of production. This material does not contain sufficient information to support an investment decision and it should not be relied upon by you in evaluating the merits of investing in any securities or products. In addition, users should make an independent assessment of the legal, regulatory, tax, credit and accounting implications and determine, together with their own financial professional, if any investment mentioned herein is believed to be appropriate to their personal goals. Investors should ensure that they obtain all available relevant information before making any investment. It should be noted that investment involves risks, the value of investments and the income from them may fluctuate in accordance with market conditions and taxation agreements and investors may not get back the full amount invested. Both past performance and yield are not a reliable indicator of current and future results.
J.P. Morgan Asset Management is the brand for the asset management business of JPMorgan Chase & Co. and its affiliates worldwide.
To the extent permitted by applicable law, we may record telephone calls and monitor electronic communications to comply with our legal and regulatory obligations and internal policies. Personal data will be collected, stored and processed by J.P. Morgan Asset Management in accordance with our privacy policies at https://am.jpmorgan.com/global/privacy.
This communication is issued by the following entities:
In the United States, by J.P. Morgan Investment Management Inc. or J.P. Morgan Alternative Asset Management, Inc., both regulated by the Securities and Exchange Commission; in Latin America, for intended recipients’ use only, by local J.P. Morgan entities, as the case may be. In Canada, for institutional clients’ use only, by JPMorgan Asset Management (Canada) Inc., which is a registered Portfolio Manager and Exempt Market Dealer in all Canadian provinces and territories except the Yukon and is also registered as an Investment Fund Manager in British Columbia, Ontario, Quebec and Newfoundland and Labrador. In the United Kingdom, by JPMorgan Asset Management (UK) Limited, which is authorized and regulated by the Financial Conduct Authority; in other European jurisdictions, by JPMorgan Asset Management (Europe) S.à r.l. In Asia Pacific (“APAC”), by the following issuing entities and in the respective jurisdictions in which they are primarily regulated: JPMorgan Asset Management (Asia Pacific) Limited, or JPMorgan Funds (Asia) Limited, or JPMorgan Asset Management Real Assets (Asia) Limited, each of which is regulated by the Securities and Futures Commission of Hong Kong; JPMorgan Asset Management (Singapore) Limited (Co. Reg. No. 197601586K), this advertisement or publication has not been reviewed by the Monetary Authority of Singapore; JPMorgan Asset Management (Taiwan) Limited; JPMorgan Asset Management (Japan) Limited, which is a member of the Investment Trusts Association, Japan, the Japan Investment Advisers Association, Type II Financial Instruments Firms Association and the Japan Securities Dealers Association and is regulated by the Financial Services Agency (registration number “Kanto Local Finance Bureau (Financial Instruments Firm) No. 330”); in Australia, to wholesale clients only as defined in section 761A and 761G of the Corporations Act 2001 (Commonwealth), by JPMorgan Asset Management (Australia) Limited (ABN 55143832080) (AFSL 376919).
For U.S. only: If you are a person with a disability and need additional support in viewing the material, please call us at 1-800-343-1113 for assistance.
Copyright 2021 JPMorgan Chase & Co. All rights reserved.
LV–JPM53234 | 11/21 | US | 0903c02a82724bb6
PORTFOLIO INSIGHTS
FOR INSTITUTIONAL/WHOLESALE/PROFESSIONAL CLIENTS AND QUALIFIED INVESTORS ONLY – NOT FOR RETAIL USE OR DISTRIBUTION