altered expression of k13 disrupts dna replication and
TRANSCRIPT
RESEARCH ARTICLE Open Access
Altered expression of K13 disrupts DNAreplication and repair in PlasmodiumfalciparumJustin Gibbons1,2, Katrina A. Button-Simons3, Swamy R. Adapa2, Suzanne Li2, Maxwell Pietsch4, Min Zhang2,Xiangyun Liao2, John H. Adams2, Michael T. Ferdig3 and Rays H. Y. Jiang2*
Abstract
Background: Plasmodium falciparum exhibits resistance to the artemisinin component of the frontline antimalarialtreatment Artemisinin-based Combination Therapy in South East Asia. Millions of lives will be at risk if artemisininresistance (ART-R) spreads to Africa. Single non-synonymous mutations in the propeller region of PF3D7_1343700,“K13”are implicated in resistance. In this work, we use transcriptional profiling to characterize a laboratory-generated k13insertional mutant previously demonstrated to have increased sensitivity to artemisinins to explore the functional roleof k13.
Results: A set of RNA-seq and microarray experiments confirmed that the expression profile of k13 is specificallyaltered during the early ring and early trophozoite stages of the mutant intraerythrocytic development cycle. Thedown-regulation of k13 transcripts in this mutant during the early ring stage is associated with a transcriptomeadvance towards a more trophozoite-like state. To discover the specific downstream effect of k13 dysregulation,we developed a new computational method to search for differential gene expression while accounting for thetemporal sequence of transcription. We found that the strongest biological signature of the transcriptome shift isan up-regulation of DNA replication and repair genes during the early ring developmental stage and a down-regulationof DNA replication and repair genes during the early trophozoite stage; by contrast, the expressions of housekeepinggenes are unchanged. This effect, due to k13 dysregulation, is antagonistic, such that k13 levels are negatively correlatedwith DNA replication and repair gene expression.
Conclusion: Our results support a role for k13 as a stress response regulator consistent with the hypothesisthat artemisinins mode of action is oxidative stress and k13 as a functional homolog of Keap1 which in humans regulatesDNA replication and repair genes in response to oxidative stress.
Keywords: Malaria, Artemisinin, K13, Drug-resistance
BackgroundThe World Health Organization estimates that malariakilled 429,000 people, mostly children under the age of 5in 2015 [1]. Prior to Artemisinin-based combination ther-apy (ACT) becoming the World Health Organizationrecommend treatment for uncomplicated Plasmodiumfalciparum infection, approximately 1,000,000 people werebeing killed by malaria annually [2]. It has been estimated
that widespread ACT resistance would lead to morethan 116,000 additional malaria deaths each year [3].ACT resistant P. falciparum is already present inSouth East Asia with the ACT dihydroartemisinin-piperaquine having treatment failure rates as high as46% in the Pursat province of Cambodia [4]. Alarm-ingly, resistant strains are reported to have spread toThailand, Laos and Vietnam [5, 6].Multiple lines of evidence suggest that the resistance
mechanism involves pausing parasite development in thering stage, which is less susceptible to artemisinin, inresponse to drug treatment [7–9]. Consistent with this
* Correspondence: [email protected] for Global Health and Infectious Diseases Research, College of PublicHealth, University of South Florida, Tampa, USAFull list of author information is available at the end of the article
© The Author(s). 2018 Open Access This article is distributed under the terms of the Creative Commons Attribution 4.0International License (http://creativecommons.org/licenses/by/4.0/), which permits unrestricted use, distribution, andreproduction in any medium, provided you give appropriate credit to the original author(s) and the source, provide a link tothe Creative Commons license, and indicate if changes were made. The Creative Commons Public Domain Dedication waiver(http://creativecommons.org/publicdomain/zero/1.0/) applies to the data made available in this article, unless otherwise stated.
Gibbons et al. BMC Genomics (2018) 19:849 https://doi.org/10.1186/s12864-018-5207-7
observation, artesunate treatment has been reported tostimulate entry into a latent developmental state due toPK4 phosphorylation of eIF2α [10]; furthermore, resist-ant clinical isolates show an up-regulated protein foldingresponse and down-regulation of the DNA replicationmachinery with a delayed progression out of the ringstage [11]. Resistant strains created in vitro by drugselection demonstrate altered gene expression in oxida-tive stress, protein damage, and cell cycle pathways [12].The gene with the strongest association with artemisi-
nin resistance is k13 [13–16]. Crystal structure similaritysuggests that K13 is a homolog of the human E3 ubiqui-tin substrate adaptor Keap1 with a root-mean-square de-viation between the propeller domains (4zgc and 1u6d)of 1.298 Å. Evidence from Mbengue et al. [17] suggeststhat K13 plays a role in regulating ubiquitination. Thishuman homolog of K13 is a well-characterized transcrip-tional regulator of oxidative stress response [18], but theprocesses regulated by K13 remain unknown in malarialparasites. Because k13 is likely essential [19, 20] knock-ing out its function is not an experimental option andregulatory mutants provide a path to decipher K13’sfunction. Birnbaum et al. [19] reported that conditionallyknocking out k13 halts growth after 3 days at the ringstage, but the mechanisms underlying k13 essentialityare unknown.In this work, we report on a k13 dysregulated mutant
(PB58) [20, 21]. Previous studies using standard 72 hgrowth inhibition assays showed the mutant to be moresensitive than the parent NF54 strain to artemisinins
(artesunate, artelinic acid, artemether, artemisinin, dihy-droartemisinin; See Additional file 1: S2) and the prote-asome inhibitor Bortezomib [20, 21]. The increasedsensitivity to a proteasome inhibitor is interesting becausethe resistance to ACT has been linked to the ubiquitin/proteasome system [17, 22]. This mutant carries a singletransposon insertion in the 5’ UTR of k13 in the NF54background. Studies utilizing QISeq verified the absenceof other changes in the genomic background [23, 24].Given K13’s BTB and propeller domains structural simi-larity to the transcriptional regulator Keap1, we hypothe-sized that dysregulation of K13 will result in an alteredtranscriptome of functionally-connected genes. Therefore,we conducted RNA-seq on various stages of the intraery-throcytic developmental cycle (IDC) to understand thecellular processes regulated by k13.
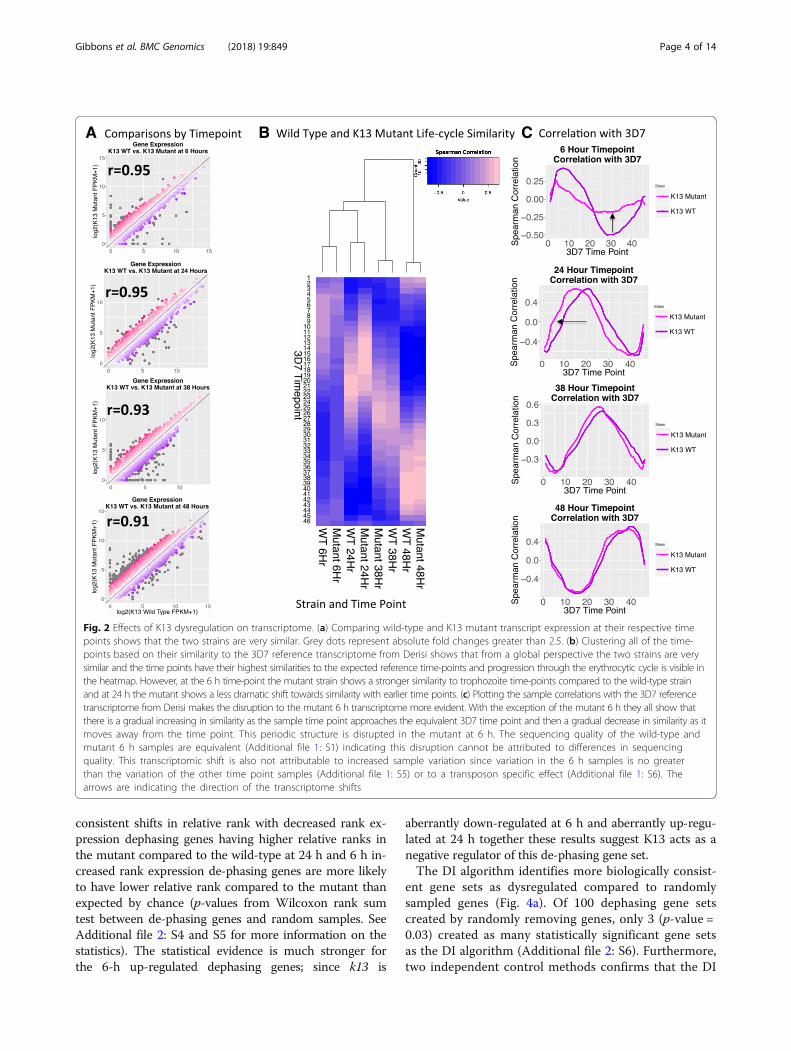
ResultsValidation of specific K13 dysregulation in the mutantThe k13 mutant carries a piggyBac transposon insertionin the promoter region (Fig. 1a) as previously reportedby Pradhan, Siwo et al. [21]. As shown in Fig. 1a thereare two other genes next to k13 on the same DNAstrand. Figure 1b shows the expression levels of thegenes immediately flanking k13 are unaffected by thetransposon insertion, whereas k13 expression is signifi-cantly altered at 6 and 24 h of the IDC (p-values of 0.05and 0.007936 from Wilcoxon rank sum test withp-values corrected using the Holm method, respectively).Thus in the mutant k13 is down-regulated during the
A
B
Fig. 1 Transposon insertion and its effect on gene expression. (a) Insertion of a PiggyBac Transposon in the 5′ upstream region the gene k13(b) results in the gene being aberrantly down-regulated at the 6 h time point and up-regulated at the 24 h time point. The expression of k13’ssame strand neighbors are unaffected by the insertion. The changes in K13 expression are consistent with the known regulation of thecalmodulin promoter in P. falciparum. The transcript expression is measured in fragments per kilobase per million mapped reads (FPKM).The abbreviations for the piggybac transposon are: inverted terminal repeat 1 (ITR1), histidine-rich protein-2 (hrp2), human dihydrofolatereductase (hdhfr), regulatory elements of calmodulin (cam), and inverted terminal repeat 2 (ITR2). The insertion occurs 1034 nucleotidesup-stream of k13 (see Additional file 1: S1 for a finer resolution mapping of the insertion site)
Gibbons et al. BMC Genomics (2018) 19:849 Page 2 of 14
early ring stage and is up-regulated during the earlytrophozoite stage, as compared to its wild-type paren-tal strain NF54. Microarray measurements from thesesame time points are consistent with this interpret-ation (Additional file 1: Figure S3).
K13 mutant transcriptome is overall simliar to wild-typewith the exception of several biological processesOur initial global transcriptome analysis showed overallconserved patterns of gene expression between the mu-tant and wild-type transcriptomes. Even at the timepoints where k13 is dysregulated, the transcriptomescorrelate well between the wild-type and mutant strains(Pearson’s r of 0.95 for both 6 and 24 h) (Fig. 2a). Nextwe analyzed the developmental time points of thesetranscriptomes by using a previously published studywith extensive time points [25]. When the samples areclustered based upon their similarity to the Derisi 3D7reference transcriptome [27], the wild-type and mutantstrains of the same time point show the same relation-ships to the 3D7 reference time points and progressionthrough the IDC, which is evident in the heatmap forboth the wild-type and mutant transcriptomes (Fig. 2b).However, compared with the wild-type the mutant strainat 6 h does not show as strong of negative correlationswith the trophozoite stage time points as the wild-typestrain; and this pattern becomes even more evidentwhen the correlations to the 3D7 reference IDC are plot-ted out as line graphs (Fig. 2c).The IDC is cyclical with the majority of genes showing
sinusoidal expression [25]. When the correlation of atranscription profile for a single time point against thereference transcriptome of 3D7 is plotted there will bean increase in the correlation coefficient as the sampletime point approaches the corresponding reference timepoint, followed by a steady decline in the correlationcoefficient as the sample time point becomes more dis-tant to the reference time point until a new inflectionpoint is reached. If the transcription profile of themutant line is out of synch with normal IDC patternsthis curve will not be smooth.As shown in Fig. 2c, at 6 h in the k13 mutant, the
transcriptional rhythms are no longer in phase, suggest-ing that a disruption in transcriptional regulation hasoccurred that advanced the 6-h transcriptome towards amore trophozoite-like state. The sequencing quality forthe wild-type and mutant 6-h samples are equivalent(Additional file 1: S4), indicating the disruption seen inthe mutant at 6 h cannot be attributed to library prepar-ation differences. Further, variation between biologicalreplicates at 6 h is not significantly different than vari-ation at the other time point samples (p-values > 0.34 byWilcoxon rank sum test; Additional file 1: S5), indicatingincreased sample variability is also not responsible for
the observed IDC correlation plot distortion. Disrup-tions to IDC correlation plots are also not present in apiggyBac mutant with an insertion in gene PF3D7_1305500 (Additional file 1: S6), indicating the transposondoes not cause cell-cycle shifts; and the effect is specificto the k13 mutant. The fact that the 6-h samples displaythe greatest divergence is particularly puzzling becausedifferential expression analysis with EdgeR shows thatthe 6-h samples have the fewest number of differentiallyexpressed genes (Additional file 1: S7). Given that the se-quencing data have good quality scores (Additional file 1:S4), the variation between the 6-h replicates is notunusually high and the paucity of differentially expressedgenes suggests that the observed shift in the transcrip-tional rhythms at 6-h may be due to a small but consist-ent shift in the expression levels of stage specific genesfunctionally linked to k13.To identify the genes most prominently linked to the
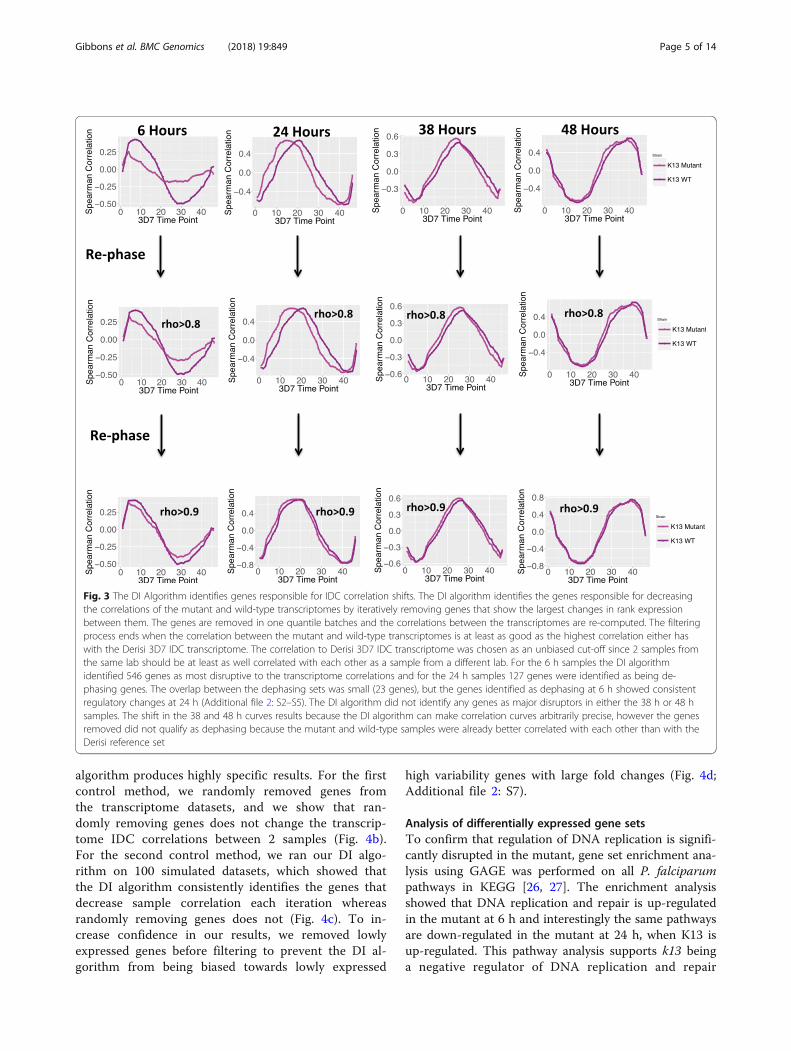
disrupted pattern of normal transcription, we developed,what is to our knowledge, a novel computational methodto parse out the important differences between the data-sets with a temporal sequence called the Dephaser Iden-tifier (DI) algorithm. First, small numbers of genes wereremoved based on their absolute rank difference inexpression between the wild-type and mutant strainsand the correlations between the mutant and wild-typestrain were recalculated. Subsequently, the process isperformed iteratively until the mutant and wild-typestrains have a correlation coefficient at least as high asthe initial highest correlation of either the mutant orwild-type strain to the Derisi 3D7 reference transcrip-tome (Fig. 3).Our computational procedure identified 546 genes pri-
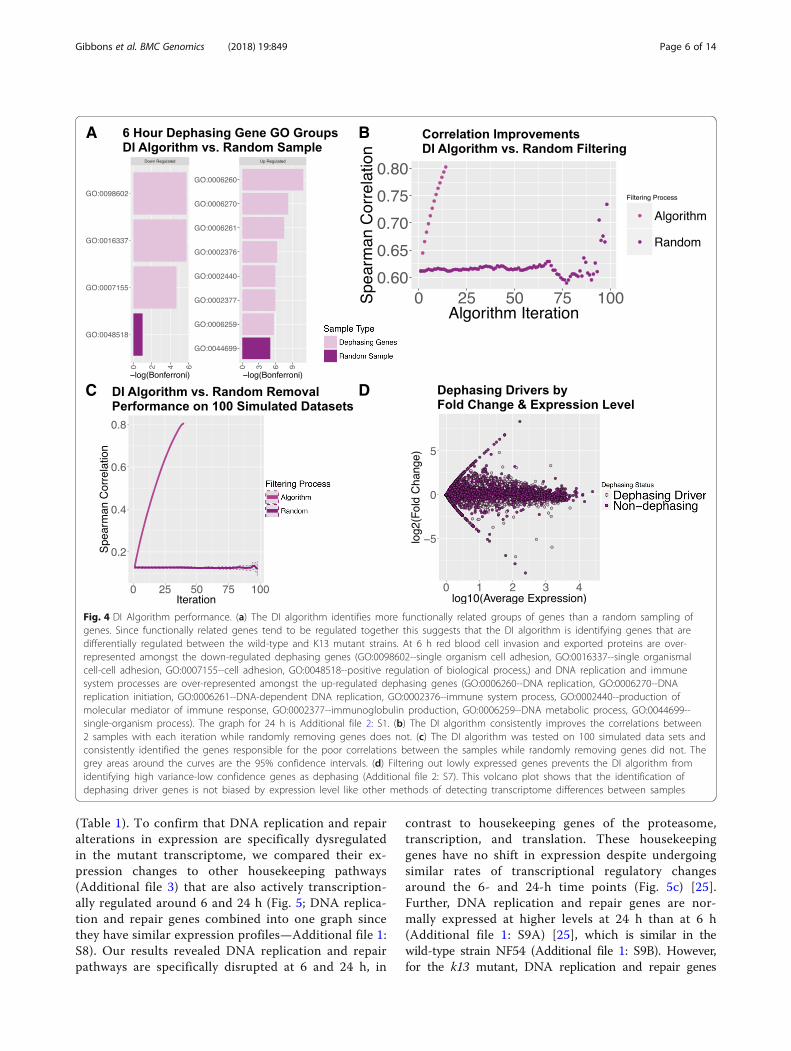
marily responsible for de-phasing of the rhythmic struc-ture of the mutant 6-h IDC correlation curve. There are305 genes that show an increase in their expression rankand 241 genes that show a decrease in their expressionrank. Over-represented amongst the increased expres-sion rank set are genes involved in DNA replication andDNA replication initiation (Bonferroni correctedp-values < 0.0005; Fig. 4a) and in the decreased expres-sion rank set genes involved in host cell invasion areover-represented (Bonferroni corrected p-values < 0.005;Fig. 4a).The genes identified as dephasing at 6 h show consist-
ent changes in expression at 24 h (the time point wherek13 becomes aberrantly up-regulated). The increased ex-pression rank de-phasing genes at 6 h are significantlydown-regulated at 24 h and the decreased rank expres-sion genes are significantly up-regulated at 24 h(p-values Determined by Wilcoxon Rank Sum test onfold changes and for more information on the statisticssee Additional file 2: S2 and S3). For both increased anddecreased expression rank 6-h dephasing genes there are
Gibbons et al. BMC Genomics (2018) 19:849 Page 3 of 14
consistent shifts in relative rank with decreased rank ex-pression dephasing genes having higher relative ranks inthe mutant compared to the wild-type at 24 h and 6 h in-creased rank expression de-phasing genes are more likelyto have lower relative rank compared to the mutant thanexpected by chance (p-values from Wilcoxon rank sumtest between de-phasing genes and random samples. SeeAdditional file 2: S4 and S5 for more information on thestatistics). The statistical evidence is much stronger forthe 6-h up-regulated dephasing genes; since k13 is
aberrantly down-regulated at 6 h and aberrantly up-regu-lated at 24 h together these results suggest K13 acts as anegative regulator of this de-phasing gene set.The DI algorithm identifies more biologically consist-
ent gene sets as dysregulated compared to randomlysampled genes (Fig. 4a). Of 100 dephasing gene setscreated by randomly removing genes, only 3 (p-value =0.03) created as many statistically significant gene setsas the DI algorithm (Additional file 2: S6). Furthermore,two independent control methods confirms that the DI
A B C
Fig. 2 Effects of K13 dysregulation on transcriptome. (a) Comparing wild-type and K13 mutant transcript expression at their respective timepoints shows that the two strains are very similar. Grey dots represent absolute fold changes greater than 2.5. (b) Clustering all of the time-points based on their similarity to the 3D7 reference transcriptome from Derisi shows that from a global perspective the two strains are verysimilar and the time points have their highest similarities to the expected reference time-points and progression through the erythrocytic cycle is visible inthe heatmap. However, at the 6 h time-point the mutant strain shows a stronger similarity to trophozoite time-points compared to the wild-type strainand at 24 h the mutant shows a less dramatic shift towards similarity with earlier time points. (c) Plotting the sample correlations with the 3D7 referencetranscriptome from Derisi makes the disruption to the mutant 6 h transcriptome more evident. With the exception of the mutant 6 h they all show thatthere is a gradual increasing in similarity as the sample time point approaches the equivalent 3D7 time point and then a gradual decrease in similarity as itmoves away from the time point. This periodic structure is disrupted in the mutant at 6 h. The sequencing quality of the wild-type andmutant 6 h samples are equivalent (Additional file 1: S1) indicating this disruption cannot be attributed to differences in sequencingquality. This transcriptomic shift is also not attributable to increased sample variation since variation in the 6 h samples is no greaterthan the variation of the other time point samples (Additional file 1: S5) or to a transposon specific effect (Additional file 1: S6). Thearrows are indicating the direction of the transcriptome shifts
Gibbons et al. BMC Genomics (2018) 19:849 Page 4 of 14
algorithm produces highly specific results. For the firstcontrol method, we randomly removed genes fromthe transcriptome datasets, and we show that ran-domly removing genes does not change the transcrip-tome IDC correlations between 2 samples (Fig. 4b).For the second control method, we ran our DI algo-rithm on 100 simulated datasets, which showed thatthe DI algorithm consistently identifies the genes thatdecrease sample correlation each iteration whereasrandomly removing genes does not (Fig. 4c). To in-crease confidence in our results, we removed lowlyexpressed genes before filtering to prevent the DI al-gorithm from being biased towards lowly expressed
high variability genes with large fold changes (Fig. 4d;Additional file 2: S7).
Analysis of differentially expressed gene setsTo confirm that regulation of DNA replication is signifi-cantly disrupted in the mutant, gene set enrichment ana-lysis using GAGE was performed on all P. falciparumpathways in KEGG [26, 27]. The enrichment analysisshowed that DNA replication and repair is up-regulatedin the mutant at 6 h and interestingly the same pathwaysare down-regulated in the mutant at 24 h, when K13 isup-regulated. This pathway analysis supports k13 beinga negative regulator of DNA replication and repair
Fig. 3 The DI Algorithm identifies genes responsible for IDC correlation shifts. The DI algorithm identifies the genes responsible for decreasingthe correlations of the mutant and wild-type transcriptomes by iteratively removing genes that show the largest changes in rank expressionbetween them. The genes are removed in one quantile batches and the correlations between the transcriptomes are re-computed. The filteringprocess ends when the correlation between the mutant and wild-type transcriptomes is at least as good as the highest correlation either haswith the Derisi 3D7 IDC transcriptome. The correlation to Derisi 3D7 IDC transcriptome was chosen as an unbiased cut-off since 2 samples fromthe same lab should be at least as well correlated with each other as a sample from a different lab. For the 6 h samples the DI algorithmidentified 546 genes as most disruptive to the transcriptome correlations and for the 24 h samples 127 genes were identified as being de-phasing genes. The overlap between the dephasing sets was small (23 genes), but the genes identified as dephasing at 6 h showed consistentregulatory changes at 24 h (Additional file 2: S2–S5). The DI algorithm did not identify any genes as major disruptors in either the 38 h or 48 hsamples. The shift in the 38 and 48 h curves results because the DI algorithm can make correlation curves arbitrarily precise, however the genesremoved did not qualify as dephasing because the mutant and wild-type samples were already better correlated with each other than with theDerisi reference set
Gibbons et al. BMC Genomics (2018) 19:849 Page 5 of 14
(Table 1). To confirm that DNA replication and repairalterations in expression are specifically dysregulatedin the mutant transcriptome, we compared their ex-pression changes to other housekeeping pathways(Additional file 3) that are also actively transcription-ally regulated around 6 and 24 h (Fig. 5; DNA replica-tion and repair genes combined into one graph sincethey have similar expression profiles—Additional file 1:S8). Our results revealed DNA replication and repairpathways are specifically disrupted at 6 and 24 h, in
contrast to housekeeping genes of the proteasome,transcription, and translation. These housekeepinggenes have no shift in expression despite undergoingsimilar rates of transcriptional regulatory changesaround the 6- and 24-h time points (Fig. 5c) [25].Further, DNA replication and repair genes are nor-mally expressed at higher levels at 24 h than at 6 h(Additional file 1: S9A) [25], which is similar in thewild-type strain NF54 (Additional file 1: S9B). However,for the k13 mutant, DNA replication and repair genes
A
C
B
D
Fig. 4 DI Algorithm performance. (a) The DI algorithm identifies more functionally related groups of genes than a random sampling ofgenes. Since functionally related genes tend to be regulated together this suggests that the DI algorithm is identifying genes that aredifferentially regulated between the wild-type and K13 mutant strains. At 6 h red blood cell invasion and exported proteins are over-represented amongst the down-regulated dephasing genes (GO:0098602--single organism cell adhesion, GO:0016337--single organismalcell-cell adhesion, GO:0007155--cell adhesion, GO:0048518--positive regulation of biological process,) and DNA replication and immunesystem processes are over-represented amongst the up-regulated dephasing genes (GO:0006260--DNA replication, GO:0006270--DNAreplication initiation, GO:0006261--DNA-dependent DNA replication, GO:0002376--immune system process, GO:0002440--production ofmolecular mediator of immune response, GO:0002377--immunoglobulin production, GO:0006259--DNA metabolic process, GO:0044699--single-organism process). The graph for 24 h is Additional file 2: S1. (b) The DI algorithm consistently improves the correlations between2 samples with each iteration while randomly removing genes does not. (c) The DI algorithm was tested on 100 simulated data sets andconsistently identified the genes responsible for the poor correlations between the samples while randomly removing genes did not. Thegrey areas around the curves are the 95% confidence intervals. (d) Filtering out lowly expressed genes prevents the DI algorithm fromidentifying high variance-low confidence genes as dephasing (Additional file 2: S7). This volcano plot shows that the identification ofdephasing driver genes is not biased by expression level like other methods of detecting transcriptome differences between samples
Gibbons et al. BMC Genomics (2018) 19:849 Page 6 of 14

Table 1 KEGG pathways dysregulated in the mutant6 hour up-regulated KEGG pathways 24 hour down-regulated KEGG pathways
KEGGGene set
p.geomean p.stat.mean p.val q.val set.size KEGGGene set
p.geomean p.stat.mean p.val q.val set.size
pfa03030 DNA replication 2.49E-05 4.50 1.70E-12 7.48E-11 29 pfa03030 DNA replication 5.67E-05 −4.21 2.02E-17 8.90E-16 29
pfa03430 Mismatch repair 2.83E-03 2.96 1.18E-06 2.60E-05 19 pfa03430 Mismatch repair 7.03E-03 −2.51 8.72E-08 1.92E-06 19
pfa03440 Homologousrecombination
2.08E-02 2.17 2.61E-04 2.61E-03 13 pfa03440 Homologousrecombination
2.61E-02 −1.86 6.82E-05 7.50E-04 16
pfa03410 Baseexcision repair
2.31E-02 2.05 4.57E-04 2.87E-03 16 pfa03410 Baseexcision repair
4.08E-02 −1.77 1.08E-04 9.48E-04 13
Definitions of terms: p.geomean: geometric mean of p-values from pairwise sample comparisons. stat.mean: Average Mann Whitney U test statisticfrom pairwise sample comparisons. p.val: p-value for the assumption of no change in pathway regulation. q.value: False discovery rate corrected p-values. set.size:number of genes in the KEGG Gene Set
A B C
Fig. 5 DNA replication and repair pathways are dysregulated, but housekeeping pathways are not. There are clear shifts in the expression patterns ofthe DNA replication and repair genes that are not apparent in other gene sets that also undergo rapid transcriptional regulation at the same points ofthe life-cycle. As indicated by the data from Bozdech et al. 2003, the proteasome, transcriptional machinery and translational machinery(Additional file 3) all undergo rapid changes in transcript expression levels around 6 and 24 h of the intraerythrocytic life-cycle (c) butthese gene sets show consistent expression in the wild-type and mutant strains which supports the idea that the dysregulation observedin the DNA replication and repair genes is not due to time point sampling error but results from the dysregulation of k13. Grey dotsrepresent absolute fold changes greater than 2.5. The DNA replication and repair pathways were combined into a single plot because they undergoequivalent rates of transcriptional regulation (Additional file 1: S8). The q statistic in (a) and (b) refers to the false discovery rate
Gibbons et al. BMC Genomics (2018) 19:849 Page 7 of 14
actually have higher expression levels at 6 h then 24 h(Additional file 1: S9B). These data indicate that the regu-latory effect of k13 is specific for cell-cycle dependentdifferentially-regulated genes, but not for others. In par-ticular, DNA replication and repair expression levelschange consistently in response to differential k13 expres-sion, but not in the other housekeeping pathways ana-lyzed. In this k13 piggyBac mutant parasite clone that ismore sensitive to artemisinin, DNA replication and repairexpression levels at 24-h actually fall below their 6-hexpression levels when k13 is up-regulated strongly. Thisresult is interesting because in artemisinin-resistant strainsresistant k13 polymorphisms are associated with thedown-regulation of DNA replication genes during thering-stage [11] and in the trophozoite and schizont stages[28], indicating that regulation of DNA replication genesis linked to the artemisinin resistance response.Chemogenomic profiling of P. falciparum isogenic
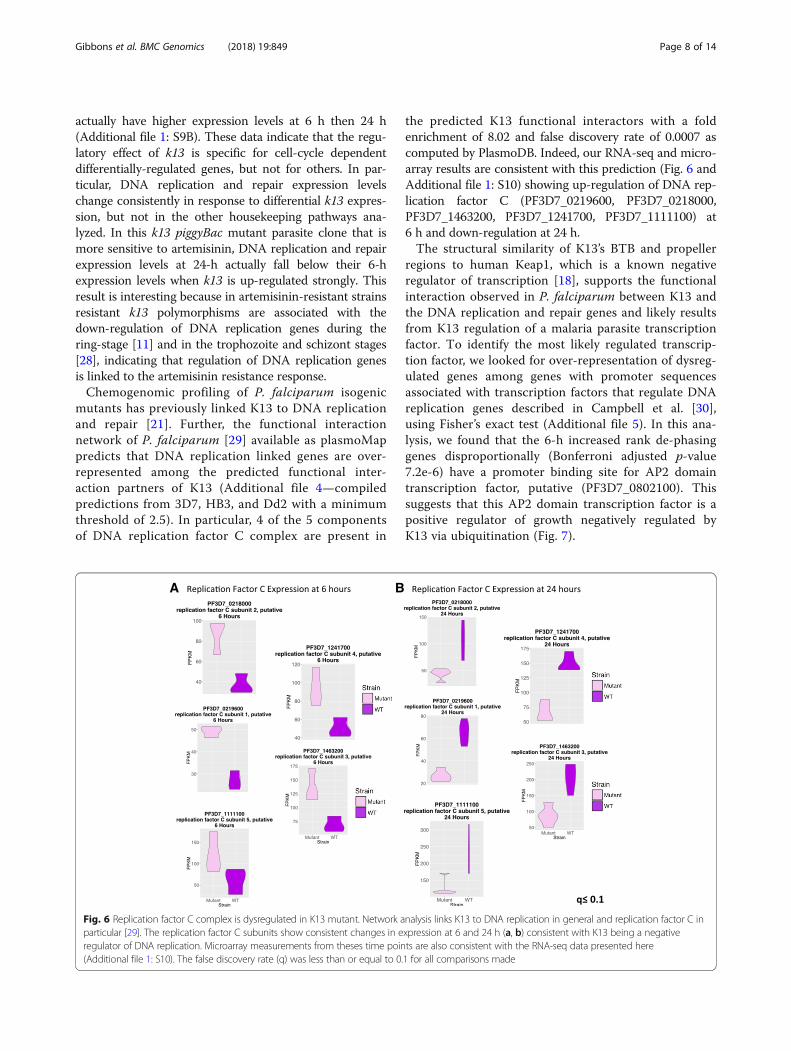
mutants has previously linked K13 to DNA replicationand repair [21]. Further, the functional interactionnetwork of P. falciparum [29] available as plasmoMappredicts that DNA replication linked genes are over-represented among the predicted functional inter-action partners of K13 (Additional file 4—compiledpredictions from 3D7, HB3, and Dd2 with a minimumthreshold of 2.5). In particular, 4 of the 5 componentsof DNA replication factor C complex are present in
the predicted K13 functional interactors with a foldenrichment of 8.02 and false discovery rate of 0.0007 ascomputed by PlasmoDB. Indeed, our RNA-seq and micro-array results are consistent with this prediction (Fig. 6 andAdditional file 1: S10) showing up-regulation of DNA rep-lication factor C (PF3D7_0219600, PF3D7_0218000,PF3D7_1463200, PF3D7_1241700, PF3D7_1111100) at6 h and down-regulation at 24 h.The structural similarity of K13’s BTB and propeller
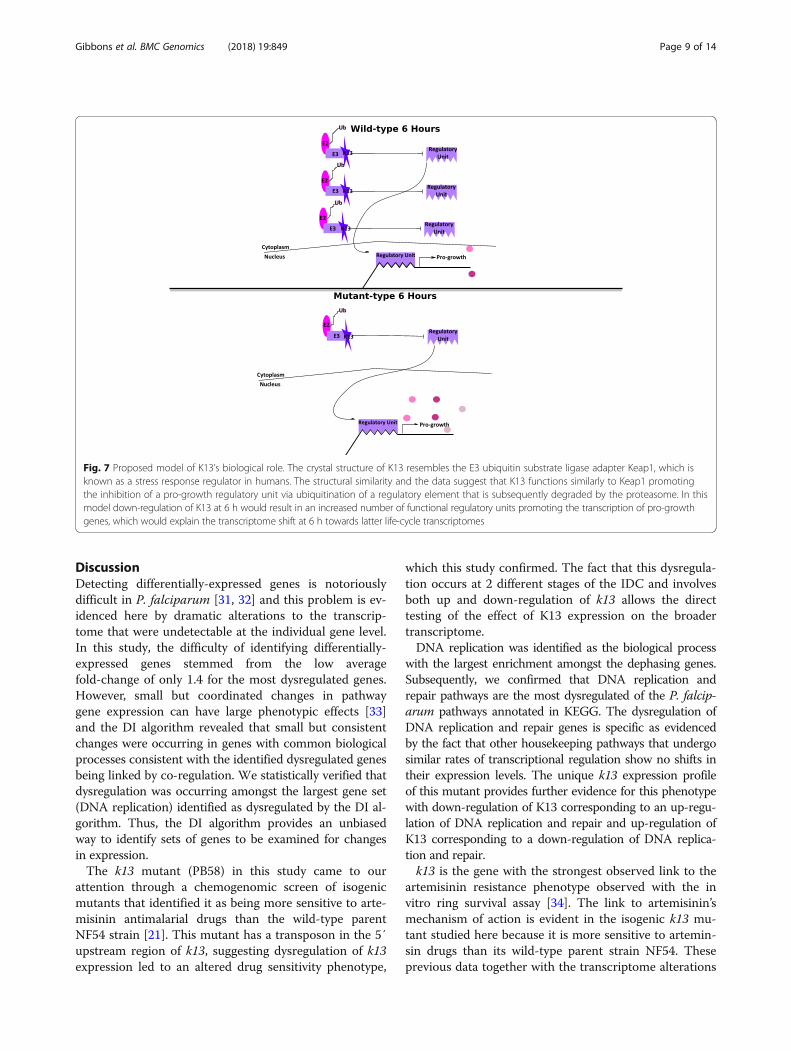
regions to human Keap1, which is a known negativeregulator of transcription [18], supports the functionalinteraction observed in P. falciparum between K13 andthe DNA replication and repair genes and likely resultsfrom K13 regulation of a malaria parasite transcriptionfactor. To identify the most likely regulated transcrip-tion factor, we looked for over-representation of dysreg-ulated genes among genes with promoter sequencesassociated with transcription factors that regulate DNAreplication genes described in Campbell et al. [30],using Fisher’s exact test (Additional file 5). In this ana-lysis, we found that the 6-h increased rank de-phasinggenes disproportionally (Bonferroni adjusted p-value7.2e-6) have a promoter binding site for AP2 domaintranscription factor, putative (PF3D7_0802100). Thissuggests that this AP2 domain transcription factor is apositive regulator of growth negatively regulated byK13 via ubiquitination (Fig. 7).
A B
Fig. 6 Replication factor C complex is dysregulated in K13 mutant. Network analysis links K13 to DNA replication in general and replication factor C inparticular [29]. The replication factor C subunits show consistent changes in expression at 6 and 24 h (a, b) consistent with K13 being a negativeregulator of DNA replication. Microarray measurements from theses time points are also consistent with the RNA-seq data presented here(Additional file 1: S10). The false discovery rate (q) was less than or equal to 0.1 for all comparisons made
Gibbons et al. BMC Genomics (2018) 19:849 Page 8 of 14
DiscussionDetecting differentially-expressed genes is notoriouslydifficult in P. falciparum [31, 32] and this problem is ev-idenced here by dramatic alterations to the transcrip-tome that were undetectable at the individual gene level.In this study, the difficulty of identifying differentially-expressed genes stemmed from the low averagefold-change of only 1.4 for the most dysregulated genes.However, small but coordinated changes in pathwaygene expression can have large phenotypic effects [33]and the DI algorithm revealed that small but consistentchanges were occurring in genes with common biologicalprocesses consistent with the identified dysregulated genesbeing linked by co-regulation. We statistically verified thatdysregulation was occurring amongst the largest gene set(DNA replication) identified as dysregulated by the DI al-gorithm. Thus, the DI algorithm provides an unbiasedway to identify sets of genes to be examined for changesin expression.The k13 mutant (PB58) in this study came to our
attention through a chemogenomic screen of isogenicmutants that identified it as being more sensitive to arte-misinin antimalarial drugs than the wild-type parentNF54 strain [21]. This mutant has a transposon in the 5′upstream region of k13, suggesting dysregulation of k13expression led to an altered drug sensitivity phenotype,
which this study confirmed. The fact that this dysregula-tion occurs at 2 different stages of the IDC and involvesboth up and down-regulation of k13 allows the directtesting of the effect of K13 expression on the broadertranscriptome.DNA replication was identified as the biological process
with the largest enrichment amongst the dephasing genes.Subsequently, we confirmed that DNA replication andrepair pathways are the most dysregulated of the P. falcip-arum pathways annotated in KEGG. The dysregulation ofDNA replication and repair genes is specific as evidencedby the fact that other housekeeping pathways that undergosimilar rates of transcriptional regulation show no shifts intheir expression levels. The unique k13 expression profileof this mutant provides further evidence for this phenotypewith down-regulation of K13 corresponding to an up-regu-lation of DNA replication and repair and up-regulation ofK13 corresponding to a down-regulation of DNA replica-tion and repair.k13 is the gene with the strongest observed link to the
artemisinin resistance phenotype observed with the invitro ring survival assay [34]. The link to artemisinin’smechanism of action is evident in the isogenic k13 mu-tant studied here because it is more sensitive to artemin-sin drugs than its wild-type parent strain NF54. Theseprevious data together with the transcriptome alterations
Fig. 7 Proposed model of K13’s biological role. The crystal structure of K13 resembles the E3 ubiquitin substrate ligase adapter Keap1, which isknown as a stress response regulator in humans. The structural similarity and the data suggest that K13 functions similarly to Keap1 promotingthe inhibition of a pro-growth regulatory unit via ubiquitination of a regulatory element that is subsequently degraded by the proteasome. In thismodel down-regulation of K13 at 6 h would result in an increased number of functional regulatory units promoting the transcription of pro-growthgenes, which would explain the transcriptome shift at 6 h towards latter life-cycle transcriptomes
Gibbons et al. BMC Genomics (2018) 19:849 Page 9 of 14
revealed by our analysis using the DI algorithm suggeststhat K13 functional changes are relevant to P. falcipar-um’s response to artemisinin. Other studies [17, 35] indi-cate that the resistance associated k13 alleles havedecreased target binding; however, the increased suscep-tibility of this k13 mutant to arteminsins is puzzling be-cause K13 is down-regulated during the early ring stage.A logical conclusion of this observation is that the in-creased sensitivity would occur during the early tropho-zoite stage during which k13 transcript levels are likelyeither up-regulated due to the calmodulin promoter orcould participate in a negative feedback loop to suppressthe premature pro-growth phenotype. K13’s homologyto Keap1 and the regulation of DNA replication and re-pair as detected here are consistent with K13 being astress response regulator. A role for K13 regulatingDNA replication and repair comports with previousstudies that found artemisinin resistant strainsdown-regulate DNA replication genes [11, 28] and previ-ous network analysis studies that linked K13 to DNAreplication and repair [21, 29].
ConclusionUnderstanding K13’s function is important to under-stand the mechanism of artemisinin resistance. Giventhat K13 is likely essential for parasite survival, regula-tory mutants are one of the important ways to studyK13. This work compared the transcriptional profiles ofisogenic strain pairs of P. falciparum with divergent K13regulation during the IDC. The points of dysregulationshow consistent and specific disruption to the normalexpression patterns of DNA replication and repair genes.This finding supports the proposed function of k13 as aregulator of stress response based on k13’s homology toKEAP1 and is consistent with previous network analysisstudies that linked k13 to DNA replication and repair[21, 29] and showed that artemisinin resistant strainsdown-regulate DNA replication genes [11, 28].
MethodsParasite culture and sequencingRNA -seqThe parasite strains NF54 and PB58 (the K13 mutant)[21] were maintained in identical standard cultureconditions and synchronized by 3 rounds of sorbitolsynchronization. The time points collected were 6(n = 3), 12 (n = 2), 24 (n = 5), 38 (n = 3), and 48 (n = 3for wild-type and n = 2 for K13 mutant) hours aftertime zero. Time zero was defined as the time whenthe synchronized culture was half late schizonts andhalf early rings. When a culture reached a harvest timepoint the parasites were separated from the red bloodcells with 0.015% saponin at room temperature for5 min. The parasites were then pelleted and washed
three times in 10 mL room temperature PBS and thesamples were stored at − 80 °C in 1 mL TRIzol reagent(Fisher Scientific, Hampton, NH) until extraction. Forextraction 200 μl of chloroform was added and thesamples vortexed vigorously for 15 s and then incu-bated at room temperature for up to 5 min. The sam-ples were then spun down at 12000×g (10,800 rpm) at4 °C for 10 min and the supernatant discarded. 1 mLof 75% ethanol was added and then the samples spundown at 10000×g (9800 rpm) for 5 min. The resultingsupernatant was discarded and the pellet brieflyallowed to dry and the pellet dissolved in 20–50 μl ofDEPC-treated water while being incubated at 55 °C for10–15 min.0.5 μg–1.0 μg of RNA samples were prepped for
sequencing using the Illumina TruSeq Stranded mRNAKit. Library quantification was measured by qPCR andTapeStation (Agilent Technologies). Sequencing wasperformed on an Illumina MiSeq using 300-cycle V2MiSeq reagent kit (Illumina).
MicroarrayThe microarray measurements were performed as de-scribed in [36]. Briefly, RNA was extracted using TriZolreagent (Invitrogen, Carlsbad, CA) and the quality andquantity determined by NanoDrop (NanoDrop Tech-nologies). 300 ηg of RNA was used for cDNA synthesisusing Sigma WTA2 whole transcriptome amplificationkit. 1 μg of cDNA was labeled with Cy3 dye andallowed to hybridize to a custom Agilent array for 17 hfollowed by washing. The microarray image was takenusing a 2 μM scanner and probe intensity valuesobtained using Agilent Feature Extraction software.Normalization of probe intensities was done using therobust multichip average (RMA) method. The timepoints were obtained as described above for theRNA-seq measurements and include the time points 6(n = 3), 24 (n = 3) and 38 (n = 3) hours after time zero.Ethical approval for the use of human blood in this
study was granted by the Institutional Review Boards ofthe University of South Florida and the University ofNotre Dame. All of the blood used for the in vitro cul-turing of parasites was obtained from healthy adult vol-unteers and drawn by trained personal from InterstateBlood Bank.The NF54 strain was originally obtained from the
Naval Medical Research Center.
Obtaining gene expression dataReads were aligned to 3D7 reference release 27 usingHISAT2 version 2.0.4 [37]. Raw counts were obtainedusing FeatureCounts Version 1.50.0-p3 [38] . Transcriptswere assembled using Cufflinks Version 2.2.1 and FPKM(Fragments per kilobase per million mapped reads)
Gibbons et al. BMC Genomics (2018) 19:849 Page 10 of 14
values calculated using Cuffnorm Version 2.2.1 using theclassic-fpkm setting and normalization was performedby strain and time point [39]. Expression data availableas Additional file 6.Since lowly expressed genes are more subject to sto-
chastic fluctuations mitochondrial and apicoplast genesas well as genes with less than 3 reads for every millionreads sequenced in more than half the samples wereremoved from further consideration.
Identification of sample outliersTMM (trimmed mean of M-values) normalized countdata was used to calculate Pearson correlation pairwisebetween all replicates. If a sample had a correlation ofless than 0.7 with at least 2 other replicates it wasremoved as an outlier. This cutoff was chosen based onthe fact that most of the biological replicates had correl-ation coefficients of at least 0.7, but a few had correl-ation coefficients that were lower.
Determination of K13 dysregulationTo test differential expression of k13 at 6 and 24 h thewilcox.test in R version 3.4.1 was used to implement thenonparametric Mann-Whitney test. The input was theFPKM values for k13 and the samples were tested fordown-regulation of K13 at 6 h and up-regulation of K13at 24 h. The Holm procedure in R version 3.4.1 was usedto adjust p-values for multiple testing [40].
EdgeR analysisDifferential expression analysis was performed usingEdgeR version 3.18.1 [41]. As previously noted the countsused as input to EdgeR were obtained using Feature-Counts Version 1.50.0-p3. Mitochondrial, apicoplast andgenes with less than 3 counts per million in more thanhalf the samples were not considered (filtered as previ-ously described). TMM (trimmed mean of M-values)normalization [42] was performed prior to differentialexpression analysis and differential expression was testedbetween strains at each time point.
Determination of DNA replication factor C dysregulationThe differential expression of the DNA replicationFactor C components was performed following the sameprocedure described under “Determination of K13 Dys-regulation” for the 6 and 24 h time points except thefalse discovery rate was used to adjust p-values [43].
Gene set analysisAll P. falciparum pathways annotated in KEGG onSeptember 4 2017 were analyzed for differential expressionusing Gage 2.26.3 via the Mann Whitney U test on un-paired samples [26].
GSAR version 1.10.0 was used to perform a KStest[44] on DNA replication and repair, proteasome, tran-scription and translation gene ontology sets obtainedfrom PlasmoDB [45]. The lists of genes used to form thegene sets is found in Additional file 3.To see if the down-regulated dephasing genes at 6 h
are more likely to be up-regulated at 24 h we checked tosee if the fold-changes of these genes are higher than thefold changes of a random sample of genes. The same isdone for the up-regulated dephasing genes, but now theyare expected to be more down-regulated. More specific-ally, a Wilcoxon rank sum test on the log2 fold changesof the FPKM values between the mutant and wild-typestrains at 24 h was performed and the results comparedto random samples. For the up-regulated dephasinggenes the controls were genes that also showed anincrease in relative rank at 6 h (n = 1704) and for thedown-regulated dephasing genes the controls were genesthat showed a decrease in relative rank at 6 h (n = 1951).This was performed 1000 times on different randomsamples to get the p-value distribution (Additional file 2:S3). The number of genes in each control set was equalto the number of genes in the experimental set.A similar procedure to that described above was used
to verify that the dephasing genes experienced consistentchanges to their relative ranks at 24 h. For this test theinput to the Wilcoxon rank sum test was the differencesin the gene expression relative rank of the mutant andwild-type at 24 h. The resulting p-value distributions areshown in Additional file 2: S5.
Mutant vs. wild-type similarity assessmentThe sample transcriptomes were correlated with theDerisi 3D7 transcriptome [25] downloaded from Plas-moDB [45]. The steps to calculate the correlations are asfollows:
1. Replicate FPKM values were averaged2. The average value for a gene at a specific time point
was divided by the average expression of that genefor all time points and samples and the log2 taken
3. The Spearman correlation between each sampletime point was calculated with respect to each ofthe 3D7 reference IDC time points individually
4. Time point and strain clustering as well as heatmapcreation were performed using the heatmap.2function in gplots version 3.0.1
Computational procedure to identify dephasing genesSignificant distortions to the mutant 6 h transcriptomewere identified by plotting out line graphs of the Spear-man correlation with the 3D7 reference transcriptome(calculated as described above). Given that very few
Gibbons et al. BMC Genomics (2018) 19:849 Page 11 of 14
differentially expressed genes were detected at this timepoint (Additional file 1: S7) we developed an algorithmnamed Dephaser Identifier (DI) detailed below to iden-tify the genes responsible for the distortions to the IDCcorrelation curve. Prior to performing the proceduremitochondrial and apicoplast genes as well as geneswith counts per million less than 3 in more than halfthe samples were removed and only genes present inour data set and in the Derisi reference transcriptomeset were used. The DI algorithm is as follows:
1. Calculate relative gene expression level vectors forthe control and mutant strains separately as follows
log2Average gene expression at a specific time pointAverage gene expression across all time points
� �
2. Define a minimum acceptable correlationbetween the control and mutant strains. For thisexperiment the minimum acceptable correlationwas defined as the highest spearman correlationthat either the control or mutant strain had witha specific time point from the Derisi referenceIDC time points [25] with the logic that 2samples from the same time point and the samelab should correlate at least as well with eachother as with a sample from a different lab
3. Rank the relative gene expression levels for both thecontrol and mutant strains
4. For a given pair of time points and for each genecalculate the difference in rank between the controland mutant strains
5. Calculate the absolute value of the difference inrank for each gene
6. Assign the absolute value of the rank differences foreach gene to quantiles (1% quantiles were used andthe quantiles were calculated using the type 7procedure in R version 3.4.1)
7. Remove the highest unfiltered quantile of genesfrom the relative gene expression level vectors forthe control and mutant strains and calculate theSpearman correlation
8. Repeat step 7 until the Spearman correlationbetween the control and mutant strains is higherthan the minimum acceptable correlation or thereare no more genes left to filter
DI algorithm performance assessmentTo determine if the DI algorithm was identifying function-ally related genes better than chance a simulation was run
100 times were a set of genes equal to the number of 6 hdephasing genes (n = 546) was randomly chosen andchecked for biological process enrichment using topGO[46]. The minimum gene ontology set size (the node_sizeparameter in topGO’s run_enrichment_tests function) wasset to 10 and a classic Fisher test was performed. Geneontology terms with p-values of less than or equal to 0.05were considered significant. The Bioconductor libraryorg.Pf.plasmodb [47] was used to obtain the gene ontologyannotations. The same procedure was performed once onthe real 6 h dephasing gene set and the results comparedto the simulation (Additional file 2: S6).
Identification of transcription factor regulatorsGenes with promoter regions linked to DNA replica-tion regulating transcription factors were identifiedfrom the data set reported by Campbell et al. [30].Campbell et al. linked 5 AP2 domain containing genesto DNA replication genes. The genes associated witheach of these transcription factors were downloadedfrom PlasmoDB [45] if the p-value for an associationwith one of the transcription factors was less than orequal to 1 × 10− 4. As shown in Additional file 5 thegenes associated with each of the transcription factorswere used to partition the genome into genes pre-dicted to have a binding site for the given transcrip-tion factor or not and whether or not the gene wasidentified as being an up-regulated 6 h dephasing geneor not to create contingency tables. The contingencytables were used to perform Fisher’s Exact Test in Rversion 3.4.1 and the p-values corrected using theBonferroni method.
Additional files
Additional file 1: Supplemental data pertaining to the K13 mutant andP. falciparum transcriptome. (PDF 1197 kb)
Additional file 2: Supplemental data pertaining to DI algorithm. (PDF 483 kb)
Additional file 3: Housekeeping gene sets. Genes sets for DNA replicationand repair, translation, transcription and proteasome. (XLSX 70 kb)
Additional file 4: Predicted K13 functional interactors. Genes predictedto have functional interactions with K13 from plasmoMAP. (XLSX 57 kb)
Additional file 5: Fisher’s exact test results for transcription factorbinding sites linked to dephasing genes. (XLSX 42 kb)
Additional file 6: Expression data. Expression data as counts and FPKM.(XLSX 2029 kb)
AbbreviationsACT: Artemisinin-based combination therapy; DI: Dephaser Identifier;FPKM: Fragments per kilobase per million mapped reads; GEO: GeneExpression Omnibus; IDC: Intra-erythrocytic development cycle
AcknowledgmentsWe would like to thank Chenqi Wang and Jenna Oberstaller for theirthoughtful discussions.We would like to thank Ash Mulholland for aesthetic design consultation.
Gibbons et al. BMC Genomics (2018) 19:849 Page 12 of 14
FundingWe thank National Institute of Health funding #R01AI117017, 5R01AI117017–02 aswell as University of South Florida New Investigator Funding to Rays H.Y. Jiang.
Availability of data and materialsAll relevant data are within the paper and its supporting information files.The RNA-seq data is available on Gene Expression Omnibus (GEO) asaccession number GSE119231.The microarray data is available on Gene Expression Omnibus (GEO) asaccession number GSE119514.DI algorithm code available at: https://github.com/JustinGibbons/Dephaser_Identifier_AlgorithmThe reference IDC data was obtained from:Bozdech Z, Llinás M, Pulliam BL, Wong ED, Zhu J, DeRisi JL (2003) TheTranscriptome of the Intraerythrocytic Developmental Cycle of Plasmodiumfalciparum. PLoS Biol 1(1): e5. https://doi.org/10.1371/journal.pbio.0000005
Authors’ contributionsRHYJ, JHA and MTF obtained the funding, conceived and supervisedthe study. JG, KABS, SRA, and SL performed culturing experiments. MZand SL designed RNA-seq experiment. XL did molecular biology workto validate the mutant and performed next generation sequencing. MPand SRA designed data analysis pipeline and performed preliminary analysis. JGprocessed the raw data and performed all subsequent analysis, made all of thefigures and wrote the majority of the manuscript. KABS performed thevalidation experiments and made major contributions to manuscriptwriting. RHYJ, JHA, MTF and KABS edited the manuscript. All authorsread and approved the final version of the manuscript.
Ethics approval and consent to participateEthical approval for the use of human blood in this study was grantedby the Institutional Review Boards of the University of South Florida andthe University of Notre Dame. All of the blood used for the in vitro culturing ofparasites was obtained from healthy adult volunteers and drawn by trainedpersonal from Interstate Blood Bank.
Consent for publicationNot applicable.
Competing interestsThe authors declare that they have no competing interests.
Publisher’s NoteSpringer Nature remains neutral with regard to jurisdictional claims in publishedmaps and institutional affiliations.
Author details1Department of Molecular Medicine, Morsani College of Medicine, Universityof South Florida, Tampa, USA. 2Center for Global Health and InfectiousDiseases Research, College of Public Health, University of South Florida,Tampa, USA. 3Eck Institute for Global Health, Department of BiologicalSciences, University of Notre Dame, Notre Dame, USA. 4Department ofComputer Science & Engineering, University of South Florida, Tampa, USA.
Received: 4 May 2018 Accepted: 30 October 2018
References1. Organization WH. World Malaria Report; 2016. p. 2016.2. Organization WH. World Malaria Report; 2005. p. 2005.3. Lubell Y, Dondorp A, Guérin PJ, Drake T, Meek S, et al. Artemisinin resistance
– modelling the potential human and economic costs. Malar J. 2014;13:452.4. Amaratunga C, Lim P, Suon S, Mao S, Sopha C, et al. Dihydroartemisinin–
piperaquine resistance in Plasmodium falciparum malaria in Cambodia: amultisite prospective cohort study. Lancet Infect Dis. 2016;16:357-65.
5. Imwong M, Suwannasin K, Kunasol C, Sutawong K, Mayxay M, et al. Thespread of artemisinin-resistant Plasmodium falciparum in the GreaterMekong subregion: a molecular epidemiology observational study. LancetInfect Dis. 2017;17:491–7.
6. Thanh NV, Thuy-Nhien N, Tuyen NTK, Tong NT, Nha-Ca NT, et al. Rapiddecline in the susceptibility of Plasmodium falciparum todihydroartemisinin–piperaquine in the south of Vietnam. Malar J. 2017;16:27.
7. Hott A, Casandra D, Sparks KN, Morton LC, Castanares GG, et al. Artemisinin-resistant Plasmodium falciparum parasites exhibit altered patterns ofdevelopment in infected erythrocytes. Antimicrob Agents Chemother.2015;59:3156–67.
8. Klonis N, Creek DJ, Tilley L. Iron and heme metabolism in Plasmodiumfalciparum and the mechanism of action of artemisinins. Curr OpinMicrobiol. 2013;16:722-727.
9. Saralamba S, Pan-Ngum W, Maude RJ, Lee SJ, Tarning J, et al. Intrahostmodeling of artemisinin resistance in Plasmodium falciparum. Proc NatlAcad Sci. 2011;108:397–402.
10. Zhang M, Gallego-Delgado J, Fernandez-Arias C, Waters NC, Rodriguez A, etal. Inhibiting the Plasmodium eIF2α kinase PK4 prevents artemisinin-induced latency. Cell Host Microbe. 2017;22:766–76 e764.
11. Mok S, Ashley EA, Ferreira PE, Zhu L, Lin Z, et al. Drug resistance. Populationtranscriptomics of human malaria parasites reveals the mechanism ofartemisinin resistance. Science. 2015;347:431–5.
12. Rocamora F, Zhu L, Liong KY, Dondorp A, Miotto O, et al. Oxidative stressand protein damage responses mediate artemisinin resistance in malariaparasites. PLoS Pathog. 2018;14:e1006930.
13. Ariey F, Witkowski B, Amaratunga C, Beghain J, Langlois AC, et al. Amolecular marker of artemisinin-resistant Plasmodium falciparum malaria.Nature. 2014;505:50-55.
14. Miotto O, Amato R, Ashley EA, MacInnis B, Almagro-Garcia J, et al. Geneticarchitecture of artemisinin-resistant Plasmodium falciparum. Nat Genet.2015;47:226–34.
15. Ghorbal M, Gorman M, Macpherson CR, Martins RM, Scherf A, et al. Genomeediting in the human malaria parasite Plasmodium falciparum using theCRISPR-Cas9 system. Nat Biotechnol. 2014;32:819–21.
16. Straimer J, Gnadig NF, Witkowski B, Amaratunga C, Duru V, et al. Drugresistance. K13-propeller mutations confer artemisinin resistance inPlasmodium falciparum clinical isolates. Science. 2015;347:428–31.
17. Mbengue A, Bhattacharjee S, Pandharkar T, Liu H, Estiu G, et al. A molecularmechanism of artemisinin resistance in Plasmodium falciparum malaria.Nature. 2015;520:683–7.
18. Zhang DD, Lo SC, Cross JV, Templeton DJ, Hannink M. Keap1 is a redox-regulated substrate adaptor protein for a Cul3-dependent ubiquitin ligasecomplex. Mol Cell Biol. 2004;24:10941–53.
19. Birnbaum J, Flemming S, Reichard N, Soares AB, Mesen-Ramirez P, et al. Agenetic system to study Plasmodium falciparum protein function. NatMethods. 2017;14:450–6.
20. Zhang M, Wang C, Otto TD, Oberstaller J, Liao X, et al. Uncovering theessential genes of the human malaria parasite Plasmodium falciparum bysaturation mutagenesis. Science. 2018;360:506-518.
21. Pradhan A, Siwo GH, Singh N, Martens B, Balu B, et al. Chemogenomicprofiling of Plasmodium falciparum as a tool to aid antimalarial drugdiscovery. Sci Rep. 2015;5:15930.
22. Dogovski C, Xie SC, Burgio G, Bridgford J, Mok S, et al. Targeting the cellstress response of Plasmodium falciparum to overcome artemisininresistance. PLoS Biol. 2015;13:e1002132.
23. Bronner IF, Otto TD, Zhang M, Udenze K, Wang C, et al. Quantitativeinsertion-site sequencing (QIseq) for high throughput phenotyping oftransposon mutants. Genome Res. 2016;26:980–9.
24. Thomas P, Sedillo J, Oberstaller J, Li S, Zhang M, et al. Phenotypicscreens identify parasite genetic factors associated with malarial feverresponse in Plasmodium falciparum piggyBac mutants. mSphere. 2016;1:e00273–16.
25. Bozdech Z, Llinas M, Pulliam BL, Wong ED, Zhu J, et al. The transcriptome ofthe intraerythrocytic developmental cycle of Plasmodium falciparum. PLoSBiol. 2003;1:E5.
26. Luo W, Friedman MS, Shedden K, Hankenson KD, Woolf PJ. GAGE: generallyapplicable gene set enrichment for pathway analysis. BMC Bioinformatics.2009;10:161.
27. Kanehisa M, Goto S, Sato Y, Furumichi M, Tanabe M. Kegg for integrationand interpretation of large-scale molecular data sets. Nucleic Acids Res.2012;40:D109-D114.
28. Mok S, Imwong M, Mackinnon MJ, Sim J, Ramadoss R, et al. Artemisininresistance in Plasmodium falciparum is associated with an altered temporalpattern of transcription. BMC Genomics. 2011;12:391.
Gibbons et al. BMC Genomics (2018) 19:849 Page 13 of 14
29. Date SV, Stoeckert CJ Jr. Computational modeling of the Plasmodiumfalciparum interactome reveals protein function on a genome-wide scale.Genome Res. 2006;16:542–9.
30. Campbell TL, De Silva EK, Olszewski KL, Elemento O, Llinas M.Identification and genome-wide prediction of DNA binding specificitiesfor the ApiAP2 family of regulators from the malaria parasite. PLoSPathog. 2010;6:e1001165.
31. Gunasekera AM, Myrick A, Roch KL, Winzeler E, Wirth DF. Plasmodiumfalciparum: genome wide perturbations in transcript profiles among mixedstage cultures after chloroquine treatment. Exp Parasitol. 2007;117:87–92.
32. Ganesan K, Ponmee N, Jiang L, Fowble JW, White J, et al. Agenetically hard-wired metabolic transcriptome in Plasmodiumfalciparum fails to mount protective responses to lethal antifolates.PLoS Pathog. 2008;4:e1000214.
33. Mootha VK, Lindgren CM, Eriksson KF, Subramanian A, Sihag S, et al. PGC-1alpha-responsive genes involved in oxidative phosphorylation arecoordinately downregulated in human diabetes. Nat Genet. 2003;34:267–73.
34. Witkowski B, Amaratunga C, Khim N, Sreng S, Chim P, et al. Novelphenotypic assays for the detection of artemisinin-resistant Plasmodiumfalciparum malaria in Cambodia: in-vitro and ex-vivo drug-response studies.Lancet Infect Dis. 2013;13:1043–9.
35. Singh GP, Goel P, Sharma A. Structural mapping of Kelch13 mutationsassociated with artemisinin resistance in malaria. J Struct Funct Genom.2016:17:1–6.
36. Turnbull LB, Siwo GH, Button-Simons KA, Tan A, Checkley LA, et al.Simultaneous genome-wide gene expression and transcript isoformprofiling in the human malaria parasite. PLoS One. 2017;12:e0187595.
37. Kim D, Langmead B, Salzberg SL. HISAT: a fast spliced aligner with lowmemory requirements. Nat Methods. 2015;12:357.
38. Liao Y, Smyth GK, Shi W. featureCounts: an efficient general purposeprogram for assigning sequence reads to genomic features. Bioinformatics.2014;30:923–30.
39. Trapnell C, Roberts A, Goff L, Pertea G, Kim D, et al. Differential gene andtranscript expression analysis of RNA-seq experiments with TopHat andCufflinks. Nat Protoc. 2012;7:562–78.
40. Holm S. A simple sequentially rejective multiple test procedure. Scand JStat. 1979;6:65–70.
41. Robinson MD, McCarthy DJ, Smyth GK. edgeR: a Bioconductor package fordifferential expression analysis of digital gene expression data.Bioinformatics. 2010;26:139–40.
42. Robinson MD, Oshlack A. A scaling normalization method for differentialexpression analysis of RNA-seq data. Genome Biol. 2010;11:1–9.
43. Benjamini Y, Hochberg Y. Controlling the false discovery rate: a practicaland powerful approach to multiple testing. J R Stat Soc Ser B Methodol.1995;57:289–300.
44. Rahmatallah Y, Zybailov B, Emmert-Streib F, Glazko G. GSAR: bioconductorpackage for gene set analysis in R. BMC Bioinformatics. 2017;18:61.
45. Aurrecoechea C, Brestelli J, Brunk BP, Dommer J, Fischer S, et al. PlasmoDB:a functional genomic database for malaria parasites. Nucleic Acids Res.2009;37:D539-D543.
46. Alexa A, Rahnenfuhrer J. topGO: enrichment analysis for gene ontology. Rpackage version 2.6.0; 2010.
47. Carlson M. org.Pf.plasmo.db: Genome wide annotation for malaria. Rpackage version 36.0; 2018.
Gibbons et al. BMC Genomics (2018) 19:849 Page 14 of 14