alrosa: the diamond investment opportunity 2014 investor presentation 0 75 117 ... largest mine in...
TRANSCRIPT

April 2014
Investor Presentation
0
75
117
190
222
254
231
243
255
1
110
179
236
27
52
209
235
255
222
226
228
236
238
239

2
Disclaimer
The information contained herein has been prepared for the use in this Presentation (the “Presentation”) and has not been independently verified. Such information is confidential
and is being provided to you solely for your information and may not be reproduced, retransmitted, further distributed to any other person or published, in whole or in part, for any
purpose.
The opinions presented herein are based on general information gathered at the time of writing and are subject to change without notice. Certain industry, market and competitive
position data contained in this Prospectus come from official or third party sources believed to be reliable but ALROSA does not guarantee its accuracy or completeness.
This Presentation contains statements about future events and expectations that are forward-looking statements. Any statement in this Presentation that is not a statement of
historical fact is a forward-looking statement that involves known and unknown risks, uncertainties and other factors which may cause the ALROSA’s actual results, performance
or achievements to be materially different from any future results, performance or achievements expressed or implied by such forward-looking statements. Past performance
should not be taken as an indication or guarantee of future results, and no representation or warranty, express or implied, is made regarding future performance. ALROSA
assumes no obligation to update, supplement or revise forward-looking or any other statements contained herein to reflect actual results, changes in assumptions or changes in
factors affecting these statements. ALROSA does not intend or have any duty or obligation to update or to keep current any information contained in this Presentation.
The diamond resources and reserves estimates provided in this Presentation have been prepared and presented in accordance with the standards and classifications of the
JORC Code (the Australasian Code for Reporting of Exploration Results, Mineral Resources and Ore Reserves as promulgated by the Australasian Joint Ore Reserves
Committee), which differ in significant respects from the standards and classifications applicable to the disclosure of mineral resources and reserves under the laws and
regulations of certain other jurisdictions, including the regulations of the U.S. Securities Exchange Commission (the “SEC”) with respect to registration statements and other
documents filed with the SEC. Among other things, in accordance with the JORC Code, this Presentation provides certain mineral resources estimates classified as “inferred”,
“indicated” or “measured”, which differ in significant respects from “probable” and “proven” mineral reserves estimates and are not disclosed in certain jurisdictions, including in
SEC filings. There can be significant uncertainty as to whether mineral resources can ever be feasibly and commercially mined. For further explanation of the JORC Code, see
the JORC website at www.jorc.org.
This Presentation does not constitute an offer to sell, or any solicitation of any offer to subscribe for or purchase, any securities. No part of this Presentation, nor the fact of its
distribution, should form any basis of, or be relied on in connection with, any contract or commitment or investment decision whatsoever.
The information in this Presentation is subject to verification, completion and change. No representation or warranty or undertaking, express or implied, is made as to, and no
reliance should be placed on, the accuracy or completeness of the information or opinions contained in this Presentation. None of ALROSA nor any of its shareholders, directors,
officers or employees, affiliates, advisors, representatives nor any other person accepts any liability whatsoever for any loss howsoever arising from any use of this Presentation
or its contents or otherwise arising in connection therewith.
This Presentation is not directed to, or intended for distribution to or use by, any person or entity that is a citizen or resident or located in any locality, state, country or other
jurisdiction where such distribution, publication, availability or use would be contrary to law or regulation or which would require any registration or licensing within such
jurisdiction.
This Presentation is not for distribution, directly or indirectly, to the public in the United States (including its territories and possessions, any State of the United States and the
District of Columbia). These materials are not an offer or solicitation to purchase or subscribe for securities in the United States or any other jurisdiction. Securities may not be
offered or sold in the United States absent registration with the U.S. Securities and Exchange Commission or an exemption from registration under the U.S. Securities Act of
1933, as amended. ALROSA does not intend to register any part of any offering in the United States or to conduct a public offering of any of its securities in the United States.
By attending a meeting where this Presentation is made or reviewing this Presentation you acknowledge and agree to be bound by the foregoing.
3
ALROSA at a Glance
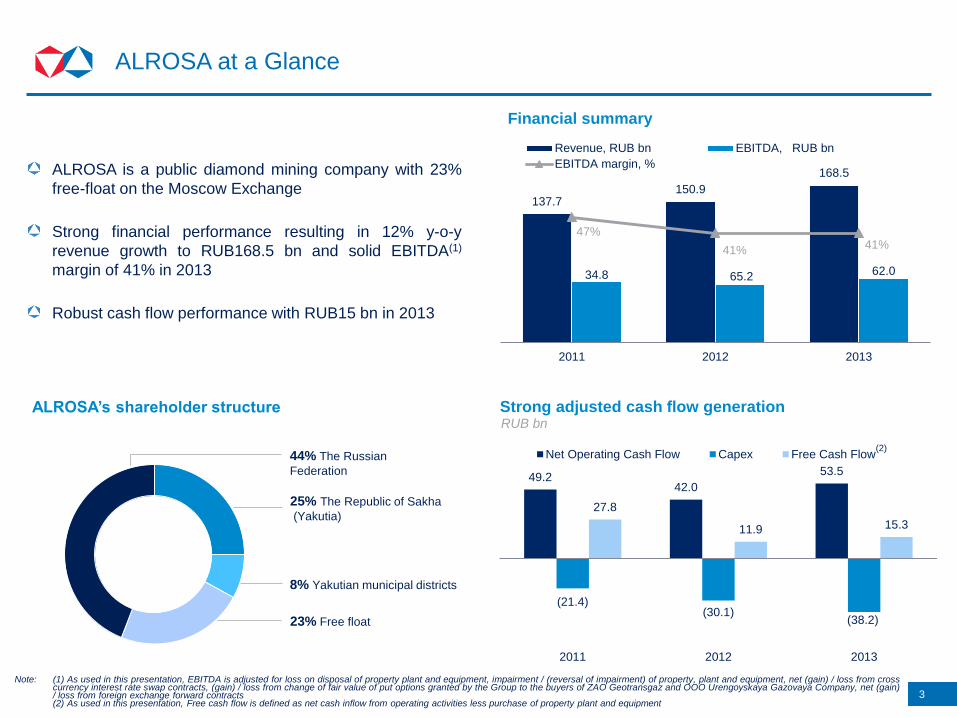
44% The Russian
Federation
25% The Republic of Sakha
(Yakutia)
8% Yakutian municipal districts
23% Free float
ALROSA is a public diamond mining company with 23%
free-float on the Moscow Exchange
Strong financial performance resulting in 12% y-o-y
revenue growth to RUB168.5 bn and solid EBITDA(1)
margin of 41% in 2013
Robust cash flow performance with RUB15 bn in 2013
ALROSA’s shareholder structure
Note: (1) As used in this presentation, EBITDA is adjusted for loss on disposal of property plant and equipment, impairment / (reversal of impairment) of property, plant and equipment, net (gain) / loss from cross currency interest rate swap contracts, (gain) / loss from change of fair value of put options granted by the Group to the buyers of ZAO Geotransgaz and OOO Urengoyskaya Gazovaya Company, net (gain) / loss from foreign exchange forward contracts
(2) As used in this presentation, Free cash flow is defined as net cash inflow from operating activities less purchase of property plant and equipment
137.7 150.9
168.5
34.8 65.2 62.0
47%
41% 41%
2011 2012 2013
Revenue, RUB bn EBITDA, RUB bn
EBITDA margin, %
Financial summary
49.2 42.0
53.5
(21.4) (30.1)
(38.2)
27.8
11.9 15.3
2011 2012 2013
Net Operating Cash Flow Capex Free Cash Flow
Strong adjusted cash flow generation RUB bn
(2)
Source: Company data, public sources
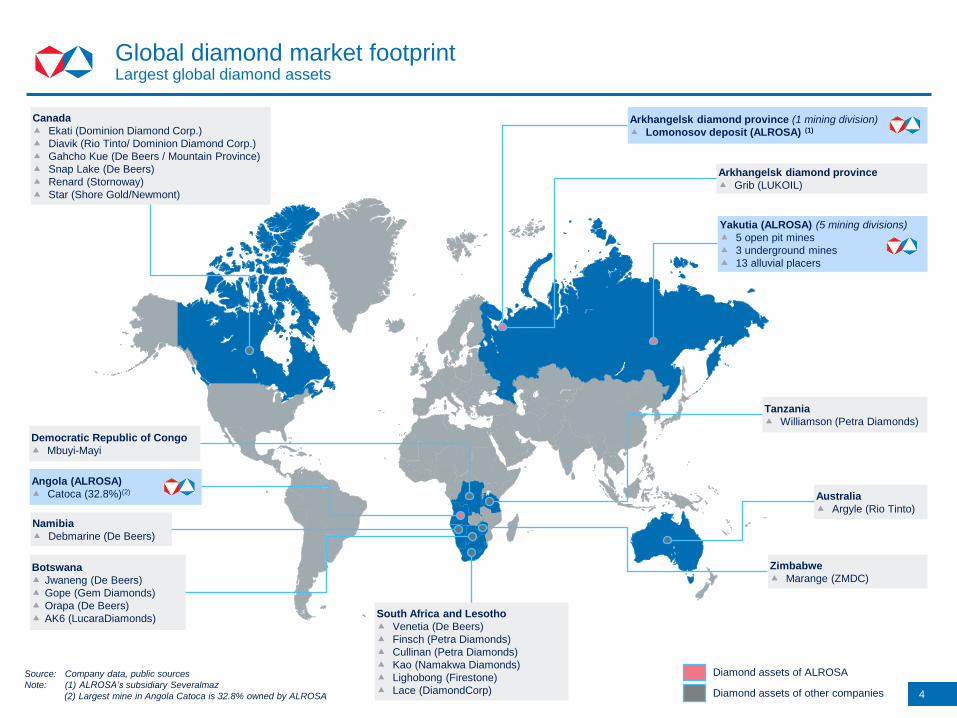
Note: (1) ALROSA’s subsidiary Severalmaz
(2) Largest mine in Angola Catoca is 32.8% owned by ALROSA
4
Global diamond market footprint Largest global diamond assets
Australia
Argyle (Rio Tinto)
Diamond assets of ALROSA
Diamond assets of other companies
South Africa and Lesotho
Venetia (De Beers)
Finsch (Petra Diamonds)
Cullinan (Petra Diamonds)
Kao (Namakwa Diamonds)
Lighobong (Firestone)
Lace (DiamondCorp)
Tanzania
Williamson (Petra Diamonds)
Yakutia (ALROSA) (5 mining divisions)
5 open pit mines
3 underground mines
13 alluvial placers
Botswana
Jwaneng (De Beers)
Gope (Gem Diamonds)
Orapa (De Beers)
AK6 (LucaraDiamonds)
Angola (ALROSA)
Catoca (32.8%)(2)
Canada
Ekati (Dominion Diamond Corp.)
Diavik (Rio Tinto/ Dominion Diamond Corp.)
Gahcho Kue (De Beers / Mountain Province)
Snap Lake (De Beers)
Renard (Stornoway)
Star (Shore Gold/Newmont)
Democratic Republic of Congo
Mbuyi-Mayi
Arkhangelsk diamond province (1 mining division)
Lomonosov deposit (ALROSA) (1)
Arkhangelsk diamond province
Grib (LUKOIL)
Zimbabwe
Marange (ZMDC)
Namibia
Debmarine (De Beers)
5
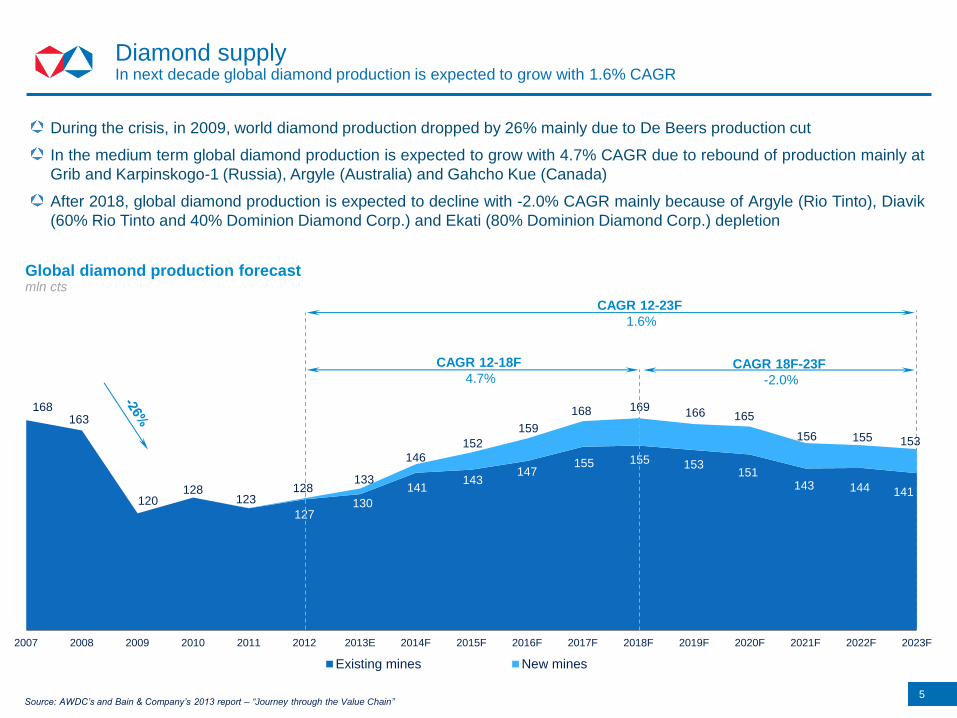
Diamond supply In next decade global diamond production is expected to grow with 1.6% CAGR
During the crisis, in 2009, world diamond production dropped by 26% mainly due to De Beers production cut
In the medium term global diamond production is expected to grow with 4.7% CAGR due to rebound of production mainly at
Grib and Karpinskogo-1 (Russia), Argyle (Australia) and Gahcho Kue (Canada)
After 2018, global diamond production is expected to decline with -2.0% CAGR mainly because of Argyle (Rio Tinto), Diavik
(60% Rio Tinto and 40% Dominion Diamond Corp.) and Ekati (80% Dominion Diamond Corp.) depletion
Source: AWDC’s and Bain & Company’s 2013 report – “Journey through the Value Chain”
CAGR 12-18F
4.7% CAGR 18F-23F
-2.0%
CAGR 12-23F
1.6%
mln cts
127 130
141 143
147 155 155 153
151 143 144 141
168 163
120 128
123 128
133
146
152
159
168 169 166 165
156 155 153
2007 2008 2009 2010 2011 2012 2013E 2014F 2015F 2016F 2017F 2018F 2019F 2020F 2021F 2022F 2023F
Existing mines New mines
Global diamond production forecast
2007 2008 2009 2010 2011 2012 2013 2014 2015 2016 2017 2018 2019 2020 2021 2022 2023
Other Gulf Europe Japan
India China USA
6
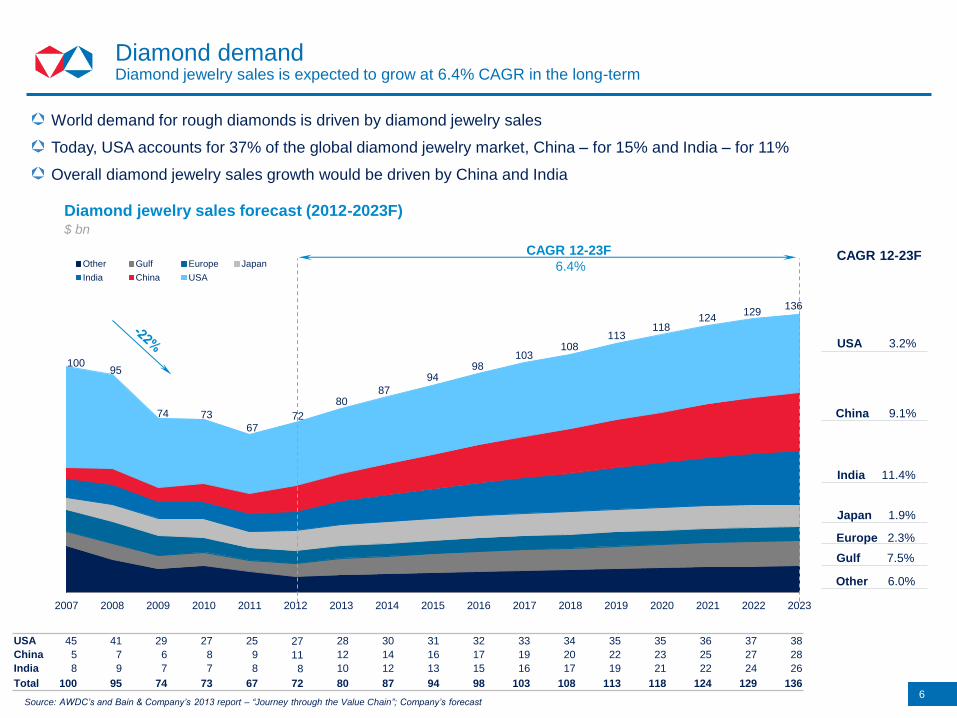
Diamond demand Diamond jewelry sales is expected to grow at 6.4% CAGR in the long-term
World demand for rough diamonds is driven by diamond jewelry sales
Today, USA accounts for 37% of the global diamond jewelry market, China – for 15% and India – for 11%
Overall diamond jewelry sales growth would be driven by China and India
USA 45 41 29 27 25 27 28 30 31 32 33 34 35 35 36 37 38
China 5 7 6 8 9 11 12 14 16 17 19 20 22 23 25 27 28
India 8 9 7 7 8 8 10 12 13 15 16 17 19 21 22 24 26
Total 100 95 74 73 67 72 80 87 94 98 103 108 113 118 124 129 136
CAGR 12-23F
USA 3.2%
China 9.1%
Diamond jewelry sales forecast (2012-2023F)
India 11.4%
Source: AWDC’s and Bain & Company’s 2013 report – “Journey through the Value Chain”; Company’s forecast
$ bn
Japan 1.9%
CAGR 12-23F
6.4%
Europe 2.3%
Gulf 7.5%
Other 6.0%
100 95
74 73 72 67
80 87
94 98
103 108
113 118
124 136
129

7
Source: Company data, JORC as of 01 July 2013 (Micon) Note: (1) Resources are inclusive of reserves. Reserves and resources data in this presentation do not include reserves or resources of Catoca, which is a 32.8% investment and is not consolidated in
ALROSA’s financial statements (2) GKZ (the Russian State Commission for Mineral Reserves) as of 01 July 2013. Includes GKZ off-balance reserves of 27.2 mln cts (3) JORC as of 01 July 2013 (Micon). The Micon report as of 01 July 2013 covered all major deposits of ALROSA, excluding certain alluvial deposits and undeveloped resources
Republic of
Sakha
(Yakutia)
Russian Federation Yakutsk
Moscow
6 open pit mines
3 underground mines
13 alluvial placers
Total resources(1)
GKZ: 1,181 mln cts(2)
JORC: 973 mln cts(3)
Angola
Angola Investment
Open Underground Alluvial
Catoca Mining (32.8%) 8
Arkhangelsk
Severalmaz
7
Nyurba Division 2
Mirny Division 1
Aikhal Division 4
Nizhne-Lenskoe 6
Almazy Anabara 5
Udachny Division 3
ALROSA diamond assets overview Well-balanced portfolio of the mining assets in one of the resource richest regions of Russia
8
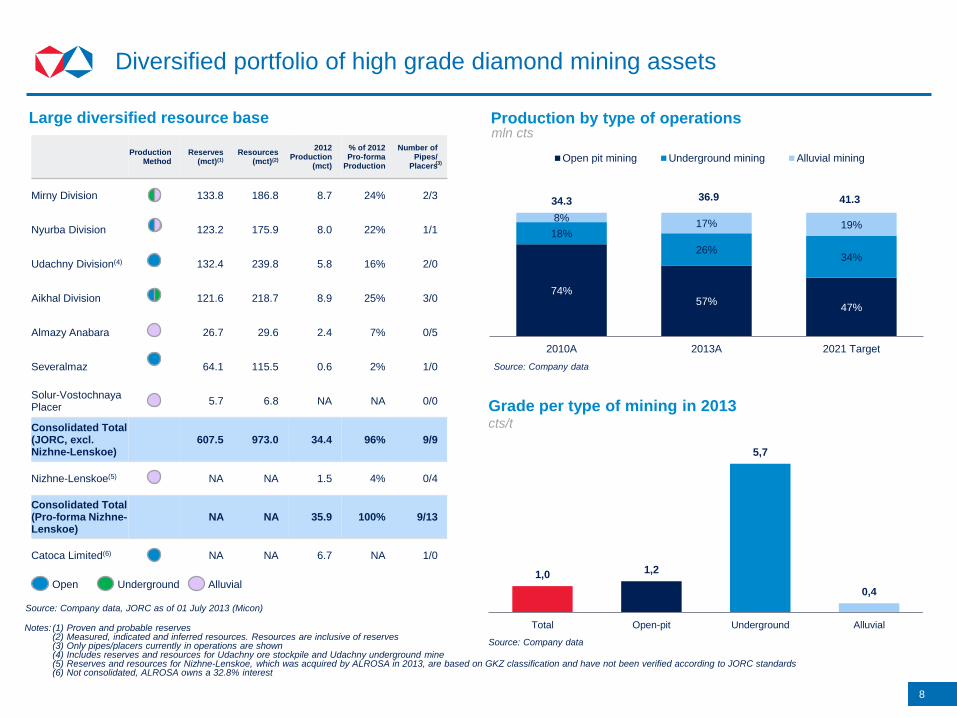
Notes: (1) Proven and probable reserves (2) Measured, indicated and inferred resources. Resources are inclusive of reserves (3) Only pipes/placers currently in operations are shown (4) Includes reserves and resources for Udachny ore stockpile and Udachny underground mine (5) Reserves and resources for Nizhne-Lenskoe, which was acquired by ALROSA in 2013, are based on GKZ classification and have not been verified according to JORC standards (6) Not consolidated, ALROSA owns a 32.8% interest
Diversified portfolio of high grade diamond mining assets
cts/t
Grade per type of mining in 2013
Source: Company data, JORC as of 01 July 2013 (Micon)
Source: Company data
Production Method
Reserves (mct)(1)
Resources (mct)(2)
2012 Production
(mct)
% of 2012 Pro-forma
Production
Number of Pipes/
Placers
Mirny Division 133.8 186.8 8.7 24% 2/3
Nyurba Division 123.2 175.9 8.0 22% 1/1
Udachny Division(4) 132.4 239.8 5.8 16% 2/0
Aikhal Division 121.6 218.7 8.9 25% 3/0
Almazy Anabara 26.7 29.6 2.4 7% 0/5
Severalmaz 64.1 115.5 0.6 2% 1/0
Solur-Vostochnaya Placer
5.7 6.8 NA NA 0/0
Consolidated Total (JORC, excl. Nizhne-Lenskoe)
607.5 973.0 34.4 96% 9/9
Nizhne-Lenskoe(5) NA NA 1.5 4% 0/4
Consolidated Total (Pro-forma Nizhne-Lenskoe)
NA NA 35.9 100% 9/13
Catoca Limited(6) NA NA 6.7 NA 1/0
Open Underground Alluvial
Production by type of operations
mln cts
Source: Company data
(3)
Large diversified resource base
74% 57%
47%
18%
26% 34%
8% 17% 19%
34.3
2010A 2013A 2021 Target
Open pit mining Underground mining Alluvial mining
36.9 41.3
1,0 1,2
5,7
0,4
Total Open-pit Underground Alluvial

9
Marketing strategy overview ALROSA is constantly improving and developing geographic and contract structure of its revenue
Geography of ALROSA marketing operations
Trading offices
Rep offices
Source: Company data
ALROSA Rough Diamonds Sales Structure
Sales of rough diamonds
Source: AWDC’s and Bain & Company’s 2013 report – “Journey through the Value Chain”;
сompanies’ reports
After ceasing rough diamond sales to De Beers in 2008, ALROSA has fully switched to direct sales to its customers and has been implementing a distribution strategy focusing on long-term contracts to improve stability of cash flows
Currently ALROSA conducts rough diamond sales through 3 main channels:
long-term contracts, which stipulate for the supply of rough diamonds consisting of the pre-agreed assortment and volume on a monthly basis – 64%
auctions – 21%
spot sales – 16%
The number of long-term clients increased to 41 in 2013 from 15 in 2009
78% 70%
22% 30%
2008 2012
ALROSA
Others
New York
Antwerp London
Geneva
Moscow
Ramat-Gan Dubai Hong Kong
Luanda
%
10
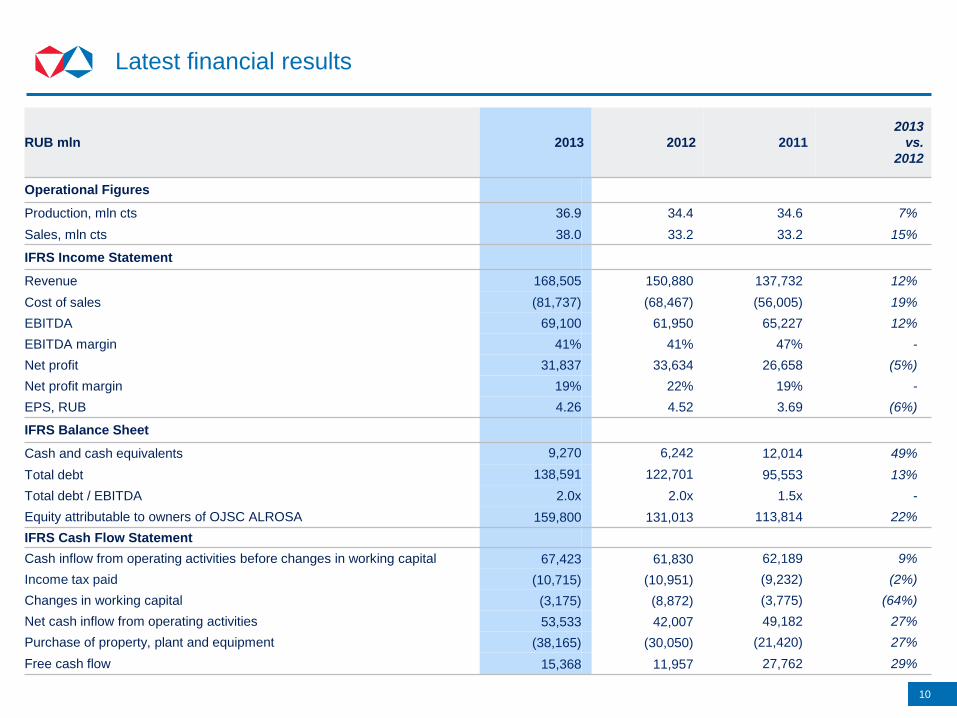
Latest financial results
RUB mln 2013 2012 2011
2013
vs.
2012
Operational Figures
Production, mln cts 36.9 34.4 34.6 7%
Sales, mln cts 38.0 33.2 33.2 15%
IFRS Income Statement
Revenue 168,505 150,880 137,732 12%
Cost of sales (81,737) (68,467) (56,005) 19%
EBITDA 69,100 61,950 65,227 12%
EBITDA margin 41% 41% 47% -
Net profit 31,837 33,634 26,658 (5%)
Net profit margin 19% 22% 19% -
EPS, RUB 4.26 4.52 3.69 (6%)
IFRS Balance Sheet
Cash and cash equivalents 9,270 6,242 12,014 49%
Total debt 138,591 122,701 95,553 13%
Total debt / EBITDA 2.0x 2.0x 1.5x -
Equity attributable to owners of OJSC ALROSA 159,800 131,013 113,814 22%
IFRS Cash Flow Statement
Cash inflow from operating activities before changes in working capital 67,423 61,830 62,189 9%
Income tax paid (10,715) (10,951) (9,232) (2%)
Changes in working capital (3,175) (8,872) (3,775) (64%)
Net cash inflow from operating activities 53,533 42,007 49,182 27%
Purchase of property, plant and equipment (38,165) (30,050) (21,420) 27%
Free cash flow 15,368 11,957 27,762 29%

11
Revenue increased due to higher diamond sales and increased revenue from sales of gas
Revenue in 2012 Increase in revenue from
diamond sales
Increase in revenue from
sales of gas Increase in other revenue Decrease in revenue from
transport
Decrease in revenue from
social infrastructure Revenue in 2013
150,880
12,882
5,359 523
(773) (366)
168,505 +12%
Revenue dynamics RUB mln
+9% 19х (14%) (12%) +9%
12
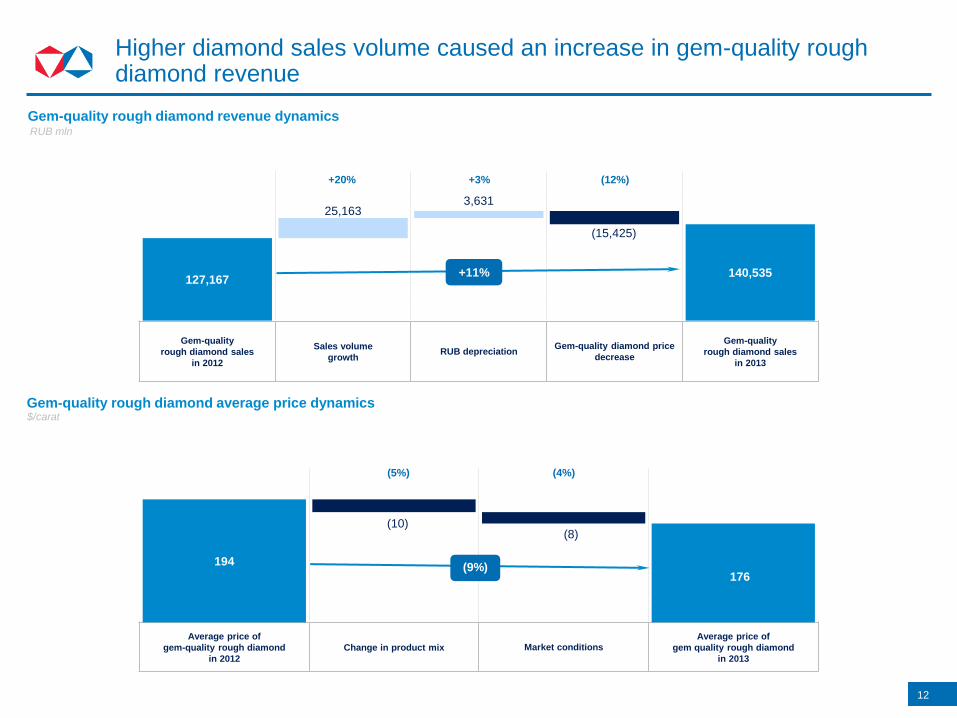
Higher diamond sales volume caused an increase in gem-quality rough diamond revenue
Gem-quality
rough diamond sales
in 2012
Sales volume
growth RUB depreciation
Gem-quality diamond price
decrease
Gem-quality
rough diamond sales
in 2013
127,167
25,163 3,631
(15,425)
140,535 +11%
Gem-quality rough diamond revenue dynamics RUB mln
Gem-quality rough diamond average price dynamics $/carat
Average price of
gem-quality rough diamond
in 2012
Change in product mix Market conditions Average price of
gem quality rough diamond
in 2013
194
(10) (8)
176 (9%)
+3% (12%) +20%
(5%) (4%)

13
74,471 83,160
2012 2013
Cost of production RUB mln
+12%
+7% Production volume growth
+5% Growth of expenses
68,467
81,737
2012 2013
+19%
+15% Sales volume growth
+4% Growth of expenses
Cost of sales RUB mln
Cost of production and cost of sales grew mainly due to increased volumes
14
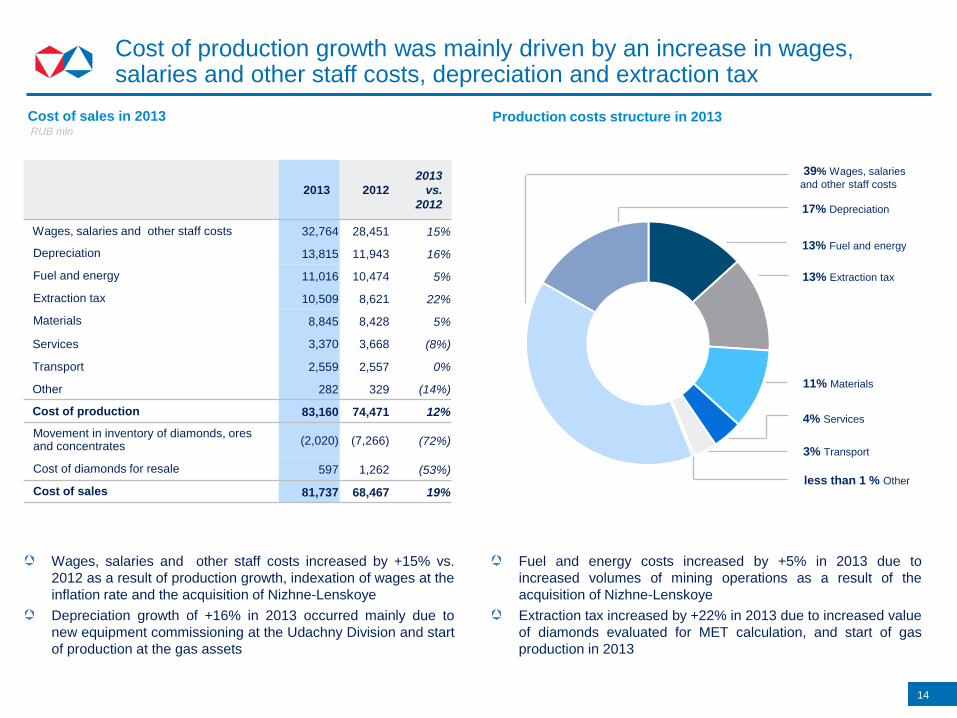
Cost of production growth was mainly driven by an increase in wages, salaries and other staff costs, depreciation and extraction tax
2013 2012
2013
vs.
2012
Wages, salaries and other staff costs 32,764 28,451 15%
Depreciation 13,815 11,943 16%
Fuel and energy 11,016 10,474 5%
Extraction tax 10,509 8,621 22%
Materials 8,845 8,428 5%
Services 3,370 3,668 (8%)
Transport 2,559 2,557 0%
Other 282 329 (14%)
Cost of production 83,160 74,471 12%
Movement in inventory of diamonds, ores and concentrates (2,020) (7,266) (72%)
Cost of diamonds for resale 597 1,262 (53%)
Cost of sales 81,737 68,467 19%
Wages, salaries and other staff costs increased by +15% vs.
2012 as a result of production growth, indexation of wages at the
inflation rate and the acquisition of Nizhne-Lenskoye
Depreciation growth of +16% in 2013 occurred mainly due to
new equipment commissioning at the Udachny Division and start
of production at the gas assets
Production costs structure in 2013
13% Fuel and energy
39% Wages, salaries
and other staff costs
Fuel and energy costs increased by +5% in 2013 due to
increased volumes of mining operations as a result of the
acquisition of Nizhne-Lenskoye
Extraction tax increased by +22% in 2013 due to increased value
of diamonds evaluated for MET calculation, and start of gas
production in 2013
13% Extraction tax
17% Depreciation
4% Services
3% Transport
11% Materials
Cost of sales in 2013 RUB mln
less than 1 % Other
15
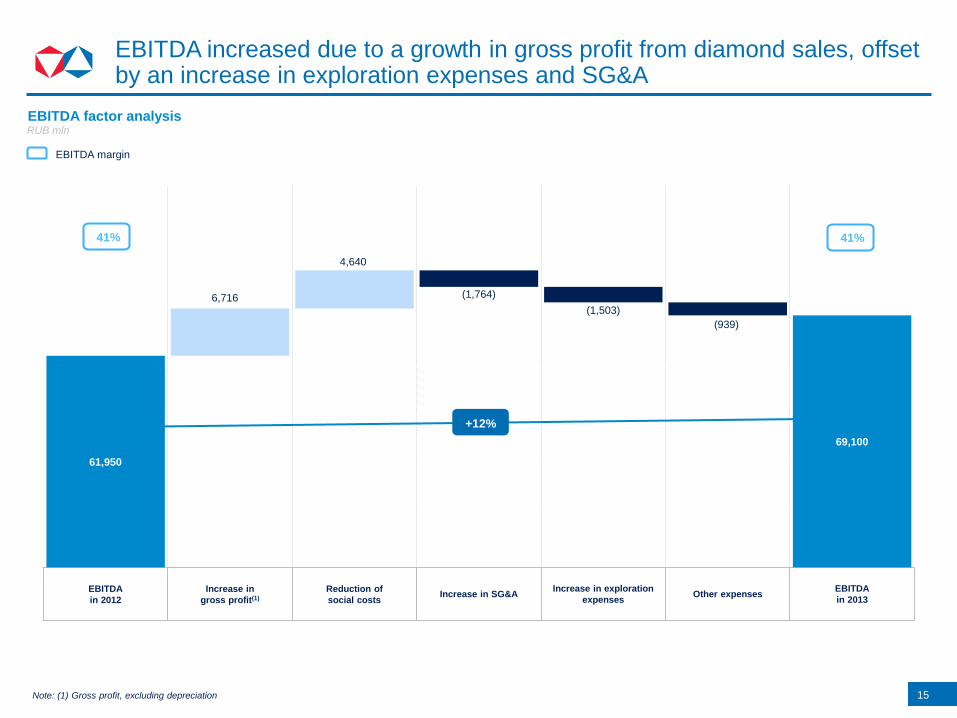
EBITDA increased due to a growth in gross profit from diamond sales, offset by an increase in exploration expenses and SG&A
EBITDA
in 2012
Increase in
gross profit(1)
Reduction of
social costs Increase in SG&A
Increase in exploration
expenses Other expenses
EBITDA
in 2013
61,950
6,716
4,640
(1,764)
(1,503)
(939)
69,100
+12%
41% 41%
RUB mln
EBITDA margin
EBITDA factor analysis
Note: (1) Gross profit, excluding depreciation
16
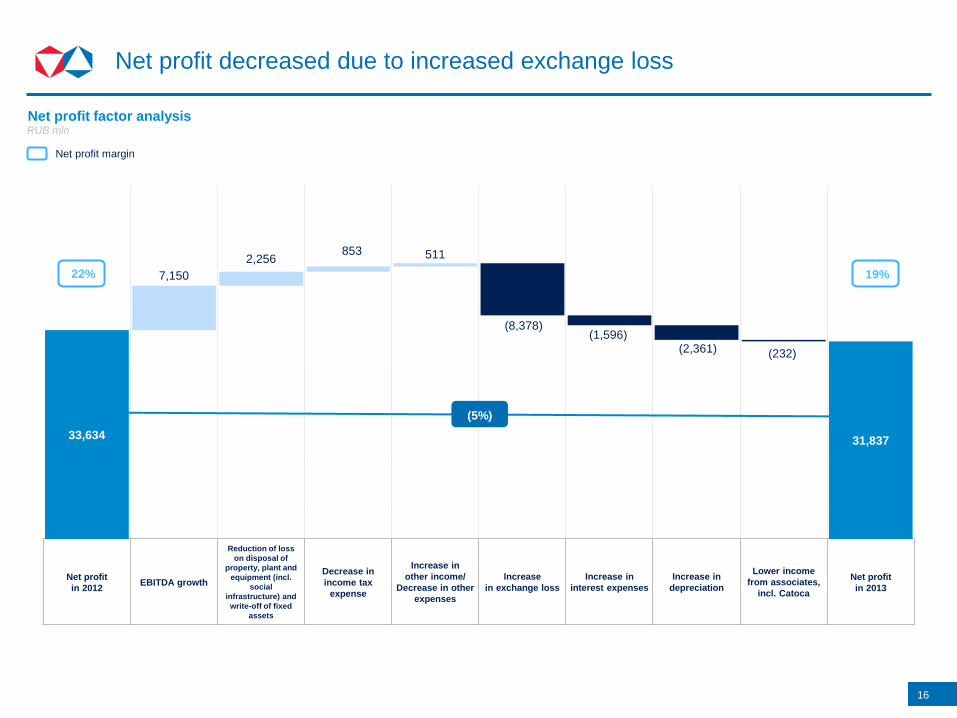
Net profit decreased due to increased exchange loss
Net profit
in 2012 EBITDA growth
Reduction of loss
on disposal of
property, plant and
equipment (incl.
social
infrastructure) and
write-off of fixed
assets
Decrease in
income tax
expense
Increase in
other income/
Decrease in other
expenses
Increase
in exchange loss
Increase in
interest expenses
Increase in
depreciation
Lower income
from associates,
incl. Catoca
Net profit
in 2013
33,634
7,150
2,256 853 511
(8,378) (1,596)
(2,361) (232)
31,837
(5%)
19% 22%
Net profit margin
RUB mln
Net profit factor analysis
17
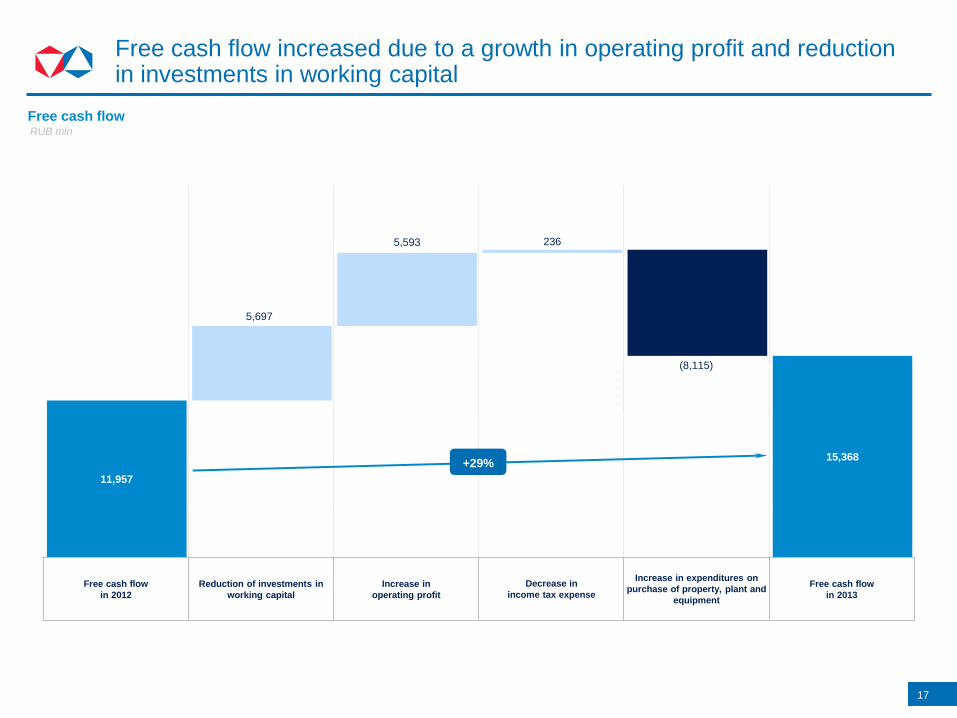
Free cash flow increased due to a growth in operating profit and reduction in investments in working capital
Free cash flow
in 2012
Reduction of investments in
working capital
Increase in
operating profit
Decrease in
income tax expense
Increase in expenditures on
purchase of property, plant and
equipment
Free cash flow
in 2013
11,957
5,697
5,593 236
(8,115)
15,368 +29%
RUB mln
Free cash flow
18
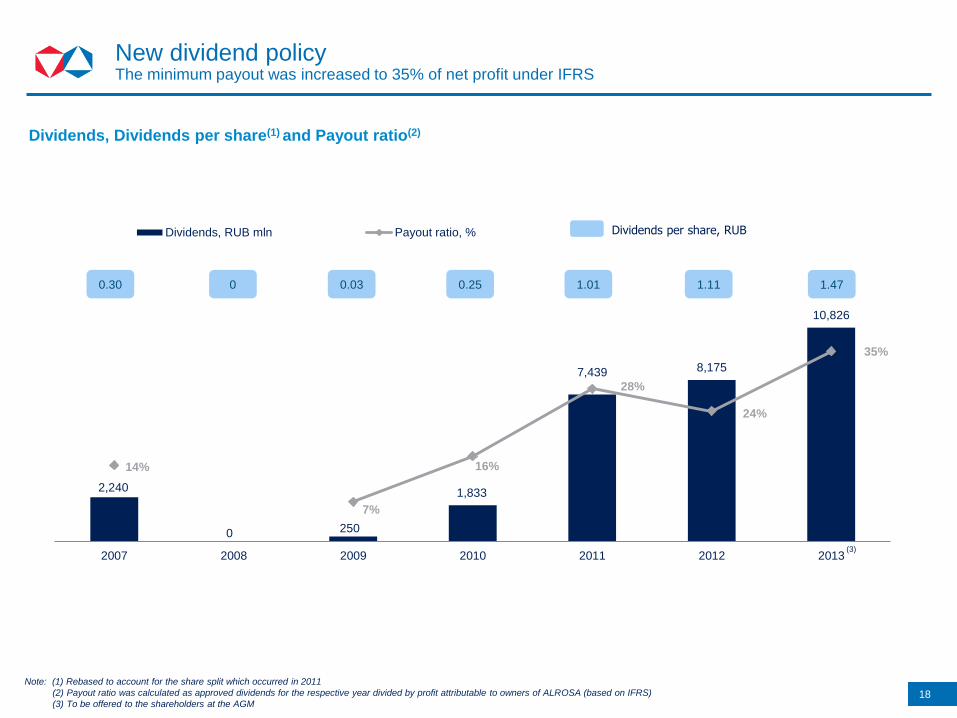
New dividend policy The minimum payout was increased to 35% of net profit under IFRS
Dividends, Dividends per share(1) and Payout ratio(2)
(3)
2,240
0 250
1,833
7,439 8,175
10,826
14%
7%
16%
28%
24%
35%
0
0,05
0,1
0,15
0,2
0,25
0,3
0,35
0,4
2007 2008 2009 2010 2011 2012 2013
Dividends, RUB mln Payout ratio, % Dividends per share, RUB
0.30 0 0.03 0.25 1.01 1.11 1.47
Note: (1) Rebased to account for the share split which occurred in 2011
(2) Payout ratio was calculated as approved dividends for the respective year divided by profit attributable to owners of ALROSA (based on IFRS)
(3) To be offered to the shareholders at the AGM

19
0
75
117
190
222
254
231
243
255
1
110
179
236
27
52
209
235
255
222
226
228
236
238
239
Appendix
20
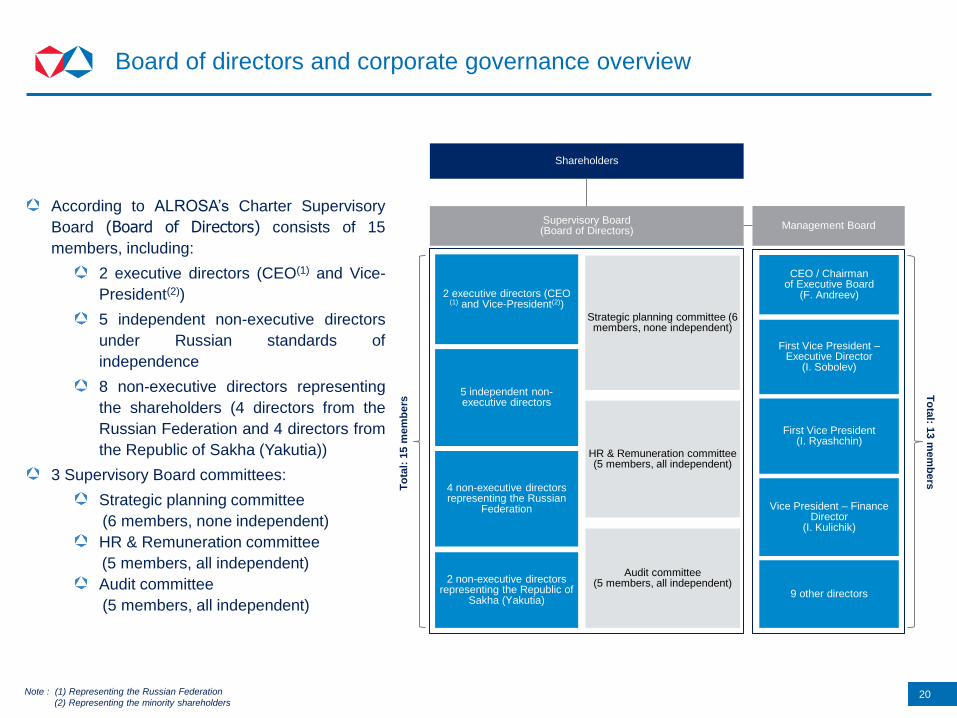
Board of directors and corporate governance overview
According to ALROSA’s Charter Supervisory
Board (Board of Directors) consists of 15
members, including:
2 executive directors (CEO(1) and Vice-
President(2))
5 independent non-executive directors
under Russian standards of
independence
8 non-executive directors representing
the shareholders (4 directors from the
Russian Federation and 4 directors from
the Republic of Sakha (Yakutia))
3 Supervisory Board committees:
Strategic planning committee
(6 members, none independent)
HR & Remuneration committee
(5 members, all independent)
Audit committee
(5 members, all independent)
Shareholders
Supervisory Board (Board of Directors)
Management Board
Strategic planning committee (6 members, none independent)
HR & Remuneration committee (5 members, all independent)
Audit committee (5 members, all independent)
2 executive directors (CEO (1) and Vice-President(2))
2 non-executive directors representing the Republic of
Sakha (Yakutia)
CEO / Chairman of Executive Board
(F. Andreev)
First Vice President – Executive Director
(I. Sobolev)
First Vice President (I. Ryashchin)
Vice President – Finance Director
(I. Kulichik)
9 other directors
To
tal:
15 m
em
be
rs T
ota
l: 13 m
em
be
rs
Note : (1) Representing the Russian Federation
(2) Representing the minority shareholders
5 independent non-executive directors
4 non-executive directors representing the Russian
Federation
21
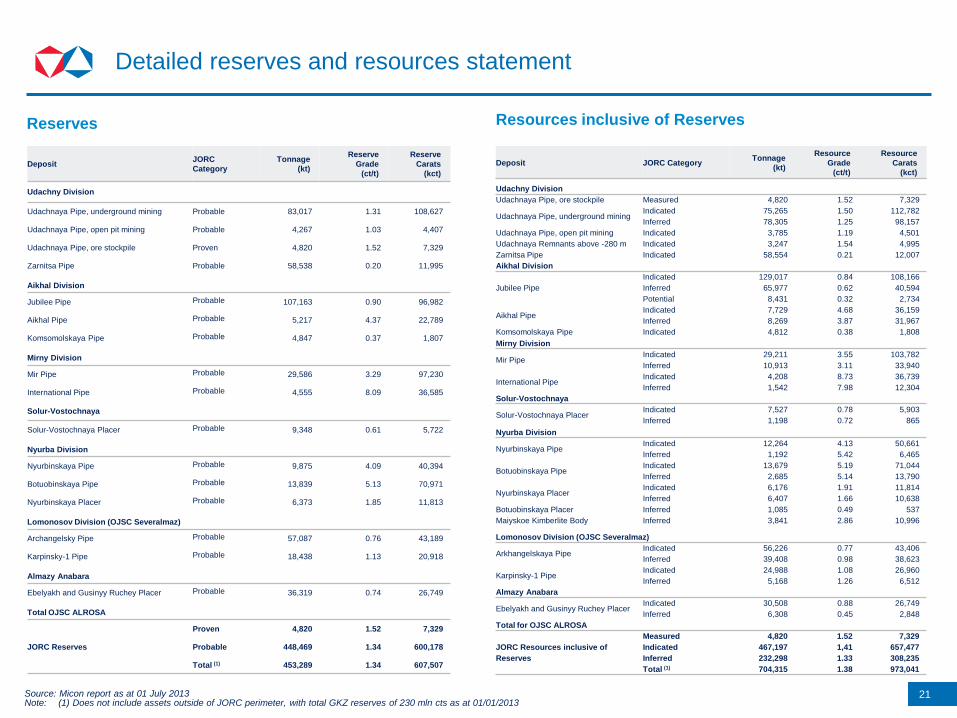
Detailed reserves and resources statement
Deposit JORC
Category
Tonnage
(kt)
Reserve
Grade
(ct/t)
Reserve
Carats
(kct)
Udachny Division
Udachnaya Pipe, underground mining Probable 83,017 1.31 108,627
Udachnaya Pipe, open pit mining Probable 4,267 1.03 4,407
Udachnaya Pipe, ore stockpile Proven 4,820 1.52 7,329
Zarnitsa Pipe Probable 58,538 0.20 11,995
Aikhal Division
Jubilee Pipe Probable 107,163 0.90 96,982
Aikhal Pipe Probable 5,217 4.37 22,789
Komsomolskaya Pipe Probable 4,847 0.37 1,807
Mirny Division
Mir Pipe Probable 29,586 3.29 97,230
International Pipe Probable 4,555 8.09 36,585
Solur-Vostochnaya
Solur-Vostochnaya Placer Probable 9,348 0.61 5,722
Nyurba Division
Nyurbinskaya Pipe Probable 9,875 4.09 40,394
Botuobinskaya Pipe Probable 13,839 5.13 70,971
Nyurbinskaya Placer Probable 6,373 1.85 11,813
Lomonosov Division (OJSC Severalmaz)
Archangelsky Pipe Probable 57,087 0.76 43,189
Karpinsky-1 Pipe Probable 18,438 1.13 20,918
Almazy Anabara
Ebelyakh and Gusinyy Ruchey Placer Probable 36,319 0.74 26,749
Total OJSC ALROSA
JORC Reserves
Proven 4,820 1.52 7,329
Probable 448,469 1.34 600,178
Total (1) 453,289 1.34 607,507
Reserves Resources inclusive of Reserves
Deposit JORC Category Tonnage
(kt)
Resource
Grade
(ct/t)
Resource
Carats
(kct)
Udachny Division
Udachnaya Pipe, ore stockpile Measured 4,820 1.52 7,329
Udachnaya Pipe, underground mining Indicated 75,265 1.50 112,782
Inferred 78,305 1.25 98,157
Udachnaya Pipe, open pit mining Indicated 3,785 1.19 4,501
Udachnaya Remnants above -280 m Indicated 3,247 1.54 4,995
Zarnitsa Pipe Indicated 58,554 0.21 12,007
Aikhal Division
Jubilee Pipe
Indicated 129,017 0.84 108,166
Inferred 65,977 0.62 40,594
Potential 8,431 0.32 2,734
Aikhal Pipe Indicated 7,729 4.68 36,159
Inferred 8,269 3.87 31,967
Komsomolskaya Pipe Indicated 4,812 0.38 1,808
Mirny Division
Mir Pipe Indicated 29,211 3.55 103,782
Inferred 10,913 3.11 33,940
International Pipe Indicated 4,208 8.73 36,739
Inferred 1,542 7.98 12,304
Solur-Vostochnaya
Solur-Vostochnaya Placer Indicated 7,527 0.78 5,903
Inferred 1,198 0.72 865
Nyurba Division
Nyurbinskaya Pipe Indicated 12,264 4.13 50,661
Inferred 1,192 5.42 6,465
Botuobinskaya Pipe Indicated 13,679 5.19 71,044
Inferred 2,685 5.14 13,790
Nyurbinskaya Placer Indicated 6,176 1.91 11,814
Inferred 6,407 1.66 10,638
Botuobinskaya Placer Inferred 1,085 0.49 537
Maiyskoe Kimberlite Body Inferred 3,841 2.86 10,996
Lomonosov Division (OJSC Severalmaz)
Arkhangelskaya Pipe Indicated 56,226 0.77 43,406
Inferred 39,408 0.98 38,623
Karpinsky-1 Pipe Indicated 24,988 1.08 26,960
Inferred 5,168 1.26 6,512
Almazy Anabara
Ebelyakh and Gusinyy Ruchey Placer Indicated 30,508 0.88 26,749
Inferred 6,308 0.45 2,848
Total for OJSC ALROSA
JORC Resources inclusive of
Reserves
Measured 4,820 1.52 7,329
Indicated 467,197 1,41 657,477
Inferred 232,298 1.33 308,235
Total (1) 704,315 1.38 973,041
Source: Micon report as at 01 July 2013 Note: (1) Does not include assets outside of JORC perimeter, with total GKZ reserves of 230 mln cts as at 01/01/2013

22
Diamond production
‘000 cts 2011 2012 2013 Q1
2013
Q2
2013
Q3
2013
Q4
2013
Q1
2014
Aikhal Division 5,262 8,945 12,088 1,984 3,669 2,456 3,978 3,000
Jubilee pipe 3,589 6,272 8,975 1,940 2,232 2,456 2,347 2,325
Aikhal underground mine 1,306 2,520 3,062 0 1,435 0 1,627 639
Komsomolskaya pipe 367 153 50 44 2 0 4 36
Mirny Division 8,138 8,707 7,361 1,792 1,778 1,885 1,907 1,477
International underground mine 5,912 5,915 4,378 1,082 1,047 1,099 1,150 1,312
Mir underground mine 1,321 1,855 2,151 471 597 518 565 52
Alluvial and technogenic deposits 905 936 833 239 134 268 192 113
Udachny Division 10,583 5,845 4,892 1,598 1,383 480 1,430 1,117
Udachnaya pipe 10,374 5,642 4,735 1,557 1,330 466 1,382 1,055
Zarnitsa pipe 209 203 157 42 53 14 48 62
Nyurba Division 7,478 7,956 7,407 1,978 1,076 2,022 2,331 2,067
Nyurbinskaya pipe 6,950 7,276 6,591 1,978 801 1,509 2,303 2,067
Alluvial deposits 528 680 816 0 275 513 28 0
Severalmaz 557 559 636 126 142 155 213 233
Arkhangelskaya pipe 557 559 636 126 142 155 213 233
Almazy Anabara 2,534 2,408 2,521 0 967 1,554 0 0
Nizhne-Lenskoye (1)
1,506 1,521 2,010 0 612 1,398 0 0
Total 34,552 34,420 36,914 7,478 9,627 9,949 9,860 7,894
Note: (1) In 2012 and earlier Nizhne-Lenskoye results are not included into ALROSA operational results
23
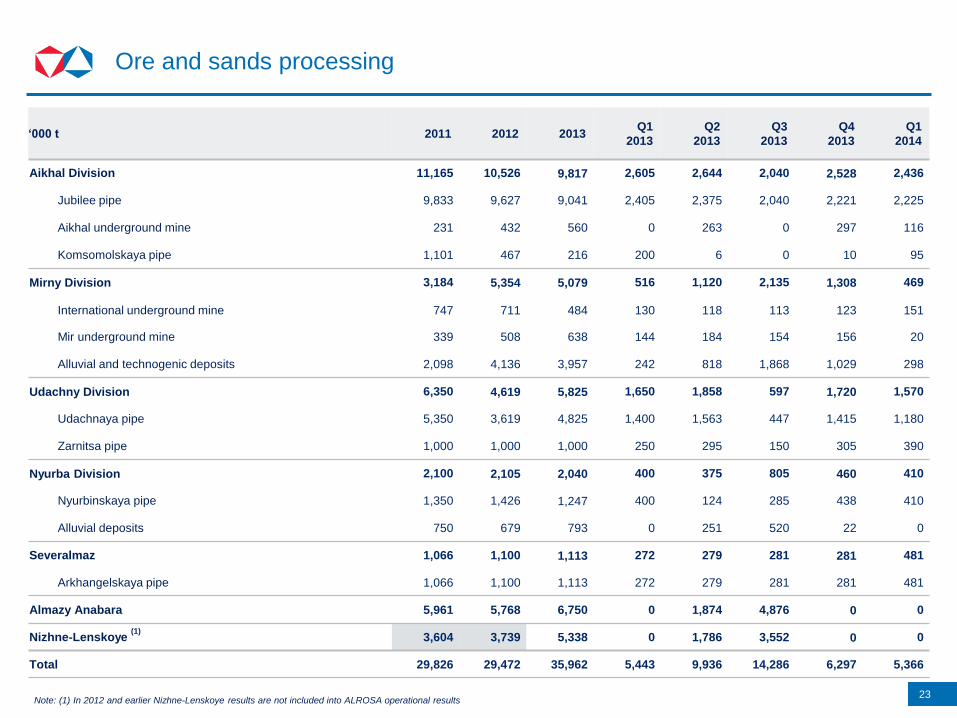
Ore and sands processing
‘000 t 2011 2012 2013 Q1
2013
Q2
2013
Q3
2013
Q4
2013
Q1
2014
Aikhal Division 11,165 10,526 9,817 2,605 2,644 2,040 2,528 2,436
Jubilee pipe 9,833 9,627 9,041 2,405 2,375 2,040 2,221 2,225
Aikhal underground mine 231 432 560 0 263 0 297 116
Komsomolskaya pipe 1,101 467 216 200 6 0 10 95
Mirny Division 3,184 5,354 5,079 516 1,120 2,135 1,308 469
International underground mine 747 711 484 130 118 113 123 151
Mir underground mine 339 508 638 144 184 154 156 20
Alluvial and technogenic deposits 2,098 4,136 3,957 242 818 1,868 1,029 298
Udachny Division 6,350 4,619 5,825 1,650 1,858 597 1,720 1,570
Udachnaya pipe 5,350 3,619 4,825 1,400 1,563 447 1,415 1,180
Zarnitsa pipe 1,000 1,000 1,000 250 295 150 305 390
Nyurba Division 2,100 2,105 2,040 400 375 805 460 410
Nyurbinskaya pipe 1,350 1,426 1,247 400 124 285 438 410
Alluvial deposits 750 679 793 0 251 520 22 0
Severalmaz 1,066 1,100 1,113 272 279 281 281 481
Arkhangelskaya pipe 1,066 1,100 1,113 272 279 281 281 481
Almazy Anabara 5,961 5,768 6,750 0 1,874 4,876 0 0
Nizhne-Lenskoye (1)
3,604 3,739 5,338 0 1,786 3,552 0 0
Total 29,826 29,472 35,962 5,443 9,936 14,286 6,297 5,366
Note: (1) In 2012 and earlier Nizhne-Lenskoye results are not included into ALROSA operational results

Thank you!
Foreign Affairs and Analytics Investor Relations
Russia, 119017, Moscow 10-12, 1-st Kazachy Per.
Tel.: +7 495 745 58 72 [email protected]
0
75
117
190
222
254
231
243
255
1
110
179
236
27
52
209
235
255
222
226
228
236
238
239