alpa documents - air line pilots association, international
TRANSCRIPT

Airline Industry Overview
David KriegerAir Line Pilots Association, Intl
Economic and Financial Analysis

September 2008 Economic & Financial Analysis 2
U.S. Economy Reporting Mostly Troubling Results
Turbulence in the financial markets is a major concernCredit crunch continues to slam the economy: Lehman Brothers files for bankruptcy, Merrill Lynch to be absorbed by Bank of America, U.S. government takes over AIG
Job losses mountingOver past 12 months, number of unemployed has increased by 2.2 millionUnemployment was 6.1% in August 2008 (vs. 4.7% in August 2007)
July’s existing home sales show gain over June, still down YOYIn July, existing home sales up 3.1% over June, but down 13.2% YOYU.S government takes over Fannie Mae & Freddie Mac, to stabilize housing crisis
Inflation fell slightly in August after large increase in JulyInflation (CPI) falls 0.1% from July to August – the first time in 2008 that inflation decreased on a month-over-month basisHowever, August inflation increased 5.4% YOY
Inflation concerns cause the Fed to keep interest rates constant at 2% in September
Source: BEA Press Release (8/28/08), BLS data (9/16/08), BLS “Employment Situation Summary” (August 2008), National Realtor Association Release (8/25/08), Economist.com, Bloomberg “U.S. Economy: Industrial production contracts most since 2005” (9/15/08), Wall Street Journal “Economy’s fate on credit watch” (9/16/08)

September 2008 Economic & Financial Analysis 3
Analysts Expect Poor U.S. Economic Performance To Continue
Indicator Second Half 2008
GDP
Interest Rates*
Unemployment Rates
Inflation (CPI)*
Overall
Source: IMF, Economist.com, OECD Economic Outlook (September 2008), NBER, BEA, Federal Reserve Open Market Committee Press Release
*In September, the Fed kept interest rates constant due to inflationary pressures. Further pressure could cause interest rate hikes in the future.
* Fed Chairman Bernanke expects inflation to moderate during late 2008 and into 2009. If it doesn’t - the Fed could react with higher interest rates

September 2008 Economic & Financial Analysis 4
After Hitting A 28-Year Low In June, Consumer Sentiment Rebounded Slightly In July & August
Source: Federal Reserve Bank of St. Louis, University of Michigan
June’s 28-year low


September 2008 Economic & Financial Analysis 6
Airline Trends
Mergers and Joint Ventures
Fuel Costs
Capacity Reductions

September 2008 Economic & Financial Analysis 7
Mergers & Joint VenturesMergers
Recent round of mergers / acquisitionsDelta / NorthwestAir France / KLMLufthansa / SwissOthers and additional potential mergers
oneworld members British Airways and Iberia in merger talksTransactions have sparked alliance shifts and additional incentives for ATI and joint ventures
Sources: SkyTeam, International Herald Tribune “Air France and Delta forming joint venture for trans-Atlantic flights” (10/17/07) , The Transnational “Signing JV, Air France and Delta Seek Expanded SkyTeam Immunity” (10/17/07), Aviation Daily (1/24/08, 3/25/08, 4/1/08) , ATW Daily News (3/25/08 & 4/16/08), Airline Business, Airlines Business (8/1/08), oneworld press release (8/14/08), www.moretravelchoices.com

September 2008 Economic & Financial Analysis 8
ATI & Joint Ventures as a Response to Mergers and Financial Challenges
ATI and Joint VenturesBefore creating joint ventures, airlines must first receive anti-trust immunity
Anti-trust immunities allow carriers to coordinate schedules, pricing, yield management, and other functionsNot profit or revenue sharingCarriers that have ATI usually work together to reduce costs as well
Joint ventures allow carriers to get closer to merger-like benefits, while maintaining separate operations
Profit sharingSometimes just revenue sharing (simplifies the JV)
Act as one carrierChanges the competitive dynamic
Sources: SkyTeam, International Herald Tribune “Air France and Delta forming joint venture for trans-Atlantic flights” (10/17/07) , The Transnational “Signing JV, Air France and Delta Seek Expanded SkyTeam Immunity” (10/17/07), Aviation Daily (1/24/08, 3/25/08, 4/1/08) , ATW Daily News (3/25/08 & 4/16/08), Airline Business, Airlines Business (8/1/08), oneworld press release (8/14/08), www.moretravelchoices.com

September 2008 Economic & Financial Analysis 9
Alliances Aim For Greater Cooperation With Transatlantic Anti-Trust Immunities & Joint Ventures
SkyTeamSkyTeam’s Delta, NWA, Air France, KLM, Alitalia & CSA Czech Airlines approved for transatlantic anti-trust immunitySkyTeam to form a four-way joint venture between Air France, KLM, Delta, and Northwest
oneworldoneworld carriers American, British Airways, Finnair, Iberia, and Royal Jordanian apply for anti-trust immunityAmerican, British Airways, and Iberia sign a joint venture agreement on flights between North America and Europe (need ATI)
Analysts expect an American/British Airways joint ventures could potentially achieve revenue and cost synergies of $400 to $800 million annuallyEuropean commission opens an anti-trust probe into the revenue sharing deal
Growing LCC partnerships possibleWestJet and Southwest announce plans for codeshare agreement
Sources: SkyTeam,, The Transnational “Signing JV, Air France and Delta Seek Expanded SkyTeam Immunity” (10/17/07), Aviation Daily, ATW Daily News, oneworld, Airline Business (September 2008), Associated Press “ EU Opens anti-trust probe into airline alliance”, Merrill Lynch, UBS

September 2008 Economic & Financial Analysis 10
Alliances Aim For Greater Cooperation With Transatlantic Anti-Trust Immunities & Joint Ventures
Star AllianceAnti-trust immunity for Star’s United, BMI, Air Canada, Austrian, Lufthansa, LOT, SAS, Swiss, and TAP went into effect March 30, 2008Continental to leave SkyTeam and join Star during 2009
CAL files a request with U.S. DOT to join Star and seeks anti-trust immunity with Star’s United, BMI, Air Canada, Austrian, Lufthansa, LOT, SAS, Swiss, and TAP (called the A++ agreement)
A++ group will have a 25% share of transatlantic seats (SkyTeam’s immunized group holds about 25%, oneworld carriers have 19%, and Virgin Atlantic has 6% share)
UAL, Air Canada, and Lufthansa hope to add CAL to transatlantic joint ventureJoint ventures are also planned for Latin America and Asia/Pacific
CAL brings Star a NYC area gateway, US-flag Atlantic operation, US-flag Central American operation (to compete with Mexicana), and US-flag Air MicronesiaContinental and partners looking for a “graceful” exit from SkyTeam
Sources: SkyTeam, International Herald Tribune “Air France and Delta forming joint venture for trans-Atlantic flights” (10/17/07) , The Transnational “Signing JV, Air France and Delta Seek Expanded SkyTeam Immunity” (10/17/07), Aviation Daily (1/24/08, 3/25/08, 4/1/08) , ATW Daily News (3/25/08 & 4/16/08), Airline Business, Airlines Business (8/08) & 9//08, oneworld press release (8/14/08)

September 2008 Economic & Financial Analysis 11
Average Jet Fuel Prices Spiked During 1H08, But Have Fallen Significantly
Source: EIA Spot Price Average
Avg. Jet Fuel Price ($/bbl)
Falling fuel prices will give carriers some breathing room, if demand weakens
Falling fuel prices will give carriers some breathing room, if demand weakens
September 2008 Economic & Financial Analysis 12
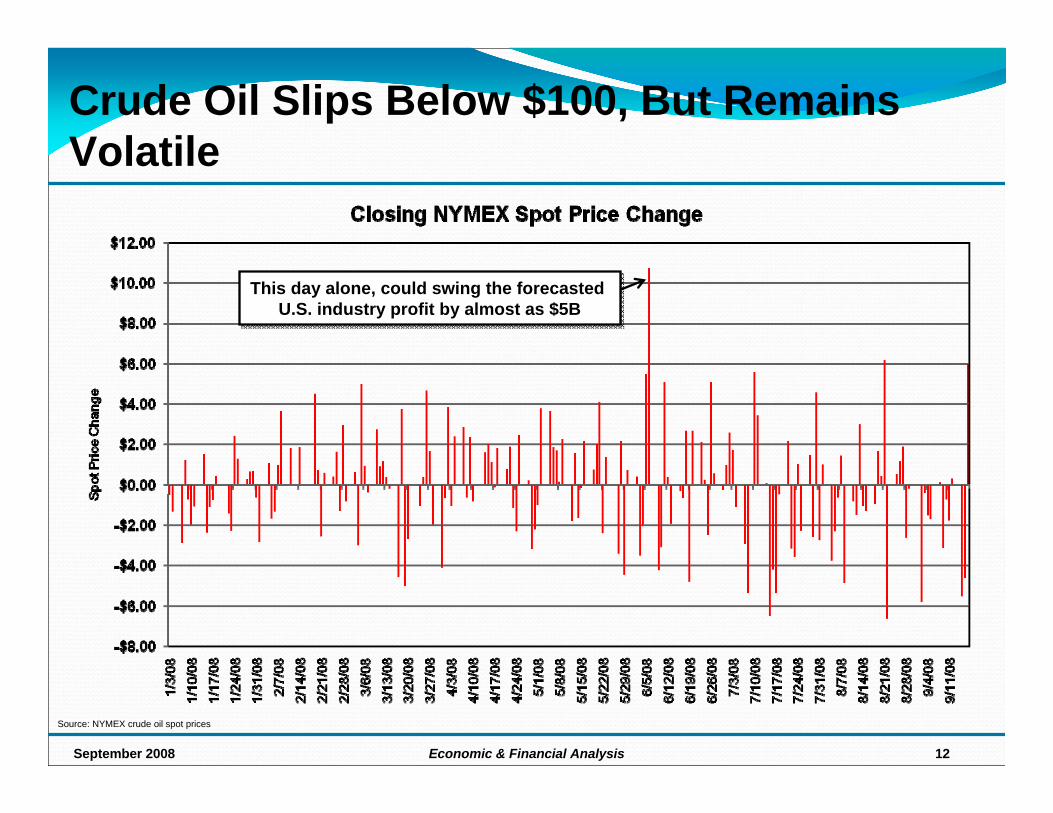
Crude Oil Slips Below $100, But Remains Volatile
Source: NYMEX crude oil spot prices
This day alone, could swing the forecasted U.S. industry profit by almost as $5B
This day alone, could swing the forecasted U.S. industry profit by almost as $5B

September 2008 Economic & Financial Analysis 13
Jet Fuel Costs Have Risen 55% YOYAverage Jet Fuel Price
Per Barrel Per Gallon2003 36.11 0.86
2004 50.72 1.21
2005 72.32 1.72
2006 82.66 1.97
2007 90.90 2.16
Jan-Aug '08 141.21 3.36
Source: U.S. Energy Information Administration

September 2008 Economic & Financial Analysis 14
We Saw Some Spike from Ike, but Surprisingly in NY
Source: NYMEX Spot Prices & EIA Jet Fuel Spot Prices
NY Harbor crack spread nearly doubled from Sept 9 to Sept 16, rising to $57.84/bbl

September 2008 Economic & Financial Analysis 15
Hurricanes Have Caused Huge Spikes In Crack Spreads in the Past
Hurricane Katrina
Hurricane RitaHurricane Rita
About 4 WeeksAbout 4 Weeks
About 2 WeeksAbout 2 Weeks

September 2008 Economic & Financial Analysis 16
Volatile Fuel & Expected Decline In Demand Drive Carrier Capacity Cuts
4Q08 1Q09Alaska -2.8% -1.9%
Continental -5.4% -5.9%
JetBlue -6.1% -7.0%
Northwest -6.8% -4.4%
American -6.9% -8.2%
Delta -6.9% -4.8%
US Airways -8.3% -6.2%
United -8.7% -7.7%
Total System Cuts -6.9% -5.9%
System Capacity, % Change YOY
Note: Based on average weekly seatsSource: Credit Suisse “US Airline Seat Check Survey” (9/12/2008)

September 2008 Economic & Financial Analysis 17
Legacy Carriers Also Expected To Make Large Capacity Cuts In LCC Top Markets
4Q08 % Chg 1Q09 % Chg
Total Legacy Carrier Cuts -9.1% -6.4%
Overall Legacy Carrier Cuts In LCC Markets -10.1% -7.5%
Legacy Cuts in LCC's Top 10 Markets -21.2% -18.2%
Legacy Cuts in LCC's Top 25 Markets -19.3% -15.6%
Legacy Cuts in LCC's Top 50 Markets -15.8% -13.4%
Note: Based on average weekly seats one-waySource: Credit Suisse “US Airline Seat Check Survey” (9/12/2008)
Legacy Carriers Capacity Cuts In Low Cost Carrier Markets


September 2008 Economic & Financial Analysis 19
Global Industry Reports Losses Of $2.68 Billion During First Half 2008
Region1H07 1H08
Oper. Profits Net Profits Oper. Profits Net ProfitsU.S.* 3.71 4.76 (0.91) (2.48)
Europe 2.39 2.70 1.79 (0.04)
Asia Pacific 1.12 1.94 1.15 (0.21)
Other 0.34 0.13 0.28 0.04
Total 7.56 9.53 2.31 (2.68)
Half Year Results ($ Billions) From A Sample Of 28 Major Airlines
*Excluding reorganization costs
Largest deterioration of profit during 1H08 is seen in the U.S, as the industry is pressured by rising fuel
costs and shrinking domestic markets
Source: IATA Forecast (September 2008)

September 2008 Economic & Financial Analysis 20
Rising Fuel Put Downward Pressure On Pre-Tax Margins, Causing Most Carriers To Report Losses in a Seasonally Strong Quarter
Corporate Pre-Tax Margin
2Q08 2Q07 Pts. Chg
Southwest 4.6% 12.1% -7.6
Delta 2.5% 7.0% -4.5
JetBlue -1.3% 5.9% -7.2
Continental -1.7% 6.2% -7.9
Northwest -2.2% 8.8% -11.0
Alaska -2.3% 8.5% -10.8
US Airways -3.1% 8.7% -11.8
American -4.6% 5.4% -10.0
United -7.1% 8.9% -16.0
AirTran -7.1% 10.0% -17.1
Source: Corporate Press Releases & SEC Filings. Excluding special items (other than fuel hedging settled in current period)

September 2008 Economic & Financial Analysis 21
Pre-Tax Losses More Pronounced Without The Aid Of Fuel Hedges And The Competitive Ranking Changes
Corporate Pre-Tax Margins(Excluding Fuel Hedges)
2Q08 2Q07 Pts. ChgDelta -3.2% 7.0% -10.2
Northwest -3.4% 8.8% -12.2
Continental -3.7% 6.2% -9.9
American -4.6% 5.4% -10.0
United -7.7% 8.9% -16.6
JetBlue -8.0% 5.9% -13.9
Alaska -8.4% 7.8% -16.2
US Airways -9.0% 8.7% -17.7
AirTran -9.5% 10.0% -19.5
Southwest -12.0% 5.4% -17.4
Notes: American Airlines did not give details on fuel hedge gains or losses that were realized during 2Q08.Source: Corporate Press Releases & SEC Filings. Excluding special items & gains of fuel hedging
AMR did not give details on fuel hedge gains or losses that were realized during 2Q08. Using an estimated unhedged jet fuel price of $3.71, AMR’s pre-tax margin would be -11.0%.

September 2008 Economic & Financial Analysis 22
Revenue Gains Helped Offset Some Of Fuel’s Rise PRASM (Seat Stage Length Adjusted)
2Q08 2Q07 % ChgJetBlue 10.05 9.04 11.2%
Northwest 13.50 12.29 9.8%
United 15.34 14.12 8.6%
American 13.29 12.36 7.6%
Delta 12.88 12.06 6.8%
Continental 14.15 13.39 5.7%
Southwest 8.26 7.86 5.1%
Alaska 10.91 10.46 4.3%
US Airways 11.48 11.06 3.7%
AirTran 8.73 8.44 3.4%
Note: Stage length adjusted for 1,000 miles. Source: Corporate Press Releases, SEC filings, Form 41 & OAG data (estimating SSL based on first quarter data from form 41 and actual second quarter company reported data )
Mainline PRASM, SSL Adjusted

September 2008 Economic & Financial Analysis 23
For Most Carriers, “Other” Revenues Are Growing And Will Be A Key Indicator In The Future
“Other” Revenue ($ Millions)
Source: Corporate Press Releases & SEC Filings.
2Q08 2Q07 % Chg.
JetBlue 80 47 70.2%
Northwest 294 192 53.1%
Delta 569 392 45.2%
AirTran 35 26 31.2%
Continental 262 205 27.8%
Southwest 85 75 13.3%
US Airways 203 190 6.8%
American 528 496 6.5%
Alaska 40 41 -2.9%
United 238 260 -8.5%
New airline fees (including baggage check fees) are expected to help
increase revenues in future quartersNote: Some carriers year over year comparisons could be skewed by
classification changes

September 2008 Economic & Financial Analysis 24
Mainline CASM Is Heavily Impacted By Fuel
2Q08 2Q07 % ChgSouthwest 7.91 7.16 10.5%
Continental 15.70 13.54 16.0%
US Airways 12.98 11.19 16.0%
Delta 13.70 11.60 18.0%
Alaska 11.95 10.07 18.6%
Northwest 13.92 11.62 19.9%
American 15.57 12.97 20.0%
JetBlue 10.49 8.62 21.7%
United 17.11 14.03 21.9%
AirTran 9.78 7.81 25.2%
Hawaiian 13.99 10.79 29.6%
Mainline CASM, SSL Adjusted
Notes: Stage length adjusted for 1,000 miles. Source: Corporate Press Releases, SEC filings, Form 41 & OAG data (estimating SSL based on first quarter data from form 41 and actual second quarter company reported data )

September 2008 Economic & Financial Analysis 25
Liquidity has become the primary focus and many carriers have been successful in finding capital sources
Unrestricted Cash & ST Investments ($M)
Adj Monthly Op Exp. ($M)
Months of Op. Exp. On Hand
FY08(E) Annual Revenue ($M)
FY08(E) Cash On Hand As % of Annual Revenue
Southwest 6,438 900 7.2 11,476 56.1%Alaska 1,006 315 3.2 3,723 27.0%JetBlue 846 280 3.0 3,436 24.6%Northwest 3,256 1,193 2.7 14,304 22.8%Continental 3,400 1,352 2.5 16,176 21.0%American 5,069 2,102 2.4 24,716 20.5%Delta 4,342 1,762 2.5 21,996 19.7%US Airways 2,295 1,109 2.1 13,028 17.6%AirTran 446 246 1.8 2,774 16.1%United 2,899 1,889 1.5 21,484 13.5%
2Q 2008 Liquidity Comparison
Notes: Delta unrestricted cash includes $1 billion in revolving credit facility. Southwest unrestricted cash includes $600m in revolving credit facility. Source: Corporate press releases, CNNMoney.com “Delta taps $1 billion in credit line” (8/25/08), Yahoo Finance , Investor Updates, SEC filings
Even with high fuel prices, most carriers have cash balances in the targeted range (15-20%)Even with high fuel prices, most carriers have cash balances in the targeted range (15-20%)
Additional notes / subsequent events: • In August, DAL drew $1b from a credit line for more financial flexibility as it heads toward NWA merger. DAL expects to
end 4Q08 with $3.1b in liquidity (including drawn $1b credit line), down from June’s forecasted $3.2b (including $1b credit line)
• In September, UAL amended its credit card processing agreement and completed an amendment of its co-branded card marketing services – boosting UAL’s liquidity by $1.2b (includes $1b in the short term and additional $200m over 2 years)
• CAL expects to end 3Q08 with $2.7b in unrestricted cash & ST investments• AMR expects to end 3Q08 with roughly $4.5b in unrestricted cash & ST investments (recently sold $300M in equity)


September 2008 Economic & Financial Analysis 27
After A Return To Profitability, Fuel Prices Expected To Spur Losses In 2008
Source: ATA Forecasts (September 18, 2008)
Great deal of uncertainty due to both fuel and revenue
?

September 2008 Economic & Financial Analysis 28
As Fuel Prices Ease, Demand Issues Are Expected To Take Center Stage
Strong Aug. RASM of +7.9% +4.8% Domestic and +12.8% Int’lPlanned capacity cuts (driven by 1H08 fuel prices) are expected to keep RASM strong, despite demand fears
Recent data releases have been encouragingDAL - 3Q PRASM +9-10%NWA – Domestic PRASM 3Q +9%-11% and 4Q +13-15%AMR – 3Q PRASM +9.5%-10.5%UAL – 3Q PRASM +4.5% - 5.5%
“Significant and widespread domestic capacity cuts are likely to be supportive of RASM growth even if demand moderates.” ~ Morgan StanleyJP Morgan expects 4Q08 mainline system RASM at 11%, because “…supply is exiting the industry at a far greater rate than demand has ever softened, ex. 9/11.
While most data points have been very good, there is a huge overhang from recent turmoil in the financial markets
Source: Company Press Releases & Investor Updates, JP Morgan, Morgan Stanley, IATA, ATA

September 2008 Economic & Financial Analysis 29
As Fuel Prices Ease, Some Hedges Could Become Harmful
3Q08 4Q08Southwest 80.0% 80.0%
AirTran 72.5% 52.5%
Northwest 70.8% 67.9%
Continental 62.0% 73.0%
US Airways 58.0% 47.0%
Alaska 50.0% 50.0%
Delta 48.0% 59.0%
United 46.0% 47.0%
JetBlue 46.0% 38.0%
American 39.0% NA
Percent Hedged of Estimated Fuel Consumption
Source: Company Press Releases, SEC filings, Investor Updates (Information current as of 9/18/08)
United announced a $500M+ charge from hedges for 3Q (most
out of period)

September 2008 Economic & Financial Analysis 30
Outlook In 2008, global net losses of -$5.2 billion are expected, due to record fuel prices and weakening economies
But there is a huge amount of variability – recent ATA release forecasted a 2008 industry loss of $7-$9B in 2008
Recent drop in fuel has some analysts predicting a return to profitability in 2009, but they are assuming:
Jet fuel prices in the range of $135/bbl - $145/bbl (crude: $115/bbl, crack: $25/bbl)RASM gains of approximately 8% YOY
Dependent on U.S. economy avoiding recession in ‘09 and airline capacity discipline
Mainline CASM (excluding fuel) + 3%
Source: JP Morgan (8/12/08), Morgan Stanley (8/11/08 & 8/28/08), IATA Forecast (September 2008), Lehman Brothers (8/28/08), Company traffic releases, ATA (9/18/08)

September 2008 Economic & Financial Analysis 31
Will Airlines Cut Capacity As Much as Planned?
Source: EIA Spot Price Average, Company Press Releases & SEC Filings
6/11 - CAL ‘08 down -0.1%
Avg. Jet Fuel Price ($/bbl) vs. Mainline System Capacity Cut Announcements at CAL & AMR
4/29 – CAL ‘08 up only 1% to 2%, revised from earlier plans of 2% to 3%
4/16 - AMR ‘08 down -1.4%
5/21 – AMR ‘08 down -3.5% to -2.5% YOY
7/17 - CAL ‘08 down -0.2%
7/17 – AMR ‘08 down -3.4% YOY

September 2008 Economic & Financial Analysis 32
Outlook The recent fuel drop is a very big deal, there is still a wide range of possible financial results, but now profits are part ofthat range
Important to remember this is a cyclical industry and the situation can change, sometimes quickly:
Current financial crisisFuel

Questions?