allyson perry - cracking the code on food issues: consumer insights on animal agriculture
TRANSCRIPT

Cracking the Code on Food Issues
Consumer Insights on Animal Agriculture

Mission: To build consumer trust and confidence in today’s food system.
Center for Food Integrity

Thank You 2014 Research Sponsors
National Sponsors
Thank You 2014 Research Sponsors
State Sponsors

Mom, Millennials and Foodies
Just less than half did not fall into one of these three categories.
Moms 30%
Foodies 21%
Millennials 37%
N=2005
Note: These groups are not mutually exclusive.
Respondents can qualify as more than one (i.e. a Mom who is a Foodie).
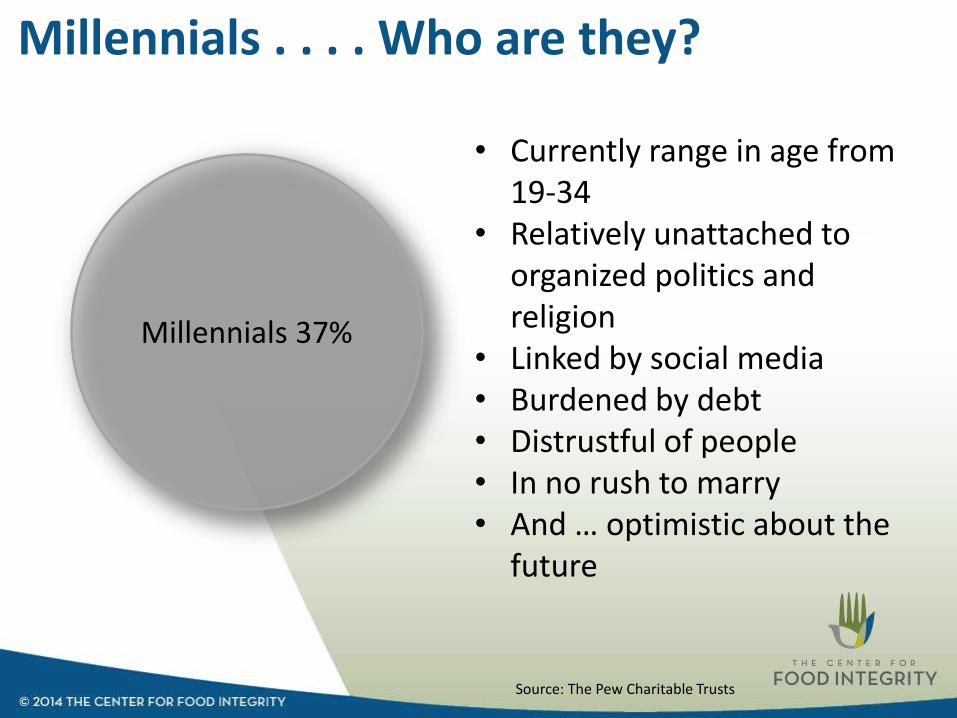
Millennials . . . . Who are they?
• Currently range in age from 19-34
• Relatively unattached to organized politics and religion
• Linked by social media• Burdened by debt• Distrustful of people• In no rush to marry• And … optimistic about the
future
Millennials 37%
Source: The Pew Charitable Trusts

11%
33%
28%
11% 12%
1%4%
0%
5%
10%
15%
20%
25%
30%
35%
Income of Millennials
N=734

Moms
Moms 30%
N=2005
Must have children at home under the age of 18

10%
31%
27%
13%15%
1%3%
0%
5%
10%
15%
20%
25%
30%
35%
Income of Moms
N=605

Ages of Moms
9%
38%
29%
19%
5%
0%
5%
10%
15%
20%
25%
30%
35%
40%
21-25 26-34 35-44 45-54 55-65
N=605

Foodies . . . .Who are they?
Foodie:
Person who has an ardent or refined interest in food and alcoholic beverages. A foodie seeks new food experiences as a hobby rather than simply eating out of convenience or hunger.
Source: The American heritage dictionary of the English language. (4th ed.)
Foodies 21%
N=2005

Ages of Foodies
11%
35%
25%
17%
11%
0%
5%
10%
15%
20%
25%
30%
35%
40%
21 to 25 26 to 34 35 to 44 45 to 54 55 to 65
N=416

9%
28%26%
16%17%
1% 2%
0%
5%
10%
15%
20%
25%
30%
Income of Foodies
N=416

Consumer Concerns About Life and Current Events

All of the Most Concerning Life Issues are Beyond the Consumer’s Direct Control
Women were more concerned than men about most issues
Additional Food System Concerns*
• Imported Food Safety (63%)
• Food Safety (62%)
• Enough to Feed U.S. (55%)
• Humane Treatment of Farm Animals (49%) – 51% last year
• Environmental Sustainability in Farming (49%)
• Access to Accurate Info to Make Healthy Food Choices (49%)
33%Lowest concern was for having enough food to feed people outside the U.S.
Early Adopters
Earlier Adopters were more concerned about all issues than later adopters
*Top Box ratings (8-10)

Consumers Less Concerned About All Top Issues in 2014
Change in Top Concerns
2013 vs. 2014
U.S. Economy (same)
Rising Cost of Food (same)
Rising Healthcare Costs (-3%)
Rising Energy Costs (-4%)
No Increase in Top
Concerns
Environmental Sustainability in Farming (same)
Safety of Imported Food (-3%)
Food Safety (-1%)
Enough to Feed U.S. (-1%)
Humane Treatment of Farm Animals (-2%)
No Increase in Top
Concerns
Change in Food Concerns
2013 vs. 2014

Right Direction/Wrong Track
43%Right Direction 27%
Unsure30%Wrong Track
Early Adopters36%
believe the food system is on the wrong
track
48%Right
Direction
32%Wrong Track
34%
38%
28%
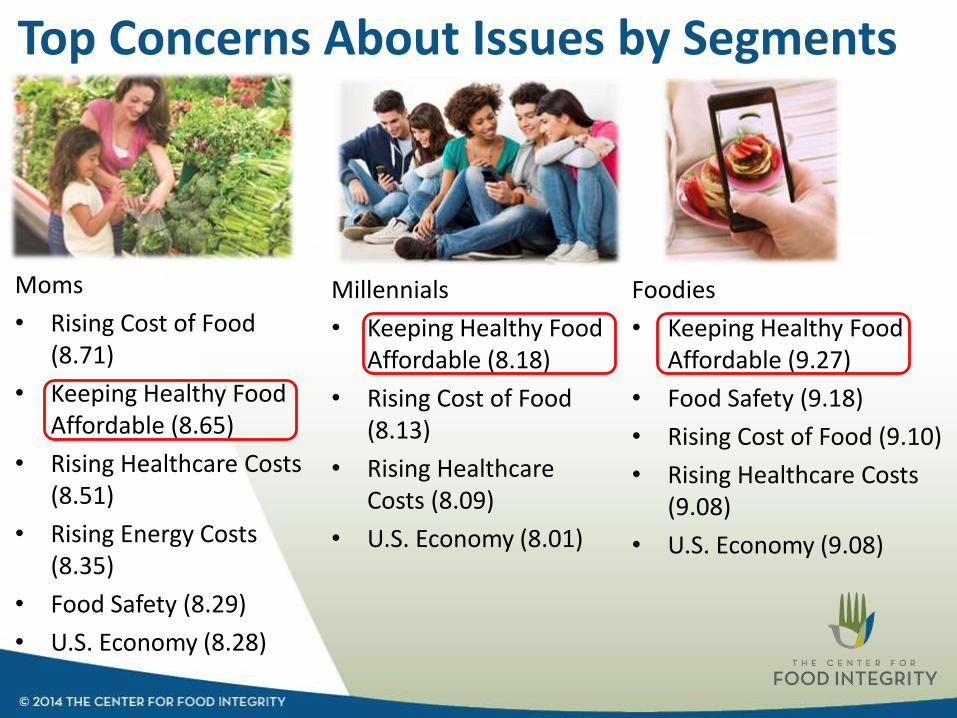
Moms
• Rising Cost of Food (8.71)
• Keeping Healthy Food Affordable (8.65)
• Rising Healthcare Costs (8.51)
• Rising Energy Costs (8.35)
• Food Safety (8.29)
• U.S. Economy (8.28)
Top Concerns About Issues by Segments
Millennials
• Keeping Healthy Food Affordable (8.18)
• Rising Cost of Food (8.13)
• Rising Healthcare Costs (8.09)
• U.S. Economy (8.01)
Foodies
• Keeping Healthy Food Affordable (9.27)
• Food Safety (9.18)
• Rising Cost of Food (9.10)
• Rising Healthcare Costs (9.08)
• U.S. Economy (9.08)

Right Direction/Wrong Track
Right/Wrong Moms Millennials Foodies
Right Direction 36% 41% 49%
WrongTrack
35% 33% 35%
Unsure 29% 26% 16%

Moms Expressed Concern About Food Issues
Moms’ Most Strongly Held Attitudes Toward Food Issues
1. I believe that the less processed a food is the healthier it is (8.44).
2. I prefer to purchase fruits and vegetables that are in season in my area (8.10).
3. It is important to me that farmers who produce the food I buy receive fair compensation for their work (8.07).
4. I prefer to buy locally produced farm products when they are available (7.92).
5. I like to support farmers in my community by buying their products (7.88).
Numbers are mean scores on a 0-10 agreement scale.

Millennials Expressed Concern About Food IssuesMillennials’ Most Strongly Held Attitudes Toward Food Issues
1. I believe that the less processed a food is the healthier it is (8.12).
2. It is important to me that farmers who produce the food I buy receive fair compensation for their work (7.83).
3. I prefer to purchase fruits and vegetables that are in season in my area (7.66).
4. Organically produced food is grown using fewer chemicals than non-organically produced food (7.66).
5. Animals are treated better on free range farms than animals on farms where they are confined (7.62).
Numbers are mean scores on a 0-10 agreement scale.
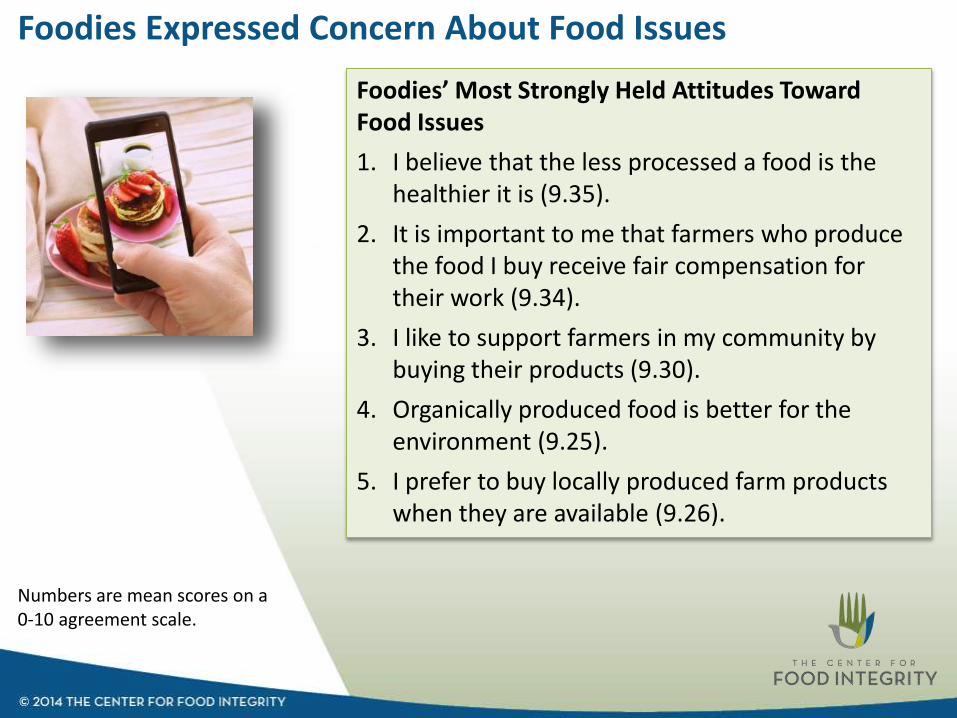
Foodies Expressed Concern About Food Issues
Foodies’ Most Strongly Held Attitudes Toward Food Issues
1. I believe that the less processed a food is the healthier it is (9.35).
2. It is important to me that farmers who produce the food I buy receive fair compensation for their work (9.34).
3. I like to support farmers in my community by buying their products (9.30).
4. Organically produced food is better for the environment (9.25).
5. I prefer to buy locally produced farm products when they are available (9.26).
Numbers are mean scores on a 0-10 agreement scale.

Where Consumers go for Information

Consumers Search Online and Watch Local TV for Info on Food System Issues
Ranked First as Info Sourceon Food System Issues
Websites 20%
(Highest % of Top Source
Mentions for Early
Adopters)
Local TV Station
16%
Friends-Not
Online12%
Family-Not
Online 12%
Google10%
22% 23%

Top Sources of Information on Food System Issues
Moms
Top Sources Ranked #1
• Websites (21%)
• Family-Not Online (14%)
• Google (12%)
• Local TV Station (12%)
• Friends-Not Online (11%)

Millennials
Top Sources Ranked #1
• Websites (22%)
• Friends-Not Online (16%)
• Google (15%)
• Family-Not Online (13%)
• Friends-Online (8%)
>45% Online
Top Sources of Information on Food System Issues

Top Sources of Information on Food System Issues
Foodies
Top Sources Ranked #1
• Websites (25%)
• Friends-Not Online (15%)
• Google (12%)
• Family-Not Online (10%)
• Food Specific TV Programs or Networks (9%)

2014 Research …
What does all this mean?

CFI Trust Model

What Drives Consumer Trust?

Science Denied: The Challenge of Introducing Complex, Controversial Issues
• Breaking down communication barriers is critical to fostering informed decision making

When Science and Consumers Collide
How do we connect?
Our Goal:
To better understand how to introduce science and technical information about agriculture and food, so they are considered in the social decision-making process.

When Science and Consumers CollideHow do we connect?
Our Goal:
Better understand communication channels and processes used by Moms, Millennials and Foodies when forming attitudes and opinions about issues in agriculture and food.

Why Facts Alone Don’t Drive Decisions
Cultural Cognition
• Tendency for people to conform beliefs about controversial matters to group values that define their cultural identities.

Why Facts Alone Don’t Drive Decisions
Confirmation Bias
• Tendency for people to favor information that confirms existing beliefs.

Online Communication is Tribal/Insular
Consumer
Consumer
Consumer
Traditional
Communication
Model
Expert
FamilyOnline Friends
Neighbor
FamilyFriend
Tribal
Communication
Model
FamilyOnline Friends
Blogs

The “Mom” Tribe
What information sources have you used to come to your conclusion that GMOs are dangerous?
Heidi: “I’m part of a moms group. When there is a big consensus, I think ‘there’s something here.’ You don’t need doctors or scientists confirming it when you have hundreds of moms.”

• Negative information weighs more heavily on our decisions than positive information.
• A single item of negative information is capable of neutralizing five similar pieces of positive information
Bad News Bias

Big is Bad
Shared Values = Trust Big is Bad
Inverse relationship between size and the perception of shared values

Millennials … Most Mistrusting …

The Decision-Making Maze

2014 Research …

2014 Research: Making Science Relevant
• Asked consumers to rate their trust in 11 different messengers
• Focused more in-depth research on three messengers – A Mom Scientist, A Federal Government Scientist and A Peer (shared interests)
• Measured messenger trust prior to sharing key messages/scenarios and after.

Theoretical Approach to Measurement
• Scenarios were developed using Fundamental Message Elements and Outrage Factors
• Scenarios were also written in different “voices” to test the trust in the messenger: Mom Scientist, Federal Government Scientist and a Peer “who shares my interest about food.”
Mom Scientist Govt. Scientist Peer

Theoretical Approach to Measurement (Continued)• Two food industry topics were chosen to serve as the vehicle for testing the
impact of the Fundamental Message Elements and the Outrage Factors (Antibiotic Resistance, GM Ingredients in Food).
Please note that the intent of the research is to identify elements in technical messaging that promotes consumer believability in the message and trust in the messenger—not to identify specific messages to promote the two topics.
What Promotes Messenger Trust?

• Perceptions of the Messenger’s Competence and the Confidence are strong predictors of Trust in the Messenger.
• Confidence typically carries at least twice the weight in predicting Trust with the Messenger.
Trust in the MESSENGER: Key Findings

Which Elements Most Promote Believability of the
Message?

Most Impactful Elements for Believability
Accurate Presentation of Risks: Present known risks since known risks “trump” unknown risks by accurately communicating safety facts
Openness/Transparency: Acknowledge both sides of the story, provide level of depth so it does not look like “holding back,” avoid oversimplification
Unifying Message: Singular, compelling message that touches the deeper drivers of human behavior - values
Fundamental Message Elements

MomsComposite Value Score• Shows the Highest
Composite Value Score for Mom Scientist in 2 of 3Antibiotic Resistance Scenarios; Govt. Scientist in Other Scenario.
Based on Composite Value Scores, Mom Scientist and Govt. Scientist are Viewed as the Best Source for Antibiotic Resistance Information

MomsComposite Value Scores• Shows the Highest
Composite Value Score for Mom Scientist in both GMFood Scenarios; Govt. Scientist Second in Both Scenarios; Peer Last in Both.
Based on Composite Value Scores, Mom Scientist and Govt. Scientist are Viewed as the Best Source for GM Food Information

MillennialsComposite Value Scores• Shows the Highest
Composite Value Score for Mom Scientist in 2 of 3Antibiotic Resistance Scenarios; Govt. Scientist in Other Scenario.
Based on Composite Value Scores, Mom Scientist and Govt. Scientist are Viewed as the Best Source for Antibiotic Resistance Information

MillennialsComposite Value Scores• Shows the Highest
Composite Value Score for Mom Scientist in 1 of 2 GM Food Scenarios; Govt. Scientist Highest in Other Scenario.
Based on Composite Value Scores, Mom Scientist and Govt. Scientist are Viewed as the Best Source for GM Food Information

FoodiesComposite Value Scores• Shows the Highest
Composite Value Score for Mom Scientist in 2 of 3 Antibiotic Resistance Scenarios; Govt. Scientist in Other Scenario.
Based on Composite Value Scores, Mom Scientist and Govt. Scientist are Viewed as the Best Source for Antibiotic Resistance Information
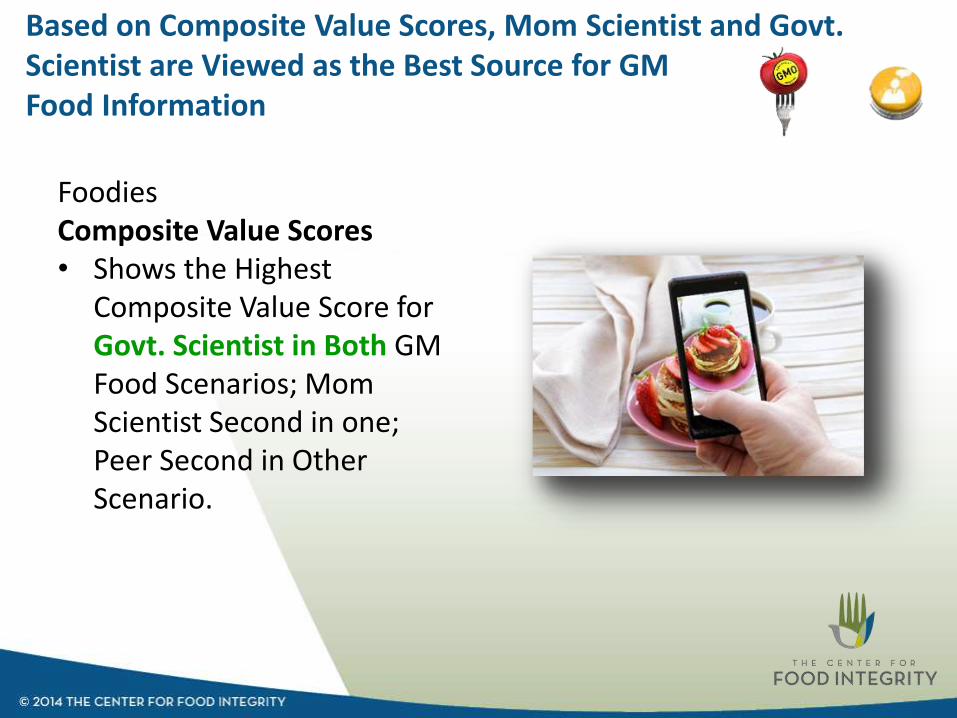
FoodiesComposite Value Scores• Shows the Highest
Composite Value Score for Govt. Scientist in Both GMFood Scenarios; Mom Scientist Second in one; Peer Second in Other Scenario.
Based on Composite Value Scores, Mom Scientist and Govt. Scientist are Viewed as the Best Source for GM Food Information

Trust in Specific Sources

Level of Trust in Sources of Information About Antibiotic Resistance by Segment
Sources of InformationTotal (A)
(Base) (2005)
My family doctor 7.22
A university scientist 6.78
A scientist who is a mom 6.64
A veterinarian who treats animals raised for food 6.54
A farmer who raises animals for food 6.39
A peer who shares my interests about food 6.24
A state government scientist 5.82
A federal government scientist 5.77
Someone who is a mom 5.76
A well-known food blogger 5.26
Dr. Oz 5.12
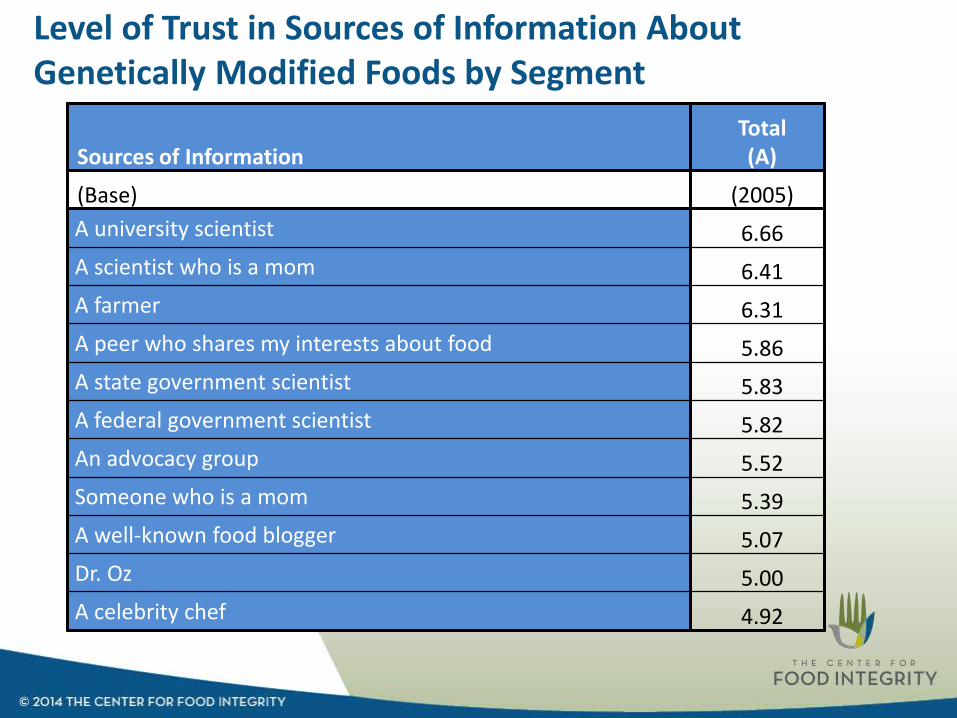
Level of Trust in Sources of Information About Genetically Modified Foods by Segment
Sources of InformationTotal (A)
(Base) (2005)
A university scientist 6.66
A scientist who is a mom 6.41
A farmer 6.31
A peer who shares my interests about food 5.86
A state government scientist 5.83
A federal government scientist 5.82
An advocacy group 5.52
Someone who is a mom 5.39
A well-known food blogger 5.07
Dr. Oz 5.00
A celebrity chef 4.92

Level of Trust in Sources of Information About Genetically Modified Foods by Segment (Continued)
Moms
• A scientist who is a mom (6.68)
• A farmer (6.64)
• A university scientist (6.49)
• A peer who share my interest (6.22)
• An advocacy group (6.02)
• Someone who is a mom (5.99)
• A state government scientist (5.69)
• A federal government scientist (5.68)
• A well-known food blogger (5.68)
• Dr. Oz (5.52)
• A celebrity chef (5.33)

Level of Trust in Sources of Information About Genetically Modified Foods by Segment (Continued)
Millennials
• A university scientist (6.86)
• A farmer (6.67)
• A scientist who is a mom (6.63)
• A peer who share my interest (6.16)
• A state government scientist (6.10)
• A federal government scientist (6.04)
• An advocacy group (5.94)
• A well-known food blogger (5.80)
• Someone who is a mom (5.77)
• A celebrity chef (5.49)
• Dr. Oz (5.27)

Level of Trust in Sources of Information About Genetically Modified Foods by Segment (Continued)
Foodies
• A scientist who is a mom (7.63)
• A university scientist (7.62)
• A farmer (7.61)
• A peer who share my interest (7.57)
• An advocacy group (7.29)
• Someone who is a mom (7.20)
• A well-known food blogger (7.13)
• A federal government scientist (6.72)
• A state government scientist (6.70)
• A celebrity chef (6.66)
• Dr. Oz (6.77)

Farm Animal Welfare
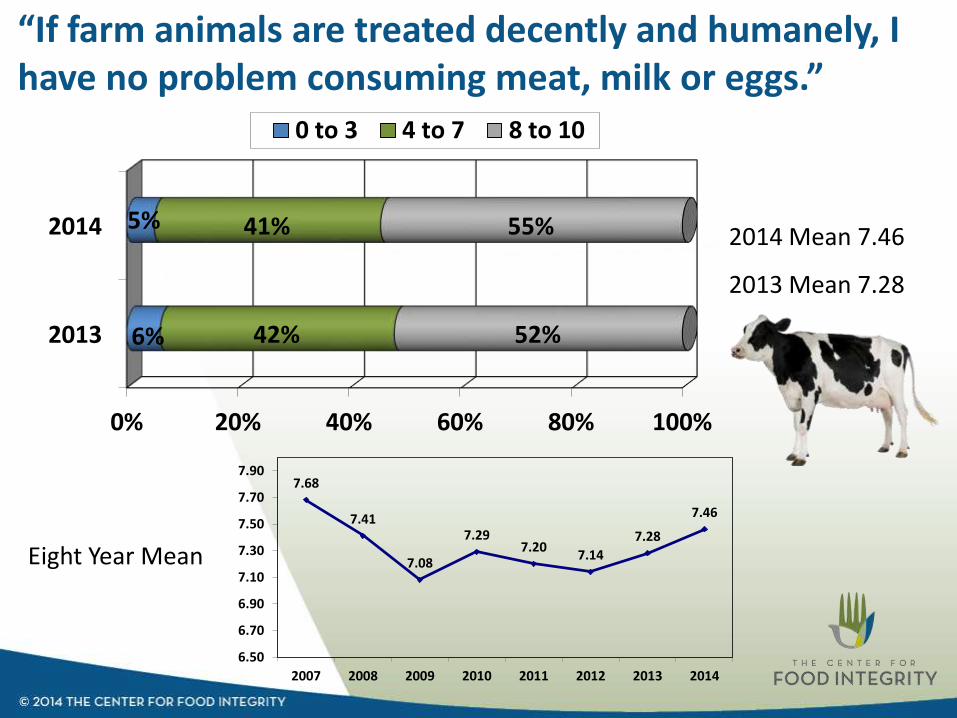
“If farm animals are treated decently and humanely, I have no problem consuming meat, milk or eggs.”
0% 20% 40% 60% 80% 100%
2013
2014
6%
5%
42%
41%
52%
55%
0 to 3 4 to 7 8 to 10
2014 Mean 7.46
2013 Mean 7.28
7.68
7.41
7.08
7.297.20
7.14
7.28
7.46
6.50
6.70
6.90
7.10
7.30
7.50
7.70
7.90
2007 2008 2009 2010 2011 2012 2013 2014
Eight Year Mean

“U.S. meat is derived from humanely treated animals.”
0% 20% 40% 60% 80% 100%
2013
2014
19%
20%
56%
56%
24%
24%
0 to 3 4 to 7 8 to 10
2014 Mean 5.54
2013 Mean 5.58
5.02
4.80
5.50
5.89
5.385.24
5.58 5.54
4.50
4.70
4.90
5.10
5.30
5.50
5.70
5.90
6.10
6.30
2007 2008 2009 2010 2011 2012 2013 2014
Eight Year Mean

“I would support a law in my state to ensure the humane treatment of farm animals.”
0% 20% 40% 60% 80% 100%
2013
2014
7%
7%
41%
41%
52%
53%
0 to 3 4 to 7 8 to 10
6.91
6.81
7.22
6.726.70
7.31 7.32
6.50
6.70
6.90
7.10
7.30
7.50
2008 2009 2010 2011 2012 2013 2014
2014 Mean 7.32
2013 Mean 7.31
Seven Year Mean

Sustainability

“I am more concerned about global warming than I was one year ago.”
0% 20% 40% 60% 80% 100%
2013
2014
24%
20%
43%
43%
34%
36%
0 to 3 4 to 7 8 to 10
5.65
5.49 5.51
5.37
5.32
5.73
5.98
5.10
5.30
5.50
5.70
5.90
6.10
6.30
2008 2009 2010 2011 2012 2013 2014
2014 Mean 5.98
2013 Mean 5.73
Seven Year Mean

Feeding the World

“The U.S. has a responsibility to provide food for the rest of the world.”
0% 20% 40% 60% 80% 100%
2013
2014
40%
32%
41%
46%
20%
22%
0 to 3 4 to 7 8 to 10
4.23
4.03
4.47
4.86
3.80
4.00
4.20
4.40
4.60
4.80
5.00
5.20
5.40
2011 2012 2013 2014
2014 Mean 4.86
2013 Mean 4.47
Four Year Mean

“It is more important for the U.S. to teach developing nations how to feed themselves than to export food to them.”
0% 20% 40% 60% 80% 100%
2013
2014
5%
6%
41%
43%
54%
52%
0 to 3 4 to 7 8 to 10
2014 Mean 7.30
2013 Mean 7.40
7.35
6.99
7.40
7.30
6.80
7.00
7.20
7.40
2011 2012 2013 2014
Four Year Mean

Bias Against Size/Scale
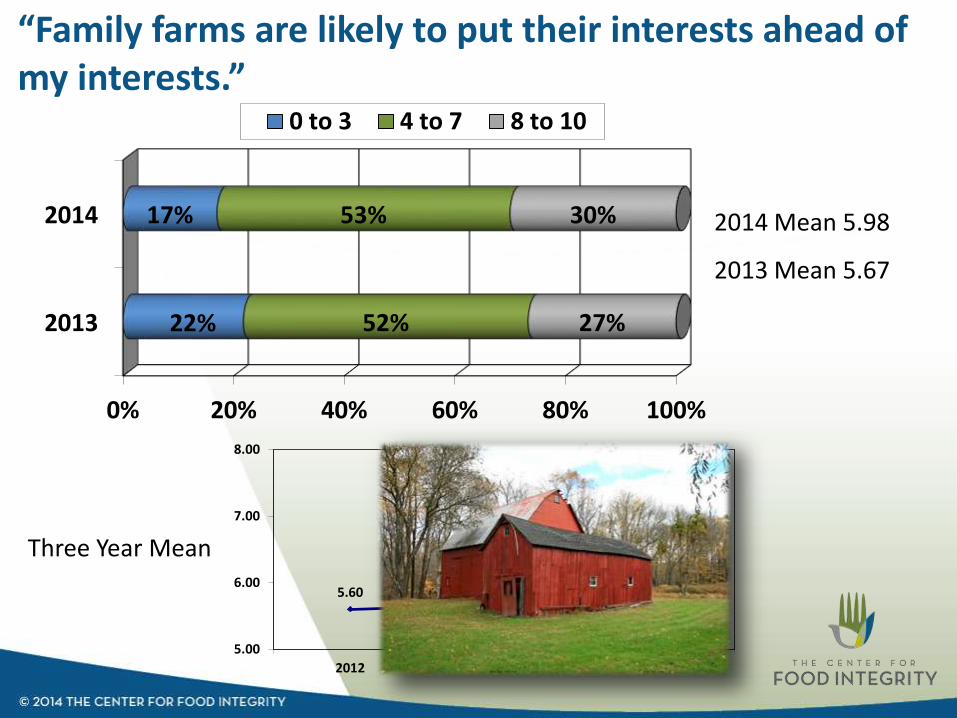
“Family farms are likely to put their interests ahead of my interests.”
0% 20% 40% 60% 80% 100%
2013
2014
22%
17%
52%
53%
27%
30%
0 to 3 4 to 7 8 to 10
2014 Mean 5.98
2013 Mean 5.67
5.60 5.67
5.98
5.00
6.00
7.00
8.00
2012 2013 2014
Three Year Mean

“Commercial farms are likely to put their interests ahead of my interests.”
0% 20% 40% 60% 80% 100%
2013
2014
6%
6%
45%
45%
49%
50%
0 to 3 4 to 7 8 to 10
2014 Mean 7.19
2013 Mean 7.20
6.86
7.20 7.19
6.50
6.70
6.90
7.10
7.30
7.50
2012 2013 2014
Three Year Mean

“Small farms are likely to put their interests ahead of my interests.”
0% 20% 40% 60% 80% 100%
2013
2014
19%
16%
53%
53%
28%
31%
0 to 3 4 to 7 8 to 10
2014 Mean 5.99
2013 Mean 5.75
5.75
5.99
5.50
5.70
5.90
6.10
6.30
6.50
2013 2014
Two Year Mean

“Large farms are likely to put their interests ahead of my interests.”
0% 20% 40% 60% 80% 100%
2013
2014
7%
6%
45%
47%
48%
47%
0 to 3 4 to 7 8 to 10
2014 Mean 7.04
2013 Mean 7.10
7.10 7.04
6.50
6.70
6.90
7.10
7.30
7.50
2013 2014
Two Year Mean

“Small food companies are likely to put their interests ahead of my interests.”
0% 20% 40% 60% 80% 100%
2013
2014
15%
13%
55%
55%
31%
32%
0 to 3 4 to 7 8 to 10
2014 Mean 6.20
2013 Mean 6.06
6.06
6.20
5.50
5.70
5.90
6.10
6.30
6.50
2013 2014
Two Year Mean

“Large food companies are likely to put their interests ahead of my interests.”
0% 20% 40% 60% 80% 100%
2013
2014
6%
5%
41%
42%
53%
54%
0 to 3 4 to 7 8 to 10
2014 Mean 7.42
2013 Mean 7.38
7.38
7.42
7.20
7.40
7.60
2013 2014
Two Year Mean
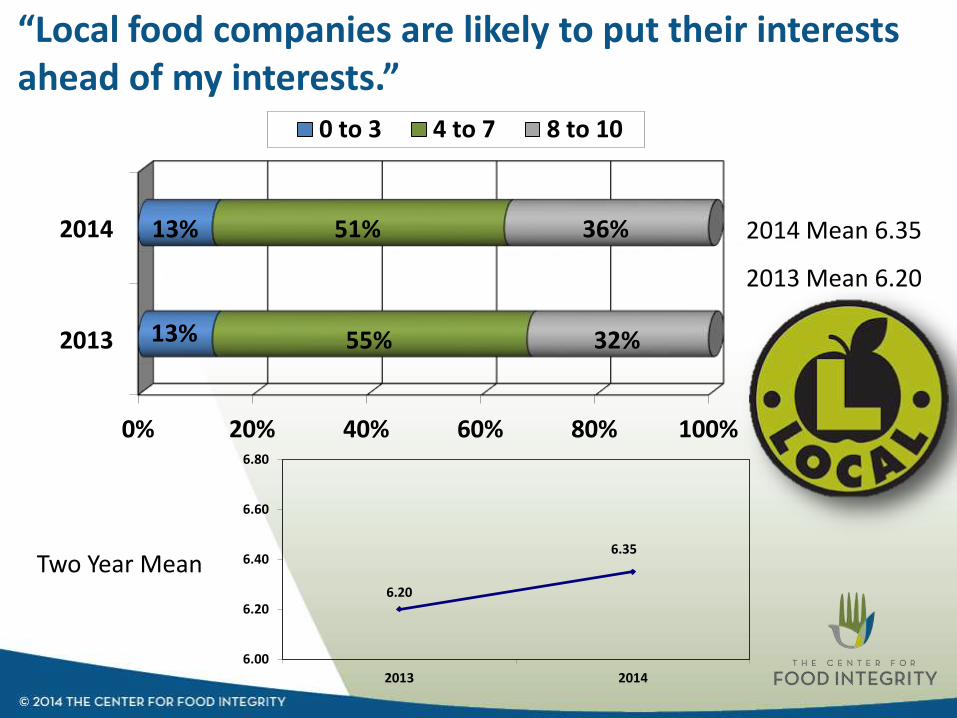
“Local food companies are likely to put their interests ahead of my interests.”
0% 20% 40% 60% 80% 100%
2013
2014
13%
13%
55%
51%
32%
36%
0 to 3 4 to 7 8 to 10
2014 Mean 6.35
2013 Mean 6.20
6.20
6.35
6.00
6.20
6.40
6.60
6.80
2013 2014
Two Year Mean

“National food companies are likely to put their interests ahead of mine.”
0% 20% 40% 60% 80% 100%
2013
2014
6%
5%
43%
45%
52%
49%
0 to 3 4 to 7 8 to 10
2014 Mean 7.26
2013 Mean 7.27
7.277.26
6.50
6.70
6.90
7.10
7.30
7.50
2013 2014
Two Year Mean
Concern/Confidence/Trust

“I have access to all of the information I want about where my food comes from, how it is produced and its safety.”
0% 20% 40% 60% 80% 100%
2013
2014
21%
16%
52%
54%
27%
31%
0 to 3 4 to 7 8 to 10
2014 Mean 5.99
2013 Mean 5.67
4.604.71
5.585.69
5.415.54
5.67
5.99
4.50
4.70
4.90
5.10
5.30
5.50
5.70
5.90
6.10
6.30
6.50
2007 2008 2009 2010 2011 2012 2013 2014
Eight Year Mean
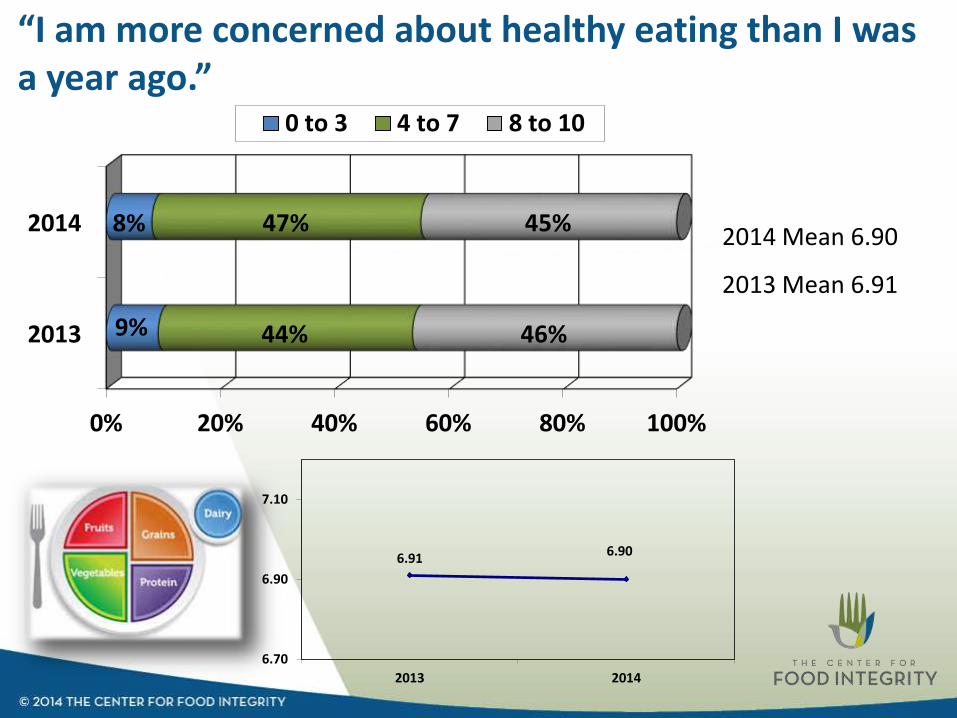
“I am more concerned about healthy eating than I was a year ago.”
0% 20% 40% 60% 80% 100%
2013
2014
9%
8%
44%
47%
46%
45%
0 to 3 4 to 7 8 to 10
2014 Mean 6.90
2013 Mean 6.91
6.916.90
6.70
6.90
7.10
2013 2014
Two Year Mean

“I feel confident about the food choices I make for my family.”
0% 20% 40% 60% 80% 100%
2013
2014
3%
3%
53%
49%
43%
47%
0 to 3 4 to 7 8 to 10
2014 Mean 7.15
2013 Mean 7.03
7.03
7.15
6.50
6.70
6.90
7.10
7.30
7.50
2013 2014
Two Year Mean

“I am concerned about the affordability of healthy food.”
0% 20% 40% 60% 80% 100%
2013
2014
5%
5%
37%
40%
58%
55%
0 to 3 4 to 7 8 to 10
2014 Mean 7.46
2013 Mean 7.58
7.58
7.46
7.20
7.40
7.60
7.80
8.00
2013 2014
Two Year Mean

“I am more concerned about the affordability of healthy food than I was a year ago.”
0% 20% 40% 60% 80% 100%
2013
2014
8%
8%
43%
44%
50%
48%
0 to 3 4 to 7 8 to 10
2014 Mean 7.03
2013 Mean 7.13
7.137.03
6.50
6.70
6.90
7.10
7.30
7.50
2013 2014
Two Year Mean

“I trust today’s food system.”
0% 20% 40% 60% 80% 100%
2014 17% 55% 28%
0 to 3 4 to 7 8 to 10
2014 Mean 5.84
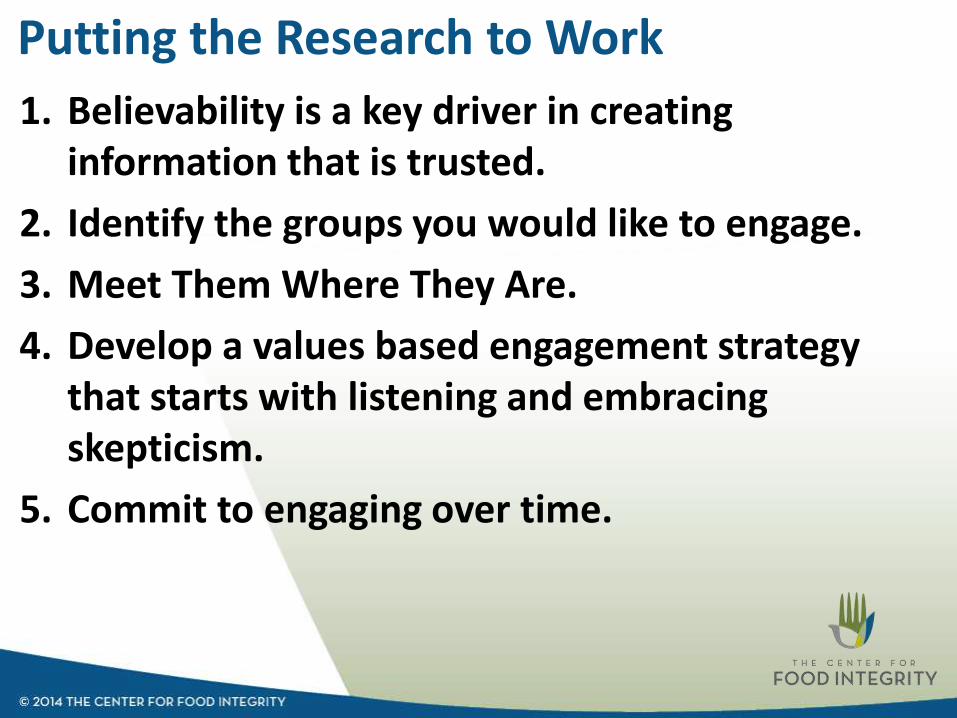
1. Believability is a key driver in creating information that is trusted.
2. Identify the groups you would like to engage.
3. Meet Them Where They Are.
4. Develop a values based engagement strategy that starts with listening and embracing skepticism.
5. Commit to engaging over time.
Putting the Research to Work

Future Webinars
January 29Insight into Moms
February 12 Insight into Foodies
February 26 Insight into Antibiotic Resistance
March 12 Insight into Food with GM Ingredients

24 page summary available online
www.foodintegrity.org
For more information or presentations please contact: [email protected]
Research Summary

Cracking the Code on Food Issues
Consumer Insights on Animal Agriculture