alluvial bar morphology and dynamics in the middle rio ...jcoonrod/rgseminar/rgseminarharvey.pdf ·...
TRANSCRIPT

Alluvial Bar Morphology and Dynamics in the Middle Rio
Grande: Application to Habitat Restoration for the Rio Grande
Silvery Minnow
Alluvial Bar Morphology and Alluvial Bar Morphology and Dynamics in the Middle Rio Dynamics in the Middle Rio
Grande: Application to Habitat Grande: Application to Habitat Restoration for the Rio Grande Restoration for the Rio Grande
Silvery MinnowSilvery Minnow
Mike Harvey
MMussetter EEngineering, IInc.
WORK CONDUCTED FOR:WORK CONDUCTED FOR:
New Mexico Interstate Stream Commission
Middle Rio Grande ESA Collaborative Program

WHAT IS A BAR ?WHAT IS A BAR ?
“Discrete alluvial feature formed by deposition and modified by erosion”
– Can be mid-channel or bank-attached– Can be subaerial or subaqueous– Can be stationary or mobile– Can be vegetated or unvegetated
?

PROJECT OBJECTIVESPROJECT OBJECTIVES
Evaluate bar changes over time in response to changes in flow, sediment supply and channel morphologyDevelop a bar classificationRelate fluvial processes to bar typesApply results to river/habitat restoration

MEI
9 STUDY SITES

MEI
1935 1955 1972
1992
1996 2001

Modified Braiding IndexModified Braiding Index((GermanoskiGermanoski, 1989), 1989)
Channel
bars
Channel
BraidBar
Ln
LL
MBI += ∑ )(2
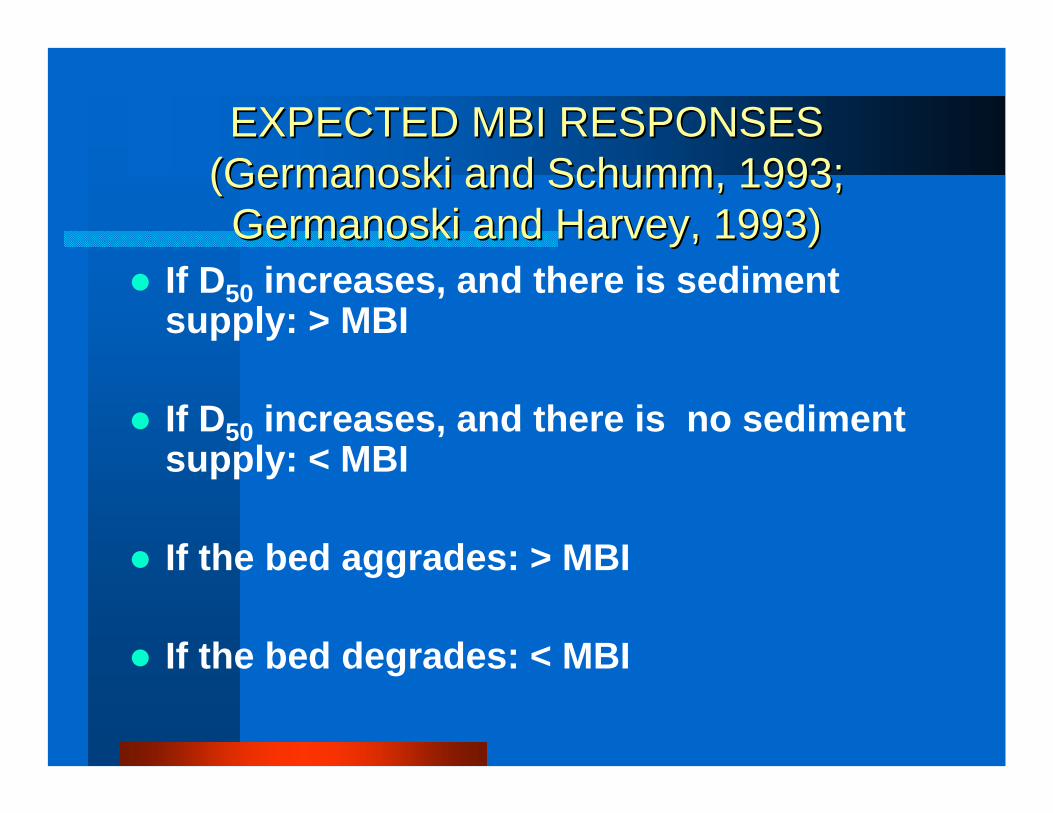
EXPECTED MBI RESPONSESEXPECTED MBI RESPONSES((GermanoskiGermanoski and and SchummSchumm, 1993; , 1993; GermanoskiGermanoski and Harvey, 1993)and Harvey, 1993)
If D50 increases, and there is sediment supply: > MBI
If D50 increases, and there is no sediment supply: < MBI
If the bed aggrades: > MBI
If the bed degrades: < MBI

0.00
1.00
2.00
3.00
4.00
5.00
6.00
7.00
1935 1945 1955 1965 1975 1985 1995
Year
Bar
Inde
x
0
200
400
600
800
1000
1200
1400
1600
Ave
rage
Cha
nnel
Wid
th (f
t)
Modified Braid Bar Index
Alternate Bar Index
Active Channel Width
0.00
0.50
1.00
1.50
2.00
2.50
3.00
1935 1945 1955 1965 1975 1985 1995
Year
Bar
Inde
x
0
200
400
600
800
1000
1200
1400
Ave
rage
Cha
nnel
Wid
th (f
t)
Modified Braid Bar Index
Alternate Bar Index
Active Channel Width
0.00
0.50
1.00
1.50
2.00
2.50
3.00
3.50
4.00
1935 1945 1955 1965 1975 1985 1995
Year
Bar
Inde
x
0
200
400
600
800
1000
1200
1400
1600
Ave
rage
Cha
nnel
Wid
th (f
t)
Modified Braid Bar Index
Alternate Bar Index
Active Channel Width
Pena Blanca Central Avenue
Bernardo
0.00
0.50
1.00
1.50
2.00
2.50
3.00
1935 1945 1955 1965 1975 1985 1995
Year
Bar
Inde
x
0
200
400
600
800
1000
1200
1400
1600
1800
2000
Ave
rage
Cha
nnel
Wid
th (f
t)
Modified Braid Bar Index
Alternate Bar Index
Active Channel Width
0.00
0.20
0.40
0.60
0.80
1.00
1.20
1972 1982 1992 2002
Year
Bar
Inde
x
0
50
100
150
200
250
Ave
rage
Cha
nnel
Wid
th (f
t)
Modified Braid Bar Index
Alternate Bar Index
Active Channel Width
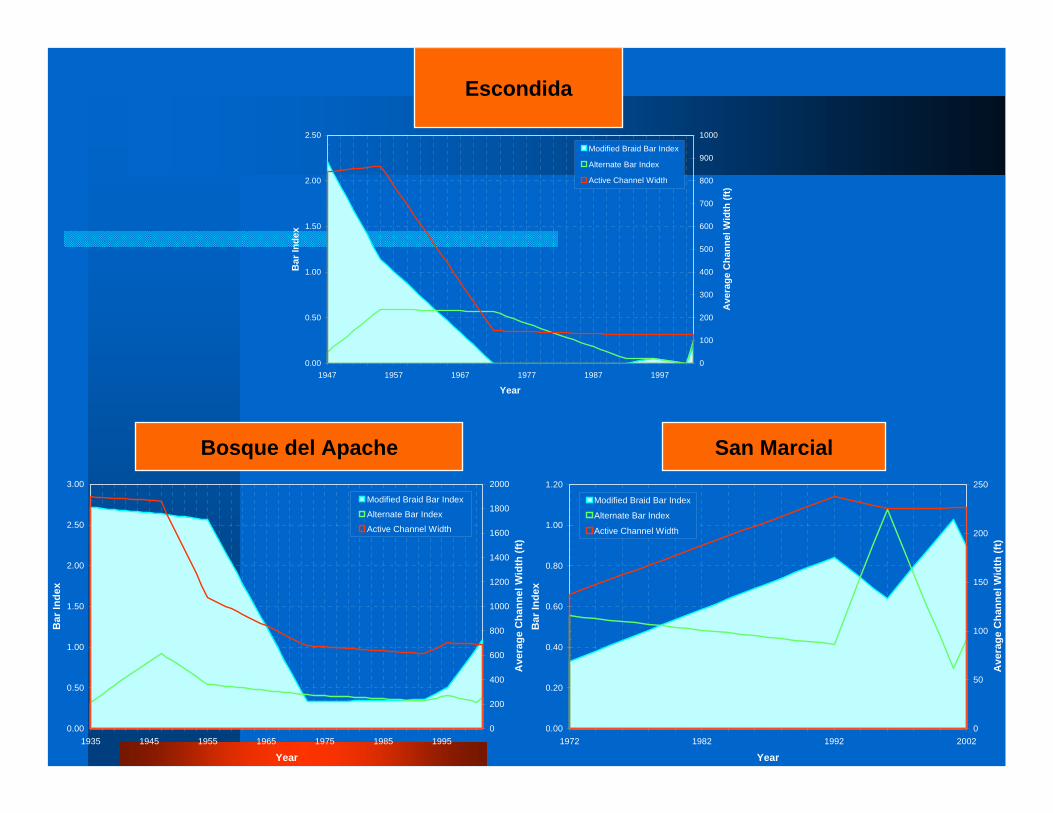
Bosque del Apache San Marcial
0.00
0.50
1.00
1.50
2.00
2.50
1947 1957 1967 1977 1987 1997
Year
Bar
Inde
x
0
100
200
300
400
500
600
700
800
900
1000
Ave
rage
Cha
nnel
Wid
th (f
t)
Modified Braid Bar Index
Alternate Bar Index
Active Channel Width
Escondida

YesSubaerialLevel-1,2Bank-attachedBank-attachedYesSubaerialLevel-1,2Mid-channelMid-channelNoSubaerialLevel-1Bank-attachedAlternateNoSubaerialLevel-1,2Mid-channelBraidNoSubaqueousBedMid-channelLinguoid
PerennialVegetation
Subaqueousor SubaerialElevationLocationBar Type
Hierarchical Bar Classification for the Middle Rio Grande
Hierarchical Bar Classification Hierarchical Bar Classification for the Middle Rio Grandefor the Middle Rio Grande
MEI

Linguoid bar

L-1 braid bars


L-1 braid bar
mud drape
L-2 braid bar
L-1 bank-attached bar

L-1 braid bar
L-1 mid-channel barL-2 braid bar
Linguoid bar

L-2 braid bar
L-2 mid-channel bar
L-1 mid-channel bar

L-2 mid-channel bar

L-2 bank-attached bar
L-1 bank-attached bar

HYDRAULIC ANALYSISHYDRAULIC ANALYSIS
One-dimensional HEC-RAS models
– Fixed-bed analysis– Calibrated to gauged flow at time of
survey and 2005 peak flow (Tetra Tech. (2005)


Central SiteCentral SiteBar Inundation Analysis
1.9-yr
2.9-yr
1.7-yr1.6-yr
1.1-yr
<1.01-yr
<1.01-yr
1.5-yr1.5-yr1.4-yr1.4-yr
1.03-yr
<1.01-yr
<1.01-yr
2.9-yr
5-yr
2.7-yr2.7-yr
1.4-yr
1.1-yr1.05-yr
<1.01-yr
4%
1%
4%5%
12%
29%
47%
95%
6%6%7%8%
21%
51%
91%98%
1%
0%
1%1%
7%
16%17%
92%
0
1000
2000
3000
4000
5000
6000
7000
8000
Linguoid Bar Level-1 Braid Bar
Alternate Bar
Level-2 Braid Bar
Level-1 Mid-Channel Bar
Level-1 Bank-Attached Bar
Level-2 Mid-Channel Bar
Level-2 Bank-Attached Bar
Bar Feature
Dis
char
ge (c
fs)
Mean Inundation Discharge
Minimum Inundation Discharge
Maximum Inundation DischargeMean Channel Capacity
Mean-daily exceedance percent and peak flood return interval of inudation discharge show n next to plotted value.

BAR INUNDATION BAR INUNDATION FREQUENCY & DURATIONFREQUENCY & DURATION
Table ES-1. Summary of frequency and duration of inundation of the
classified bar types at sites without excessive aggradation or degradation.*
Bar Type Inundation Recurrence
Interval
Days per Year of
Inundation
Percent of Year
Inundated Level 1 braid bars < 1 year 290 80% Alternate bars < 1 year 290 80% Level 2 braid bars < 1 year 146 <40% Level 1 mid-channel bars 1.5 years 90 25% Level 1 bank-attached bars 1.5 years 90 25% Level 2 mid-channel bars 2 years 36 <10% Level 2 bank-attached bars 2 years 36 <10%
*excluding the Pena Blanca, Bernalillo, Escondida and San Marcial sites.

BARS AND SHEAR STRESSBARS AND SHEAR STRESS
Table ES-2: Comparison of maximum in-channel shear stresses to the prevalence of bars in the sand-bed sites.
Site Names
Maximum In-Channel Shear
Stresses (lb/ft2)
Prevalence of Active Bars
Central Avenue <0.1 moderate to high number of active bars Bosque del Apache, San Marcial 0.1 high number of active bars Bernardo, La Joya, Lemitar 0.12 - 0.15 active bars are present Belen 0.2 moderate number of active bars Escondida 0.3 virtually no active bars
BARS AND VEGETATIONBARS AND VEGETATION
Shear stress limit for vegetation establishment ~ < 1 psfShear stress limit for vegetation removal ~ > 6 psf

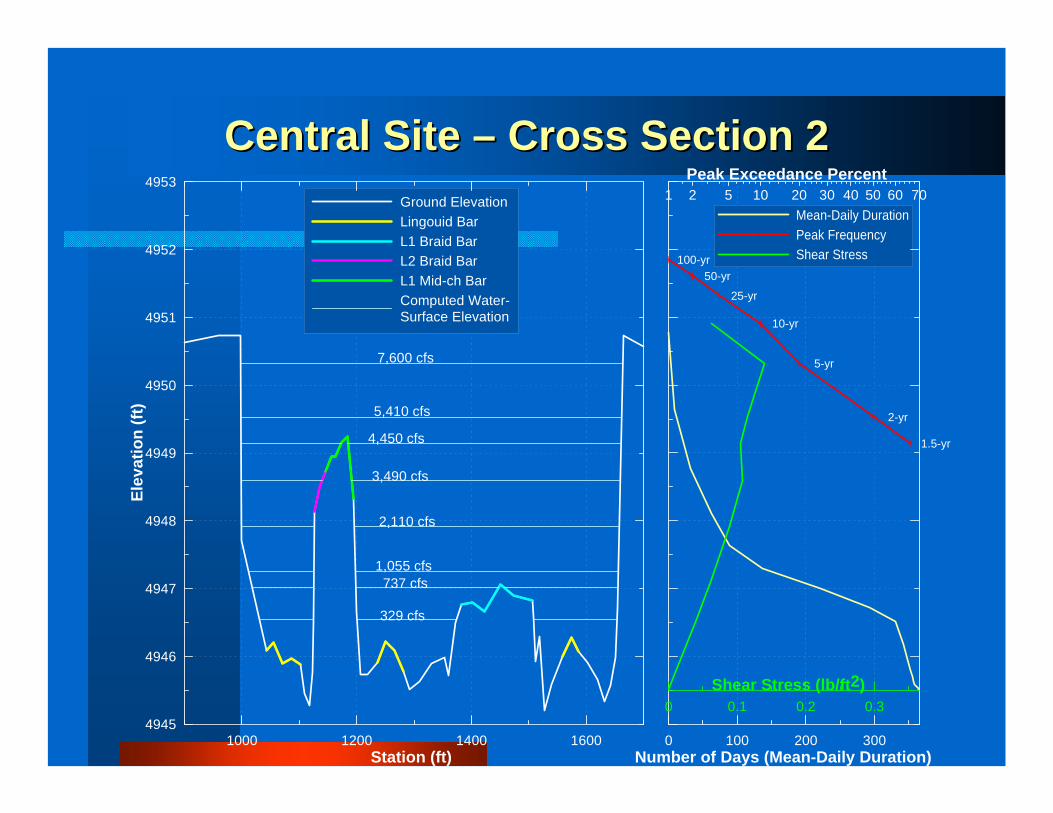
Central Site Central Site –– Cross Section 2Cross Section 2
1000 1200 1400 1600Station (ft)
4945
4946
4947
4948
4949
4950
4951
4952
4953
Elev
atio
n (ft
)
Ground ElevationLingouid BarL1 Braid BarL2 Braid BarL1 Mid-ch BarComputed Water-Surface Elevation
0 100 200 300Number of Days (Mean-Daily Duration)
1.5-yr
2-yr
5-yr
10-yr
25-yr
50-yr100-yr
1 2 5 10 20 30 40 50 60 70Peak Exceedance Percent
Mean-Daily DurationPeak FrequencyShear Stress
0 0.1 0.2 0.3Shear Stress (lb/ft2)
737 cfs
329 cfs
1,055 cfs
2,110 cfs
3,490 cfs
4,450 cfs
5,410 cfs
7,600 cfs

BARS AND DEPOSITIONBARS AND DEPOSITION
Based on surveys of L1 and L2 bars in Albuquerque Reach, pre- and post-2005 high flows
Comparison based on 0.5 ft contour-interval topographic mapping

L1
POST-HIGH FLOWSEDIMENT DEPOSITION
2005
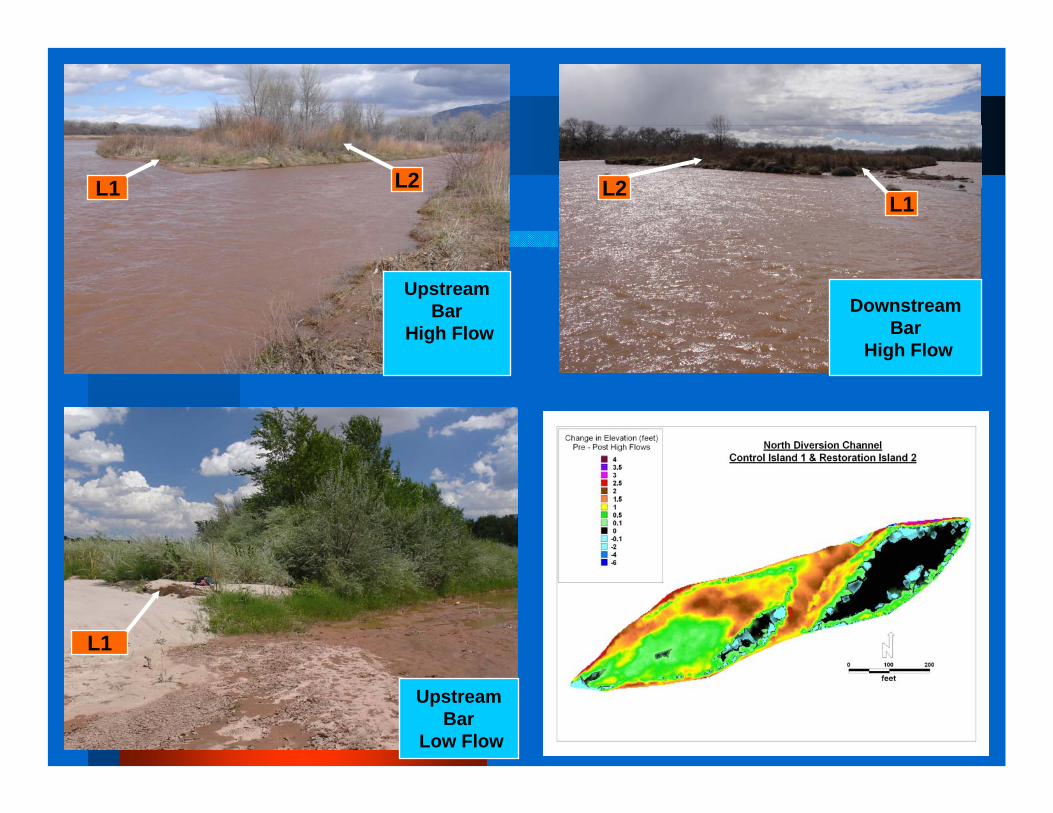
UpstreamBar
High Flow
UpstreamBar
Low Flow
DownstreamBar
High Flow
L1 L2 L2L1
L1

BARS AND DEGRADATIONBARS AND DEGRADATION
Degradation causes hydrologic abandonment of bars
If restoration is being considered is the bed currently stable?
If degradation continues, restoration will be compromised

Abandoned L-2 mid-channel bar

Bernalillo SiteBernalillo SiteBar Inundation Analysis
13.5-yr
4.2-yr3.6-yr
1.6-yr
1.2-yr
<1.01-yr
1.8-yr
1.3-yr1.2-yr
1.03-yr<1.01-yr
100-yr
10.1-yr8.6-yr
4.6-yr4.4-yr
0%
0%0%
6%
11%
32%
4%
8%9%
20%31%
33%
0%
0%0%
0%0%
32%
0
2000
4000
6000
8000
10000
12000
14000
Linguoid Bar Level-1 Braid Bar
Alternate Bar
Level-2 Braid Bar
Level-1 Mid-Channel Bar
Level-1 Bank-Attached Bar
Level-2 Mid-Channel Bar
Level-2 Bank-Attached Bar
Bar Feature
Dis
char
ge (c
fs)
Mean Inundation DischargeMinimum Inundation DischargeMaximum Inundation DischargeMean Channel Capacity
Mean-daily exceedance percent and peak f lood return interval of inudation discharge show n next to plotted value.
No
Ling
uoid
Bar
s Id
entif
ied
in S
tudy
Rea
ch
No
Leve
l-1 B
ank-
Atta
ched
Bar
s Id
entif
ied
in S
tudy
Rea
ch

Bernalillo Site Bernalillo Site –– Cross Section 10Cross Section 10
1000 1200 1400 1600 1800 2000Station (ft)
5046
5048
5050
5052
5054
5056
5058
5060
Elev
atio
n (ft
)
Ground ElevationL1 Braid BarAlternate BarL2 Braid BarL1 Bank-att BarL2 Mid-ch BarL2 Bank-att BarComputed Water-Surface Elevation
0 100 200 300Number of Days (Mean-Daily Duration)
1.5-yr
2-yr
5-yr10-yr
25-yr50-yr
100-yr
1 2 5 10 20 30 40 50 60 70Peak Exceedance Percent
Mean-Daily DurationPeak FrequencyShear Stress
737 cfs882 cfs1,055 cfs
2,110 cfs
3,490 cfs
4,450 cfs5,410 cfs
7,600 cfs8,940 cfs
0 0.1 0.2 0.3Shear Stress (lb/ft2)

Bernalillo SiteBernalillo Site
1.5 2 5 10 25 50 100
0
0.5
1
1.5
2
1000 3000 5000 7000 9000 11000 13000Discharge (cfs)
Dim
ensi
onle
ss G
rain
She
ar
Reach Averaged Hydraulics, D50=37 mm (WC4)
XS8 Hydraulics, D50=37 mm (WC4)
RI (years)

CONCLUSIONSCONCLUSIONS
Bar indices reflect changes in flow, sediment supply and channel morphology
Bar classification is a communication tool, and provides first-cut hydraulic assessments

CONCLUSIONSCONCLUSIONS
Active braid bars require average shear stresses < 0.2 psfInundation of bars leads to vertical growth and reduced frequency and duration of inundationDegradation will adversely affect restoration efforts, so vertical stability must be assessed

APPLICATION TO APPLICATION TO RESTORATIONRESTORATION

Bridge Blvd.

RIO GRANDE SILVERY MINNOWRIO GRANDE SILVERY MINNOWTARGETED LIFE STAGES:-EGGS - LARVAE- JUVENILES
BIOLOGICAL TARGET25 DAYS INUNDATION(~ 7 % EXCEEDENCE)
POST-COCHITI (1974 -2005)Flow Duration Curve:~ 4000 CFS
PHYSICAL NEEDS-LOW VELOCITY-SHALLOW DEPTH

10 30 50 70 9010.10.01 99 99.995Percent of Time Equaled or Exceeded
0.1
1
10
100
1,000
10,000
Dis
char
ge (c
fs)
DryNormalWet
Rio Grande at Albuquerque, NM (Central Ave.)USGS Gage no. 08330000
Flow Duration Curves
25-D
ay E
xcee
danc
e
Class
25-day Exceedance Discharge
(cfs)Dry 1426
Normal 3493Wet 5601

4953.7
4955.1
4956.3
4952
4953
4954
4955
4956
4957
4958
4959
100 1000 10000 100000
Discharge (cfs)
Wat
er-S
urfa
ce E
leva
tion
(ft)
Central Avenue Site (Section 13)
1430
cfs
(Dry
25-
day
Exce
eden
ce)
3500
cfs
(Nor
mal
25-
day
Exc
eede
nce)
5600
cfs
(Wet
25-
day
Exc
eede
nce)

Bridge Blvd.

Rio Grande Phase II
9.4
55.1
832.5
8.534.5
127.4
519
8
51.2
95.2
756.2
5.5 21.5 33.3
293.2
244.5
0
100
200
300
400
500
600
700
800
900
1400 cfs 3500 cfs 5600 cfs >6500 cfs
Discharge (cfs)
Are
a of
Inun
datio
n (a
cres
)
SDCI-40PDNNDC
Note: Areas of inundation represent habitat increases at discharges greater than 1,000 cfs.

Rio Grande Phase II
1.59.0
135.5
1.87.4
27.2
110.9
1.8
11.4
21.1
167.8
2.510.0
15.4
135.8
39.8
0
20
40
60
80
100
120
140
160
180
1400 cfs 3500 cfs 5600 cfs >6500 cfs
Discharge (cfs)
Are
a of
Inun
datio
n (a
cres
) / C
hann
el M
ile
SDCI-40PDNNDC
Note: Areas of inundation represent habitat increases at discharges greater than 1,000 cfs.

Potential Site
Bar Classification Reject
RejectSite
Availability & Constraints
Design Criteria -Egg Retention -Juvenile Habitat
Hydrologic Analysis-25-day duration (6.8% Exceedence)
Design Discharge1,400 cfs 5,600 cfs
3,500 cfs
Hydraulics (HEC-RAS, FLO-2D)Water-Surface Elevation
Design Elevation
L-II mcb, bab
bb, ab L-I mcb, bab
Prior Use Private Property Infrastructure Impacts
Available No Infrastructure Impacts
Dry Wet
Normal
SITE SELECTION SCREENING TOOL

98000 100000 102000 104000 106000 108000 110000 112000 114000Station (ft)
4970
4975
4980
4985
4990
4995
5000El
evat
ion
(ft)
6500 cfs5600 cfs3500 cfs2500 cfs1400 cfs300 cfsPhase II FeaturesChannel Bed
13i
12i
11i3b
10i
9i
8i7i North
6i North6i South6i Chan
14i1b South4i
3i2i
7i SouthFeature Areas(acres)PDN 13i - 3.32PDN 12i - 1.0PDN 11i - 2.76PDN 3b - 1.52PDN 10i - 0.1PDN 9i - 6.25PDN 8i - 0.7PDN 7i - 0.34PDN 6i - 2.63PDN 14i - 1.3PDN 1b - 1.73PDN 4i - 0.3PDN 3i - 2.02PDN 2i - 2.81


TAKE HOME MESSAGESTAKE HOME MESSAGESRestoration requires a clear understanding of river dynamics and biological objectives.Must be able to translate biological objectives into physical parameters to provide a basis of design.Bar classification provides a first-cut tool for relating fluvial process to habitat requirements and initial site selection.