allinea ddt training day cp /path/to/archive/ddt-training.tar.gz ~/ 3-setup the environment in the...
TRANSCRIPT

Allinea DDT Training day
Debug parallel codes efficiently and at-scale

Agenda of the day
09:00 – 09:30 : Registration
09:30 – 10:00 : Presentation – Allinea environment
10:00 – 11:00 : Getting started
11:00 – 11:30 : Coffee Break
11:30 – 11:45 : GPU Debugging (demo only)11:30 – 11:45 : GPU Debugging (demo only)
11:45 – 13:00 : Memory debugging
13:00 – 14:00 : Lunch
14:00 – 14:45 : Incorrect results
14:45 – 15:30 : Memory leaks
15:30 – 16:00 : Coffee Break
16:00 – 17:00 : Allinea MAP demo, free session – brin g your own codes !

And now…
Let's talk about us!

New technologies, more parallelism
Complexity needs to be
minimum
Software
needs to
scale
Machine
size
grows

How does my application scale ?
No instrumentation needed
No source code needed
No recompilation neededNo recompilation needed
Less than 5% runtime overhead
Fully scalable
Run regularly – or in regression tests
Explicit and usable output

• A modern integrated environment for HPC developers
• Supporting the lifecycle of application development
and improvement‒ Allinea DDT : Productively debug code
‒ Allinea MAP : Enhance application performance
Need to dive into the code ?
‒ Allinea MAP : Enhance application performance
• Designed for productivity‒ Consistent easy to use tools
‒ Fewer failed jobs
• Available at EPCC‒ Allinea DDT on 32,768 processes
‒ Allinea MAP available as a trial at 8k processes

Debugging in practiceThe usual method
Run
ProblemCompile Problem
Hypothesis
Who ? Where ?
How ? Why ?
Insert print
statements
Compile
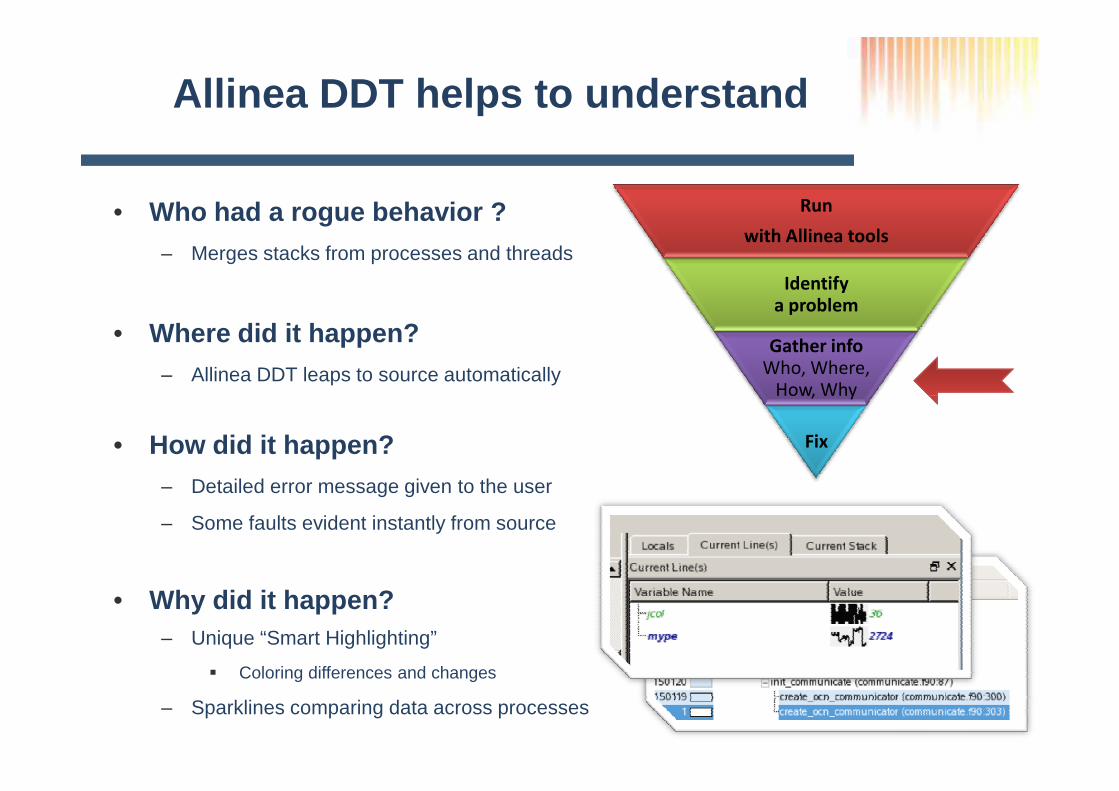
• Who had a rogue behavior ?‒ Merges stacks from processes and threads
• Where did it happen? ‒ Allinea DDT leaps to source automatically
Allinea DDT helps to understand
Run
with Allinea tools
Identify
a problem
Gather info
Who, Where,
How, Why
• How did it happen? ‒ Detailed error message given to the user
‒ Some faults evident instantly from source
• Why did it happen?‒ Unique “Smart Highlighting”
� Coloring differences and changes
‒ Sparklines comparing data across processes
How, Why
Fix

Hands-on workshop

1- Connect to the front-end node :
$ ssh –Y <username>@login.archer.ac.uk
2- Get the training package
$ cp /path/to/archive/ddt-training.tar.gz ~/
3- Setup the environment
In the beginning was the Word
3- Setup the environment
$ module load ddt
4- Read instructions
$ evince instructions.pdf
$ evince agenda.pdf
5- Modify your submission scripts and use aprun to ru n on Archer !
$ vi submission.job
$ qsub submission.job

• Session 1 in training.pdf
• Example 1 : cstartmpi- Start an MPI job with Allinea DDT
- Discovering the GUI
- Detect and correct straightforward crashes
Getting Started with Allinea DDT10:00 – 11:00
- Detect and correct straightforward crashes
- How to replace print statements ?
- Starting Allinea DDT in offline mode
• Key commands in a nutshell :
$ vi submission_script.pbs
$ aprun –n 4 ./cstartmpi.exe arg1 arg2
$ ddt –n 4 ./cstartmpi.exe arg1 arg2

Memory Debugging with Allinea DDT11:45 – 13:00
• Session 2 in training.pdf
• Example 2 : trisol- Enable memory debugging
- Enable guard pages
- Resolve straightforward memory-related crashes- Resolve straightforward memory-related crashes
• Key commands in a nutshell :
$ vi Makefile # you need to enable memory debugging !
$ aprun –n 4 ./trisol.exe
$ ddt –n 4 ./trisol.exe

Incorrect Results with Allinea DDT14:00 – 14:45
• Session 3 on training.pdf
• Example 3 : array- Visualize arrays in a distributed environment
- Filter and detect rogue values in parallel
- Setup watchpoints- Setup watchpoints
• Key commands in a nutshell :
$ aprun –n 8 ./array
$ ddt –n 8 ./array

Memory leaks with Allinea DDT14:45 – 15:30
• Session 4 on training.pdf
• Example 4 : mandel- Analyze the current memory usage
- Analyze memory allocations and statistics
• Key commands in a nutshell :
$ vi Makefile # you need to enable memory debugging !
$ aprun –n 8 ./mandel
$ ddt –n 8 ./mandel

• Allinea MAP demonstration !
• Bring your own code !
Free session16:00 – 17:00
• Try more of the exercises (optional exercises) !

Thank youThank you
Your contacts :– Technical Support team : [email protected]– Sales team : [email protected]