allied grape growers, 2015. all rights reserved. clarksburg district grape day state of the industry...
TRANSCRIPT

Allied Grape Growers, 2015. All rights reserved.
Clarksburg District Grape Day
State of the Industry
Jeff BitterAllied Grape Growers
March 3, 2015

Allied Grape Growers, 2015. All rights reserved.
Sections
• Current Acreage/Grape Supply Position• Macro-trends (A look at the future)• Segmenting the Industry (By price)• Supply Potential by Variety and
Segment

Allied Grape Growers, 2015. All rights reserved.
Current PositionAcreage and Grape Supply
Allied Grape Growers, 2015. All rights reserved.
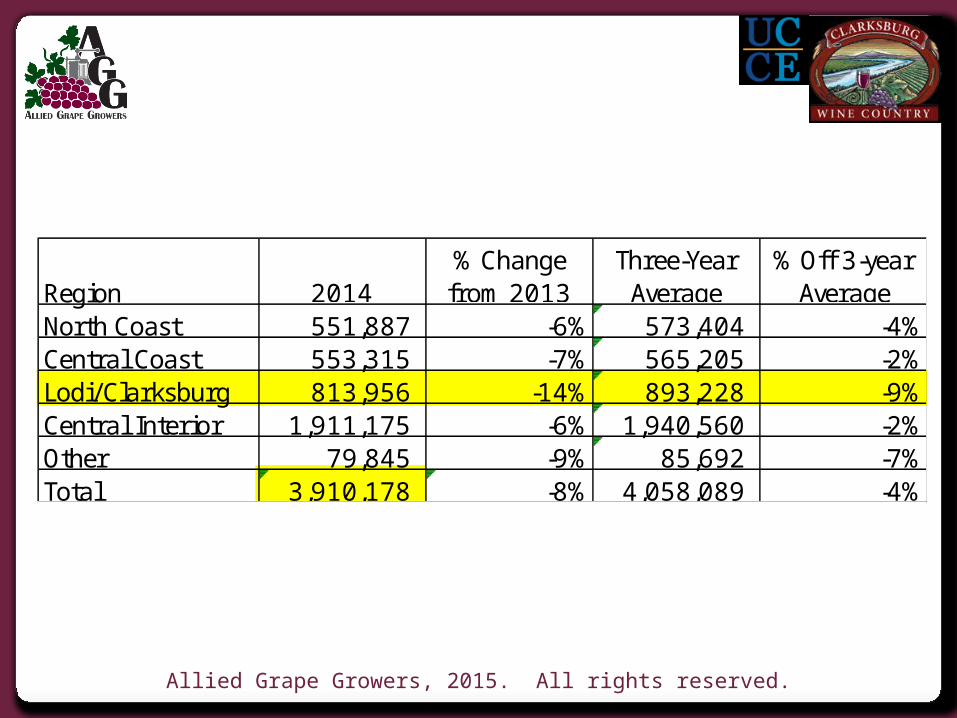
Current PositionAcreage & Grape Supply
Regional Tons
Region 2014% Change from 2013
Three-Year Average
% Off 3-year Average
North Coast 551,887 -6% 573,404 -4%Central Coast 553,315 -7% 565,205 -2%Lodi/Clarksburg 813,956 -14% 893,228 -9%Central Interior 1,911,175 -6% 1,940,560 -2%Other 79,845 -9% 85,692 -7%Total 3,910,178 -8% 4,058,089 -4%

Allied Grape Growers, 2015. All rights reserved.
Current PositionAcreage & Grape Supply
0.00
0.50
1.00
1.50
2.00
2.50
3.00
3.50
4.00
4.50
5.00
2006 2007 2008 2009 2010 2011 2012 2013 2014
3.14 3.253.06
3.70 3.583.34
4.024.25
3.91
3.673.49 3.673.67
Tons(in Millions)
Statewide Grape Crush, 2006-2014
Winegrape Crush Other Crush
4.09 3.98
4.704.39
4.16
Allied Grape Growers, 2015. All rights reserved.
Current PositionAcreage & Grape Supply
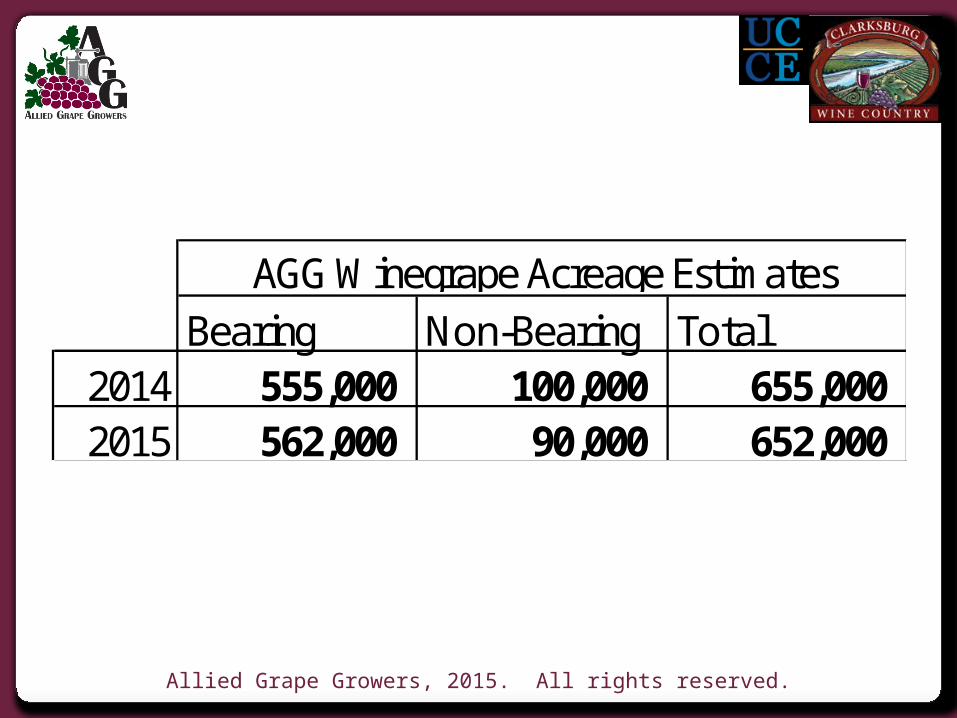
Bearing Non-Bearing Total2014 555,000 100,000 655,000 2015 562,000 90,000 652,000
AGG Winegrape Acreage Estimates
Allied Grape Growers, 2015. All rights reserved.
Current PositionAcreage & Grape Supply
Presentation Assumption:Non-bearing for three years

Allied Grape Growers, 2015. All rights reserved.
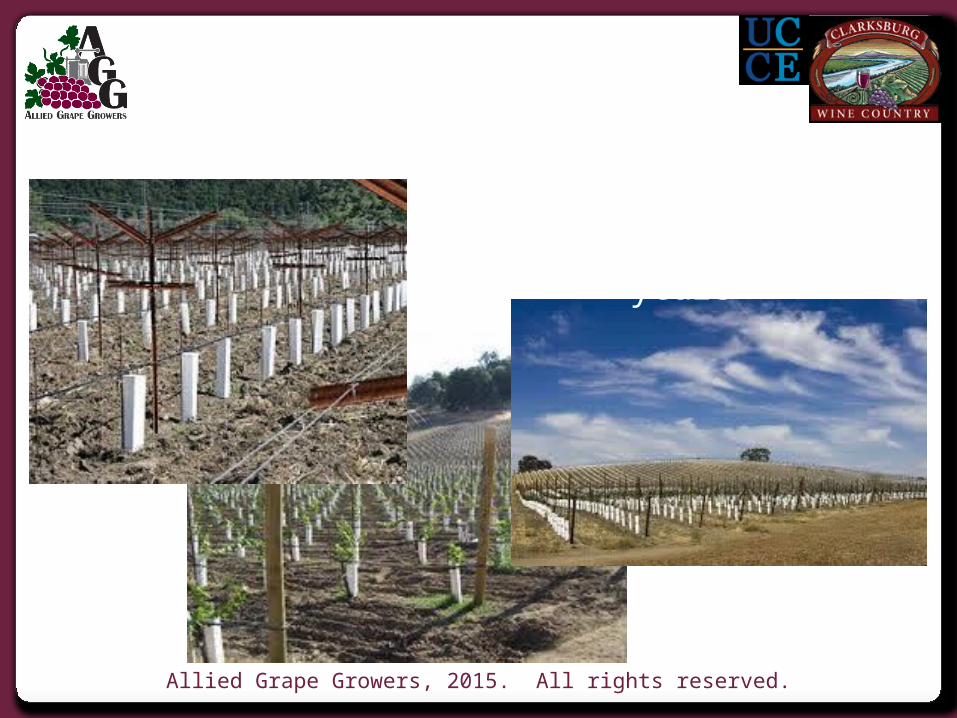
We have observed new plantings statewide, but now we are beginning
to see significant removals
in the interior.
Allied Grape Growers, 2015. All rights reserved.
Current PositionAcreage & Grape Supply
Allied Grape Growers, 2015. All rights reserved.
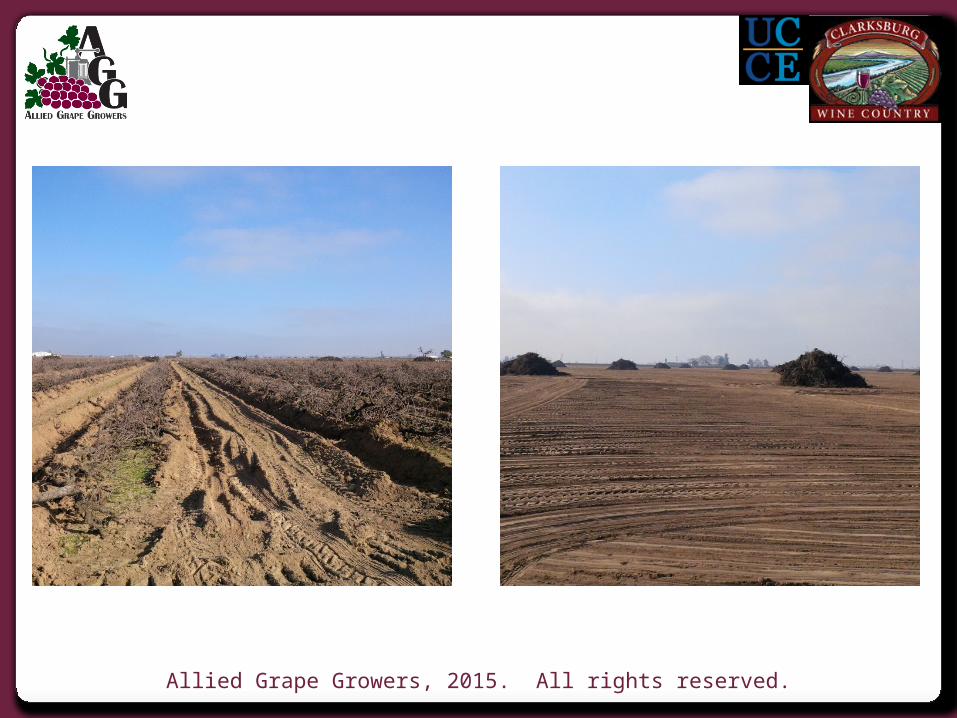
Why are growers pulling vines out?

Allied Grape Growers, 2015. All rights reserved.
Current PositionAcreage & Grape Supply
Lodi – 12/14
Madera – 01/15
Is over-production
limited to the interior regions?
What Happened?• Imports• Large Crops/Ample
Supply• Shipment/Supply
Imbalance
Allied Grape Growers, 2015. All rights reserved.
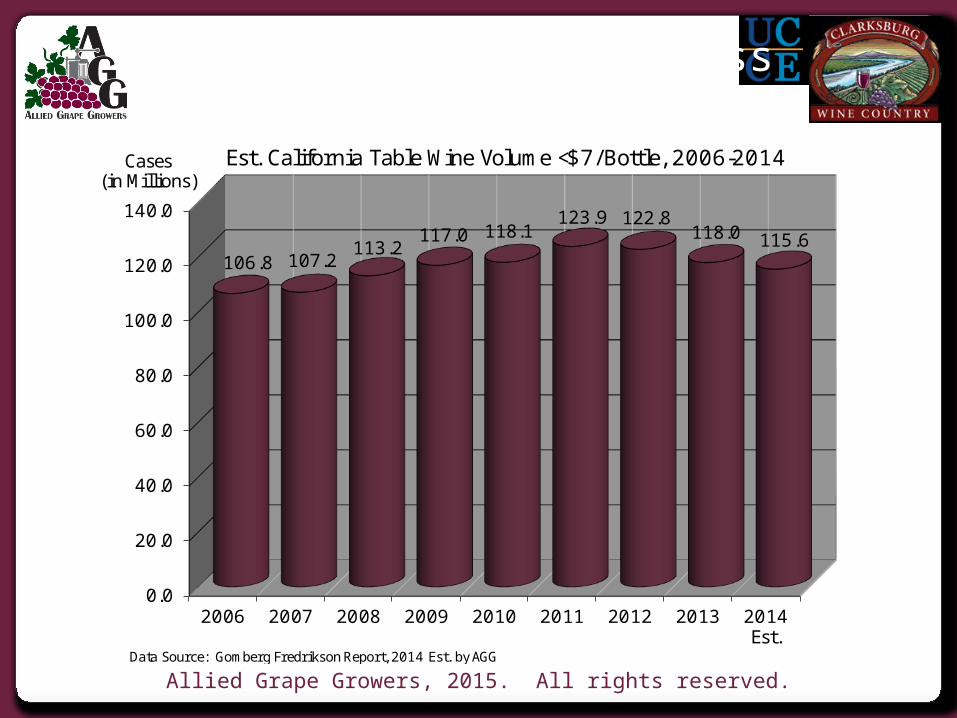
0.0
20.0
40.0
60.0
80.0
100.0
120.0
140.0
2006 2007 2008 2009 2010 2011 2012 2013 2014Est.
106.8 107.2113.2
117.0 118.1123.9 122.8
118.0 115.6
Cases(in Millions)
Est. California Table Wine Volume <$7/Bottle, 2006-2014
Data Source: Gomberg Fredrikson Report, 2014 Est. by AGG
Segmenting the Business
Allied Grape Growers, 2015. All rights reserved.
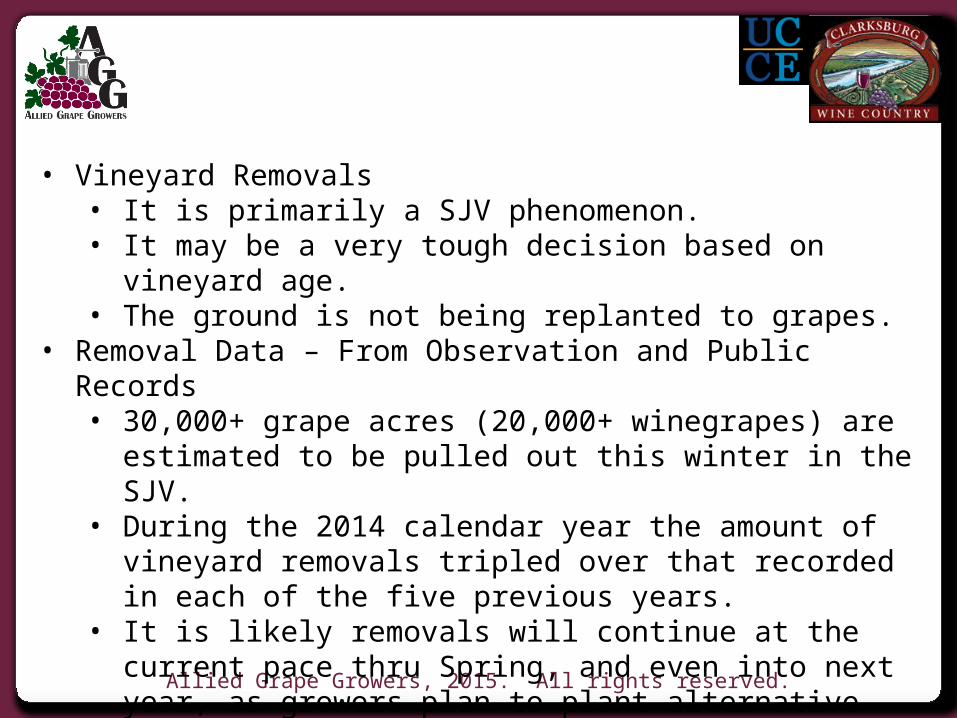
• Vineyard Removals• It is primarily a SJV phenomenon.• It may be a very tough decision based on vineyard
age.• The ground is not being replanted to grapes.
• Removal Data – From Observation and Public Records• 30,000+ grape acres (20,000+ winegrapes) are
estimated to be pulled out this winter in the SJV.• During the 2014 calendar year the amount of
vineyard removals tripled over that recorded in each of the five previous years.
• It is likely removals will continue at the current pace thru Spring, and even into next year, as growers plan to plant alternative crops.
Current PositionAcreage & Grape Supply

Allied Grape Growers, 2015. All rights reserved.
Macro-trends(A look at the Future)
Allied Grape Growers, 2015. All rights reserved.
34.5% White
65.5%
Red
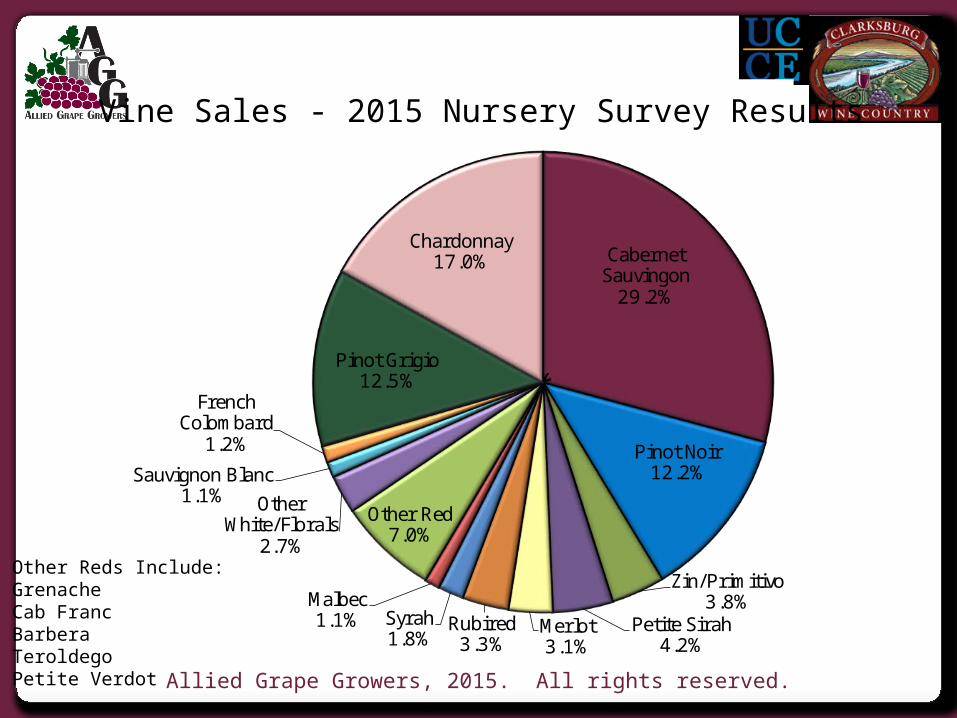
Other Reds Include:GrenacheCab FrancBarberaTeroldegoPetite Verdot
Cabernet Sauvingon
29.2%
Pinot Noir12.2%
Zin/Primitivo3.8%
Petite Sirah4.2%
Merlot3.1%
Rubired3.3%
Syrah1.8%
Malbec1.1%
Other Red7.0%
Other White/Florals
2.7%
Sauvignon Blanc1.1%
French Colombard
1.2%
Pinot Grigio12.5%
Chardonnay17.0%
2014 Winegrape Vines Sold by California NurseriesMacro-trends
Vine Sales - 2015 Nursery Survey Results
Allied Grape Growers, 2015. All rights reserved.
-
5,000
10,000
15,000
20,000
25,000
30,000
35,000
40,000
45,000
2010 2011 2012 2013 2014
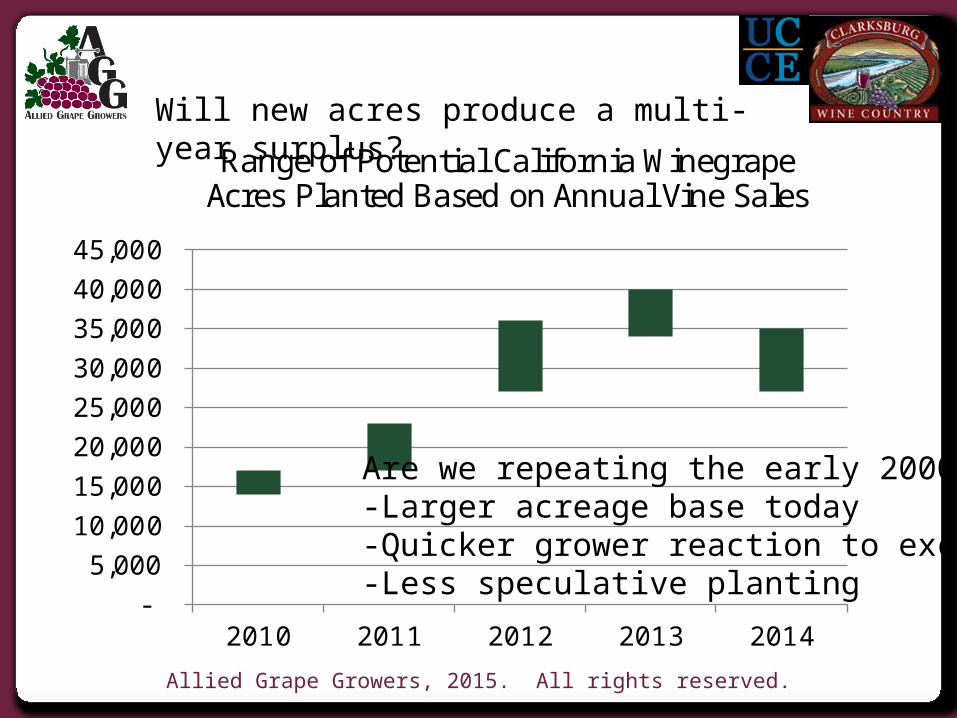
Range of Potential California Winegrape Acres Planted Based on Annual Vine Sales
Macro-trendsWill new acres produce a multi-year surplus?
Are we repeating the early 2000s?-Larger acreage base today-Quicker grower reaction to excess-Less speculative planting

Allied Grape Growers, 2015. All rights reserved.
0.0
0.5
1.0
1.5
2.0
2.5
3.0
3.5
4.0
4.5
5.0
2009 2010 2011 2012 2013 2014Est.
2015Est.
2016Est.
2017Est.
California Wine Shipments and Grape Production (for wine only)2009-2014 with estimates and projections thru 2017
Wine Shipments Grapes Crushed for Wine
Millionsof Tons
California Wine Shipment Data Source:The Gomberg Fredrikson Report
Macro-trends
Assuming attrition rates of 2% coastal and 6% interior,We are forecast to produce along the demand trendline.
Allied Grape Growers, 2015. All rights reserved.
0
10
20
30
40
50
60
70
80
90
100
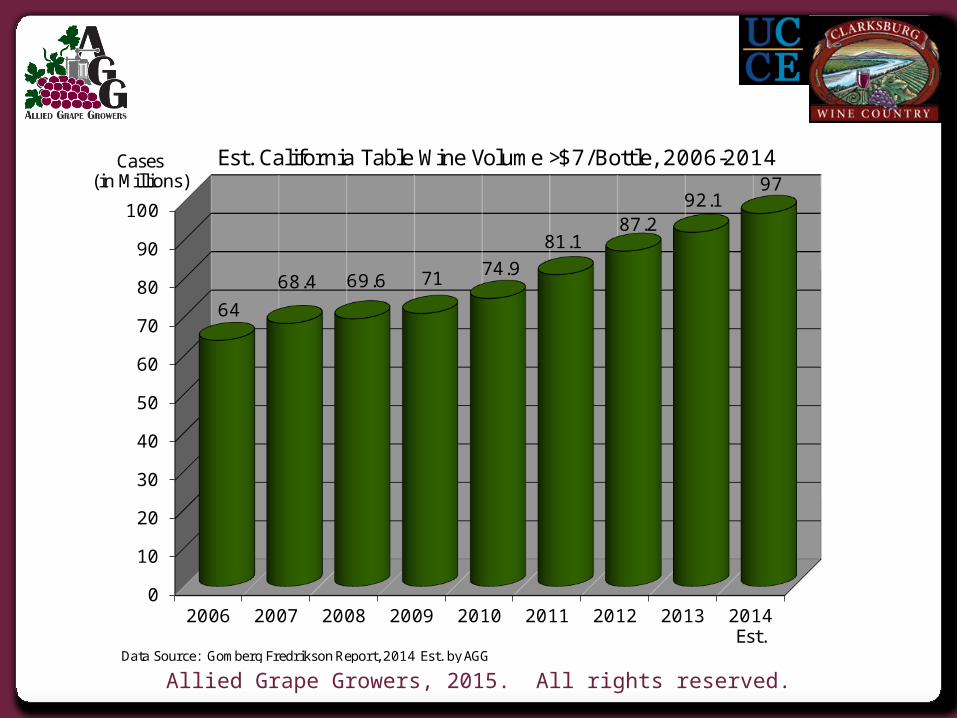
2006 2007 2008 2009 2010 2011 2012 2013 2014Est.
64
68.4 69.6 71 74.9
81.187.2
92.197
Cases(in Millions)
Est. California Table Wine Volume >$7/Bottle, 2006-2014
Data Source: Gomberg Fredrikson Report, 2014 Est. by AGG
Macro-trends

Allied Grape Growers, 2015. All rights reserved.
Segmentingthe Industry

Allied Grape Growers, 2015. All rights reserved.
Allied Grape Growers, 2015. All rights reserved.
Segmenting the Business
• <$10 – Everyday Wines – (The “Value” Category)• The backbone of the industry• Highly competitive (not only within the wine business,
but among competing beverage industries)• The bottom end of this segment has been declining in
volume for decades• Generally characterized by higher volume/lower
margin• Limited differentiation• Lower portions of this segment may exist due to
oversupplies of wine worldwide• Competing interest – production agriculture• Geographically – the interior regions
• (Grapes <$1,000/ton)
Bottle Prices:Less than $10 / $10-20 / and above $20
Allied Grape Growers, 2015. All rights reserved.
Segmenting the Business
• $10-20 - Premium Segment (The “Mid” Category)• Seemingly more mainstream to the U.S. consumer• Consumer confidence and value are keys to success• Grape buyers looking to average down their cost• Growers challenging the paradigm of low-yield = high
quality• Geographically – coastal regions
• (Grapes $1,000-2,000/ton)
Bottle Prices:Less than $10 / $10-20 / and above $20
Allied Grape Growers, 2015. All rights reserved.
Segmenting the Business
• >$20 - Luxury Segment (The “High” Category)• Based on discretionary income• Highly differentiated; provides unique experience• Limited land & unique sites (grape
growing/marketing)• Ultimate place in the business for differentiation• Grants the most ability to invest in quality & pass
along cost• Geographically – Very specific coastal areas
• (Grapes >$2,000/ton)
Bottle Prices:Less than $10 / $10-20 / and above $20

Allied Grape Growers, 2015. All rights reserved.
Segmenting the Business
Essentially, the California Coast
Range is the geographic line that
represents the+/- $10/bottle pivot point in the market.
<$10
>$10= <$10= $10-20= >$20
Allied Grape Growers, 2015. All rights reserved.
Segmenting the Business
-
5,000,000
10,000,000
15,000,000
20,000,000
25,000,000
30,000,000
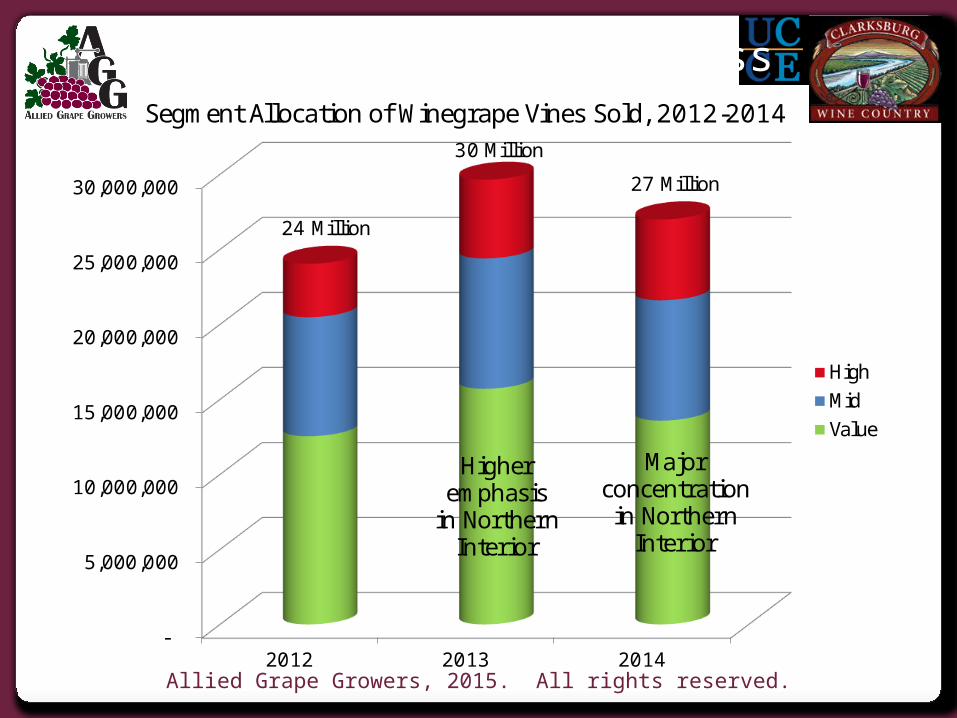
2012 2013 2014
Segment Allocation of Winegrape Vines Sold, 2012-2014
HighMidValue
24 Million
30 Million
27 Million
Higheremphasis
in NorthernInterior
Majorconcentrationin Northern
Interior

Allied Grape Growers, 2015. All rights reserved.
Supply PotentialBy Variety and Segment

Allied Grape Growers, 2015. All rights reserved.
Supply Potential - Chardonnay
-
5,000
10,000
15,000
20,000
25,000
30,000
35,000
40,000
45,000
50,000
High Mid Value
Est. California Chardonnay Bearing Acres, 2013-2017
2013 2014 2015 2016 2017
Includes 2% Attrition Rate
0% 1% 2%
3% 3% 4%
-1% 4% 4%
Allied Grape Growers, 2015. All rights reserved.
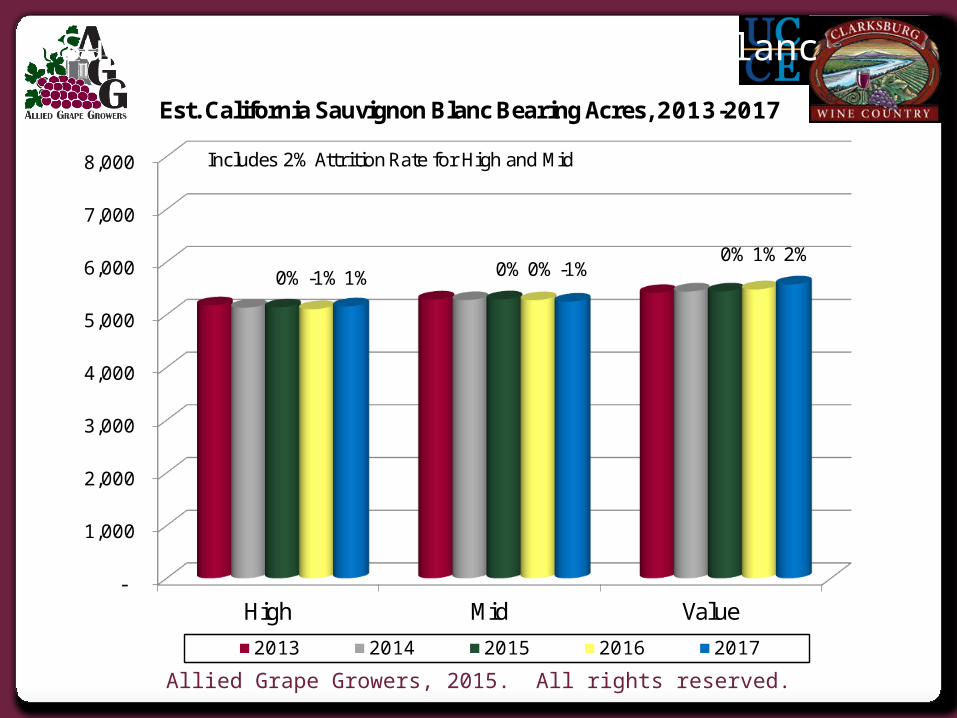
Supply Potential – Sauvignon Blanc
-
1,000
2,000
3,000
4,000
5,000
6,000
7,000
8,000
High Mid Value
Est. California Sauvignon Blanc Bearing Acres, 2013-2017
2013 2014 2015 2016 2017
Includes 2% Attrition Rate for High and Mid
0% -1% 1% 0% 0% -1%0% 1% 2%
Allied Grape Growers, 2015. All rights reserved.
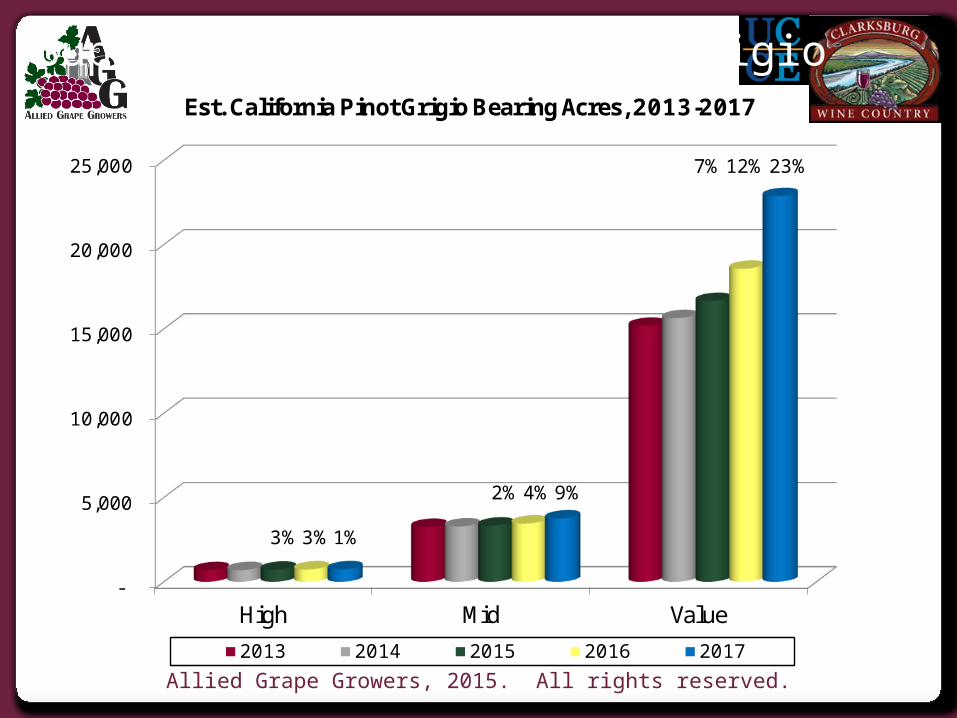
Supply Potential – Pinot Grigio
-
5,000
10,000
15,000
20,000
25,000
High Mid Value
Est. California Pinot Grigio Bearing Acres, 2013-2017
2013 2014 2015 2016 2017
3% 3% 1%
2% 4% 9%
7% 12% 23%

Allied Grape Growers, 2015. All rights reserved.
Supply Potential - Merlot
-
5,000
10,000
15,000
20,000
25,000
30,000
High Mid Value
Est. California Merlot Bearing Acres, 2013-2017
2013 2014 2015 2016 2017
Includes 2% Attrition Rate
-2% -1% -1%1% 0% 0%
1% 2% 1%
Allied Grape Growers, 2015. All rights reserved.
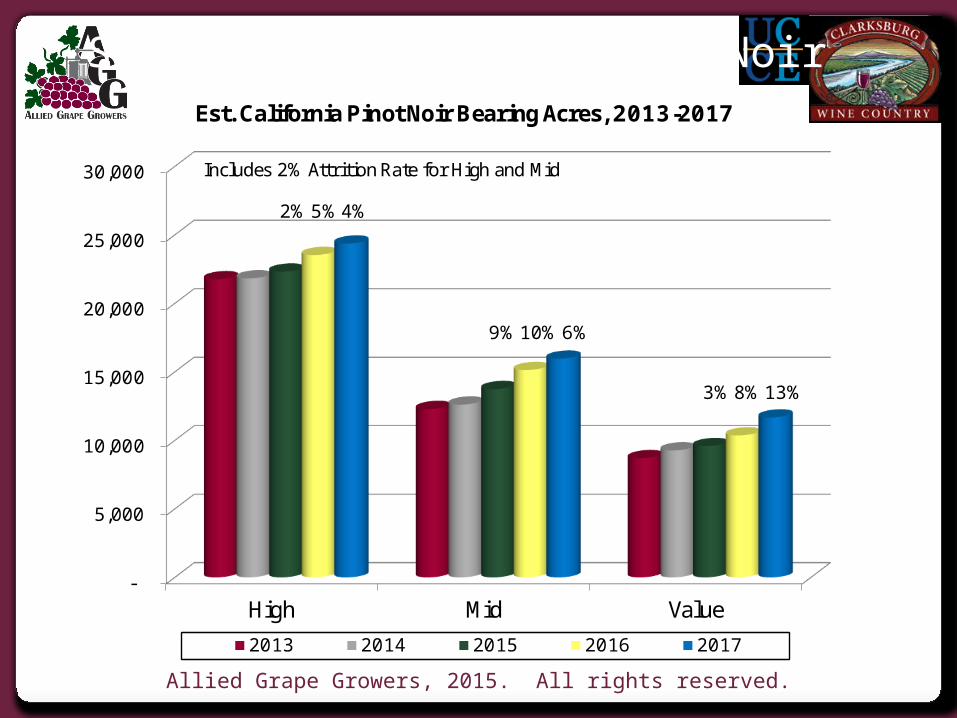
Supply Potential - Pinot Noir
-
5,000
10,000
15,000
20,000
25,000
30,000
High Mid Value
Est. California Pinot Noir Bearing Acres, 2013-2017
2013 2014 2015 2016 2017
Includes 2% Attrition Rate for High and Mid
2% 5% 4%
9% 10% 6%
3% 8% 13%
Allied Grape Growers, 2015. All rights reserved.
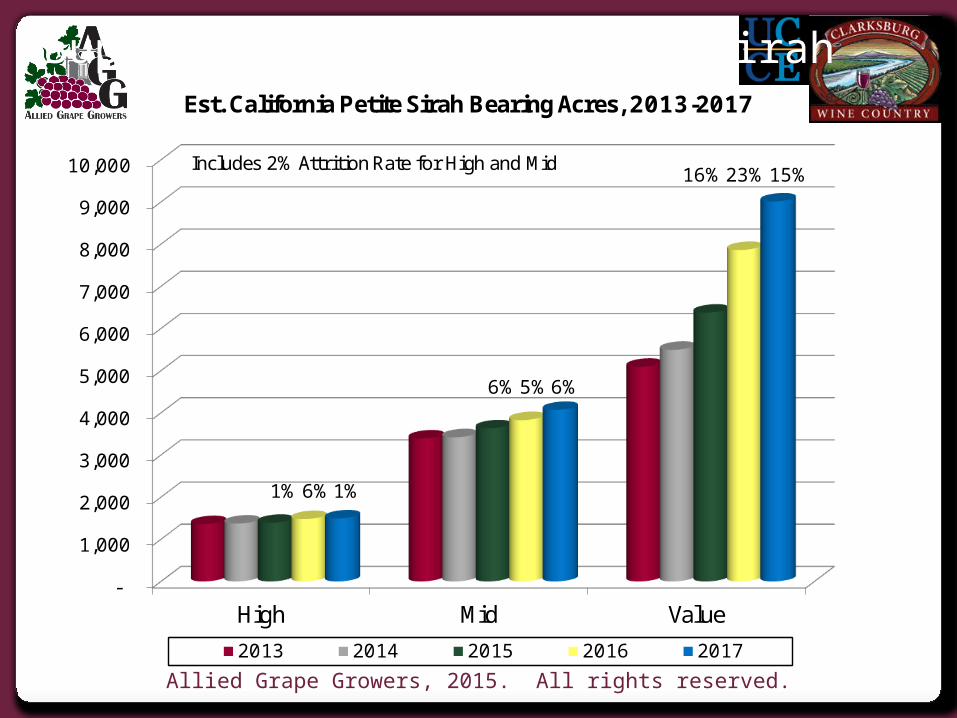
Supply Potential – Petite Sirah
-
1,000
2,000
3,000
4,000
5,000
6,000
7,000
8,000
9,000
10,000
High Mid Value
Est. California Petite Sirah Bearing Acres, 2013-2017
2013 2014 2015 2016 2017
Includes 2% Attrition Rate for High and Mid
1% 6% 1%
6% 5% 6%
16% 23% 15%
Allied Grape Growers, 2015. All rights reserved.
-
50,000
100,000
150,000
200,000
250,000
300,000
350,000
High Mid Value
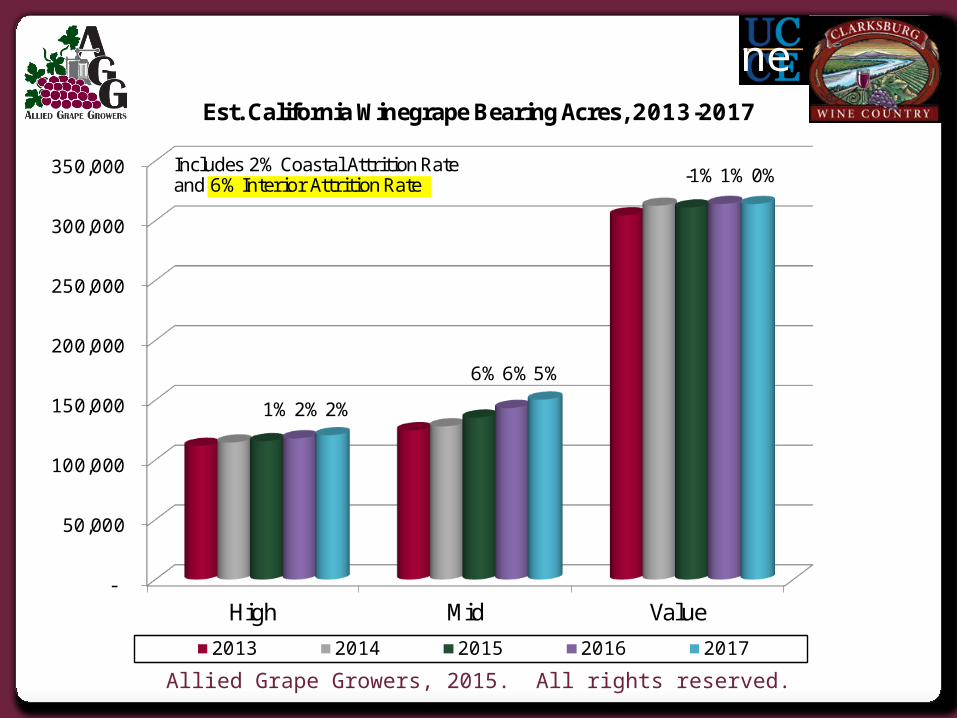
Est. California Winegrape Bearing Acres, 2013-2017
2013 2014 2015 2016 2017
Includes 2% Coastal Attrition Rateand 6%Interior Attrition Rate
1% 2% 2%
6% 6% 5%
-1% 1% 0%
Supply Potential - All Wine

Allied Grape Growers, 2015. All rights reserved.
Summing up for Success• Market growth is currently at higher price points.
This is a prime opportunity to differentiate.• Focus on promoting California (A grower driven marketing
order?)• Embrace sustainability (on our terms)
• Industry growth requires continued investment in our future.
• Clean vine stock protocols• Pest/disease prevention and control programs
• Continue to monitor production increases and inventories.• A healthy industry strives for growth but requires balance• Planting for need is critical; pulling for lack of market is
essential• Opportunities exist, even in segments of the
business that appear disadvantaged at the moment.
Allied Grape Growers, 2015. All rights reserved.
For more information,visit us at:
alliedgrapegrowers.org