alliance international conference on artificial …...alliance international conference on...
TRANSCRIPT
Alliance International Conference on Artificial Intelligence and Machine Learning (AICAAM), April 2019
310
IMPACT ON GROUNDWATER AND SOIL DUE
TO SOLID WASTE DUMP
A CASE STUDY OF S. BINGIPUR IN BANGALORE
Dr.Basavaraj Paruti*, Dr. Santhaveeranagoud. B
**
* Department of Civil Engineering
Alliance College of Engineering and Design,
Alliance University Bangalore, India
** Department of Civil Engineering
UVCE, Bangalore University
Bangalore, India
Abstract- Municipal Solid Waste Management has become one of the major problems in urban and semi-
urban areas. Improper MSW disposal and management causes all types of pollution: air, soil, and water.
Indiscriminate dumping of wastes contaminates surface and ground water supplies. Health and safety
issues also arise from open dumping. The report starts with various approaches to manage municipal solid
waste and a plan to implement an integrated solid waste management for a city. Solid wastes have
potential for causing serious adverse impact on the environment. Ground water & Surface water
Contamination, Land Pollution, and Air Quality Deterioration. Leachate is a toxic liquid that seeps
through solid waste in a land fill. This process extracts soluble dissolved and suspended materials from
the waste. It contains bacteria, toxic substances, heavy metals, etc . The impact assessment of the open
dumping was assessed by collecting and analyzing ground water and soil (within 5 km of the site) around
S Bingipur village dump yard in Bangalore city. The focus of this study is to assess the contribution of
waste dumping in soil contamination and in groundwater pollution. Collected surface soil samples from
the open waste dumping area and controlled site (away from dumping yard) were examined and found
variation in the soil composition. On the other hand, ground water samples were collected from the
nearby village bore wells and lake, were analyzed and observed contamination of groundwater up to
certain limit. This paper presents the impact of open dumping of solid waste on surrounding water and
soil.
Index Terms- Municipal Solid Waste Management, Soil & Groundwater pollution, open dumping and
Landfill, Leachate
I. INTRODUCTION
The threat of environmental pollution has been remaining the human world and is still growing fast due to
excessive population growth in developing countries. Municipal solid waste (MSW) normally termed as
garbage or trash is an unavoidable consequence of human activity. Population growth and economic
development lead to enormous amounts of solid waste generation by the dwellers of urban areas. Urban
MSW is usually generated from human settlements, small industries and commercial activities .Solid
waste from hospitals and clinics is an additional source of MSW. Most of the countries do not have any
specific technique of managing hospital and clinical wastes. So, they are mixed with MSW and pose a
threat to human population and surrounding environment. Unsuitable disposal of MSW causes all types of
Alliance International Conference on Artificial Intelligence and Machine Learning (AICAAM), April 2019
311
pollution: air, soil, and water. Indiscriminate dumping of wastes contaminates surface and ground water
supplies. In urban areas, MSW clogs drains, creating stagnant water for insect breeding and floods during
rainy seasons. Open burning of MSW contributes significantly to urban air pollution. Open dumping is
quite common in developing countries due to low budget available for waste disposal. It also poses
serious threat to groundwater. Health and safety issues also arise from improper MSWM. Insect and
rodent vectors are attracted to the waste and can spread diseases such as cholera and dengue fever. Using
water polluted by MSW for bathing, food, irrigation and drinking water can also expose individuals to
disease organisms and other contaminants. In India, dumping on land is the most common method of
waste disposal, because it is the cheapest method of waste disposal. Still, this method requires large area
and proper drainage. The land disposal of municipal and industrial solid waste is potential cause of
groundwater contamination. Unscientifically managed dumping yards are prone to groundwater
contamination because of leachate production. Leachate is the liquid that seeps from solid wastes or other
medium and have extracts with dissolved or suspended materials from it.
The volume of leachate depends principally on the area of the landfill, the meteorological and hydro-
geological factors and effectiveness of capping. It is essential that the volume of leachate generated be
kept to a minimum and ensures that the access of groundwater and surface water is minimized and
controlled. The volume of leachate generated is therefore expected to be very high in humid regions with
high rainfall, or high run off and shallow water table. Leachate from the solid waste dump has a
significant effect on the chemical properties as well as the geotechnical properties of the soil. Leachate
can modify the soil properties and significantly alter the behavior of soil.
The present study has been focused to conduct a detailed analysis of S.Bingipura solid waste landfill site
to fulfill the following objectives:
Assessment of quality of water bodies surrounding S.Bingipura
To determine the nature of soil around the landfill site.
Also compared the soil characteristics for contaminated and uncontaminated soil in the study
area.
II. MATERIALS AND METHODS
2.1. Description of the Study Area
Bangalore is also known as the silicon valley of India. Bangalore urban district is located on the Deccan
Plateau in the south eastern part of Karnataka. Bangalore district lies between 12039’ to 13
018’ North
Latitude and 77022’ to 77
052’ East Longitude. The temperature in the district is known to vary between
390C (Max.) to 11
0C (Min.). The average rainfall in the district is found to be 831mm. The district
comprises of the following river: Shimsha, Kanva, Arkavathi, South Pennar and Vrishabhavathi. Total
geographical area of the district is 2196 sq.km. The city is situated at an elevation of 920m above MSL.
The district is spread across four Taluks; Bangalore North, Bangalore East, Bangalore South and Anekal.
Bangalore is a hub for Information Technology, Biotechnology, Aerospace, & key knowledge based
industries.
As per provisional reports of Census India, population of Bangalore in 2011 is 96, 21, 551; of which male
and female are 50,22,661 and 45,98,890 respectively. The sex ratio of Bangalore is 916 females per 1000
Alliance International Conference on Artificial Intelligence and Machine Learning (AICAAM), April 2019
312
males. The population density of Bangalore is 4,381 per sq.km. The Population growth of the city as per
Census 2011 was found to be 47.18%.
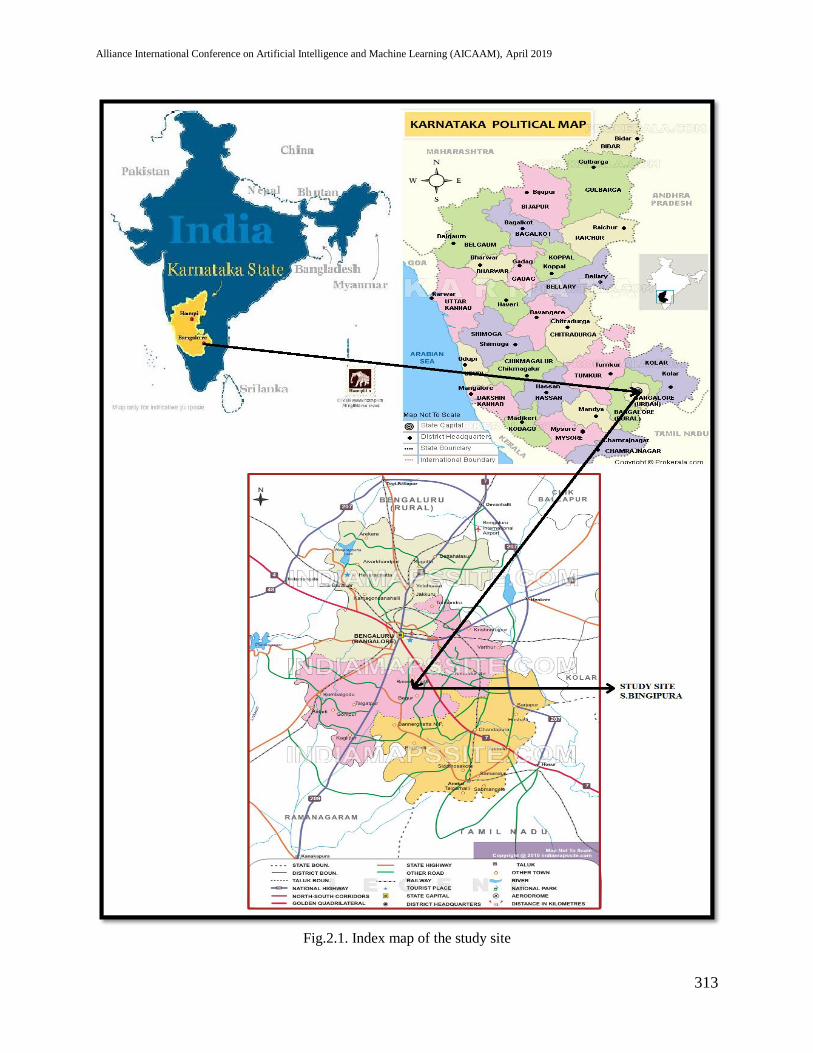
The study was carried out at S.Bingipura. village located in the state of Karnataka as shown in Figure 2.1.
The village lies in Bangalore Urban district and the block/tehsil is Anekal. S.Bingipura is situated about
21.30 km from the city, with an average height of about 915m above MSL. The study started in the month
of January 2016, but presently the site is being closed down and they are proposing a park at the site. The
site is known to receive 1.45 lakh tons quantity of waste from Bommanahalli BBMP zone area.
Alliance International Conference on Artificial Intelligence and Machine Learning (AICAAM), April 2019
313
Fig.2.1. Index map of the study site
Alliance International Conference on Artificial Intelligence and Machine Learning (AICAAM), April 2019
314
2.2 Sampling and Analytical Methods
Since there is no proper solid waste treatment and disposal, at the dump yard, there is a possibility of
contamination to soil and groundwater in and around the site. So, a soil sample from the dump yard and
soil away from the dump yard are collected for testing and comparison. Similarly, to check whether the
ground water is being contaminated or not, the ground water samples were collected from a neighboring
area (5 km) and tested. Soil samples were collected from the dumpsite, by removing the surface debris
and subsurface soil dug to a depth of about 30cm and 1m with a hand auger. 5 Kg of soil sample was
taken into the sterile containers and labeled. The samples were carried to laboratory and analyzed for
water and soil chemical properties. The analysis was done as per the standard methods. Various Physico-
chemical parameters examined in water samples include, pH, electrical conductivity (EC), total dissolved
solids (TDS), total alkalinity (TA), total hardness (TH), calcium, magnesium, potassium, iron, chlorides,
turbidity, Nitrates. Similarly soil samples were tested for moisture content, specific gravity, density of
soil,gradation of soil properties, bulk density, electrical conductivity (EC) .The results were compared
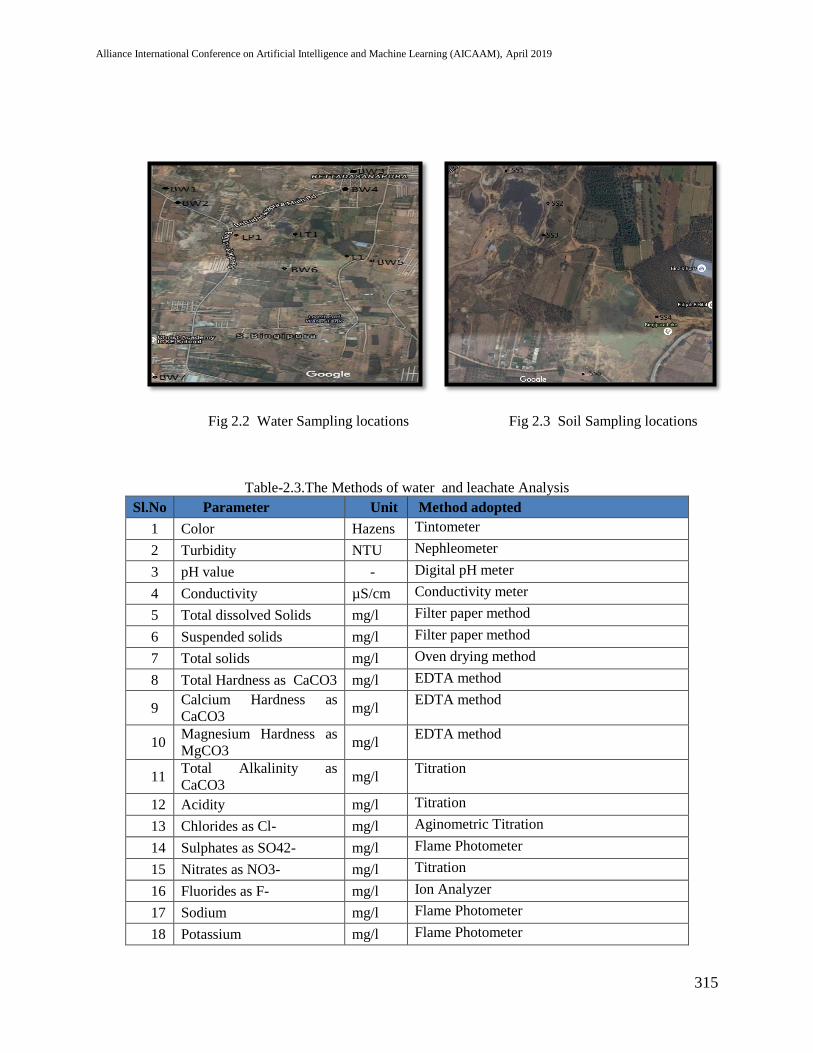
with BIS standard limits. The sampling locations were located on map(Figure 2.2 and 2.3) with help of
GPS and detail of the site is given in Table.2.2. The methods adopted for the various parameters of soil
and water analysis is mentione in the Table-2.3 and 2.4.
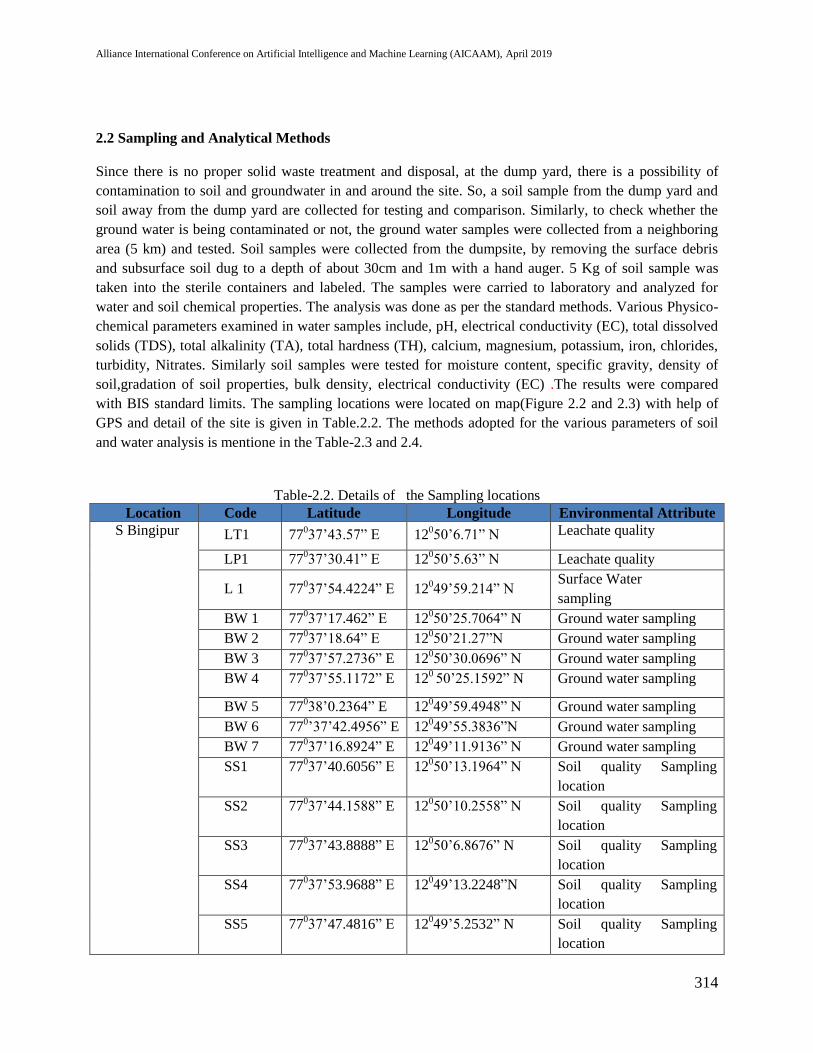
Table-2.2. Details of the Sampling locations
Location Code Latitude Longitude Environmental Attribute
S Bingipur LT1 77037’43.57” E 12
050’6.71” N Leachate quality
LP1 77037’30.41” E 12
050’5.63” N Leachate quality
L 1 77037’54.4224” E 12
049’59.214” N
Surface Water
sampling
BW 1 77037’17.462” E 12
050’25.7064” N Ground water sampling
BW 2 77037’18.64” E 12
050’21.27”N Ground water sampling
BW 3 77037’57.2736” E 12
050’30.0696” N Ground water sampling
BW 4 77037’55.1172” E 12
0 50’25.1592” N Ground water sampling
BW 5 77038’0.2364” E 12
049’59.4948” N Ground water sampling
BW 6 770’37’42.4956” E 12
049’55.3836”N Ground water sampling
BW 7 77037’16.8924” E 12
049’11.9136” N Ground water sampling
SS1 77037’40.6056” E 12
050’13.1964” N Soil quality Sampling
location
SS2 77037’44.1588” E 12
050’10.2558” N Soil quality Sampling
location
SS3 77037’43.8888” E 12
050’6.8676” N Soil quality Sampling
location
SS4 77037’53.9688” E 12
049’13.2248”N Soil quality Sampling
location
SS5 77037’47.4816” E 12
049’5.2532” N Soil quality Sampling
location
Alliance International Conference on Artificial Intelligence and Machine Learning (AICAAM), April 2019
315
Fig 2.2 Water Sampling locations Fig 2.3 Soil Sampling locations
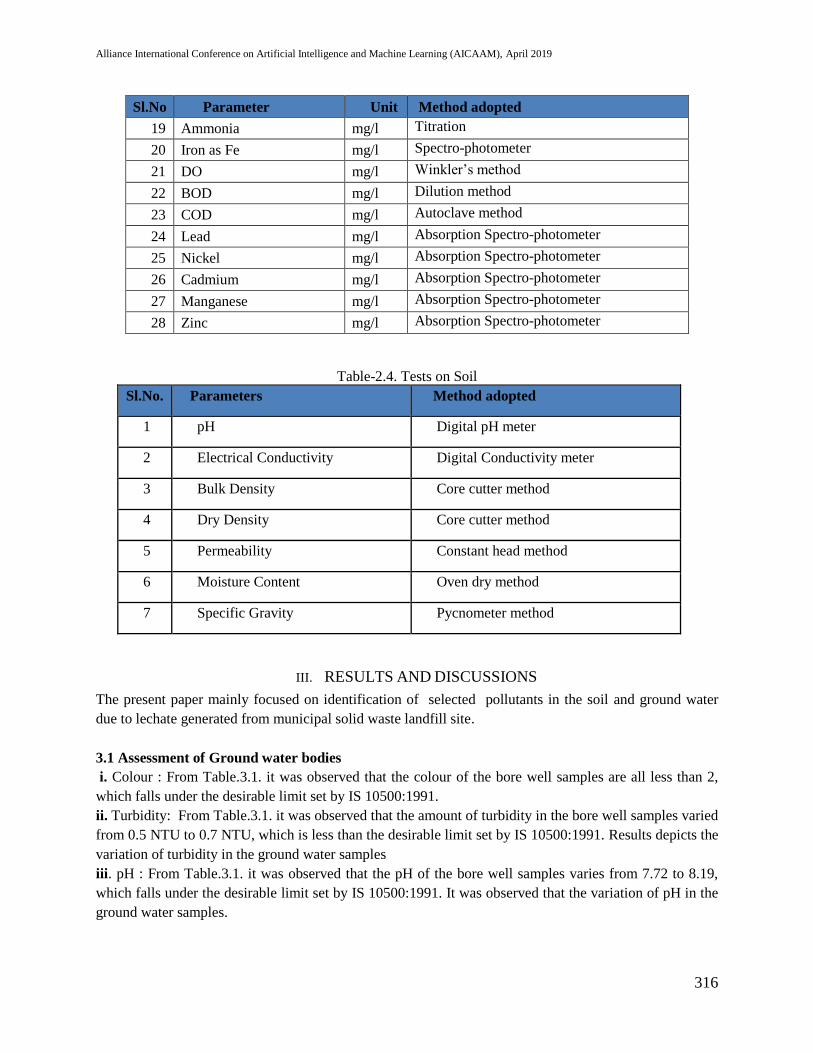
Table-2.3.The Methods of water and leachate Analysis
Sl.No Parameter Unit Method adopted
1 Color Hazens Tintometer
2 Turbidity NTU Nephleometer
3 pH value - Digital pH meter
4 Conductivity µS/cm Conductivity meter
5 Total dissolved Solids mg/l Filter paper method
6 Suspended solids mg/l Filter paper method
7 Total solids mg/l Oven drying method
8 Total Hardness as CaCO3 mg/l EDTA method
9 Calcium Hardness as
CaCO3 mg/l
EDTA method
10 Magnesium Hardness as
MgCO3 mg/l
EDTA method
11 Total Alkalinity as
CaCO3 mg/l
Titration
12 Acidity mg/l Titration
13 Chlorides as Cl- mg/l Aginometric Titration
14 Sulphates as SO42- mg/l Flame Photometer
15 Nitrates as NO3- mg/l Titration
16 Fluorides as F- mg/l Ion Analyzer
17 Sodium mg/l Flame Photometer
18 Potassium mg/l Flame Photometer
Alliance International Conference on Artificial Intelligence and Machine Learning (AICAAM), April 2019
316
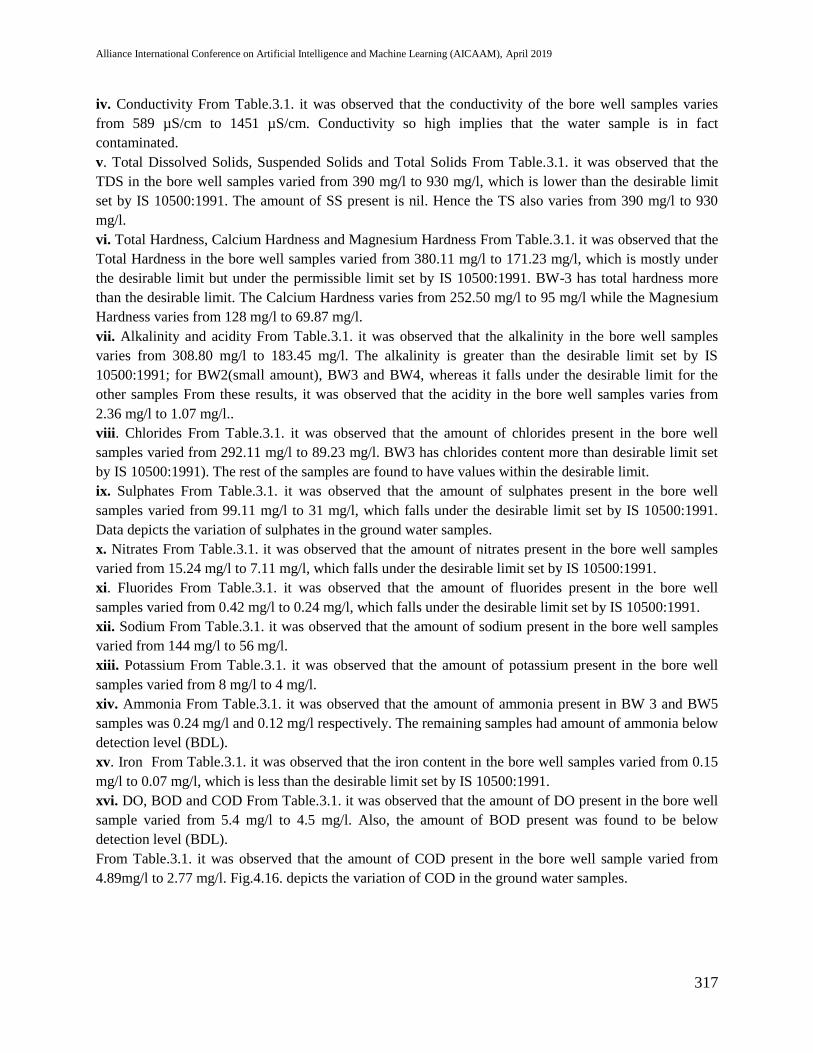
Sl.No Parameter Unit Method adopted
19 Ammonia mg/l Titration
20 Iron as Fe mg/l Spectro-photometer
21 DO mg/l Winkler’s method
22 BOD mg/l Dilution method
23 COD mg/l Autoclave method
24 Lead mg/l Absorption Spectro-photometer
25 Nickel mg/l Absorption Spectro-photometer
26 Cadmium mg/l Absorption Spectro-photometer
27 Manganese mg/l Absorption Spectro-photometer
28 Zinc mg/l Absorption Spectro-photometer
Table-2.4. Tests on Soil
Sl.No. Parameters Method adopted
1 pH Digital pH meter
2 Electrical Conductivity Digital Conductivity meter
3 Bulk Density Core cutter method
4 Dry Density Core cutter method
5 Permeability Constant head method
6 Moisture Content Oven dry method
7 Specific Gravity Pycnometer method
III. RESULTS AND DISCUSSIONS
The present paper mainly focused on identification of selected pollutants in the soil and ground water
due to lechate generated from municipal solid waste landfill site.
3.1 Assessment of Ground water bodies
i. Colour : From Table.3.1. it was observed that the colour of the bore well samples are all less than 2,
which falls under the desirable limit set by IS 10500:1991.
ii. Turbidity: From Table.3.1. it was observed that the amount of turbidity in the bore well samples varied
from 0.5 NTU to 0.7 NTU, which is less than the desirable limit set by IS 10500:1991. Results depicts the
variation of turbidity in the ground water samples
iii. pH : From Table.3.1. it was observed that the pH of the bore well samples varies from 7.72 to 8.19,
which falls under the desirable limit set by IS 10500:1991. It was observed that the variation of pH in the
ground water samples.
Alliance International Conference on Artificial Intelligence and Machine Learning (AICAAM), April 2019
317
iv. Conductivity From Table.3.1. it was observed that the conductivity of the bore well samples varies
from 589 µS/cm to 1451 µS/cm. Conductivity so high implies that the water sample is in fact
contaminated.
v. Total Dissolved Solids, Suspended Solids and Total Solids From Table.3.1. it was observed that the
TDS in the bore well samples varied from 390 mg/l to 930 mg/l, which is lower than the desirable limit
set by IS 10500:1991. The amount of SS present is nil. Hence the TS also varies from 390 mg/l to 930
mg/l.
vi. Total Hardness, Calcium Hardness and Magnesium Hardness From Table.3.1. it was observed that the
Total Hardness in the bore well samples varied from 380.11 mg/l to 171.23 mg/l, which is mostly under
the desirable limit but under the permissible limit set by IS 10500:1991. BW-3 has total hardness more
than the desirable limit. The Calcium Hardness varies from 252.50 mg/l to 95 mg/l while the Magnesium
Hardness varies from 128 mg/l to 69.87 mg/l.
vii. Alkalinity and acidity From Table.3.1. it was observed that the alkalinity in the bore well samples
varies from 308.80 mg/l to 183.45 mg/l. The alkalinity is greater than the desirable limit set by IS
10500:1991; for BW2(small amount), BW3 and BW4, whereas it falls under the desirable limit for the
other samples From these results, it was observed that the acidity in the bore well samples varies from
2.36 mg/l to 1.07 mg/l..
viii. Chlorides From Table.3.1. it was observed that the amount of chlorides present in the bore well
samples varied from 292.11 mg/l to 89.23 mg/l. BW3 has chlorides content more than desirable limit set
by IS 10500:1991). The rest of the samples are found to have values within the desirable limit.
ix. Sulphates From Table.3.1. it was observed that the amount of sulphates present in the bore well
samples varied from 99.11 mg/l to 31 mg/l, which falls under the desirable limit set by IS 10500:1991.
Data depicts the variation of sulphates in the ground water samples.
x. Nitrates From Table.3.1. it was observed that the amount of nitrates present in the bore well samples
varied from 15.24 mg/l to 7.11 mg/l, which falls under the desirable limit set by IS 10500:1991.
xi. Fluorides From Table.3.1. it was observed that the amount of fluorides present in the bore well
samples varied from 0.42 mg/l to 0.24 mg/l, which falls under the desirable limit set by IS 10500:1991.
xii. Sodium From Table.3.1. it was observed that the amount of sodium present in the bore well samples
varied from 144 mg/l to 56 mg/l.
xiii. Potassium From Table.3.1. it was observed that the amount of potassium present in the bore well
samples varied from 8 mg/l to 4 mg/l.
xiv. Ammonia From Table.3.1. it was observed that the amount of ammonia present in BW 3 and BW5
samples was 0.24 mg/l and 0.12 mg/l respectively. The remaining samples had amount of ammonia below
detection level (BDL).
xv. Iron From Table.3.1. it was observed that the iron content in the bore well samples varied from 0.15
mg/l to 0.07 mg/l, which is less than the desirable limit set by IS 10500:1991.
xvi. DO, BOD and COD From Table.3.1. it was observed that the amount of DO present in the bore well
sample varied from 5.4 mg/l to 4.5 mg/l. Also, the amount of BOD present was found to be below
detection level (BDL).
From Table.3.1. it was observed that the amount of COD present in the bore well sample varied from
4.89mg/l to 2.77 mg/l. Fig.4.16. depicts the variation of COD in the ground water samples.
Alliance International Conference on Artificial Intelligence and Machine Learning (AICAAM), April 2019
318
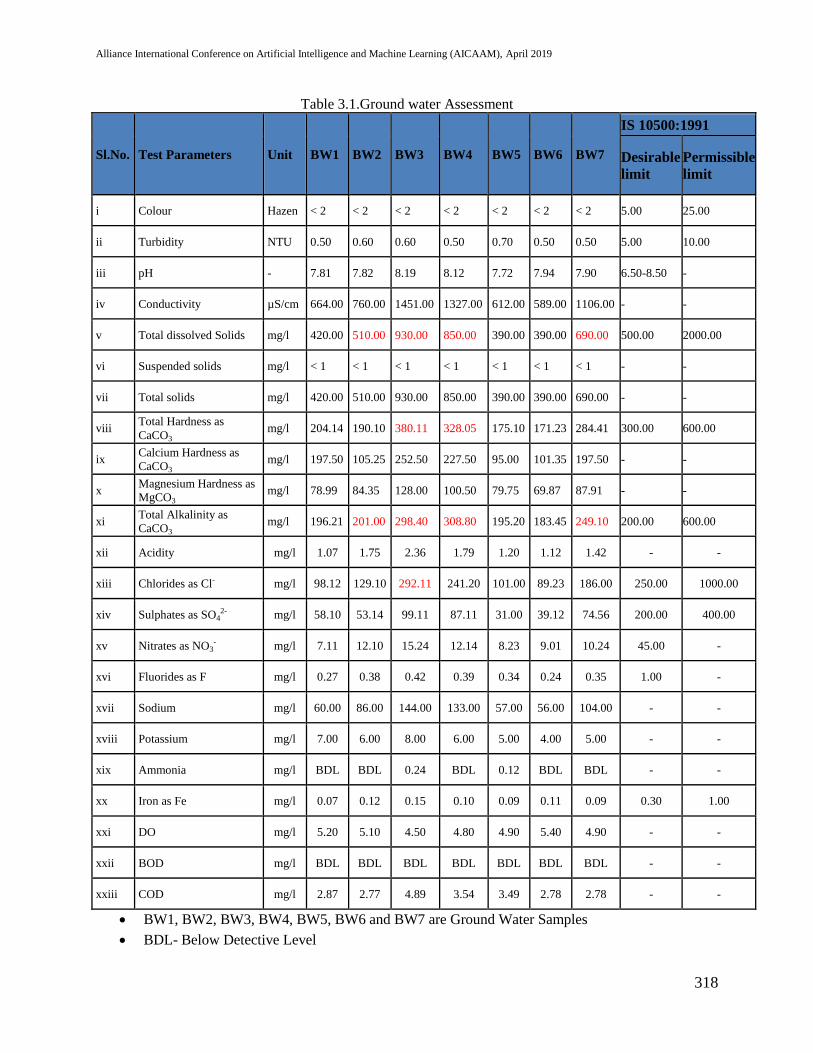
Table 3.1.Ground water Assessment
Sl.No. Test Parameters Unit BW1 BW2 BW3 BW4 BW5 BW6 BW7
IS 10500:1991
Desirable
limit
Permissible
limit
i Colour Hazen < 2 < 2 < 2 < 2 < 2 < 2 < 2 5.00 25.00
ii Turbidity NTU 0.50 0.60 0.60 0.50 0.70 0.50 0.50 5.00 10.00
iii pH - 7.81 7.82 8.19 8.12 7.72 7.94 7.90 6.50-8.50 -
iv Conductivity µS/cm 664.00 760.00 1451.00 1327.00 612.00 589.00 1106.00 - -
v Total dissolved Solids mg/l 420.00 510.00 930.00 850.00 390.00 390.00 690.00 500.00 2000.00
vi Suspended solids mg/l < 1 < 1 < 1 < 1 < 1 < 1 < 1 - -
vii Total solids mg/l 420.00 510.00 930.00 850.00 390.00 390.00 690.00 - -
viii Total Hardness as
CaCO3 mg/l 204.14 190.10 380.11 328.05 175.10 171.23 284.41 300.00 600.00
ix Calcium Hardness as
CaCO3 mg/l 197.50 105.25 252.50 227.50 95.00 101.35 197.50 - -
x Magnesium Hardness as
MgCO3 mg/l 78.99 84.35 128.00 100.50 79.75 69.87 87.91 - -
xi Total Alkalinity as
CaCO3 mg/l 196.21 201.00 298.40 308.80 195.20 183.45 249.10 200.00 600.00
xii Acidity mg/l 1.07 1.75 2.36 1.79 1.20 1.12 1.42 - -
xiii Chlorides as Cl- mg/l 98.12 129.10 292.11 241.20 101.00 89.23 186.00 250.00 1000.00
xiv Sulphates as SO42- mg/l 58.10 53.14 99.11 87.11 31.00 39.12 74.56 200.00 400.00
xv Nitrates as NO3- mg/l 7.11 12.10 15.24 12.14 8.23 9.01 10.24 45.00 -
xvi Fluorides as F mg/l 0.27 0.38 0.42 0.39 0.34 0.24 0.35 1.00 -
xvii Sodium mg/l 60.00 86.00 144.00 133.00 57.00 56.00 104.00 - -
xviii Potassium mg/l 7.00 6.00 8.00 6.00 5.00 4.00 5.00 - -
xix Ammonia mg/l BDL BDL 0.24 BDL 0.12 BDL BDL - -
xx Iron as Fe mg/l 0.07 0.12 0.15 0.10 0.09 0.11 0.09 0.30 1.00
xxi DO mg/l 5.20 5.10 4.50 4.80 4.90 5.40 4.90 - -
xxii BOD mg/l BDL BDL BDL BDL BDL BDL BDL - -
xxiii COD mg/l 2.87 2.77 4.89 3.54 3.49 2.78 2.78 - -
BW1, BW2, BW3, BW4, BW5, BW6 and BW7 are Ground Water Samples
BDL- Below Detective Level
Alliance International Conference on Artificial Intelligence and Machine Learning (AICAAM), April 2019
319
3.2. Assessment of Surface water bodies i. Colour From Table.3.2. it was observed that the colour of the lake sample was 4 Hazens, which
falls under the desirable limit set by IS 10500:1991.
ii. Turbidity From Table.3.2. it was observed that the amount of turbidity in the lake sample was
21 NTU, which is more than the desirable limit set by IS 10500:1991. This may be due to the
blown away leaves, sand, and also due to the villagers washing their clothes and cattle over the
banks of the lake. The lake is also used by the commoners for bathing.
iii. pH From Table.3.2. it was observed that the pH of the lake sample was 7.96, which falls
under the desirable limit set by IS 10500:1991.
iv. Conductivity From Table.3.2. it was observed that the conductivity of the lake sample was
3526 µS/cm. Conductivity so high only implies that the water sample is infact contaminated.
This could be due to the possibility of the leachate to infiltrate through the soil and reach the lake
and also other sources of pollution.
v. Total Dissolved Solids, Suspended Solids and Total Solids From Table.3.2. it was observed
that the TDS, SS and TS present in the lake sample was 2270 mg/l, 50 mg/l and 2320 mg/l
respectively, which is more than the desirable limit, set by IS 10500:1991.
vi. Total Hardness, Calcium Hardness and Magnesium Hardness From Table.3.2. it was
observed that the Total Hardness, Calcium Hardness and Magnesium Hardness present in the
lake sample was 320m mg/l, 190 mg/l and 130 mg/l respectively, which is greater than the
desirable limit but under the permissible limit set by IS 10500:1991.
vii. Alkalinity and acidity From Table.3.2. it was observed that the alkalinity and acidity of the
lake sample was 718.5 mg/l and zero respectively. The alkalinity is greater than both the
desirable limit and the permissible limit set by IS 10500:1991.
viii. Chlorides From Table.3.2. it was observed that the amount of chlorides present in the lake
sample was 723 mg/l, which is greater than the desirable limit but it falls under the permissible
limit set by IS 10500:1991.
ix. Sulphates From Table.3.2. it was observed that the amount of sulphates present in the lake
sample was 189 mg/l, which falls under the desirable limit set by IS 10500:1991.
x. Nitrates From Table.3.2. it was observed that the amount of nitrates present in the lake sample
was 29 mg/l, which falls under the desirable limit set by IS 10500:1991.
xi. Fluorides From Table.3.2. it was observed that the amount of fluorides present in the lake
sample was 0.78 mg/l, which falls under the desirable limit set by IS 10500:1991.
xii. Sodium From Table.3.2. it was observed that the amount of sodium present in the lake
sample was 600 mg/l.
xiii. Potassium From Table.3.2. it was observed that the amount of potassium present in the lake
sample was 41 mg/l.
xiv. Ammonia From Table.3.2. it was observed that the amount of ammonia present in the lake
sample was 21.9 mg/l.
xv. Iron From Table.3.2. it was observed that the iron content in the lake sample was 0.46 mg/l,
which is above the desirable limit but falls under the permissible limit set by IS 10500:1991.
xvi. DO, BOD and COD From Table.3.2. it was observed that the DO, BOD and COD of the
lake sample was 0.8 mg/l, 34 mg/l and 187.14mg/l respectively, which is below the desirable
limit set by IS 10500:1991.
Alliance International Conference on Artificial Intelligence and Machine Learning (AICAAM), April 2019
320
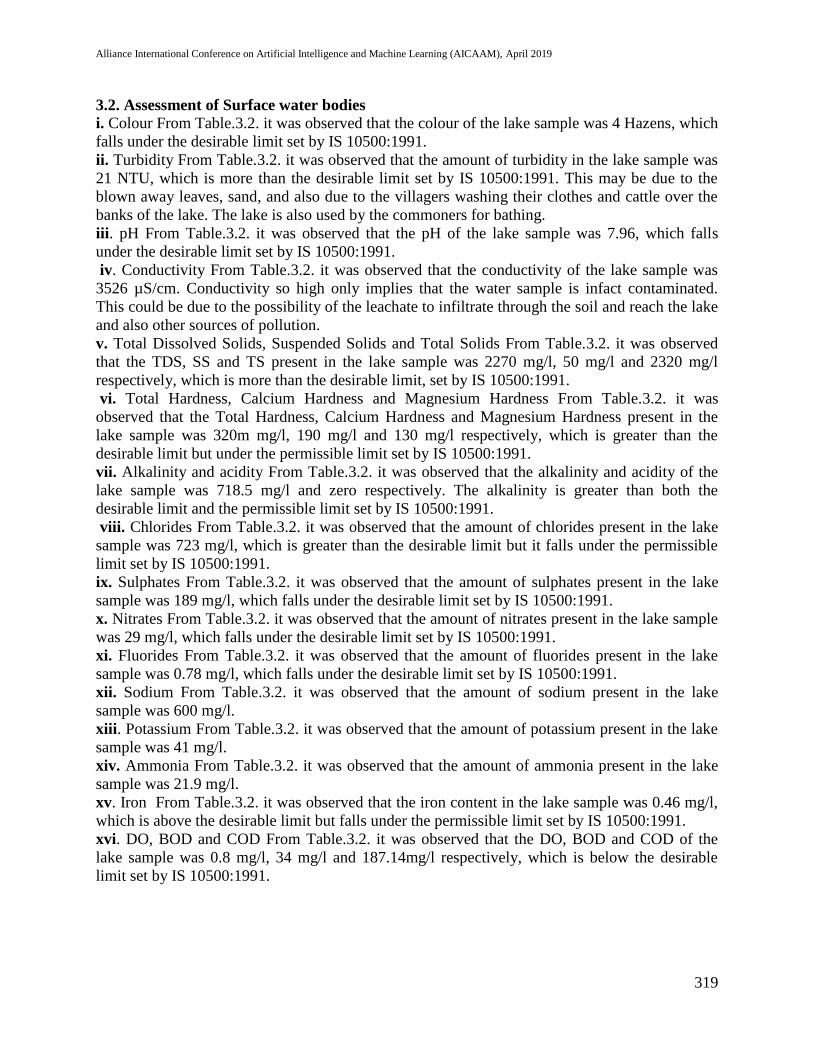
Table.3.2. Bingipura Lake Assessment
Sl.No. Test Parameters Unit L1
IS 10500:1991
Desirable
limit
Permissible
limit
i Colour Hazen 4.00 5.00 25.00
ii Turbidity NTU 21.00 5.00 10.00
iii pH - 7.96 6.50-8.50 -
iv Conductivity µS/cm 3526.00 - -
v Total dissolved Solids mg/l 2270.00 500.00 2000.00
vi Suspended solids mg/l 50.00 - -
vii Total solids mg/l 2320.00 - -
viii Total Hardness as CaCO3 mg/l 320.00 300.00 600.00
ix Calcium Hardness as CaCO3 mg/l 190.00 - -
x Magnesium Hardness as MgCO3 mg/l 130.00 - -
xi Total Alkalinity as CaCO3 mg/l 718.50 200.00 600.00
xii Acidity mg/l BDL - -
xiii Chlorides as Cl
- mg/l 723.00 250.00 1000.00
xiv Sulphates as SO4
2- mg/l 189.00 200.00 400.00
xv Nitrates as NO3
- mg/l 29.00 45.00 -
xvi Fluorides as F mg/l 0.78 1.00 -
xvii Sodium mg/l 600.00 - -
xviii Potassium mg/l 41.00 - -
xix Ammonia mg/l 2.19 - -
xx Iron as Fe mg/l 0.46 0.30 1.00
xxi DO mg/l 0.8 - -
xxii BOD mg/l 34.00 - -
xxiii COD mg/l 187.14 - -
Alliance International Conference on Artificial Intelligence and Machine Learning (AICAAM), April 2019
321
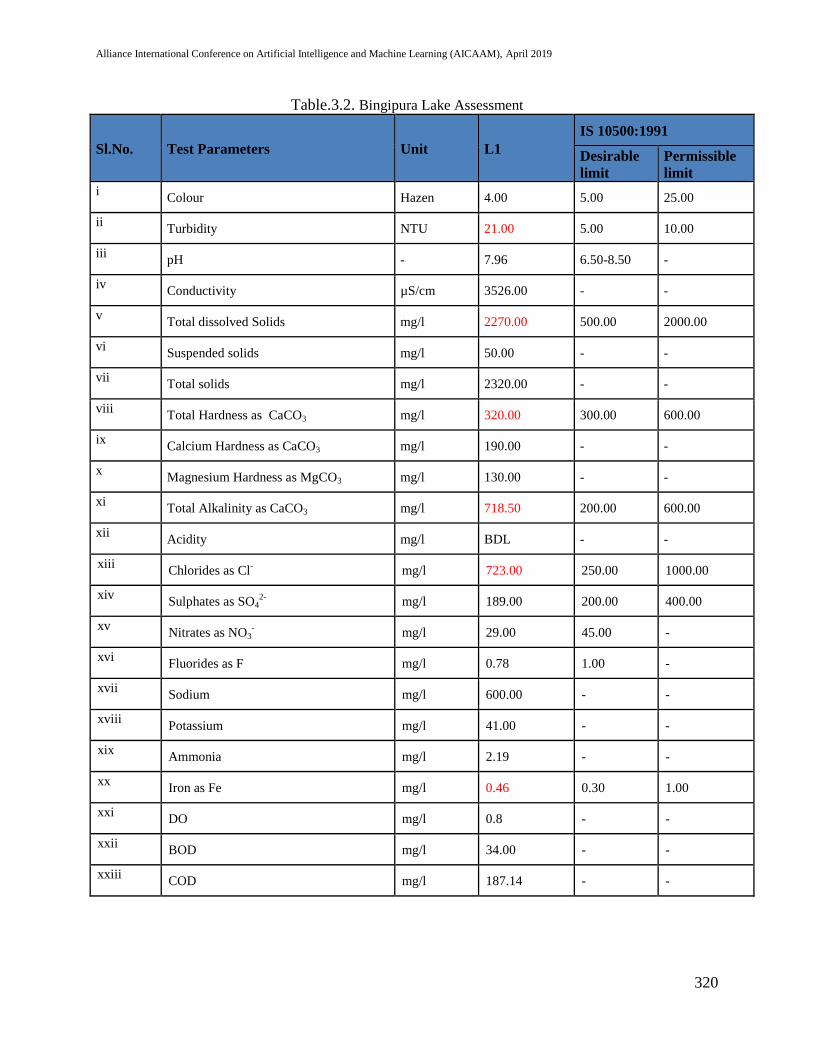
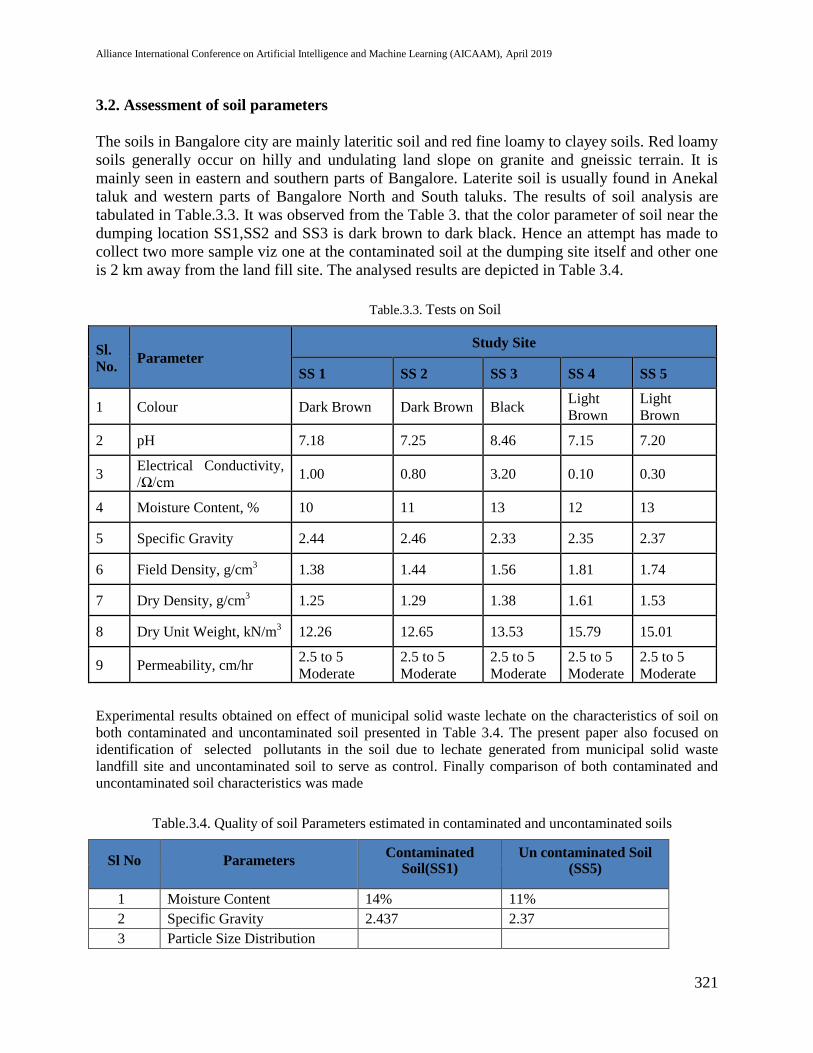
3.2. Assessment of soil parameters
The soils in Bangalore city are mainly lateritic soil and red fine loamy to clayey soils. Red loamy
soils generally occur on hilly and undulating land slope on granite and gneissic terrain. It is
mainly seen in eastern and southern parts of Bangalore. Laterite soil is usually found in Anekal
taluk and western parts of Bangalore North and South taluks. The results of soil analysis are
tabulated in Table.3.3. It was observed from the Table 3. that the color parameter of soil near the
dumping location SS1,SS2 and SS3 is dark brown to dark black. Hence an attempt has made to
collect two more sample viz one at the contaminated soil at the dumping site itself and other one
is 2 km away from the land fill site. The analysed results are depicted in Table 3.4.
Table.3.3. Tests on Soil
Sl.
No. Parameter
Study Site
SS 1 SS 2 SS 3 SS 4 SS 5
1 Colour Dark Brown Dark Brown Black Light
Brown
Light
Brown
2 pH 7.18 7.25 8.46 7.15 7.20
3 Electrical Conductivity,
/Ω/cm 1.00 0.80 3.20 0.10 0.30
4 Moisture Content, % 10 11 13 12 13
5 Specific Gravity 2.44 2.46 2.33 2.35 2.37
6 Field Density, g/cm3 1.38 1.44 1.56 1.81 1.74
7 Dry Density, g/cm3 1.25 1.29 1.38 1.61 1.53
8 Dry Unit Weight, kN/m3 12.26 12.65 13.53 15.79 15.01
9 Permeability, cm/hr 2.5 to 5
Moderate
2.5 to 5
Moderate
2.5 to 5
Moderate
2.5 to 5
Moderate
2.5 to 5
Moderate
Experimental results obtained on effect of municipal solid waste lechate on the characteristics of soil on
both contaminated and uncontaminated soil presented in Table 3.4. The present paper also focused on
identification of selected pollutants in the soil due to lechate generated from municipal solid waste
landfill site and uncontaminated soil to serve as control. Finally comparison of both contaminated and
uncontaminated soil characteristics was made
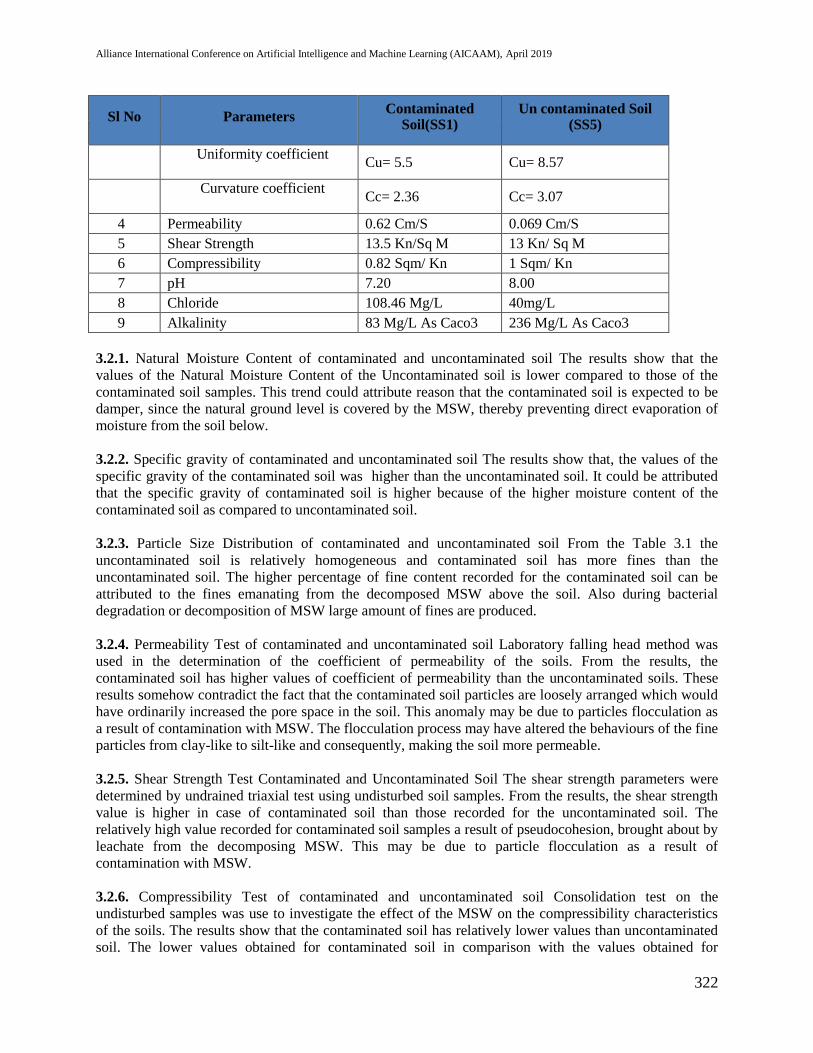
Table.3.4. Quality of soil Parameters estimated in contaminated and uncontaminated soils
Sl No Parameters Contaminated
Soil(SS1) Un contaminated Soil
(SS5)
1 Moisture Content 14% 11%
2 Specific Gravity 2.437 2.37
3 Particle Size Distribution
Alliance International Conference on Artificial Intelligence and Machine Learning (AICAAM), April 2019
322
Sl No Parameters Contaminated
Soil(SS1) Un contaminated Soil
(SS5)
Uniformity coefficient
Cu= 5.5 Cu= 8.57
Curvature coefficient
Cc= 2.36 Cc= 3.07
4 Permeability 0.62 Cm/S 0.069 Cm/S
5 Shear Strength 13.5 Kn/Sq M 13 Kn/ Sq M
6 Compressibility 0.82 Sqm/ Kn 1 Sqm/ Kn
7 pH 7.20 8.00
8 Chloride 108.46 Mg/L 40mg/L
9 Alkalinity 83 Mg/L As Caco3 236 Mg/L As Caco3
3.2.1. Natural Moisture Content of contaminated and uncontaminated soil The results show that the
values of the Natural Moisture Content of the Uncontaminated soil is lower compared to those of the
contaminated soil samples. This trend could attribute reason that the contaminated soil is expected to be
damper, since the natural ground level is covered by the MSW, thereby preventing direct evaporation of
moisture from the soil below.
3.2.2. Specific gravity of contaminated and uncontaminated soil The results show that, the values of the
specific gravity of the contaminated soil was higher than the uncontaminated soil. It could be attributed
that the specific gravity of contaminated soil is higher because of the higher moisture content of the
contaminated soil as compared to uncontaminated soil.
3.2.3. Particle Size Distribution of contaminated and uncontaminated soil From the Table 3.1 the
uncontaminated soil is relatively homogeneous and contaminated soil has more fines than the
uncontaminated soil. The higher percentage of fine content recorded for the contaminated soil can be
attributed to the fines emanating from the decomposed MSW above the soil. Also during bacterial
degradation or decomposition of MSW large amount of fines are produced.
3.2.4. Permeability Test of contaminated and uncontaminated soil Laboratory falling head method was
used in the determination of the coefficient of permeability of the soils. From the results, the
contaminated soil has higher values of coefficient of permeability than the uncontaminated soils. These
results somehow contradict the fact that the contaminated soil particles are loosely arranged which would
have ordinarily increased the pore space in the soil. This anomaly may be due to particles flocculation as
a result of contamination with MSW. The flocculation process may have altered the behaviours of the fine
particles from clay-like to silt-like and consequently, making the soil more permeable.
3.2.5. Shear Strength Test Contaminated and Uncontaminated Soil The shear strength parameters were
determined by undrained triaxial test using undisturbed soil samples. From the results, the shear strength
value is higher in case of contaminated soil than those recorded for the uncontaminated soil. The
relatively high value recorded for contaminated soil samples a result of pseudocohesion, brought about by
leachate from the decomposing MSW. This may be due to particle flocculation as a result of
contamination with MSW.
3.2.6. Compressibility Test of contaminated and uncontaminated soil Consolidation test on the
undisturbed samples was use to investigate the effect of the MSW on the compressibility characteristics
of the soils. The results show that the contaminated soil has relatively lower values than uncontaminated
soil. The lower values obtained for contaminated soil in comparison with the values obtained for
Alliance International Conference on Artificial Intelligence and Machine Learning (AICAAM), April 2019
323
uncontaminated soil, can be attributed to the soil immediately beneath the MSW don't undergoing any
compression as a result of the weight of the MSW above.
3.2.7. pH of contaminated and uncontaminated soil We can conclude that, pH value of uncontaminated
soils is higher than the contaminated soils. The pH of the contaminated soils is 7.20, it signifies that it is
slightly acidic in nature compared to uncontaminated soil could be reason behind that the nature of the
solid waste contribute acidity of the soil. Due to this reason the pH of contaminated soil is slightly acidic
than uncontaminated soils. Alkalinity value of uncontaminated soils is higher than the contaminated soils.
This could be the reason that the pH of the contaminated soil is slightly acidic than uncontaminated soil.
3.2.8. Chloride of contaminated and uncontaminated soil The chloride concentration in contaminated soil
is 108.46 mg/l where as uncontaminated is 40 mg/l, it indicates that it is higher than uncontaminated soil.
This contribute due to disposal of solid waste, the quality of the soil is reduced and it clearly indicated by
the chloride values of contaminated soils.
3.2.9. Alkalinity of contaminated and uncontaminated soil The alkalinity concentration in contaminated
soil is 83 mg/l as caco3 where as uncontaminated is 236 Mg/L As Caco3, it indicates that it is lower than
uncontaminated soil. This clearly indicated by the lesser alkalinity values of contaminated soils due to
acidic properities due to the concentration of leachate.
The results of contaminated and uncontaminated soils are represented in Table 3.4. The result in the table
indicates that except for pH and alkalinity, all other parameters are higher in contaminated soil compared
to uncontaminated soils. The study concludes based on the results obtained, the disposal site soil quality
is reduced compared to uncontaminated soil. In other words, due to the disposal of solid waste on land the
soil quality gets reduced.
IV. CONCLUSION
The following conclusions has been drawn based on the results obtained in the present study.
The surface water sample is found to have significantly high salinity and alkalinity as reflected in
their values for conductivity, TDS, alkalinity and pH. Hence it indicating that the surface water
body is polluted.
Test result on ground water concluded that certain bore well on the down stream side were
polluted.
The Analysis of the soil samples around the site shows that the soil has moderate permeability.
Also Based on the experiment results obtained from the soil sample analysed in both
contaminated and uncontaminated soils following major conclusions have been drawn.
o The coefficient of permeability of the contaminated soil has higher than the
uncontaminated soils. This indicates that due to disposal of solid waste the quality of the
soil is reduced and it clearly indicated by the chloride values of contaminated soils.
o Study conclude based on the results obtained, the disposal site soil quality is reduced
compared to uncontaminated soil. In other words, due to the disposal of solid waste on
land the soil quality gets reduced.
ACKNOWLEDGMENT
The authors are great full to the authority of Bruhat Bangalore Mahanagar Palike (BBMP) for their kind
co-operation and giving permission to carry out this study at landfill site.
Alliance International Conference on Artificial Intelligence and Machine Learning (AICAAM), April 2019
324
REFERENCES
[1] A Asadi Huat BBK, H Moayedi, Shariatmadari N, Parsaie A (2011). Changes of hydraulic
conductivity of silty clayey sand soil under the effects of municipal solid waste leachate. International
Journal of the Physical Sciences, 6(12): 2869-2874.
[2] APHA, Standard Methods for the Examination of Water and Wastewater , 21 ed. Washington D.C:
American Public Health Association, 2005.
[3] Barjinder Bhalla, M.S. Saini, M.K. Jha (2012) “Characterization of Leachate from Municipal Solid
Waste (MSW) Landfilling Sites of Ludhiana”, India: A Comparative Study. International Journal of
Engineering Research and Applications (IJERA) ISSN: 2248-9622 Vol. 2, Issue 6, November-
December 2012, pp.732-745.
[4] Basavaraj Paruti, and Santhaveeranagoud B, (2019).“ CHARACTERISATION OF LEACHATE IN
SOLID WASTE LANDFILL SITE- A Case Study of S Bingipur in Bangalore”, Journal of
Engineering Annals, of the Faculty of Engineering Hunedoara. Tome XVII [2019] | Fascicule 1
[February] pp. 205-208
[5] Bharat Jhamnani and SK Singh (2009) “Groundwater Contamination due to Bhalaswa Landfill Site in
New Delhi”, International Journal of Civil and Environmental Engineering, vol 1(3), pp. 121-125 .
[6] E.Panahpour ,A. Gholami, A.H Davami (2011). Influence of Garbage Leachate on Soil Reaction,
Salinity and Soil Organic Matter in East of Isfahan. World Academy of Science, Engineering and
Technology, 171-176
[7] Evaluation of Technology for processing existing waste at Seven Landfill sites of BBMP, Bangalore
Technical committee Recommendations on EOI application REPORT; Date: 03-01-2013.
[8] Iwekumo Ebibofe, Michael (2015) “Leachate characterization of active and closed dump sites in Port
Harcourt metropolis”, Nigeria. Int. J. Biol. Chem. Sci. 9(2): 1107-1119.
[9] Lovleen Gupta, Swati Rani (2014) “Leachate characterization and evaluating its impact on
groundwater quality in vicinity of landfill site area”.
[10] O.Schwarz-Herion, A. Omran, and H.PRapp, (2008).“A Case Study on Successful Municipal Solid
Waste Management in Industrialized Countries by the Example of Karlsruhe City, Germany”, Journal
of Engineering Annals, of the Faculty of Engineering Hunedoara. 6 (3) pp. 266-273
[11] Ohwoghere–Asuma, Aweto (2013) “Leachate Characterization and Assessment of Groundwater and
Surface Water Qualities near Municipal Solid Waste Dump Site”, Effurun, Delta State, Nigeria.
[12] The Municipal Solid Wastes (management and handling) rules, 2000 (Ministry of Environment &
Forests) notification New Delhi, the 25th september, 2000
[13] Naveen.B.P, Sivapullaiah.P.V, Sitharam.T.G, Ramachandra.T.V (2014) “Characterization of leachate
from municipal landfill and its effect on surrounding water bodies”, Mavallipura.