all voor cep discussion paper
TRANSCRIPT
CEP Discussion Paper No 926
April 2009
Long-Term Health Effects on the Next Generation of Ramadan Fasting During Pregnancy
Reyn van Ewijk
Abstract Each year, many pregnant women fast from dawn to sunset during the Islamic holy month of Ramadan. Medical theory suggests that this may have negative long-term health effects on their offspring. Building upon the work of Almond and Mazumder (2008), and using Indonesian cross-sectional data, I show that people who were exposed to Ramadan fasting during their mother’s pregnancy have a poorer general health and are sick more often than people who were not exposed. This effect is especially pronounced among older people, who, when exposed, also report health problems more often that are indicative of coronary heart problems and type 2 diabetes. The exposed are a bit smaller in body size and weigh less. Among Muslims born during, and in the months after, Ramadan, the share of males is lower, which is most likely to be caused by death before birth. I show that these effects are unlikely to be an artifact of common health shocks, correlated to the occurrence of Ramadan, or o f fasting mainly occurring among women who, irrespective of fasting or not, would have had unhealthier children anyway. Keywords: health, Ramadan, pregnancy, nutrition, Indonesia JEL Classifications: I2, I12, J1, J14 Data: The Indonesia Family Life Survey (IFLS), available at: http://www.rand.org/labor/FLS/IFLS/ This paper was produced as part of the Centre’s Labour Markets Programme. The Centre for Economic Performance is financed by the Economic and Social Research Council. Acknowledgements I would like to thank Douglas Almond, David Barker, Monique de Haan, Bhashkar Mazumder, Sandra McNally, Hessel Oosterbeek and Erik Plug for their helpful comments and suggestions. I gratefully acknowledge comments from seminar participants at the National Islamic University (UIN) in Jakarta, Indonesia, the London School of Economics, the Chicago Fereral Reserve Bank and the University of Amsterdam Medical Center (AMC). I thank my Indonesian hosts, particularly the people from UIN and Dwi Tyastuti for their great help in organizing the interviews and visits I made during Ramadan 2008. Tessa Roseboom, who leads the “Fetal origins of adult disease” research programme at the University of Amsterdam Medical Center (AMC), I thank for her expert advice on the medical theory described in this paper. Reyn van Ewijk was a Visiting Researcher at the London School of Economics. He is presently at Amsterdam School of Economics, University of Amsterdam, The Netherlands. Published by Centre for Economic Performance London School of Economics and Political Science Houghton Street London WC2A 2AE All rights reserved. No part of this publication may be reproduced, stored in a retrieval system or transmitted in any form or by any means without the prior permission in writing of the publisher nor be issued to the public or circulated in any form other than that in which it is published. Requests for permission to reproduce any article or part of the Working Paper should be sent to the editor at the above address. © R. van Ewijk, submitted 2009 ISBN 978-0-85328-379-9
3
1. Introduction
Mothers’ behavior and consumption during pregnancy are known to have long-term effects
on their children’s health, as is evidenced by research on the effects of smoking and of the
consumption of e.g. alcohol and coffee during pregnancy. Medical studies show that fasting
during pregnancy in the form of skipping breakfast and other meals may be another aspect of
mother’s consumption and behavior that may have a negative effect on the health of their
children, which may last into adulthood. Each year, many pregnant women fast during
daylight hours during the Islamic holy month of Ramadan. They do this, even though they are
exempted from the religious obligation to fast if they are worrying about their own health, or
the health of their fetus. This paper shows that the health of people is negatively affected if
their mother fasted during a Ramadan while they themselves were still in utero. Although
effects on pregnant women and newborn babies with respect to Ramadan fasting have been
measured in previous studies, very little research exists on the long-term effects of having a
mother who observed Ramadan during pregnancy. Almond & Mazumder (2008) are the first
to systematically examine such long-term effects.
This research builds further upon their work. Almond & Mazumder, using data from
Michigan, first show that the health of newborns is negatively affected by exposure to
Ramadan in utero. Using Ugandan data, they next look at long-term effects of exposure on
the probabilities of having disabilities as an adult. They find that Muslims who were
conceived or in utero during Ramadan had higher probabilities of having vision, hearing and
mental or learning disabilities as adults. They also find an effect on the male/female ratio (a
lower share of males) that can be related to adverse pre-birth conditions.
In this paper, I use a rich dataset containing information on the health of a cross-
section of the Indonesian population, to further explore how exposure to Ramadan fasting
before birth affects people’s health. Indonesia is very well suited to study this topic, not only
because there is no country in the world that has a larger Muslim population, but also because
it has the advantage that Ramadan fasting hours, which in many countries depend on seasonal
variations in daylight hours, are virtually the same each year, because of its location on the
equator. I start from people’s general health condition. After showing that general health,
especially that of older people, is negatively affected by exposure, I take a deeper look at
which aspects of health are affected. Medical theory makes some explicit predictions about
aspects of adults’ health that may be affected. I find evidence for some important ones of
4
those: the theory predicts that exposure can lead people to be more likely to develop coronary
heart disease, type 2 diabetes and kidney problems when they are older. A point of overlap
with Almond & Mazumder is that I also look for, and find, effects on the share of males,
which is lower among those who had been exposed. This fits with medical theory, because in
utero, males are more vulnerable to adverse conditions. I also find effects on people’s weight
and body size that may be explained by medical theory. To get a more complete picture about
how general health is affected, I further look at effects on subjective health feelings and
occurrence of sickness. Although people who had been exposed, especially older people,
report being sick more often and feeling less healthy, they do not report higher incidences of
a small set of non-severe illnesses and health problems. This suggests that the effects on
people’s general health that I find are not caused by relatively low-impact symptoms, but are
more likely a result of more serious health problems.
Importantly, in this paper I will investigate whether there are alternative explanations
for the effects that I find. I will show that the effects are most probably not artifacts of
selective timing of pregnancies: perhaps the relatively small group of Muslims who had not
been in utero during a Ramadan are healthier only because they had mothers who were very
concerned about health, would hence have had healthier offspring anyway, and, for health
concerns, timed their pregnancy in such a way that they avoided Ramadan, thus creating a
spurious correlation between exposure to Ramadan before birth and health. Using family
fixed effects and by comparing the characteristics of mothers who where pregnant during
Ramadan with those of mothers whose pregnancy did not include a Ramadan, I refute this
alternative explanation. Also, throughout this paper, to rule out that effects of Ramadan
during pregnancy are caused by correlated common shocks to birth cohorts, I show that no
effects of timing of Ramadan are found on non-Muslims.
This paper will start with background information on Ramadan and Indonesia, in
which I will also explore Muslims’ beliefs on observing the Ramadan fast during pregnancy
and the rate of fasting among pregnant women. After this, I will discuss medical theory on
how maternal fasting during pregnancy may exert a long-term effect on the health of her
offspring and I describe the data used. The next section will deal with effects on general
health and some checks on the robustness of the results found. The following sections will
deal with effects on the sex ratio, the occurrence of some generally non-severe health
problems, reports by elderly people of symptoms that may indicate coronary heart disease
and diabetes, measures on hypertension and anemia, the health of children and finally
people’s weight and body size. The last section discusses the implications of this research.
5
Throughout this paper, I will sometimes complement the texts with information
obtained from interviews I held in Indonesia during Ramadan 2008 with doctors, midwifes,
health workers and others. These interviews and the observations made in hospitals and
health clinics during my visits are not representative for a complete Indonesian population,
nor do they serve to replace any quantitative analyses, but they do often shed more light on
the local situation and the believes and experiences of Indonesians.
2. Background
2.1. Ramadan
Ramadan is the holiest month of Islam. It is one of the five “pillars” of Islam that Muslims
have to fast during this month. No food and drinks are to be taken from dawn to sunset.
Smoking, sexual intercourse and, according to some interpretations, the taking of oral
medicine are also forbidden during these hours. In the evening, the fast is broken with sweet
drinks and sweet snacks. This is a very social happening, in which family and friends come
together. If a Muslim misses a day of fasting, (s)he has to make up for it on a later day and in
many cases pay a penalty that is used to feed the poor. The timing of the Ramadan follows
the Islamic calendar. This is a lunar calendar and since, depending on the exact moon cycle,
the year is about 11 days shorter than the commonly used Gregorian calendar, each year
Ramadan starts about 11 days earlier. After a bit more than 33 years, Ramadan will start
around the same Gregorian date again. This “shifting over the years” makes it possible to
separate effects of Ramadan from seasonal effects, a strategy similar to the one applied in
Almond & Mazumder (2008), which I exploit in this paper.
Ramadan lasts about 30 days, but both the exact start and end date depend on moon
sightings and cannot be predicted exactly in advance. Sometimes Ramadan lasts only 29
days, and often different countries use different start and end dates. Because Indonesia lies on
the equator, daylight times and thus length of fasting, are about the same each year (about 13
½ hours), irrespective of the Gregorian month in which Ramadan falls. This makes Indonesia
very well suited for the study of these effects, because the effect of fasting (which can be
assumed to depend on the length of fasting) will be the same for each cohort. Hence, my
results are not biased by correlation between length of Ramadan in utero and age.

6
Certain people are excluded from the religious obligation to fast. This includes
children under 12, the sick, the traveling, women who are breastfeeding young babies and
women in their period. Pregnant women are allowed to skip fasting if they are afraid that
fasting may harm their own health or the health of their fetus. According to most people, they
then have to do the fasting later and often pay a compensation in food or money that will go
to the poor. Some Muslims explain this regulation as an obligation for all pregnant women to
fast, unless there are specific reasons for abandoning fasting. These reasons, according to
Indonesian doctors I interviewed who adhered to this interpretation, include pregnancy
complications and maternal health problems that existed already before pregnancy. Exact
criteria, however, differed considerably. Other Muslims have the interpretation that pregnant
women in any case have a dispensation from fasting. Even women who adhere to the
interpretation that they are given a dispensation, often do choose to fast. Reasons include
having to make up for the fast later on their own, instead of fasting together with the whole
community and family, a loss of the feeling of Ramadan and not actively deciding to fast: it is
just the normal thing to do (Robinson & Raisler, 2005; Mirghani, Weerasinghe, Ezimokhai &
Smith, 2003). Also, many women think that fasting during pregnancy is not harmful
(Joosoph, Abu & Yu, 2004) and some believe it even to be beneficial. This follows the
general conviction among Muslims that Ramadan fasting is good for health and beneficial in
general, as it is the wish of God that they fast. That women think fasting during pregnancy is
not harmful, plays an important role in their decision to fast, since many Muslims believe that
it is a sin to fast if this is harmful (Robinson & Raisler, 2005). Beside this, among poor
Indonesian families, the obligation to pay a compensation for not fasting may play a role in
the decision to continue fasting, while in the most orthodox areas, negative reactions from
other people may do the same. On the other hand, some women I talked to who believed
fasting to be obligatory during pregnancy, gave up fasting because they found it too hard to
continue. A great majority of 70 to 90% of pregnant Muslim women do fast, as is evidenced
by research from around the world, from Iran (Arab & Nasrollahi, 2001), to Singapore
(Joosoph, Abu & Yu, 2004), rural West Africa (Prentice et al., 1983) and the UK (Malhotra
et al., 1989). For Indonesia, no survey data on this are available, but there is no reason to
assume that the picture will be different.
2.2. Indonesia
Indonesia is the country with the largest Muslim population in the world: 86,1% of its 238
million citizens are Muslim (CIA World Factbook, 2008). Indonesia is a non-Arab country
7
and, save a few exceptions, Indonesians are not known to be among the more orthodox
Muslims, and in some cases, they are mingling Islamic with traditional, pre-Islamic customs.
Religion, however, does play an important role for most citizens, and Ramadan is widely and
enthusiastically observed by Muslims, for whom this is often a period of increased piety.
The country is roughly spread around the equator in an archipelago of over 17,000
islands, many of which are very small. The largest, Java, houses approximately 60% of all
inhabitants. Indonesia is a developing country with relatively low health care standards. E.g.
maternal death rate is 420 per 100,000 live births, compared to 11 for the USA and under five
mortality is 34 per 1,000 births, compared to 8 in the USA (Unicef, 2008), although the latter
number for Indonesia is down from a staggering 118 per 1,000 in 1970 (Strauss et al., 2004),
indicating a steady improvement which now takes it into the middle of the world-wide
country ranking (Unicef, 2008).
3. Medical theory and evidence of the effects of Ramadan fasting during
pregnancy on offspring’s health
Medical theory on how Ramadan fasting during pregnancy affects the offspring, is highly
related to medical theory on fasting, skipping meals, and hunger during pregnancy in general.
Long-term effects are mainly expected to arise because a shortage in nutrition hampers fetal
growth and causes damage to the fetal body, while at the same time such a nutritional
shortage arises relatively quickly in a pregnant woman, because the fetus growing inside of
her increases her energy demands. I will first discuss what fasting in general does to the body
and why effects of fasting in the body are stronger in pregnant women. Next, I cite medical
research that shows that such strong effects are specifically present in Ramadan fasting
pregnant women. I then review how, according to medical theory, the fetus is affected by
prenatal exposure to fasting and how this may lead to a deteriorated health much later in life.
Last, I discuss effects on the fetus that have been measured during pregnancy in previous
research on Ramadan, or that have been noticed by Indonesian doctors I interviewed.
The fasting person’s body experiences a reduced supply of metabolic fuel. Under
normal circumstances, glucose is one of the body’s main sources of energy. When fasting, a
lack of glucose arises (hypoglycemia or “low blood sugar”). The body may be able to at least
partially compensate for this lack of fuel by stepping up the, otherwise sparsely used, process
8
of fat metabolism. Herein, fat is broken up into fatty acids and ketone bodies. Both these
serve as sources of energy for the body. Although, as will be discussed, a shortage in
nutrition probably causes the greatest problems to the fetus, an increased fat metabolism is
also potentially dangerous. If the number of ketones rises too much, this will lead to a drop in
blood pH. This destroys proteins in the body, leading to tissue damage, organ failure, and
eventually death. This is what happens during starvation and what caused death to many type
1 diabetics before insulin injections became available. Pregnant women, who are at an
increased risk of reaching a state of ketoacidosis, in many countries are regularly tested for
elevated ketone levels, since ketoacidosis is a major cause of intrauterine death.
Pregnant women are at an increased risk of reaching states of hypoglycemia and
ketoacidosis, because their own body’s demand for energy is augmented by that of both
placenta and fetus. This increased energy demand means that glucose-levels for pregnant
women are lower in general already, so that there is much less leeway for any restriction in
food intake before the body gets into problems (Hobel & Culhane, 2003). Metzger, Ravnikas,
Vileisis, & Norbert (1982) coined the term “accelerated starvation” for the increased speed
with which the pregnant body reaches states, otherwise only seen in starvation. When
comparing pregnant and non-pregnant women after skipping breakfast, they found that
pregnant women exhibited considerably stronger effects of the fast, as measured by blood
levels of metabolic fuels and hormones. Particularly, they had strongly elevated levels of
ketones and low blood sugar. In the case of Metzger et al., these patterns only became very
pronounced after about 16 hours without food. This exceeds the fasting time during Ramadan
in Indonesia. However, when fasting takes place during daytime, as during Ramadan, and not
mostly during the night, as in Metzger and colleagues’ study, accelerated starvation starts
taking place much more swiftly. This is because daytime activities increase the already high
demand for glucose experienced by pregnant women, so that they reach hypoglycemia even
earlier. Meis, Rose & Swain (1984) showed that daytime fasting for 8 hours leads to
symptoms that are as severe as in Metzger et al. (1982) after nighttime plus morning fasting
for 18 hours. Therefore, according to Meis, Rose & Swain, it is especially important for
pregnant women to eat during daytime hours to avoid hypoglycemia.
Several studies give evidence that pregnant women in Ramadan do indeed reach low
levels of blood glucose and high levels of ketones. Arab (2004) found that 61% of the Iranian
pregnant women in their sample had hypoglycemia and 31% had ketonuria before breaking
their fast. Prentice et al. (1983) and Malhotra et al. (1989) measured clear signs of accelerated
starvation in Ramadan fasting women in respectively West Africa and the UK. It is thinkable
9
that Ramadan fasting does not lead to a decreased total energy consumption as women do eat
during the evening and in the early morning, and hence only causes a series of temporary
shortages of nutrition, each day during daylight hours. But Arab (2004) found that also the
total amount of energy consumed over a 24-hour time span is often too low: in his sample,
92% of Ramadan fasting pregnant women had a calorie deficit of at least 500 Kcal.
In the medical sciences, there is now a wide consensus that many chronic diseases,
typical for adults, find their origins in pre-birth conditions such as pre-natal exposure to
malnutrition (Harding, 2001). When there is a shortage of nutrition, the fetus will adapt itself
to this adverse condition. According to fetal programming theory, fetal adaptations to a
hostile environment may be beneficial in the short run because they help the fetus to survive,
but the downside is that they may lead to serious problems in the long run (Godfrey &
Barker, 2000). These potential consequences include an increased risk later in life of
coronary heart disease and its biological risk factors, including hypertension and type 2
diabetes.
One important adaptation by the fetus to nutritional shortage is that it will use most of
the scarce energy for the most vital organs and their metabolism, so that they will be
protected against the lack of fuel. Because particularly the brain will be protected in this way,
this process is known as “brain-sparing” (Godfrey & Barker, 2001). This goes at the expense
of energy devoted to other organs, muscles and limbs. As a result, cell division in these body
parts may be slowed. Also, resources may be increasingly diverted to placenta growth in
order to extract more nutrients, which comes at the expense of resources devoted to the fetal
body itself (Barker, 1997). Apart from effects on the general growth of the fetus, this
especially affects organs which are undergoing their critical growth period: the period in
which they are formed or go through a phase of important growth. Even short periods of
undernutrition can cause damage to these organs (Barker, 1997). Often, such damage does
not create problems immediately, but only much later in life, as degeneration sustained
during the lifetime has taken its own toll. A good example for this are the kidneys:
undernutrition leads to a reduced number of nephrons (the functional units of the kidney).
Initially, this does not cause great problems, but when ageing further decreases the number of
nephrons, it may result in hypertension and consequent further damage to the kidney (Barker,
2002). Type 2 diabetes may also often appear only much later in life as a consequence of
brain sparing: the fetal body reacts to a shortage of glucose by increasing insulin resistance.
This causes a decrease in glucose uptake in the body and hence reduced body growth. The
immediate positive effect of this is that glucose concentrations are maintained for the brain.

10
But if this insulin resistance persists until adulthood, this may lead to type 2 (“adult-onset”)
diabetes, which is also characterized by insulin resistance (Phillips, 1996). Both hypertension
and type 2 diabetes are major risk factors for developing coronary heart disease. Coronary
heart disease itself has often been linked to low birth weight. Birth weight is often used in
epidemiological research as a rough measure for fetal development. Birth weight is on
average lower if the mother experienced malnutrition during pregnancy (Barker, 1997), but it
captures only part of the changes of the fetal body to maternal nutrition. More refined
measures, such as changes to organs, however, are hard to obtain for newborns (Harding,
2001). The link between lower birth weight and an increased risk of developing coronary
heart disease has, nevertheless, consistently been shown to exist, is linear, i.e. not only
referring to the extreme of low birth weight and is present in both developed and developing
countries. A lower birth weight has also been linked to an increased risk for several
cardiovascular risk factors (Godfrey & Barker, 2001; Rich-Edwards et al., 1997). Evidence
that the low birth weight channel may also be relevant to Ramadan fasting during pregnancy
is found by Almond & Mazumder (2008), who show that children who experienced Ramadan
in utero on average have a lower birth weight.
Beside brain sparing, there are other ways in which the fetal body can adapt and react
to nutritional shortage. A potentially important role is played by maternal undernutrition
acting as a stressor. In this capacity, it triggers an increase in maternal concentrations of the
stress hormone CRH (corticotropin-releasing hormone). These elevated levels prepare the
fetus for an expected preterm delivery: fetal growth is reduced, but at the same time, tissue
maturation is speeded up (Hermann et al., 2001; Hobel & Culhane, 2003). Exposure to stress
hormones before birth may also program the hypothalamic-pituitary-adrenal (HPA-)axis: a
system that controls much of the hormonal system, including reactions to stress. The
alterations to the HPA-axis and its responses resulting from this programming have been
linked to higher blood pressure and type 2 diabetes (Seckl & Holmes, 2007). Other recent
evidence focuses on how, as a result of pre-birth circumstances, the same set of genes may
lead to different outcomes (“phenotypes”): the in utero environment may evoke epigenetic
changes (Seckl & Holmes, 2007) and thus cause programming in the way that genes are
expressed. Heijmans et al. (2008), for example, show that the layer surrounding the DNA that
determines the extent to which genes are expressed, is changed at the site of a gene that is
related to human growth.
The adaptations of the fetal body to a shortage in nutrition may serve to prepare for a
life in an environment characterized by this same shortage, or may mainly serve to minimize
11
damage. When there are adverse conditions in utero, the fetus starts to “expect” to encounter
these same circumstances after birth. Hence, according to fetal programming theory, the body
makes some adaptations that prepare it for this expected post-natal environment. For
example, it will acquire a heightened tendency to store fat, which is beneficial if there is
indeed often a shortage of nutrition. If this is not the case, however, these adaptations will
only prove to be maladaptive. The initially small child will then gain weight fast
(“compensatory growth”), and fast weight gain is, even more than the final body weight
reached, a cause of coronary heart disease (Barker, 2002). Consequent with this principle, the
chances of developing serious health problems later in life seem to be higher if there is a
“mismatch” between the environment experienced in utero and the environment experienced
during post-natal life (Seckl & Holmes, 2007). This possibly happens during Ramadan, as the
fetus gets “programmed” for a hostile environment that it will in reality not encounter.
If negative health effects from a shortage of nutrition are unavoidable, the best way to
minimize damage, from an evolutionary viewpoint, is if the body manages to postpone these
negative effects till after the person has procreated. The body’s adaptational strategy is hence
theorized to be such that it tries to stay vital until the reproductive age. After that, it pays the
price for the adaptations made. The evolutionary goal of procreation will be achieved in this
way, but the early onset of adult diseases is the side-effect (Godfrey & Barker, 2000;
Metcalfe & Monaghan, 2001).
Beside general theories on how adaptations of the fetal body to nutritional shortage
may lead to long term negative health consequences, negative effects of observing Ramadan
may also come from higher incidences of hyperemesis gravidarum (excessive vomiting
during pregnancy) during this month (Rabinerson et al., 2000) and from a refusal to take
prescribed drugs during daytime (Leiper, Molla & Molla, 2003). Potentially, peaks in the
blood glucose level caused by the consumption of large amounts of sweet products in the
evening, may lead to major congenital anomalies in the offspring (cf. Schaefer et al., 1997).
Furthermore, dehydration caused by restricted fluid intake may cause a low amniotic fluid
level. This, in turn, has been linked to perinatal death, fetal malformations, preterm birth, low
birth weight and poor health at birth (Brace, 1997; Casey et al., 2000).
Some indications that a fetus suffers from a lack of nutrition can be measured directly
during pregnancy, and have been demonstrated specifically during Ramadan fasting. During
a period of shortage, the fetus reduces its breathing movements (Phillips, 1996) in order to
decrease metabolism. Another potential reaction is that spontaneous decelerations of the fetal
heart rate appear more often, while heart rate accelerations that should occur when the fetus
12
moves in utero, appear less often. Mirghani and colleagues find similar heart rate effects and
a reduction in the breathing movements among fetuses of Ramadan fasting women
(Mirghani, Weerasinghe, Smith & Ezimokhai, 2004; Mirghani, Weerasinghe, Al-Awar &
Ezimokhai, 2005). Strikingly, the latter effect was found even when women reached blood
glucose levels that were still above those indicating hypoglycemia.
The Indonesian doctors I interviewed did not separately register problems during
pregnancy related to Ramadan, let alone long-term effects on children. A few obstetricians
nevertheless confirmed that there was an increased incidence of pregnancy problems during
Ramadan: more cesarean sections, cases in which there was a decrease in amniotic fluid or
fetal heart rate accelerations and, in the first trimester, a higher incidence of hyperemesis.
Note that some problems can easily turn out severe in poorer areas as most clinics there
cannot make the necessary measurements, while a problem necessitating a cesarean section
may turn out lethal for baby and even mother. Beside these problems, most doctors mainly
saw a point of concern in the development of the weight of mother and fetus. It was this that
most often prompted them to give an advice to a woman to stop fasting. Another point of
concern noted by the doctors was liquid and/or food intake. Women had to be advised to
drink enough and to eat variedly, healthily and a sufficient quantity.
Based on medical theory, being exposed to Ramadan in utero may negatively affect
the general health condition of people of all ages, although fetal programming suggests that
effects on some diseases will mainly occur on people who are after a after their reproductive
age. I will first show that this is indeed the case, using the cross-sectional data described next,
and I will support the evidence by a few robustness checks. Next, I will turn to various
aspects of general health. To begin with, it is thinkable that some exposed fetuses do not
survive the pregnancy. The data used do not contain information on miscarriages or perinatal
death, but an indication can be retrieved from the sex ratio: males are more sensitive to
disadvantageous conditions. Male fetuses grow faster and are therefore more vulnerable to a
shortage of nutrition (Godfrey & Barker, 2001). Therefore, if Ramadan causes attrition
among fetuses, this will lead to a lower share of males among the affected. I will show that
this is the case and rule out some alternative explanations. That fasting causes death before
birth, means that the effects on general health found in a cross-section of living people are
underestimates of the total effect on the entire population of fetuses, because the fetuses that
have experienced the strongest effect do not survive long enough to enter the sample. Having
established that fetal attrition was indeed very likely, in the third results section, I look at
effects on generally non-severe symptoms, such as a cold, diarrhea and infections. Fourth, it
13
has been suggested that effects on certain serious symptoms, particularly coronary heart
disease and type 2 diabetes, should mainly be found in older people. I will hence look at
effects on these health measures taken at the elderly. Fifth, I investigate effects on blood
pressure and blood values that may indicate kidney problems. Sixth, I examine effects on
body size measures that are suggested by theory, as affected people would be born smaller
and then later be prone to accumulating fat more easily. Seventh, I will look at specific
effects on children’s health. But before I will go into each of those health aspects, I will first
describe the data used.
4. The data
The Indonesia Family Life Survey (IFLS) is a longitudinal survey carried out by the RAND
corporation (Strauss et al., 2004). It consists of 3 waves: IFLS 1 (1993/4); IFLS 2 (1997/8)
and IFLS 3 (2000). For most analyses, I will use data from the last wave, as this wave has the
largest sample size, contains the most complete birthdate information and contains more
information of interest for the purposes of this research than the other two waves.
IFLS is a broadly set up survey which collects a great amount of information at
individual, household and community level on a large array of economic, health and social
indicators. Sampling took place at the household level. Great care was taken to assure
representativeness of the sample for the reference population. IFLS covers 13 of the (then) 26
provinces of Indonesia, which in total represent 83% of the Indonesian population. The
provinces that are not included, are mainly the decentrally located, less densely populated
ones. In the first wave of IFLS, 7,224 households were interviewed, which in total contained
33,026 household members, from zero years of age till old-age. In the second and third wave,
the same households were approached (re-contact rate: around 95%) and split-off households
were also interviewed. The sample size subsequently increased to 43,649 persons in 10,435
households in IFLS 3, about 85% of whom were measured and/or interviewed in person. In
Indonesia, as is the case in most developing countries, some people do not know their exact
birthdate. Of about 20% of the remaining sample, the month and/or year of birth was not
known; of another 11%, only birth month and not exact birthday was known, which also
rendered them not useable for the analyses. This reduced the total sample to 29,695. About
88% of these interviewees were Muslims. Household interviews were conducted by teams of

14
12 to 14 interviewers with different specialisms, assigned to a set of communities (for
budgetary reasons, 20 to 30 households were interviewed per community). Each team
contained two health workers (nurses) who were trained by staff of the School of Public
Health of the University of Gadjah Mada, Yogyakarta. In many analyses, I will specifically
make use of information collected by these health professionals. Table 1 summarizes the
variables used in this paper.
I calculated how many days before somebody’s birth the last Ramadan fell. For this, I
used the person’s exact birthdate and the dates of each Ramadan in the years 1900-2000.1
Note that since the occurrence of Ramadan depends on moon sightings which may vary by
geographical place, there may be deviations of one or two days in the start and end dates in
some years for groups of people. This causes a small amount of noise in my measures. Using
the average length of human pregnancies (266 days as calculated from the day of
conception), I calculated whether the person experienced Ramadan in utero. Figure 1 clarifies
the procedure used.
The reference group in all analyses consists of those who were certainly not in utero
during Ramadan, i.e. those who, according to my calculations, were conceived within a
relatively narrow time window of about 59-60 days per Islamic year, which starts right after a
Ramadan and ends 266 days before the next fasting period. If a pregnancy lasted longer than
the average human gestational time, this would lead to an erroneous classification as not
having experienced Ramadan in utero. Since the reference group is so important in all
analyses, I therefore drop from the data all those for whom I calculated that they were
conceived less than 21 days after the end of Ramadan. This is a safe margin, since
pregnancies that last three weeks beyond term or more are rare (see e.g. Kieler et al., 1995).
Actually, this bandwidth is longer than necessary for just this purpose: taking it this long also
makes sure that almost all children are dropped who were conceived in the festive days
following Ramadan, who may differ from children conceived at other time points.
Note that a shorter than average gestation can never lead to erroneously classifying
someone into the reference group. It can, however, lead me to wrongly conclude that the
person did experience Ramadan in utero. This happens if conception took place less than 266
days before birth and Ramadan ended between 266 days before birth and the date of
conception. I cannot solve this misclassification problem by dropping people from the data,
since some pregnancies are shorter than 266 days by a great number of days. Dropping would 1 These, I retrieved from www.phys.uu.nl/~vgent/islam/ummalqura.htm and (before 14 March, 1937) www.al-islam.com/eng.
15
then lead to the loss of a great deal of information. Also, I am interested in the differential
effects of having experienced Ramadan during conception and during different periods of the
pregnancy. Dropping in this case would make it impossible to calculate effects of being
conceived during Ramadan.2
For the latter analyses, I divide those for whom I calculated that they experienced
Ramadan in utero into five subgroups: those who were conceived during Ramadan, those
who were born during Ramadan and those who experienced an entire Ramadan in utero and
who were further subdivided into those for whom Ramadan started during the first trimester
of pregnancy, those for whom it started during the second trimester and those for whom it
started during the third trimester, but who were not born during Ramadan. Depending on
variations in the exact length of pregnancies, there is some noise in these measures due to
misclassifications.
My basic specification now becomes:
(1)
Standard errors are clustered by family, as there may be within-family correlation on
the health variable, y. The age variables refer to the number of days after Jan. 1st, 1900 that a
person was born. I choose to control for age in this flexible way instead of using year of
birth-dummies, since some Gregorian years contain two Ramadans, which might lead to
unwanted correlations. In the latter analyses described above, the variable indicating whether
someone was exposed to Ramadan in utero vs. was certainly not exposed, is replaced by five
dummies for the different periods during pregnancy that exposure could have taken place.
Note that all estimates are probably underestimates of the real effect. First, (except for
children living at home with their parents) I only know a person’s own religion and not the
religion of his/her mother. Deviations may lead to misclassification and attenuation. Second,
I calculate whether persons had been exposed using the average length of human pregnancy.
2 Note that I drop people based on the day on which they are born. Both the exposed and the non-exposed group therefore contain people who have been born pre-term and people who have been born after the expected date of birth. Exposure, as argued, may cause premature birth. This leads to misclassification in that I classify some people for whom Ramadan started in trimester 1, respectively 2, of the pregnancy, as having been exposed in trimester 2, respectively 3, and some people who have been conceived during Ramadan, as having been exposed to a Ramadan that started in trimester 1.
112 3 4
1 2 3 41
i i i i i i m mi i im
y exposed age age age age month sexα β γ γ γ γ λ θ ε=
= + + + + + + + +∑
16
Persons conceived shortly after Ramadan and born prematurely, may be wrongly classified as
“exposed”. Third, and most importantly, I do not know which mothers actually did observe
Ramadan during pregnancy. My results should therefore be seen as intention to treat
estimates. If choice of fasting is uncorrelated to expected offspring’s health outcomes, the
magnitude of all estimates would have to be multiplied by one over the share of fasting
women in order to get to an average treatment effect (ATE). If especially those mothers chose
not to fast for whom fasting would have had a larger impact on their offspring’s health, then
my estimates would even be a larger underestimation of the ATE. If mothers with an above
average health chose not to fast, and if for those women, fasting would have had a smaller
impact on their offspring’s health, then the correction factor would have to be smaller than
one over the share of fasters. As fasting rates are likely to differ per trimester of pregnancy,
the difference between my estimates and the ATE probably differs between the phases of
pregnancy that I distinguish. Fourth, beside misclassification issues, attrition may bias my
results towards zero. That is: all estimates are conditional upon survival. If people’s health is
indeed negatively affected by having a mother who fasted during pregnancy, this may lead to
higher mortality rates among those who are affected most. Indeed, some fetuses may even
have died in utero as a result of fasting. My results for effects on the sex ratio give some
evidence that such attrition does indeed take place. Fifth, those who do not know their exact
date of birth, were excluded from all analyses. Their average health is worse than that of
those who do know their birthdate. It is possible that the health of some people was affected
in such a way by exposure to Ramadan in the womb, that they were less likely to remember
their date of birth. If such selective attrition of those on whom the effect was the strongest has
indeed taken place, this may lead to a bias towards zero.
5. Results
5.1. General health measure
The following analyses will go into general health. After showing that people who were
exposed to Ramadan in utero have a worse general health than people who were not, I will
look at a few alternative explanations: common shocks in health that just happened to be
correlated to the occurrence of Ramadan and systematic differences between mothers whose
children were vs. were not exposed that can be lead back to selective timing by certain

17
parents of pregnancies to avoid Ramadan. I will show that the finding that fasting during
pregnancy negatively affects offspring’s general health, is a very robust one.
5.1.1. General health effects on Indonesian Muslims
As part of IFLS 3, each household was visited by two health workers, typically nurses, who
were trained for this purpose by university staff of the Public Health School of Gadjah Mada;
one of Indonesia’s most renowned universities. They took measurements of a diverse set of
physical and health variables such as weight, height and other anthropometric measures,
blood pressure, pulse, lung capacity and hemoglobin level. For respondents aged 15 years and
older, also measurements of physical condition were taken by letting the person rise from a
sitting to a standing position five times and timing them doing this. In taking all these
measurements, the health workers gained good insight into the health of the respondents. At
the end of all measurements, they rated how the health of the person compared, in general, to
the health status of other people of the same age and sex. A nine-point scale was used, in
which 1 referred to much worse and 9 to much better, etcetera. Because of the experience of
the health workers, the specific training they had received for IFLS and because of the insight
they had gotten into the respondents health after taking a broad set of measurements, this
variable is arguably the best indicator of respondents’ general health that is available. Such a
measure is, for example, much more reliable than self-reports of health given by respondents.
In later analyses, I will use these self-reports as well, but they may suffer from lack of
knowledge of the meaning of subjectively felt symptoms, overreporting of illnesses and a
lack of a frame of reference, whereas the general health measure is given by a professional
with a great deal of knowledge about health, who had the experience and overview to
compare respondents’ health with that of others of the same age and sex.
Table 2 shows the results from OLS-regressions for the effects of having been in utero
during Ramadan for Indonesian Muslims. In all analyses on general health, babies under one
year of age were removed, because, due to rapid changes and “jumps” in growth, size and
development at this age, it is very difficult for health workers to give reliable comparisons
with people of the same age and sex. The upper panel shows the overall effects, in which
people who were in utero during Ramadan are compared with those who were not. The
second panel compares those who experienced Ramadan during different phases of
pregnancy, with those who were not exposed. All regressions control for age in a flexible
way, month of birth and sex (except, naturally, for the regressions on males and females
separately); standard errors are clustered by family; see equation (1).
18
For the entire sample, I find a highly significant negative effect of having been
exposed during pregnancy of 6.1% of a standard deviation of the general health variable. I
next split up the sample in those under the age of 45 and those 45 and older, following the
idea from fetal programming that fetal adaptations to adverse conditions in utero that are
beneficial in the short run, mainly lead to problems after the reproductive age (Godfrey &
Barker, 2000). I find that, although there is a significant effect for the young, the effect is
much stronger for the older people, where the effect is as much as 18.5% of a standard
deviation. Note that I cannot distinguish between the effects on my estimates of ageing and
those of changes over time in the share of mothers who chose to fast, or of changes over time
in health care provisions. Looking at the general trend in Indonesian religious observance,
however, there is no reason to assume that fasting among the pregnant has decreased to such
a degree that it can explain the threefold difference in effect sizes between the young and the
old; one midwife I interviewed even claimed that in recent years, there had been a strong
increase in the share of pregnant women in her village that fasted. The lower panel shows that
the signs are negative for each phase of pregnancy during which Ramadan may be
experienced (note that these phases are different in length, and that the power to find
significant effects varies accordingly between the phases). The largest effects are found when
an entire Ramadan was experienced during pregnancy, especially when Ramadan fell about
halfway the pregnancy.
5.1.2. Non-Muslims
To check whether the reported effects are not a result of common shocks to cohorts,
correlated by coincidence to Ramadan, in table 3, I report the same analysis for non-Muslims.
Non-Muslims are not affected by Ramadan fasting, but otherwise, they experienced the same
common shocks as Muslims. Also, there are reasons to assume that non-Muslims are affected
by Ramadan itself somewhat as well through changes in daily life patterns that occur at the
same time as Ramadan. Consumption patterns of non-Muslims living in predominantly
Muslim-areas may be affected to some extent in that it is often considered impolite or rude to
eat and drink when fasting Muslims are around and through changes in availability of food
(more sweets). Increased food prices are partially offset by the receipt of a 13th month wage
and for the poor, by the receipt of food during Ramadan. Also, around the end of Ramadan,
there is an important national holiday in which people en masse visit family. If it is not
fasting during pregnancy, but the general change in life pattern during Ramadan that causes
the previously described effects, or if it is common shocks that are coincidentally correlated
19
with Ramadan, I should also find effects of having been in utero during a Ramadan on non-
Muslims.
All common shocks influence non-Muslims more if they are living in predominantly
Muslim provinces than if they are living in a non-Muslim province. I therefore report
estimates separately for these two groups; and in subsequent robustness checks related to
other analyses, reported in Appendix A, I only show results for the non-Muslims living in
Muslim-provinces. Note that all provinces included in IFLS have a great majority of
Muslims, except for the island of Bali, where 86% of the Hindus in the sample are
concentrated and where only 14% of the population is Muslim, many of whom have migrated
there at some point in their life. In the predominantly Muslim provinces, the non-Muslims are
mainly Protestant or Roman Catholic (84.7%), Hindu (5.9%) and Buddhist (8.8%). On
average, their general health is better than that of Muslims: 6.47 vs. 6.13 on the nine-point
general health scale (p < .001).
As the table shows, no effects are found for either of the non-Muslim groups. General
health effects related to Ramadan during pregnancy are hence not caused by common shocks
experienced by the whole population, that happened to be correlated with the occurrence of
the Ramadan fasting period.
5.1.3. Selective timing of pregnancies
If some women, whose offspring would have had a better health anyway, deliberately plan
their pregnancy so as to avoid Ramadan, my results may confound effects of Ramadan during
pregnancy with self-selection of healthy people into the control group. The fact that sampling
in IFLS takes place at the household-level, gives me two instruments to check whether self-
selection may have driven the results. First, I compare mothers whose child was exposed to
Ramadan with those whose child was not. The second strategy comprises family fixed
effects.
I should note here that there are a few things that speak against the occurrence of
selective timing. First, it is quite difficult for a woman to plan her pregnancy in such a way
that she avoids Ramadan completely: the time window to get pregnant is then small; only less
than three months per year can she “safely” get pregnant. Second, according to the
obstetricians and midwifes I interviewed, selective timing is not an issue at all: they had
never heard of anybody planning in such a way or even thinking about doing this. Especially
those Muslims who interpret fasting during pregnancy to be obligatory, believe that fasting is
generally beneficial and would not avoid pregnancy during Ramadan. On the contrary, it

20
occasionally happened that couples tried to plan the pregnancy in such a way that the child
was delivered during Ramadan, as this is considered a positive occurrence. It is questionable
whether this latter phenomenon leads to any noticeable effect on my estimates, because of the
small time window and because even those few couples mainly wanted to get pregnant and
hence also tried this around the time window. Moreover, in case this does lead to selectivity,
this cannot explain why, in table 2, there are effects of exposure e.g. halfway during
pregnancy. Nevertheless, because selective timing is a clear potential source of bias, it is
important to investigate this issue further.
If mothers self-select into exposing their baby to Ramadan in utero, then, arguably,
differences in characteristics should exist between mothers whose pregnancy overlapped with
Ramadan and those for whom this was not the case. Particularly, women whose child had not
been exposed, would be expected to be higher educated and healthier. Higher educated
women might be more likely to plan their pregnancy so as to avoid Ramadan. And women
who care a lot about their own health, may also be more concerned about the risks posed by
Ramadan to the baby. If under normal circumstances, mother’s and child’s health are
correlated, then not-exposed children may have a better health, not (only) because of not
having been exposed, but just because their mothers had a better health.
Table 4 shows the results of a comparison of women whose oldest home-living child
between the ages of one and eighteen had versus had not been exposed.3,4 Note that all
variables, except for age at giving birth, refer to the present state of the mother, not to the
state at the moment of giving birth: such data are unavailable. Some variables may have
endogenously changed since then, if, for example, a pregnancy with complications affected
the mother’s health. On the other hand, if unhealthy and older mothers are more likely to
miscarry as a result of fasting, then the remaining mothers whose child was exposed, will
have a health that is a bit above average and be a bit older. The measuring of certain variables
years after childbirth, limits the value of the present analysis somewhat.
3 To be exact: because IFLS collects data on the household and does not link mothers to children, I do not work with mothers and children, but with the female partner of the household head, or female household head, and the biological children of the household head. The difference between the two definitions will be small. 4 I exclude very young children, since their mothers’ health may still have been affected by recently having given birth. This may lead to spurious correlations between pregnancy during (the recent) Ramadan and mothers’ health. I also exclude children above the age of eighteen, the age at which many children start leaving home. Home-leaving may be correlated with health, so that this sub-sample may overrepresent children who had been affected by exposure during pregnancy more strongly than average.
21
There are no differences between the two groups of women in the share who
completed high school. Their general health is equal as well. Also, there are no differences in
prevalence of non-severe symptoms in the last four weeks, nor in the prevalence of high
blood pressure or anemia. Their height, body mass index (height/weight2) and the weight
itself do not differ. Women whose child had been exposed report being sick less often. This
difference is hard to explain, as this indicates a better health. Women in the not exposed-
group were perhaps somewhat older at the time of giving birth than the others. This
marginally significant difference is possibly caused by the general pattern that miscarriages
happen more often among older women, in combination with a higher incidence of
miscarriages among women who are pregnant during Ramadan – see also paragraph 5.2
below. The last line of table 4 gives the share of women living in urban vs. rural areas. This is
interesting to look at, since perhaps women in urban areas have better health behavior (i.e. are
more likely to avoid Ramadan) and simultaneously have healthier children, just because
health care is better in urban areas. Again, no difference is found. Hence, it can be concluded
that women whose child was exposed to Ramadan in utero and women whose child was not,
are quite similar in a number of relevant characteristics. Appendix table B4 shows that this
pattern holds for each of the phases of pregnancy during which people could have been
exposed.
Table 5 shows the results of the family fixed effects regression on children’s general
health. I take the subsample of Muslim children between the ages of one and eighteen, living
with their biological parents. This fixed effects analysis has the advantage that it compares
children within families and is insensitive to any systematic differences between families in
general health. So if only women chose to fast whose children would have had a worse health
anyway, I should find no effect. The first column of the table shows the OLS-results for the
sample used in this analysis. The second column shows the results for the family fixed effects
regression. The third column adds birth order dummies to the latter, to control for potential
correlations between birth order and exposure on the one hand and birth order and health on
the other hand.
The OLS-coefficient is comparable to that of the complete sample (see table 2), but
not significant, probably due to a lack of power. In the fixed effects analysis, the coefficient
is almost the same, and, combined with the increased precision, it is now significant. This
gives strong evidence that the general health effects do not arise because of systematic
between-family differences. Moreover, controlling for birth order effects does not change the
size or significance of the effect.
22
5.1.4. Subjective feelings of general health and sickness
Having shown that general health as measured by health professionals is negatively affected
by exposure to the Ramadan fast in utero, I will now turn to the question whether this pattern
fits with the subjective health experiences of Indonesians. Respondents in the IFLS were
asked whether they had been sick in the last four weeks and whether their own health was
better or worse than that of another person of the same age and sex. The first question was
also asked in the second wave of IFLS. This makes it possible to increase the precision of the
estimates for this variable by pooling the data from IFLS 3 and IFLS 2. To allow for
maximum flexibility, in equation 1, I now interact each regressor and the constant with a
dummy for the IFLS-wave. I cluster the standard errors by person.
Table 6 shows the results in the same way as the previous tables: the top panel of part
a. shows the corrected difference between exposed and not-exposed and the second panel
compares the not-exposed to those exposed in different periods of pregnancy. The same
results separately for the young (under 45) and old (45 and older) are shown in parts b. and c.
The results confirm the picture that arose from the health workers’ reports. People
who had been exposed report sickness in the last four weeks more often – an effect of about
one percentage point on an average rate of seven per cent. Older people judge their own
health more negatively in comparison with others of the same age and sex. Among younger
people, this latter effect does not appear. Larger effects among older people concur with fetal
programming theories which say that health adjustments of the fetus to adverse conditions in
utero are detrimental mainly in the long run. Appendix A shows results for the non-Muslims
living in a predominantly Muslim province. No significant effects for them are found, nor is
there a clear, but non-significant, pattern in the results.
5.2. Sex ratio
As shown, being exposed to Ramadan in utero negatively affects peoples’ general health.
From medical theory, it can be expected that these health effects translate into an altered sex
ratio, i.e. the proportion males among the exposed would be lower: it is probable that some
fetuses will not survive pregnancy if the effects of exposure to fasting are large. And as male
fetuses are more vulnerable to a shortage of nutrition (Godfrey & Barker, 2001), this attrition
should take place more often among males. Hence, in the absence of data on miscarriages and
perinatal death, an effect on the sex ratio is a sign that some fetuses indeed do not survive the
pregnancy as a result of an exposure to Ramadan. One side-consequence of such an effect,
23
would be that the previously described general health effects are an underestimate of the
total-population effect, as those for whom the general health effect was strongest did not
survive till after birth.
There is a problem here in that I do not know the sex ratio at birth, but only the sex
ratio of the people in a cross-section of all ages. This causes the first of two alternative
explanations for any effects found: it is possible that attrition of males does not take place at
the fetal stage, but later in life. I.e. that the health of males is affected more strongly, and that
they therefore die younger, which then causes the changes in the sex ratio. I can check this by
looking at the effect on the sex ratio at different ages. If a general effect on the sex ratio is
caused by differential mortality later in life, then the sex ratio effect should be larger among
older people. Also, arguably, health effects would then be stronger for males. The last two
columns of table 2 showed that men may indeed experience stronger effects during their
lifetime than women, but the coefficients lie within one standard error of each other. In the
analyses that will be presented in upcoming sections, I also find no systematic larger health
effects on males, see Appendix C, which shows all analyses for males and females separately.
My results, presented in table 7, corroborate those of Almond & Mazumder (2008),
who find altered sex ratios both among newly-borns and adults. After correction for time
trends and month of birth dummies, among the exposed, the share of males is about 2.6%
lower (uncorrected average for the exposed: 50.55% males; not-exposed: 52.92%). The first
alternative explanation seems unlikely, as the estimated effect among the young (under 45
years of age) is larger than the effect among the old. Among the old, the effect in most phases
of pregnancy has even disappeared: perhaps the least healthy girls are born but are short-
lived, while the least healthy boys are not born at all.5
The second alternative explanation lies in processes playing around the time of
conception. The Trivers-Willard hypothesis (1973) states that when conditions are favorable,
it is more advantageous for a mother to produce males. This suggests that sex ratio effects do
not arise because of miscarriages and perinatal death, but because of a purposeful biological
process of sex determination at conception. The Trivers-Willard hypothesis argues that males
are more costly to produce in terms of parental investment and survival chances, but that if
they do procreate, they are able to produce more grandchildren. Hence, when conditions are
favorable, it is better to produce more males in order to obtain the evolutionary goal of the
5 Note that with the present data, I cannot distinguish between pre-birth death and mortality in the first few years of life, since if analyzing only the sub-sample of very young children, I may confound effects of exposure with seasonal effects.
24
highest number of grandchildren. When conditions are unfavorable, it is better to play it safe
and produce females, who have a lower reproductive rate, but a higher chance of procreating.
Since sex is determined at conception, this means that the unfavorable conditions during
Ramadan would lead to a lower share of males among people who were conceived during
Ramadan. Indeed, Mathews, Johnson & Neil (2008) show that among women who had a
lower energy consumption around the date of conception, the share of boys in the offspring
was also lower. Following this hypothesis, an effect is not expected among people who were
born during Ramadan, or exposed during second or third trimester. The same holds for the
hypothesis that sex ratio effects may be caused by potentially altered patterns of sexual
intercourse during Ramadan: it has been suggested that a lower frequency of sexual
intercourse increases the chances that the child will be female (e.g. James, 1971). Both
alternative hypotheses can be rejected, since effects are found in all trimesters and are even
strongest among the people born during Ramadan, see the lower panel of table 7.
Table 8 shows the effects for the non-Muslims, to investigate whether common
shocks, including the occurrence of the holiday period around Ramadan, may have caused the
presented effects. Again, no effects are found for the non-Muslims. For the upcoming
analyses, the effects on non-Muslims living in predominantly Muslim provinces, of having
been in utero during a Ramadan, are shown in Appendix A. I do not find significant effects
that suggest negative health effects. This gives strong evidence that the effects of exposure on
the Muslims have not been caused by common shocks which occurrences were correlated to
those of Ramadan.
5.3. Generally non-severe health problems
The preceding sections have shown that exposure to Ramadan in utero causes negative health
effects and most probably even fetal attrition. I will now turn back to people who survived
the fetal stage and will focus on investigating which specific aspects of their health are
affected. First, I will investigate whether the negative general health effects that I found may
be caused by some relatively mild health problems. IFLS contains a number of questions on
symptoms that could have occurred in the past four weeks: a cold (runny nose/dry cough),
headache, skin infection, nausea/vomiting, eye infection, diarrhea and toothache. These self-
reports seem somewhat unreliable: e.g. 53% of the respondents reported having had a cold in
the past four weeks. This seems unrealistically much. To increase the precision of the
estimates, I use the data from all waves of IFLS in which these questions have been asked.
25
For the last three variables, I pool data from all three waves; for the other variables, this is
only possible over the last two waves, see table 9.
Exposure to Ramadan in utero does not seem to affect the chances of suffering from
one of the presented sicknesses and mild health problems. Hence, the effects on general
health that were described extensively earlier, are not caused by effects on the generally mild,
non-severe health problems described here, nor do these general health problems capture the
sicknesses that forced the exposed people to stay in bed more often. This also fits with
medical theory, which predicts that effects of exposure should especially be found on some
specific, more serious health problems. Also, the absence of effects on the subjective reports
of symptoms, means that the exposed do not have an increased general propensity to
complain. This is important, because in the next section, I will turn to the more serious health
problems predicted by medical theory, for which I will also use subjective reports of
symptoms.
5.4. Subjective indicators of coronary heart disease and diabetes among the elderly
Effects on certain serious symptoms, particularly coronary heart disease and type 2 diabetes,
are specifically predicted by medical theory and should mainly be found in people who are
after their reproductive age. A few questions in IFLS asked specifically to people aged 50 and
older, provide a good, although indirect, insight into these symptoms. Respondents indicated
whether they sometimes felt chest pains on the left side or during exertions, which can be a
sign of coronary heart problems; and whether cuts or wounds take a long time to heal. This
can be a sign of type 2 diabetes. Often having to get up during the night to urinate is a sign of
diabetes type 1. Medical theory does not predict effects on this type of diabetes (insulin-
dependent or juvenile diabetes), and hence, this analysis mainly serves as a robustness check.
Note that 34% of the elderly respondents answered “yes” to at least one of the chest pain sub-
questions. This seems to be quite much and an overestimate of real, severe problems. Again, I
can pool data from the last two waves of IFLS in order to increase the precision of the
estimates. (Data not available for IFLS 1.)
I find that chest pain occurs more often among people who were exposed to Ramadan
in utero (see table 10). For females, this effect seems larger than for males. The effect appears
for people exposed in each phase of the pregnancy, although especially for females, the effect
seems larger for people conceived during Ramadan. This concurs with a finding from
Roseboom et al. (2000) who study the effect of in utero exposure to the Dutch famine of
1944-45 and find that the chance of developing coronary heart disease is increased mainly

26
among people exposed early in gestation. People exposed to Ramadan in utero also more
often report that wounds take a long time to heal. Again, this effect seems stronger for
females. This effect may be larger for people exposed late in gestation or born during
Ramadan. This concurs with Ravelli et al. (1998), who report that the largest effect of the
Dutch famine on decreased glucose tolerance is on people exposed late in pregnancy. For the
indicator of type 1 diabetes, having to get up often during the night to urinate, I do not find a
significant effect. The effects on chest pain and wounds that take a long time to heal are quite
strong. These symptoms potentially indicate very serious health problems and they occur
about eight and four percentage points more often among the exposed, for symptoms that on
average occur in 34 and ten per cent of the population, respectively. Similar effects are not
found for non-Muslims, see Appendix table A11: coefficients partially even point into the
opposite direction.
5.5. Hypertension and anemia
IFLS-health workers measured participants’ blood pressure and the hemoglobin level in their
blood. Increased occurrence of hypertension (high blood pressure) is specifically predicted by
fetal programming theory, especially among older people. It may be caused by damage to the
kidneys. Anemia (a low hemoglobin blood level) has several potential causes. Anemia can be
caused by a lower intake of iron than what is lost, which most often occurs among women in
the fertile ages (related to menstruation), and by diseases including cancer, rheumatoid
arthritis and sickle cell disease. But, like hypertension, it may also be caused by kidney
problems. Recall that fetal adaptations to maternal undernutrition may lead to a reduced
number of nephrons in the kidneys, which may cause problems after ageing has caused a
further decrease in the number of nephrons.
As shown in table 11, older people who experienced Ramadan in mid gestation, more
often have anemia, while the overall effect for the older group, relating to all phases of
pregnancy, is only marginally significant (p = .054). This concurs with the finding of Painter
et al. (2005), who find that people aged around 50 who were exposed to famine in utero, have
a higher chance of developing certain kidney problems, but only if exposure took place
during the critical period for kidney development, which is in mid gestation. I do not find
evidence for a general effect on hypertension (defined as a systolic blood pressure ≥ 140
mmHg and/or a diastolic blood pressure ≥ 90 mmHg), or for the expected effect among the
older people. I do, however, find an effect on pulse pressure (systolic minus diastolic
pressure): this turns out to be higher among the exposed. This effect mainly seems to come
27
from the younger part of the population. In the older sample, there is no significant effect.
This makes the effect on pulse pressure a bit hard to interpret: a high pulse pressure is
predictive of coronary heart disease among older people, but not among younger people
(Franklin et al., 2001).
5.6. Effects on weight and body size
Beside the predictions by medical theory on effects on serious symptoms that were largely
confirmed above, another prediction by medical theory is that people exposed to fasting will
be smaller at birth, and after that accumulate fat more quickly. This may be a reaction of the
body to the expected scarcity that will be encountered in life: a propensity to quickly
accumulate fat will then be beneficial, but if there is no scarcity during life, then this leads to
problems. Expectedly, in a country where there is an abundance of food, the exposed would
therefore more often have obesity later in life. The results from table 12 show a different
picture, however. There are in general no effects of exposure on obesity, although for people
born during Ramadan, the expected significantly positive effect is found. The analyses on
body mass index (BMI), weight and waist circumference (a measure for abdominal fat), show
that the exposed are even less heavy and have less fat.
A tentative explanation for this is that obesity in Indonesia is a much smaller problem
than in Western countries; according to Unicef data (2008), 28% of the children even have
underweight. People who started off with low birth weight may not have had the chance to
accumulate fat quickly, and thus stayed lighter. In a world without abundance, the dominating
effect on adults’ weight may then come from the lack of muscles which is usually present in
low birth weight children and which cannot be made up for later in life (Barker, 2002) and
not from the increase in body fat. Some evidence for this explanation also comes from the
analyses on a more extreme form of underweight: severe thinness. This occurs more often
among those who have been born or conceived during Ramadan; mainly among those under
45 years of age. Also, on average, people who develop coronary heart disease are relatively
short at birth and, since accelerated fat accumulation does not influence growth, remain short
all through their lives (Barker, 2002). Consistent with this, I find that those who were
conceived during Ramadan were about half a centimeter shorter than comparable others.
5.7. Estimates on health of children by their parents
As mentioned, the largest health effects are expected for older people. Nevertheless, to get a
complete picture, I also look at the questions that parents answered about the health of their

28
children aged under 15. Many of the symptoms that parents were asked about, were similar to
the questions on symptoms adults answered about themselves, that I treated earlier.
Whenever possible, in these analyses, I again pooled data from all three IFLS-waves, see
table 13.
Children conceived during Ramadan were sick and unhealthy more often according to
their parents; for the other phases of pregnancy, these effects were not significant. (Do note
that previously, I did find effects on health for children in the family fixed effects analyses;
these used the more exactly measured general health variable.) Concerning the various
generally non-severe health problems that were measured, as was the case for adults, there
were no significant negative health effects.
6. Discussion
Participating in the Ramadan fast during pregnancy may cause considerable negative health
effects on the offspring. Such effects are not limited to health outcomes around the moment
of birth, that were shown in earlier research. Indeed, some effects get stronger, or only show
up when the offspring gets older. Exposure to fasting before birth is associated with poorer
general health and a higher incidence of sickness. It also increases a person’s chances of
developing symptoms that are indicatory for serious health problems such as coronary heart
disease and type 2 diabetes and, among older people who had been exposed during certain
stages of gestation, may lead to anemia. Younger people who had been exposed on average
have a higher pulse pressure. Depending on the moment of exposure, the exposed on average
are a bit smaller in body size and weigh less. A lower percentage of males among those born
during, and in the months after Ramadan, suggests a higher incidence of miscarriages and
perinatal death. I find such effects for exposure during each phase of pregnancy. These results
are robust to a number of alternative explanations. Although often considerable in size, the
presented effects are probably usually underestimates of the true effect (ATE).
Perhaps the main practical question that these results call up is whether such effects
will show up irrespective of how the fasting process is managed. For example, most of the
Indonesian doctors I interviewed believed that fasting is not a problem, as long as the
pregnant woman follows up advice on food and fluid intake and ceases fasting in case of
complications. In the medical profession, however, there seems to be very little consensus on

29
nutritional advice to Ramadan fasting women and on when to classify a complication as a
reason to stop fasting. This is clearly the case for Indonesia, where Ramadan fasting during
pregnancy is not an issue among medical practitioners or in university curricula, but also in
general, there is a great lack of medical literature on this topic.
Given the demonstrated potential severity of the effects, the degree to which
recommendations to stop fasting given in practice differ, is notable. Some Indonesian doctors
thought it better not to fast in the first trimester of pregnancy at all, because of an increased
incidence of hyperemesis (vomiting). Others saw less problems during the first trimester, but
during later stages sometimes advised women to stop because of stagnations in maternal
weight gain or insufficient intra-uterine growth. One doctor mentioned decreased amniotic
fluid and insufficient fetal heart rate accelerations were sometimes a reason to stop, but
another doctor did not regard the occurrence of both symptoms as problematic, as long as
values came back to normal during evening and night. In some clear occasions of
complications, such as bleedings, there was more consensus, but in these cases, a problem has
already arisen. Even with a scientifically based consensus, it is doubtful whether advising
women to stop fasting at the right moment is sufficient to manage the apparent great risks. A
continuous monitoring of all fasting pregnant women seems necessary. And even for well-
equipped hospitals with many patients, this would probably be a challenge. In the case of a
country like Indonesia, an added practical problem is that many clinics in poorer areas lack
the means to perform all the tests that would be required.
The composition and amount of food is very likely to make a difference for the extent
to which the fetus is affected. The more hypoglycemia and a calorie deficiency are avoided,
the smaller the effects will arguably be. A healthy and varied diet, not containing much sugar,
is generally part of guidelines to prevent hypoglycemia. Particularly, abandoning the
traditional consumption of many sweet products at breaking the fast may be beneficial, as this
leads to a quick release of glucose into the blood, the opposite of the slow and even release
that helps prevent hypoglycemia. Another part of such guidelines, however, is to eat small
amounts, regularly. This is not possible during fasting. And it is questionable whether a
healthy and varied diet in evening and morning is sufficient to prevent hypoglycemia and
ketonuria altogether during such a long period without food; especially for pregnant women,
for whom these symptoms arise much faster than for others (Metzger et al., 1982). The
second part of the diet, consuming a sufficient amount, in practice proves to be a great
problem for many women (Arab, 2004). In Indonesia, many doctors did not give specific
recommendations concerning the amounts of food to be eaten – their advice was then limited
30
to the amount of liquid to be taken – but such recommendations can relatively easily be given
to fasting women. A shortage of food and liquid may then be avoidable, but hypoglycemia
and ketonuria may not be.
All in all, careful management of fasting during pregnancy may reduce problems, but
it is unlikely that it reduces them to negligible levels. For women who insist to fast, it is
imperative that knowledge is assembled and a consensus is reached on the conditions under
which a woman can keep on fasting. It should become clear which consumption patterns are
desirable and which ones are not. Also, the women need to be monitored well on a number of
variables on which physicians should get consensus. Beside development of maternal and
fetal weight, this may include measures such as ketone levels, fetal heart rate, amniotic fluid,
and others. For women who adhere to the interpretation that fasting is not obligatory in
general, or not obligatory if there are risks to the health of themselves or the child, it seems,
given the risks of fasting during pregnancy shown in the present and other studies, advisable
to take dispensation from fasting. This concurs with advices given in some previous medical
papers on the topic of Ramadan fasting during pregnancy, see Malhotra et al. (1989) and the
review article by Azizi (2002), and with the general medical advice not to skip meals during
pregnancy, especially not during daytime given in e.g. Metzger et al. (1982) and Meis, Rose
& Swain (1984).
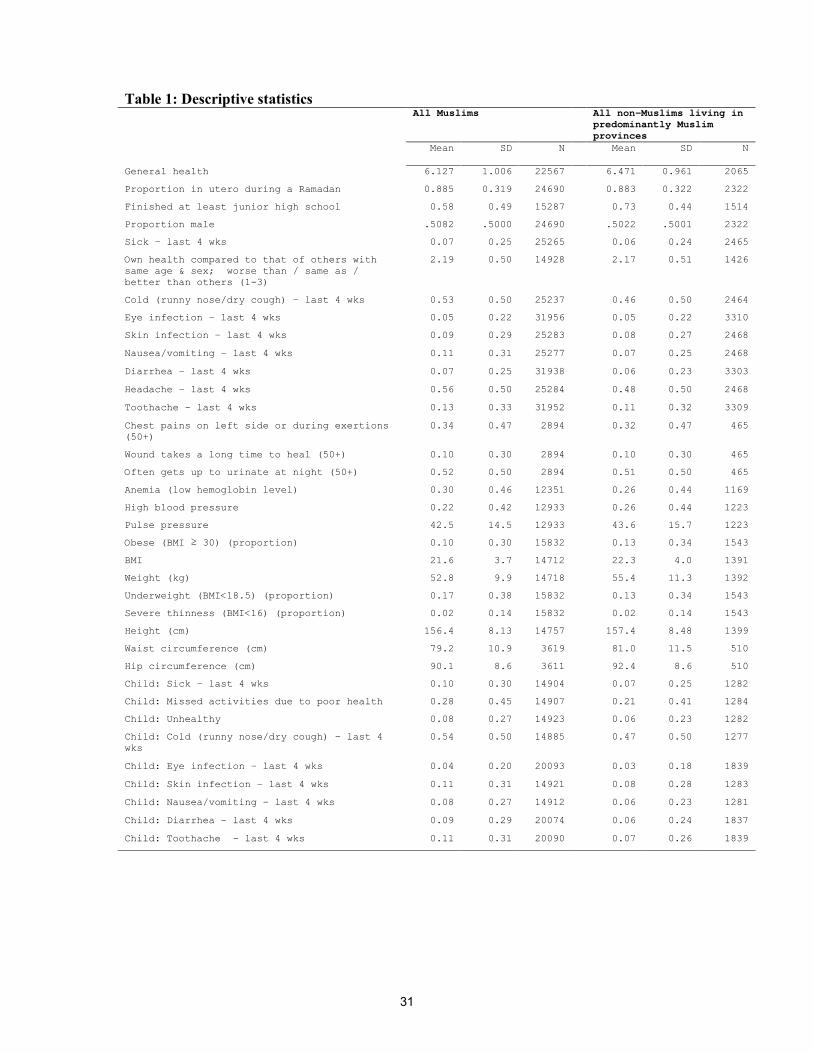
31
Table 1: Descriptive statistics All Muslims All non-Muslims living in
predominantly Muslim provinces
Mean SD N Mean
SD N
General health
6.127 1.006 22567 6.471 0.961 2065
Proportion in utero during a Ramadan
0.885 0.319 24690 0.883 0.322 2322
Finished at least junior high school
0.58 0.49 15287 0.73 0.44 1514
Proportion male
.5082 .5000 24690 .5022 .5001 2322
Sick – last 4 wks
0.07 0.25 25265 0.06 0.24 2465
Own health compared to that of others with same age & sex; worse than / same as / better than others (1-3)
2.19 0.50 14928 2.17 0.51 1426
Cold (runny nose/dry cough) – last 4 wks
0.53 0.50 25237 0.46 0.50 2464
Eye infection – last 4 wks
0.05 0.22 31956 0.05 0.22 3310
Skin infection – last 4 wks
0.09 0.29 25283 0.08 0.27 2468
Nausea/vomiting – last 4 wks
0.11 0.31 25277 0.07 0.25 2468
Diarrhea – last 4 wks
0.07 0.25 31938 0.06 0.23 3303
Headache – last 4 wks
0.56 0.50 25284 0.48 0.50 2468
Toothache – last 4 wks
0.13 0.33 31952 0.11 0.32 3309
Chest pains on left side or during exertions (50+)
0.34 0.47 2894 0.32 0.47 465
Wound takes a long time to heal (50+)
0.10 0.30 2894 0.10 0.30 465
Often gets up to urinate at night (50+)
0.52 0.50 2894 0.51 0.50 465
Anemia (low hemoglobin level)
0.30 0.46 12351 0.26 0.44 1169
High blood pressure
0.22 0.42 12933 0.26 0.44 1223
Pulse pressure
42.5 14.5 12933 43.6 15.7 1223
Obese (BMI ≥ 30) (proportion)
0.10 0.30 15832 0.13 0.34 1543
BMI
21.6 3.7 14712 22.3 4.0 1391
Weight (kg)
52.8 9.9 14718 55.4 11.3 1392
Underweight (BMI<18.5) (proportion)
0.17 0.38 15832 0.13 0.34 1543
Severe thinness (BMI<16) (proportion)
0.02 0.14 15832 0.02 0.14 1543
Height (cm)
156.4 8.13 14757 157.4 8.48 1399
Waist circumference (cm)
79.2 10.9 3619 81.0 11.5 510
Hip circumference (cm)
90.1 8.6 3611 92.4 8.6 510
Child: Sick – last 4 wks
0.10 0.30 14904 0.07 0.25 1282
Child: Missed activities due to poor health
0.28 0.45 14907 0.21 0.41 1284
Child: Unhealthy
0.08 0.27 14923 0.06 0.23 1282
Child: Cold (runny nose/dry cough) – last 4 wks
0.54 0.50 14885 0.47 0.50 1277
Child: Eye infection – last 4 wks
0.04 0.20 20093 0.03 0.18 1839
Child: Skin infection – last 4 wks
0.11 0.31 14921 0.08 0.28 1283
Child: Nausea/vomiting – last 4 wks
0.08 0.27 14912 0.06 0.23 1281
Child: Diarrhea – last 4 wks
0.09 0.29 20074 0.06 0.24 1837
Child: Toothache – last 4 wks
0.11 0.31 20090 0.07 0.26 1839
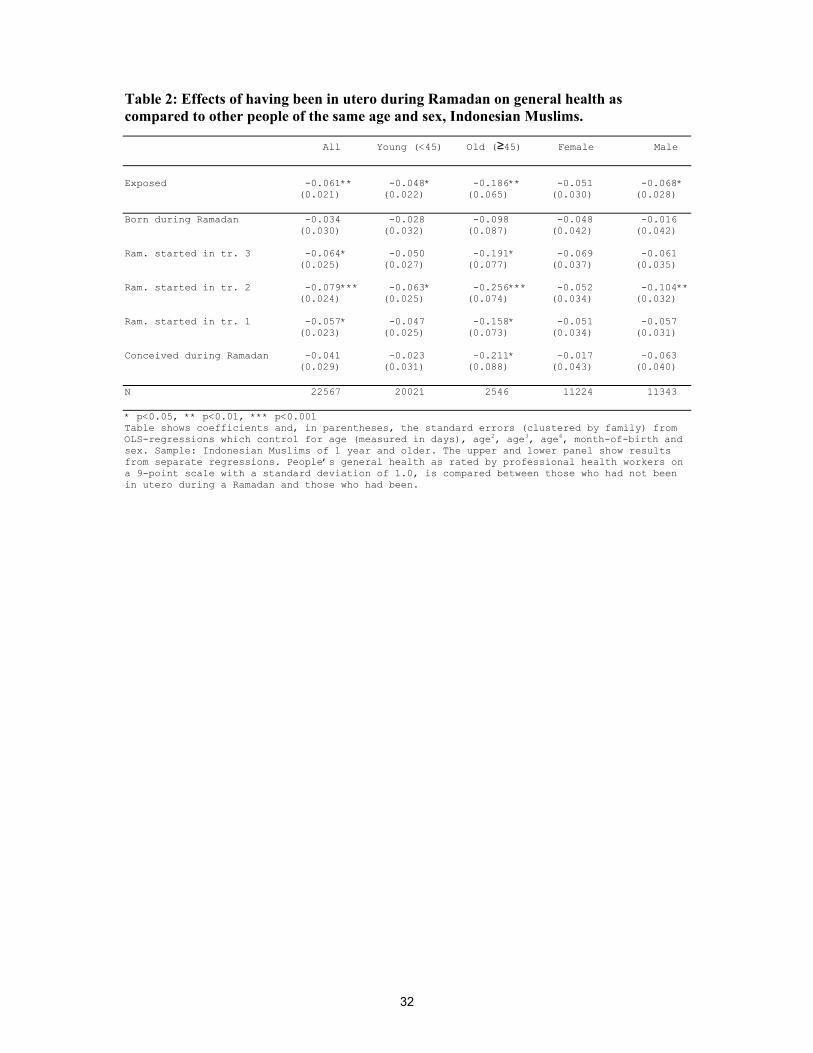
32
Table 2: Effects of having been in utero during Ramadan on general health as compared to other people of the same age and sex, Indonesian Muslims.
All Young (<45) Old (≥45) Female Male Exposed -0.061** -0.048* -0.186** -0.051 -0.068* (0.021) (0.022) (0.065) (0.030) (0.028) Born during Ramadan -0.034 -0.028 -0.098 -0.048 -0.016 (0.030) (0.032) (0.087) (0.042) (0.042) Ram. started in tr. 3 -0.064* -0.050 -0.191* -0.069 -0.061 (0.025) (0.027) (0.077) (0.037) (0.035) Ram. started in tr. 2 -0.079*** -0.063* -0.256*** -0.052 -0.104** (0.024) (0.025) (0.074) (0.034) (0.032) Ram. started in tr. 1 -0.057* -0.047 -0.158* -0.051 -0.057 (0.023) (0.025) (0.073) (0.034) (0.031) Conceived during Ramadan -0.041 -0.023 -0.211* -0.017 -0.063 (0.029) (0.031) (0.088) (0.043) (0.040) N 22567 20021 2546 11224 11343 * p<0.05, ** p<0.01, *** p<0.001 Table shows coefficients and, in parentheses, the standard errors (clustered by family) from OLS-regressions which control for age (measured in days), age2, age3, age4, month-of-birth and sex. Sample: Indonesian Muslims of 1 year and older. The upper and lower panel show results from separate regressions. People’s general health as rated by professional health workers on a 9-point scale with a standard deviation of 1.0, is compared between those who had not been in utero during a Ramadan and those who had been.

33
Table 3: Effects of having been in utero during Ramadan on general health as compared to other people of the same age and sex, Indonesian non-Muslims
Non-Muslims living in Non-Muslims living in a predominantly Muslim- a predominantly non- province Muslim province
Exposed 0.012 0.018 (0.065) (0.037) Born during Ramadan 0.040 0.062 (0.093) (0.047) Ram. started in tr. 3 -0.051 -0.064 (0.083) (0.071) Ram. started in tr. 2 0.028 0.009 (0.072) (0.038) Ram. started in tr. 1 0.022 0.067 (0.074) (0.041) Conceived during Ramadan 0.029 0.026 (0.093) (0.038) N 2065 820 * p<0.05, ** p<0.01, *** p<0.001 Table shows coefficients and, in parentheses, the standard errors (clustered by family) from OLS-regressions which control for age (measured in days), age2, age3, age4, month-of-birth and sex. The upper and lower panel show results from separate regressions. Sample: Indonesian non-Muslims of 1 year and older. The only predominantly non-Muslim province in IFLS is Bali.
Non-Muslims living in Non-Muslims living in a predominantly Muslim- a predominantly non- province Muslim province
Young Old Young Old Exposed -0.007 0.083 0.002 0.178 (0.072) (0.168) (0.033) (0.281) Born during Ramadan 0.004 0.132 0.028 0.718 (0.104) (0.199) (0.043) (0.403) Ram. started in tr. 3 -0.105 0.165 -0.086 0.283 (0.090) (0.216) (0.069) (0.477) Ram. started in tr. 2 0.022 0.054 0.002 -1.213 (0.079) (0.189) (0.033) (0.716) Ram. started in tr. 1 0.010 0.093 0.044 -0.108 (0.082) (0.196) (0.038) (0.324) Conceived during Ramadan 0.045 -0.066 0.032 -0.372 (0.103) (0.239) (0.036) (0.376) N 1685 380 779 41 * p<0.05, ** p<0.01, *** p<0.001 Tables show coefficients and, in parentheses, the standard errors (clustered by family) from OLS-regressions which control for age (measured in days), age2, age3, age4, month-of-birth and sex. The upper and lower panel show results from separate regressions. Sample: Indonesian non-Muslims of 1 year and older. The only predominantly non-Muslim province in IFLS is Bali.

34
Table 4: Comparison of Muslim women whose oldest home-living child between the ages of 1 and 18, was vs. was not exposed to Ramadan during pregnancy. Child exposed Child not exposed p (dif-
ference) Mean SD N Mean SD N Education (junior high school) 0.46 0.50 2486 0.44 0.50 307 0.482 General health 6.09 0.97 2412 6.09 0.94 289 0.991 Stayed in bed due to poor
health at least one day last 4 weeks
0.06 0.24 2420 0.10 0.29 293 0.042*
Number of generally non-severe symptoms last 4 weeks1
1.63 1.26 2420 1.53 1.24 293 0.200
At least one non-severe symptom last 4 weeks1
0.78 0.41 2420 0.75 0.43 293 0.331
High blood pressure 0.21 0.40 2407 0.17 0.38 289 0.181 Low hemoglobin level (anemia) 0.35 0.48 2213 0.37 0.48 275 0.392 Age at giving birth 24.5 5.41 2491 25.1 5.76 307 0.064 Body Mass Index (BMI) 23.3 4.03 2406 23.6 3.96 288 0.208 Height (cm) 151.0 5.29 2411 150.5 5.21 289 0.111 Weight (kg) 53.2 9.69 2406 53.6 9.50 288 0.537 Mother was not exposed to
Ramadan in utero herself 0.90 0.30 2491 0.90 0.30 307 0.973
Own health compared to that of others with same age & sex; worse than / same as / better than others (1-3)
2.16 0.48 2420 2.20 0.48 293 0.239
Lives in urban area 0.56 0.50 2491 0.54 0.50 307 0.478 * = difference significant at p<0.05, ** = p<0.01, *** = p<0.001 1 cold (runny nose/dry cough), eye infection, skin infection, nausea/vomiting, headache, toothache
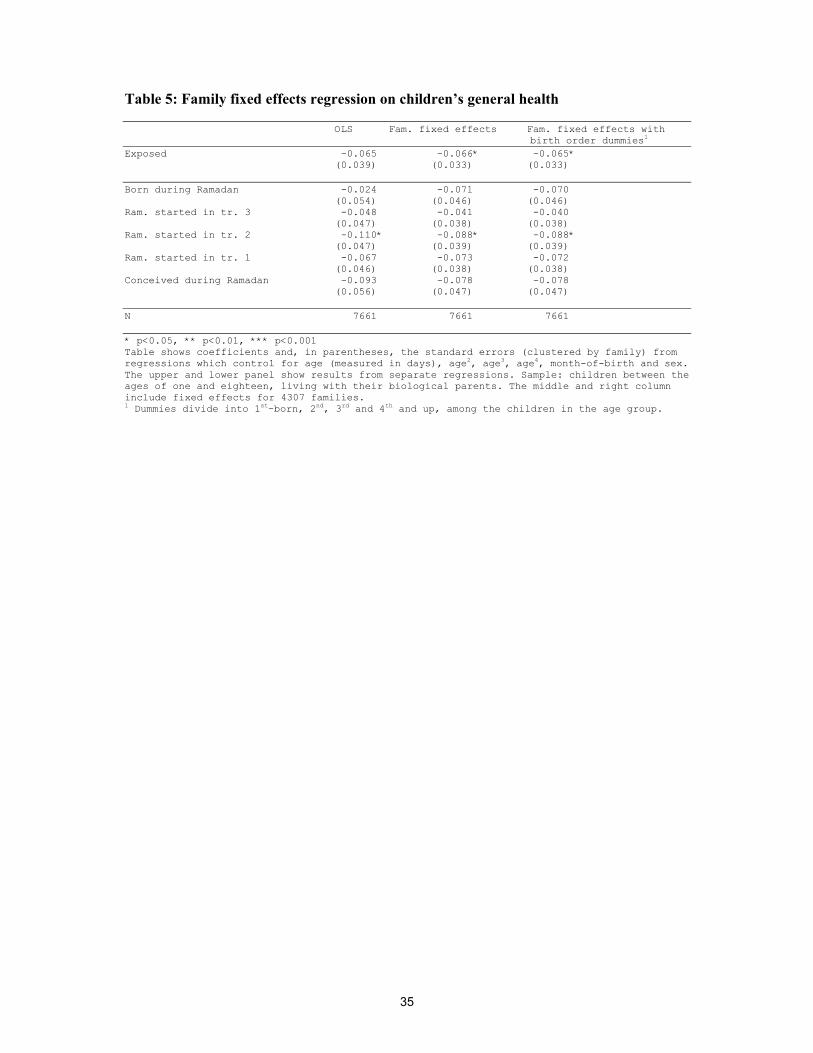
35
Table 5: Family fixed effects regression on children’s general health OLS Fam. fixed effects Fam. fixed effects with birth order dummies1 Exposed -0.065 -0.066* -0.065* (0.039) (0.033) (0.033) Born during Ramadan -0.024 -0.071 -0.070 (0.054) (0.046) (0.046) Ram. started in tr. 3 -0.048 -0.041 -0.040 (0.047) (0.038) (0.038) Ram. started in tr. 2 -0.110* -0.088* -0.088* (0.047) (0.039) (0.039) Ram. started in tr. 1 -0.067 -0.073 -0.072 (0.046) (0.038) (0.038) Conceived during Ramadan -0.093 -0.078 -0.078 (0.056) (0.047) (0.047) N 7661 7661 7661 * p<0.05, ** p<0.01, *** p<0.001 Table shows coefficients and, in parentheses, the standard errors (clustered by family) from regressions which control for age (measured in days), age2, age3, age4, month-of-birth and sex. The upper and lower panel show results from separate regressions. Sample: children between the ages of one and eighteen, living with their biological parents. The middle and right column include fixed effects for 4307 families. 1 Dummies divide into 1st-born, 2nd, 3rd and 4th and up, among the children in the age group.
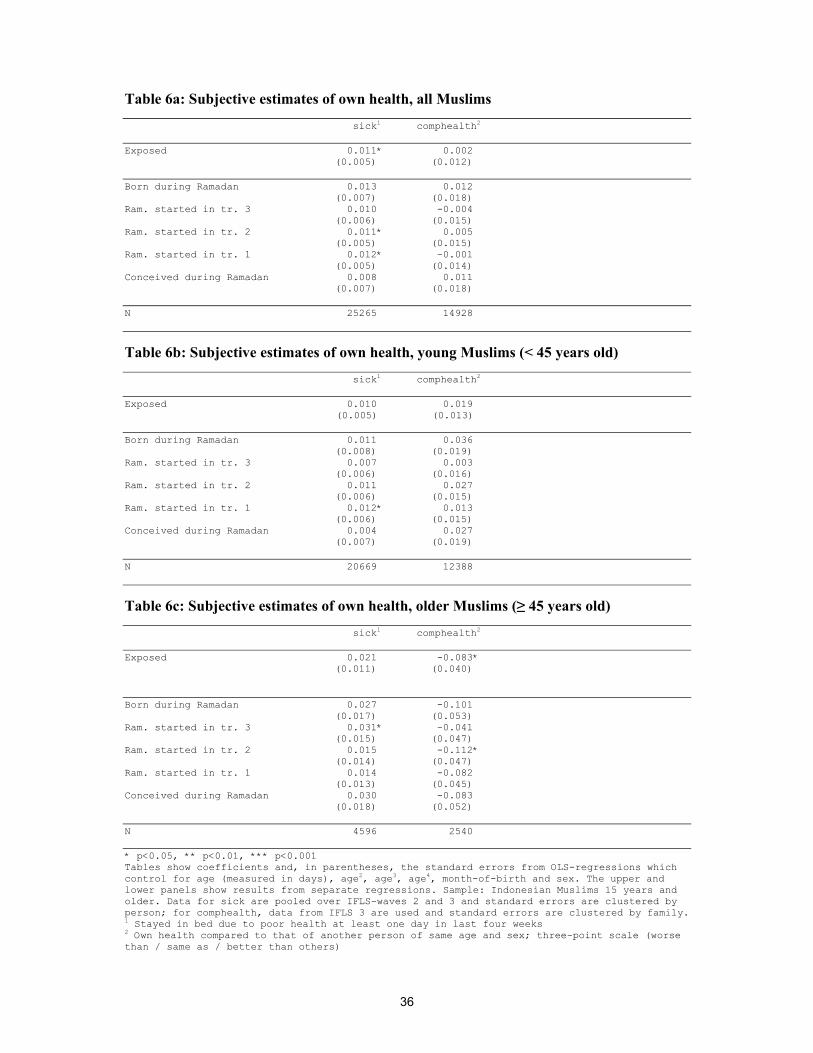
36
Table 6a: Subjective estimates of own health, all Muslims sick1 comphealth2 Exposed 0.011* 0.002 (0.005) (0.012) Born during Ramadan 0.013 0.012 (0.007) (0.018) Ram. started in tr. 3 0.010 -0.004 (0.006) (0.015) Ram. started in tr. 2 0.011* 0.005 (0.005) (0.015) Ram. started in tr. 1 0.012* -0.001 (0.005) (0.014) Conceived during Ramadan 0.008 0.011 (0.007) (0.018) N 25265 14928
Table 6b: Subjective estimates of own health, young Muslims (< 45 years old) sick1 comphealth2 Exposed 0.010 0.019
(0.005) (0.013) Born during Ramadan 0.011 0.036 (0.008) (0.019) Ram. started in tr. 3 0.007 0.003 (0.006) (0.016) Ram. started in tr. 2 0.011 0.027 (0.006) (0.015) Ram. started in tr. 1 0.012* 0.013 (0.006) (0.015) Conceived during Ramadan 0.004 0.027 (0.007) (0.019) N 20669 12388
Table 6c: Subjective estimates of own health, older Muslims (≥ 45 years old) sick1 comphealth2 Exposed 0.021 -0.083* (0.011) (0.040) Born during Ramadan 0.027 -0.101 (0.017) (0.053) Ram. started in tr. 3 0.031* -0.041 (0.015) (0.047) Ram. started in tr. 2 0.015 -0.112* (0.014) (0.047) Ram. started in tr. 1 0.014 -0.082 (0.013) (0.045) Conceived during Ramadan 0.030 -0.083 (0.018) (0.052) N 4596 2540 * p<0.05, ** p<0.01, *** p<0.001 Tables show coefficients and, in parentheses, the standard errors from OLS-regressions which control for age (measured in days), age2, age3, age4, month-of-birth and sex. The upper and lower panels show results from separate regressions. Sample: Indonesian Muslims 15 years and older. Data for sick are pooled over IFLS-waves 2 and 3 and standard errors are clustered by person; for comphealth, data from IFLS 3 are used and standard errors are clustered by family. 1 Stayed in bed due to poor health at least one day in last four weeks 2 Own health compared to that of another person of same age and sex; three-point scale (worse than / same as / better than others)
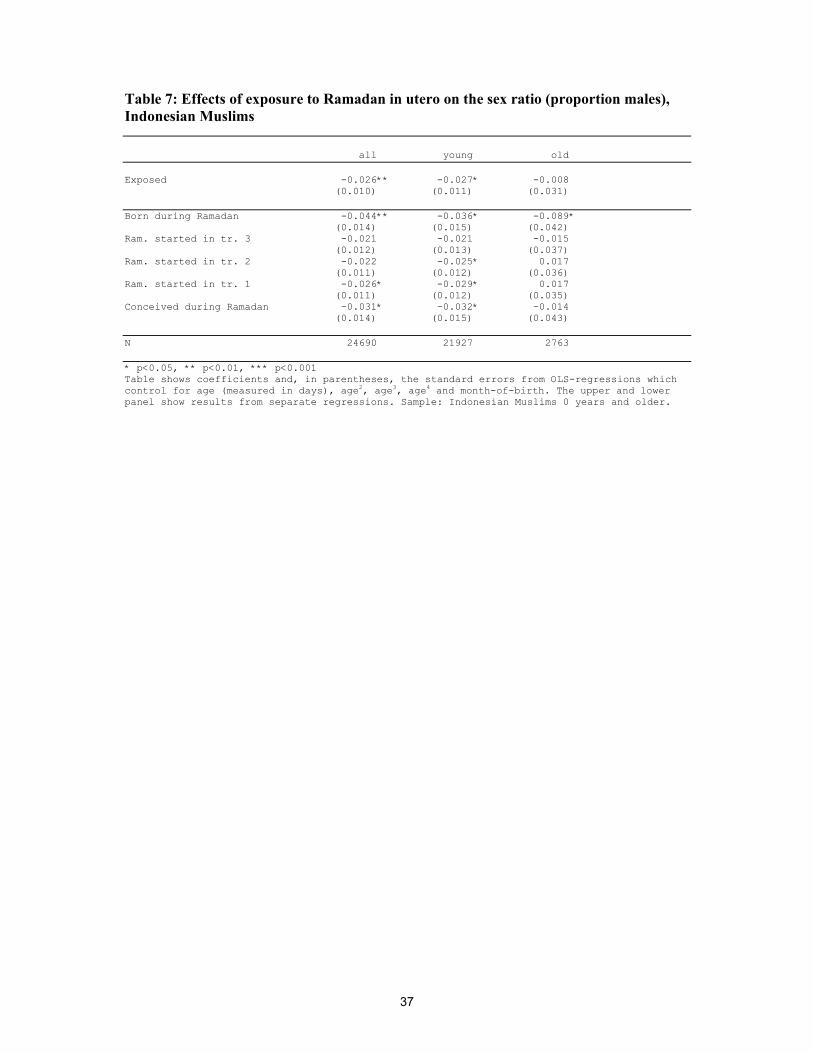
37
Table 7: Effects of exposure to Ramadan in utero on the sex ratio (proportion males), Indonesian Muslims all young old Exposed -0.026** -0.027* -0.008 (0.010) (0.011) (0.031) Born during Ramadan -0.044** -0.036* -0.089* (0.014) (0.015) (0.042) Ram. started in tr. 3 -0.021 -0.021 -0.015 (0.012) (0.013) (0.037) Ram. started in tr. 2 -0.022 -0.025* 0.017 (0.011) (0.012) (0.036) Ram. started in tr. 1 -0.026* -0.029* 0.017 (0.011) (0.012) (0.035) Conceived during Ramadan -0.031* -0.032* -0.014 (0.014) (0.015) (0.043) N 24690 21927 2763 * p<0.05, ** p<0.01, *** p<0.001 Table shows coefficients and, in parentheses, the standard errors from OLS-regressions which control for age (measured in days), age2, age3, age4 and month-of-birth. The upper and lower panel show results from separate regressions. Sample: Indonesian Muslims 0 years and older.
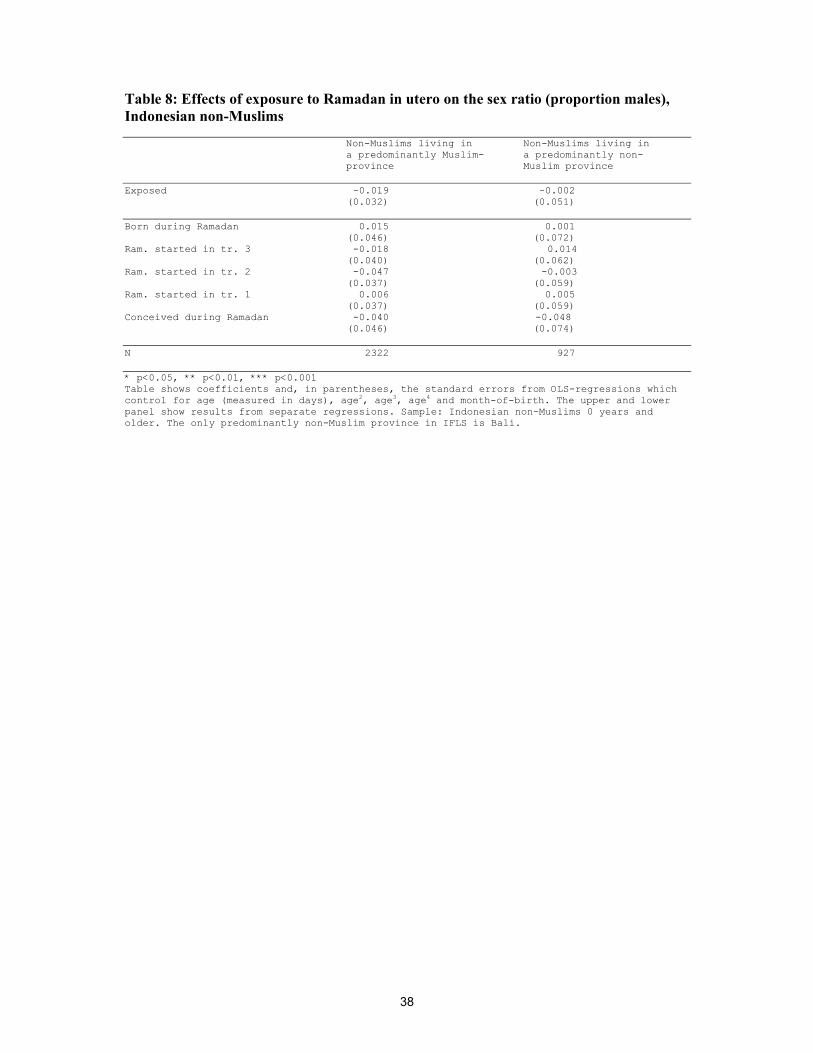
38
Table 8: Effects of exposure to Ramadan in utero on the sex ratio (proportion males), Indonesian non-Muslims
Non-Muslims living in Non-Muslims living in a predominantly Muslim- a predominantly non- province Muslim province
Exposed -0.019 -0.002 (0.032) (0.051) Born during Ramadan 0.015 0.001 (0.046) (0.072) Ram. started in tr. 3 -0.018 0.014 (0.040) (0.062) Ram. started in tr. 2 -0.047 -0.003 (0.037) (0.059) Ram. started in tr. 1 0.006 0.005 (0.037) (0.059) Conceived during Ramadan -0.040 -0.048 (0.046) (0.074) N 2322 927 * p<0.05, ** p<0.01, *** p<0.001 Table shows coefficients and, in parentheses, the standard errors from OLS-regressions which control for age (measured in days), age2, age3, age4 and month-of-birth. The upper and lower panel show results from separate regressions. Sample: Indonesian non-Muslims 0 years and older. The only predominantly non-Muslim province in IFLS is Bali.
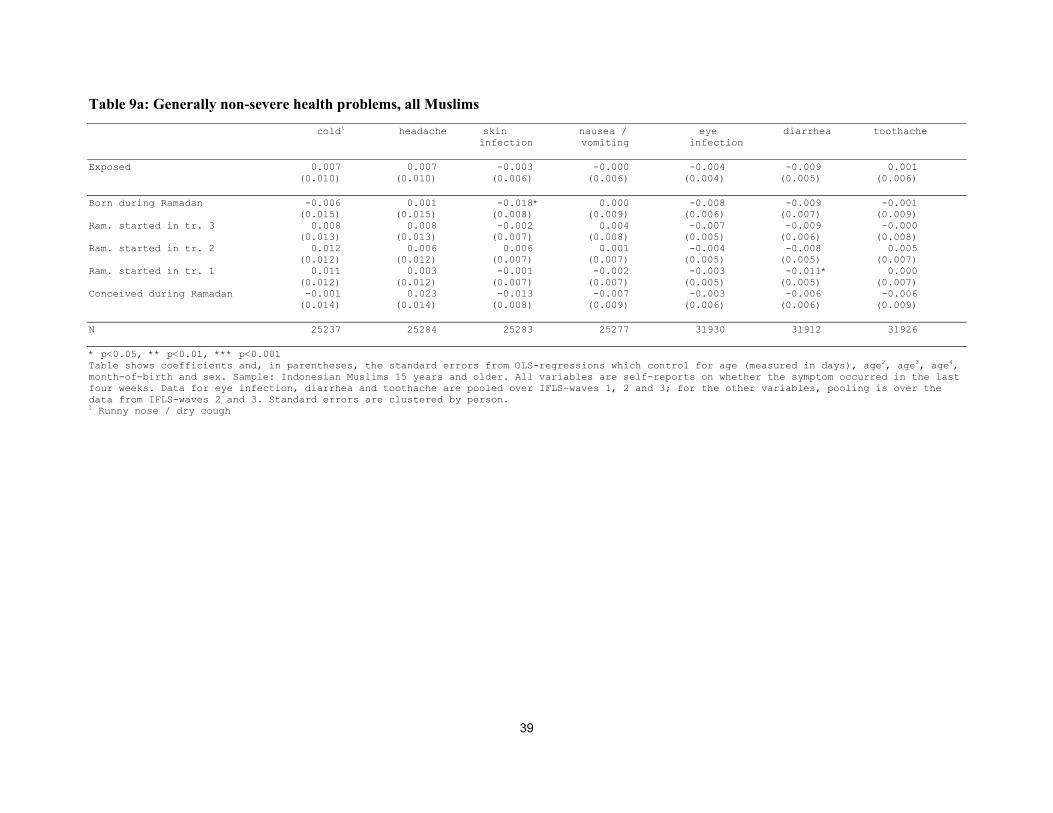
39
Table 9a: Generally non-severe health problems, all Muslims cold1 headache skin nausea / eye diarrhea toothache infection vomiting infection Exposed 0.007 0.007 -0.003 -0.000 -0.004 -0.009 0.001 (0.010) (0.010) (0.006) (0.006) (0.004) (0.005) (0.006) Born during Ramadan -0.006 0.001 -0.018* 0.000 -0.008 -0.009 -0.001 (0.015) (0.015) (0.008) (0.009) (0.006) (0.007) (0.009) Ram. started in tr. 3 0.008 0.008 -0.002 0.004 -0.007 -0.009 -0.000 (0.013) (0.013) (0.007) (0.008) (0.005) (0.006) (0.008) Ram. started in tr. 2 0.012 0.006 0.006 0.001 -0.004 -0.008 0.005 (0.012) (0.012) (0.007) (0.007) (0.005) (0.005) (0.007) Ram. started in tr. 1 0.011 0.003 -0.001 -0.002 -0.003 -0.011* 0.000 (0.012) (0.012) (0.007) (0.007) (0.005) (0.005) (0.007) Conceived during Ramadan -0.001 0.023 -0.013 -0.007 -0.003 -0.006 -0.006 (0.014) (0.014) (0.008) (0.009) (0.006) (0.006) (0.009) N 25237 25284 25283 25277 31930 31912 31926 * p<0.05, ** p<0.01, *** p<0.001 Table shows coefficients and, in parentheses, the standard errors from OLS-regressions which control for age (measured in days), age2, age3, age4, month-of-birth and sex. Sample: Indonesian Muslims 15 years and older. All variables are self-reports on whether the symptom occurred in the last four weeks. Data for eye infection, diarrhea and toothache are pooled over IFLS-waves 1, 2 and 3; for the other variables, pooling is over the data from IFLS-waves 2 and 3. Standard errors are clustered by person. 1 Runny nose / dry cough
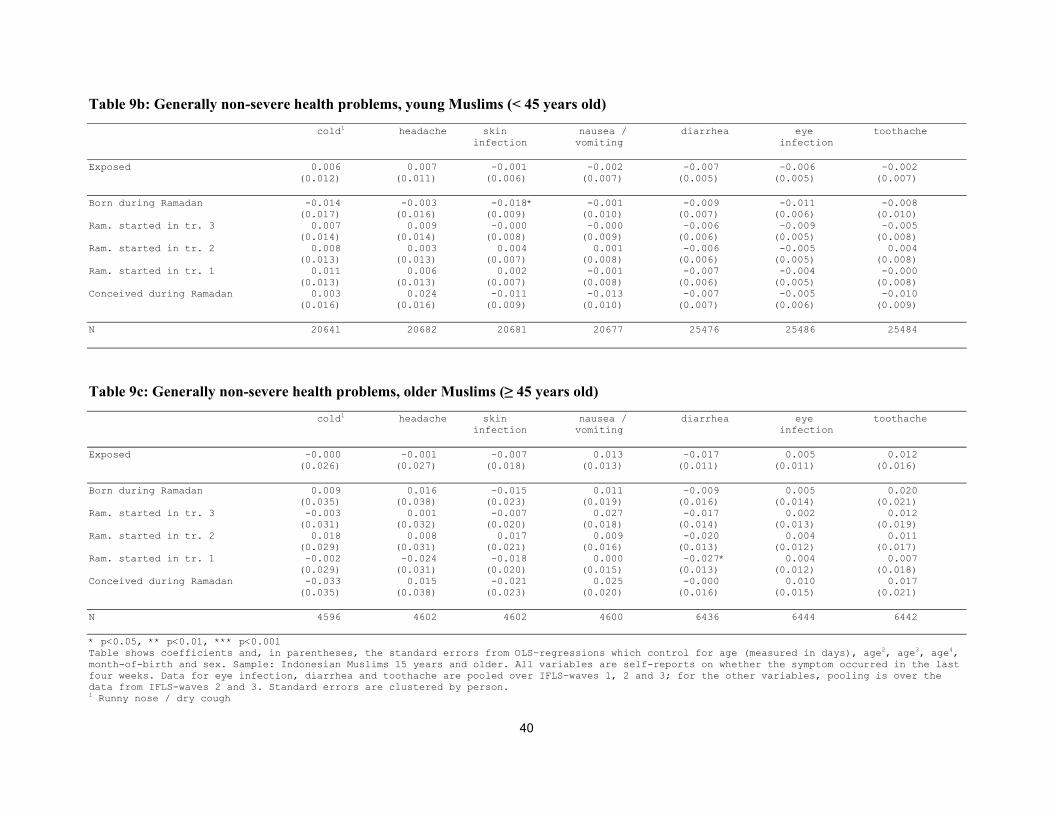
40
Table 9b: Generally non-severe health problems, young Muslims (< 45 years old) cold1 headache skin nausea / diarrhea eye toothache infection vomiting infection Exposed 0.006 0.007 -0.001 -0.002 -0.007 -0.006 -0.002 (0.012) (0.011) (0.006) (0.007) (0.005) (0.005) (0.007) Born during Ramadan -0.014 -0.003 -0.018* -0.001 -0.009 -0.011 -0.008 (0.017) (0.016) (0.009) (0.010) (0.007) (0.006) (0.010) Ram. started in tr. 3 0.007 0.009 -0.000 -0.000 -0.006 -0.009 -0.005 (0.014) (0.014) (0.008) (0.009) (0.006) (0.005) (0.008) Ram. started in tr. 2 0.008 0.003 0.004 0.001 -0.006 -0.005 0.004 (0.013) (0.013) (0.007) (0.008) (0.006) (0.005) (0.008) Ram. started in tr. 1 0.011 0.006 0.002 -0.001 -0.007 -0.004 -0.000 (0.013) (0.013) (0.007) (0.008) (0.006) (0.005) (0.008) Conceived during Ramadan 0.003 0.024 -0.011 -0.013 -0.007 -0.005 -0.010 (0.016) (0.016) (0.009) (0.010) (0.007) (0.006) (0.009) N 20641 20682 20681 20677 25476 25486 25484
Table 9c: Generally non-severe health problems, older Muslims (≥ 45 years old) cold1 headache skin nausea / diarrhea eye toothache infection vomiting infection Exposed -0.000 -0.001 -0.007 0.013 -0.017 0.005 0.012 (0.026) (0.027) (0.018) (0.013) (0.011) (0.011) (0.016) Born during Ramadan 0.009 0.016 -0.015 0.011 -0.009 0.005 0.020 (0.035) (0.038) (0.023) (0.019) (0.016) (0.014) (0.021) Ram. started in tr. 3 -0.003 0.001 -0.007 0.027 -0.017 0.002 0.012 (0.031) (0.032) (0.020) (0.018) (0.014) (0.013) (0.019) Ram. started in tr. 2 0.018 0.008 0.017 0.009 -0.020 0.004 0.011 (0.029) (0.031) (0.021) (0.016) (0.013) (0.012) (0.017) Ram. started in tr. 1 -0.002 -0.024 -0.018 0.000 -0.027* 0.004 0.007 (0.029) (0.031) (0.020) (0.015) (0.013) (0.012) (0.018) Conceived during Ramadan -0.033 0.015 -0.021 0.025 -0.000 0.010 0.017 (0.035) (0.038) (0.023) (0.020) (0.016) (0.015) (0.021) N 4596 4602 4602 4600 6436 6444 6442 * p<0.05, ** p<0.01, *** p<0.001 Table shows coefficients and, in parentheses, the standard errors from OLS-regressions which control for age (measured in days), age2, age3, age4, month-of-birth and sex. Sample: Indonesian Muslims 15 years and older. All variables are self-reports on whether the symptom occurred in the last four weeks. Data for eye infection, diarrhea and toothache are pooled over IFLS-waves 1, 2 and 3; for the other variables, pooling is over the data from IFLS-waves 2 and 3. Standard errors are clustered by person. 1 Runny nose / dry cough
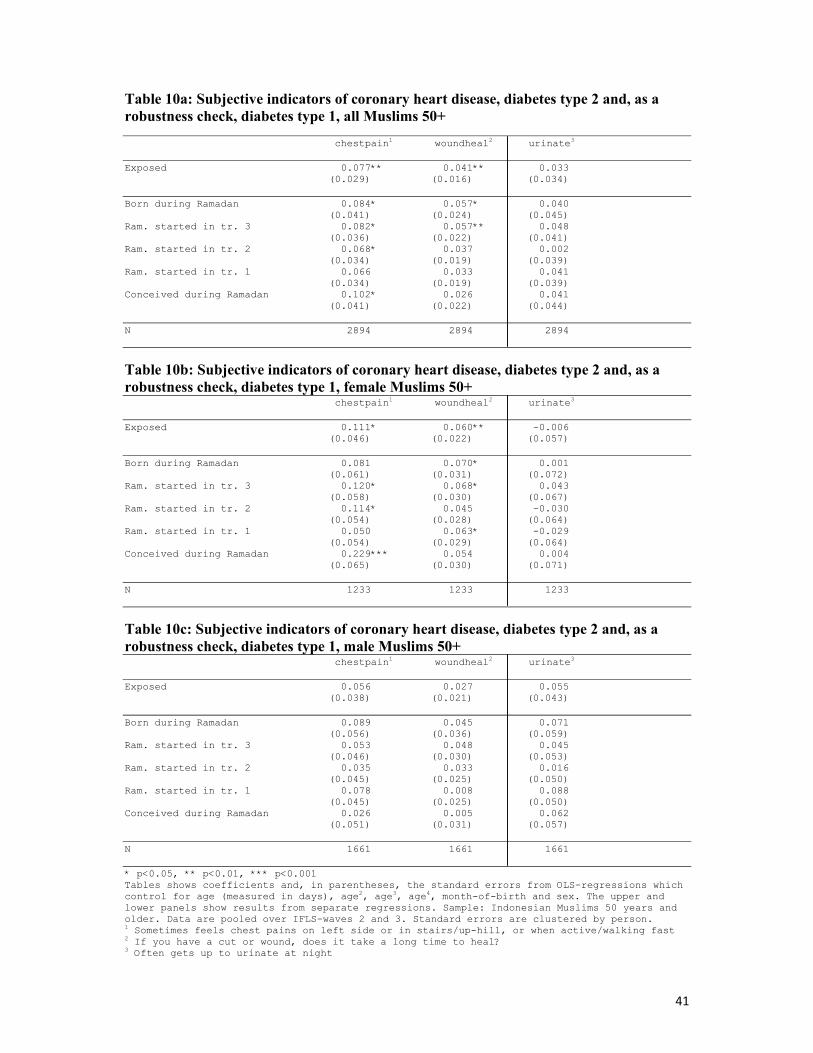
41
Table 10a: Subjective indicators of coronary heart disease, diabetes type 2 and, as a robustness check, diabetes type 1, all Muslims 50+ chestpain1 woundheal2 urinate3 Exposed 0.077** 0.041** 0.033 (0.029) (0.016) (0.034) Born during Ramadan 0.084* 0.057* 0.040 (0.041) (0.024) (0.045) Ram. started in tr. 3 0.082* 0.057** 0.048 (0.036) (0.022) (0.041) Ram. started in tr. 2 0.068* 0.037 0.002 (0.034) (0.019) (0.039) Ram. started in tr. 1 0.066 0.033 0.041 (0.034) (0.019) (0.039) Conceived during Ramadan 0.102* 0.026 0.041 (0.041) (0.022) (0.044) N 2894 2894 2894
Table 10b: Subjective indicators of coronary heart disease, diabetes type 2 and, as a robustness check, diabetes type 1, female Muslims 50+ chestpain1 woundheal2 urinate3 Exposed 0.111* 0.060** -0.006 (0.046) (0.022) (0.057) Born during Ramadan 0.081 0.070* 0.001 (0.061) (0.031) (0.072) Ram. started in tr. 3 0.120* 0.068* 0.043 (0.058) (0.030) (0.067) Ram. started in tr. 2 0.114* 0.045 -0.030 (0.054) (0.028) (0.064) Ram. started in tr. 1 0.050 0.063* -0.029 (0.054) (0.029) (0.064) Conceived during Ramadan 0.229*** 0.054 0.004 (0.065) (0.030) (0.071) N 1233 1233 1233
Table 10c: Subjective indicators of coronary heart disease, diabetes type 2 and, as a robustness check, diabetes type 1, male Muslims 50+ chestpain1 woundheal2 urinate3 Exposed 0.056 0.027 0.055 (0.038) (0.021) (0.043) Born during Ramadan 0.089 0.045 0.071 (0.056) (0.036) (0.059) Ram. started in tr. 3 0.053 0.048 0.045 (0.046) (0.030) (0.053) Ram. started in tr. 2 0.035 0.033 0.016 (0.045) (0.025) (0.050) Ram. started in tr. 1 0.078 0.008 0.088 (0.045) (0.025) (0.050) Conceived during Ramadan 0.026 0.005 0.062 (0.051) (0.031) (0.057) N 1661 1661 1661 * p<0.05, ** p<0.01, *** p<0.001 Tables shows coefficients and, in parentheses, the standard errors from OLS-regressions which control for age (measured in days), age2, age3, age4, month-of-birth and sex. The upper and lower panels show results from separate regressions. Sample: Indonesian Muslims 50 years and older. Data are pooled over IFLS-waves 2 and 3. Standard errors are clustered by person. 1 Sometimes feels chest pains on left side or in stairs/up-hill, or when active/walking fast 2 If you have a cut or wound, does it take a long time to heal? 3 Often gets up to urinate at night
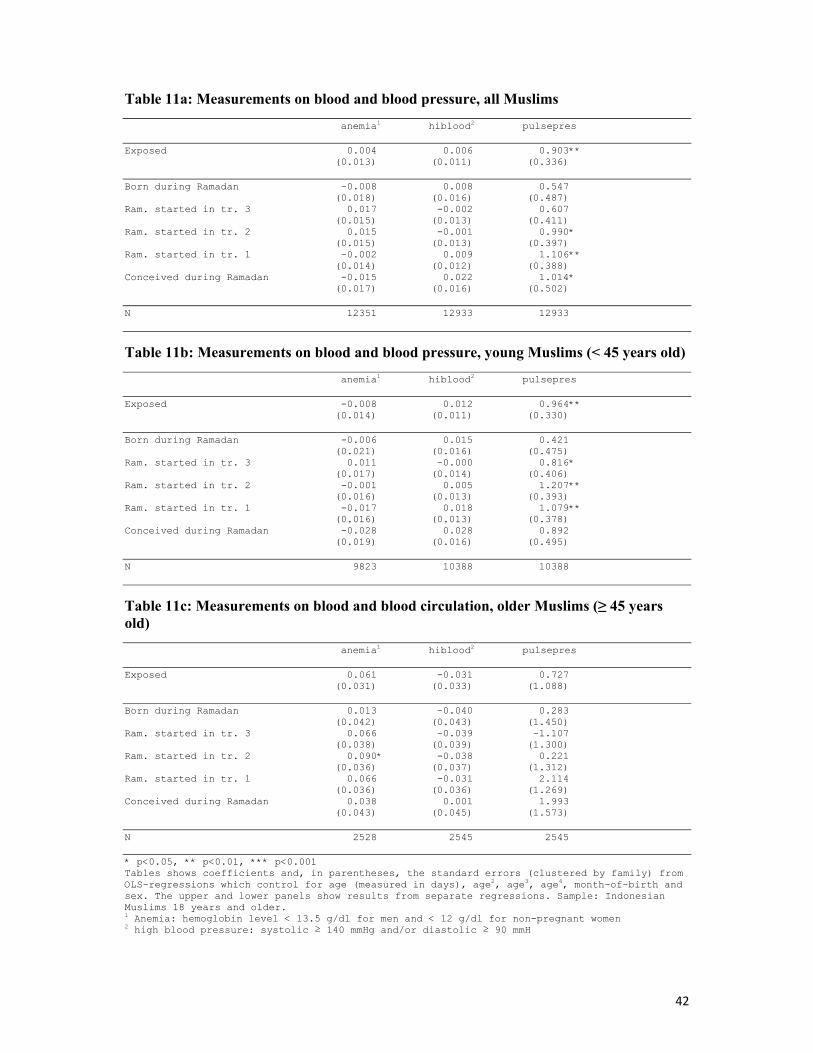
42
Table 11a: Measurements on blood and blood pressure, all Muslims anemia1 hiblood2 pulsepres Exposed 0.004 0.006 0.903** (0.013) (0.011) (0.336) Born during Ramadan -0.008 0.008 0.547 (0.018) (0.016) (0.487) Ram. started in tr. 3 0.017 -0.002 0.607 (0.015) (0.013) (0.411) Ram. started in tr. 2 0.015 -0.001 0.990* (0.015) (0.013) (0.397) Ram. started in tr. 1 -0.002 0.009 1.106** (0.014) (0.012) (0.388) Conceived during Ramadan -0.015 0.022 1.014* (0.017) (0.016) (0.502) N 12351 12933 12933
Table 11b: Measurements on blood and blood pressure, young Muslims (< 45 years old) anemia1 hiblood2 pulsepres Exposed -0.008 0.012 0.964** (0.014) (0.011) (0.330) Born during Ramadan -0.006 0.015 0.421 (0.021) (0.016) (0.475) Ram. started in tr. 3 0.011 -0.000 0.816* (0.017) (0.014) (0.406) Ram. started in tr. 2 -0.001 0.005 1.207** (0.016) (0.013) (0.393) Ram. started in tr. 1 -0.017 0.018 1.079** (0.016) (0.013) (0.378) Conceived during Ramadan -0.028 0.028 0.892 (0.019) (0.016) (0.495) N 9823 10388 10388
Table 11c: Measurements on blood and blood circulation, older Muslims (≥ 45 years old) anemia1 hiblood2 pulsepres Exposed 0.061 -0.031 0.727 (0.031) (0.033) (1.088) Born during Ramadan 0.013 -0.040 0.283 (0.042) (0.043) (1.450) Ram. started in tr. 3 0.066 -0.039 -1.107 (0.038) (0.039) (1.300) Ram. started in tr. 2 0.090* -0.038 0.221 (0.036) (0.037) (1.312) Ram. started in tr. 1 0.066 -0.031 2.114 (0.036) (0.036) (1.269) Conceived during Ramadan 0.038 0.001 1.993 (0.043) (0.045) (1.573) N 2528 2545 2545 * p<0.05, ** p<0.01, *** p<0.001 Tables shows coefficients and, in parentheses, the standard errors (clustered by family) from OLS-regressions which control for age (measured in days), age2, age3, age4, month-of-birth and sex. The upper and lower panels show results from separate regressions. Sample: Indonesian Muslims 18 years and older. 1 Anemia: hemoglobin level < 13.5 g/dl for men and < 12 g/dl for non-pregnant women 2 high blood pressure: systolic ≥ 140 mmHg and/or diastolic ≥ 90 mmH
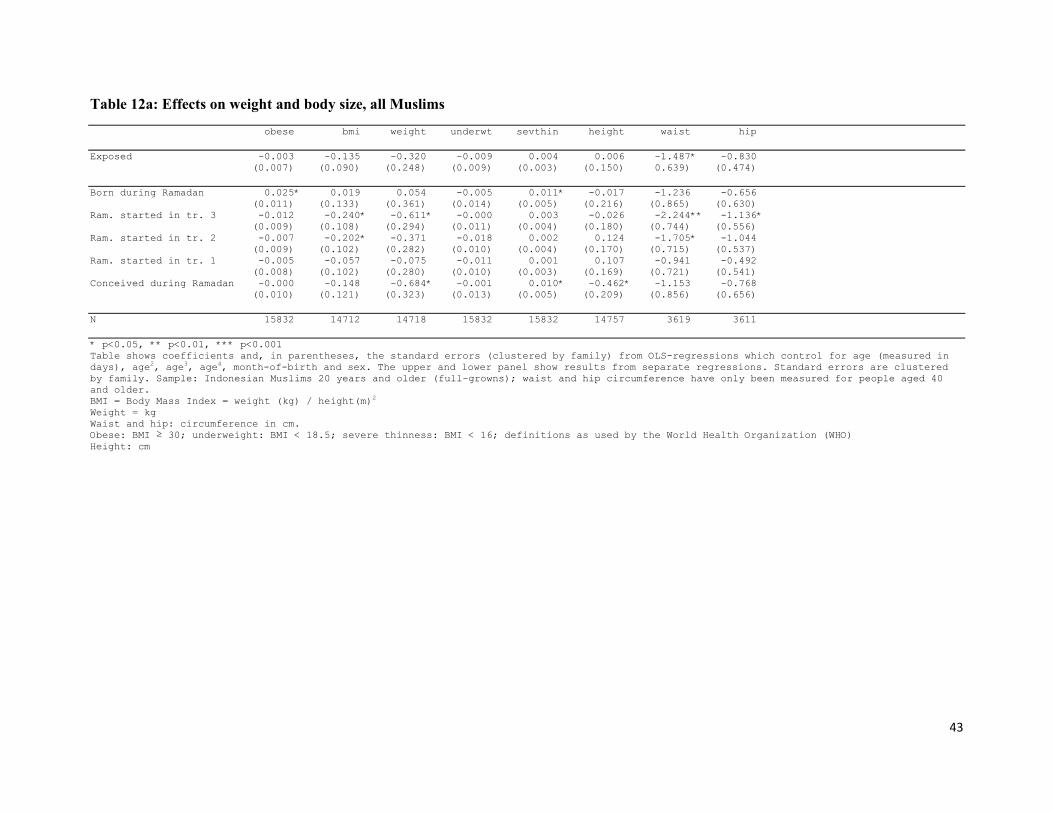
43
Table 12a: Effects on weight and body size, all Muslims obese bmi weight underwt sevthin height waist hip Exposed -0.003 -0.135 -0.320 -0.009 0.004 0.006 -1.487* -0.830 (0.007) (0.090) (0.248) (0.009) (0.003) (0.150) 0.639) (0.474) Born during Ramadan 0.025* 0.019 0.054 -0.005 0.011* -0.017 -1.236 -0.656 (0.011) (0.133) (0.361) (0.014) (0.005) (0.216) (0.865) (0.630) Ram. started in tr. 3 -0.012 -0.240* -0.611* -0.000 0.003 -0.026 -2.244** -1.136* (0.009) (0.108) (0.294) (0.011) (0.004) (0.180) (0.744) (0.556) Ram. started in tr. 2 -0.007 -0.202* -0.371 -0.018 0.002 0.124 -1.705* -1.044 (0.009) (0.102) (0.282) (0.010) (0.004) (0.170) (0.715) (0.537) Ram. started in tr. 1 -0.005 -0.057 -0.075 -0.011 0.001 0.107 -0.941 -0.492 (0.008) (0.102) (0.280) (0.010) (0.003) (0.169) (0.721) (0.541) Conceived during Ramadan -0.000 -0.148 -0.684* -0.001 0.010* -0.462* -1.153 -0.768 (0.010) (0.121) (0.323) (0.013) (0.005) (0.209) (0.856) (0.656) N 15832 14712 14718 15832 15832 14757 3619 3611 * p<0.05, ** p<0.01, *** p<0.001 Table shows coefficients and, in parentheses, the standard errors (clustered by family) from OLS-regressions which control for age (measured in days), age2, age3, age4, month-of-birth and sex. The upper and lower panel show results from separate regressions. Standard errors are clustered by family. Sample: Indonesian Muslims 20 years and older (full-growns); waist and hip circumference have only been measured for people aged 40 and older. BMI = Body Mass Index = weight (kg) / height(m)2
Weight = kg Waist and hip: circumference in cm. Obese: BMI ≥ 30; underweight: BMI < 18.5; severe thinness: BMI < 16; definitions as used by the World Health Organization (WHO) Height: cm
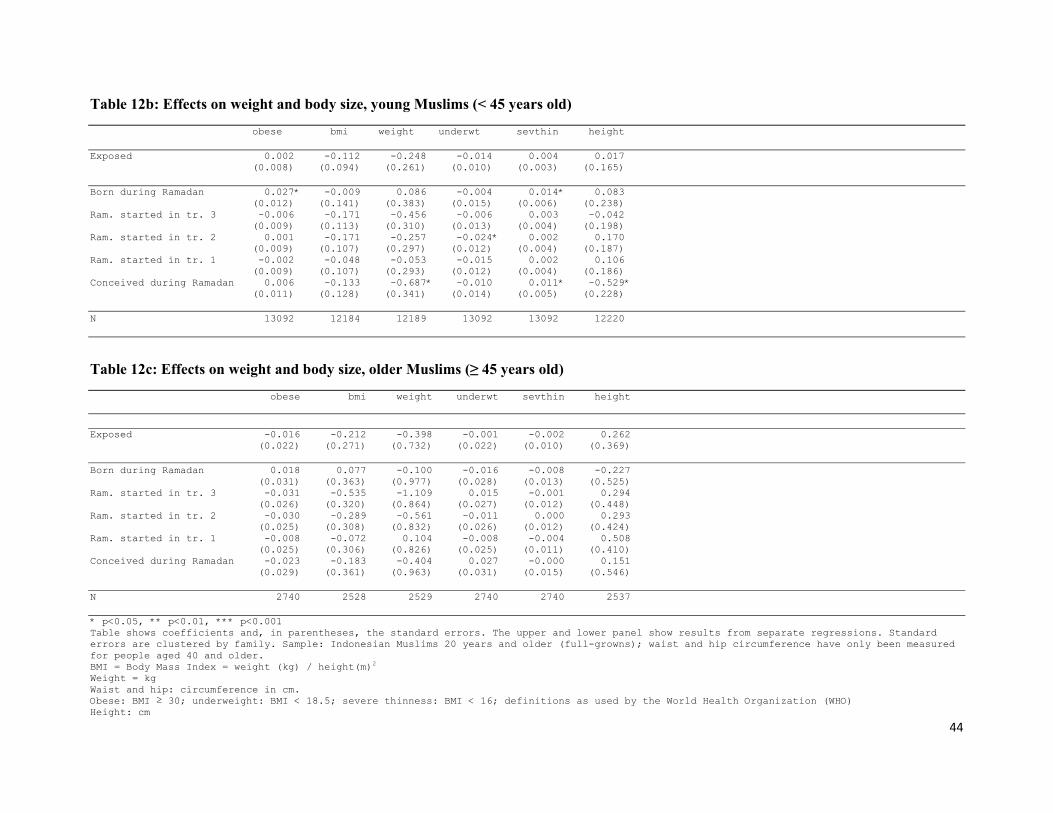
44
Table 12b: Effects on weight and body size, young Muslims (< 45 years old) obese bmi weight underwt sevthin height Exposed 0.002 -0.112 -0.248 -0.014 0.004 0.017 (0.008) (0.094) (0.261) (0.010) (0.003) (0.165) Born during Ramadan 0.027* -0.009 0.086 -0.004 0.014* 0.083 (0.012) (0.141) (0.383) (0.015) (0.006) (0.238) Ram. started in tr. 3 -0.006 -0.171 -0.456 -0.006 0.003 -0.042 (0.009) (0.113) (0.310) (0.013) (0.004) (0.198) Ram. started in tr. 2 0.001 -0.171 -0.257 -0.024* 0.002 0.170 (0.009) (0.107) (0.297) (0.012) (0.004) (0.187) Ram. started in tr. 1 -0.002 -0.048 -0.053 -0.015 0.002 0.106 (0.009) (0.107) (0.293) (0.012) (0.004) (0.186) Conceived during Ramadan 0.006 -0.133 -0.687* -0.010 0.011* -0.529* (0.011) (0.128) (0.341) (0.014) (0.005) (0.228) N 13092 12184 12189 13092 13092 12220
Table 12c: Effects on weight and body size, older Muslims (≥ 45 years old) obese bmi weight underwt sevthin height Exposed -0.016 -0.212 -0.398 -0.001 -0.002 0.262 (0.022) (0.271) (0.732) (0.022) (0.010) (0.369) Born during Ramadan 0.018 0.077 -0.100 -0.016 -0.008 -0.227 (0.031) (0.363) (0.977) (0.028) (0.013) (0.525) Ram. started in tr. 3 -0.031 -0.535 -1.109 0.015 -0.001 0.294 (0.026) (0.320) (0.864) (0.027) (0.012) (0.448) Ram. started in tr. 2 -0.030 -0.289 -0.561 -0.011 0.000 0.293 (0.025) (0.308) (0.832) (0.026) (0.012) (0.424) Ram. started in tr. 1 -0.008 -0.072 0.104 -0.008 -0.004 0.508 (0.025) (0.306) (0.826) (0.025) (0.011) (0.410) Conceived during Ramadan -0.023 -0.183 -0.404 0.027 -0.000 0.151 (0.029) (0.361) (0.963) (0.031) (0.015) (0.546) N 2740 2528 2529 2740 2740 2537 * p<0.05, ** p<0.01, *** p<0.001 Table shows coefficients and, in parentheses, the standard errors. The upper and lower panel show results from separate regressions. Standard errors are clustered by family. Sample: Indonesian Muslims 20 years and older (full-growns); waist and hip circumference have only been measured for people aged 40 and older. BMI = Body Mass Index = weight (kg) / height(m)2
Weight = kg Waist and hip: circumference in cm. Obese: BMI ≥ 30; underweight: BMI < 18.5; severe thinness: BMI < 16; definitions as used by the World Health Organization (WHO) Height: cm

45
Table 13: Health of children aged 1 – 15, all Muslims sick1 daymis2 unhealthy3 cold4 skin nausea / eye diarrhea toothache infection vomiting infection Exposed 0.009 -0.004 0.011 -0.008 0.004 0.003 -0.004 -0.001 0.001 (0.008) (0.013) (0.007) (0.015) (0.009) (0.008) (0.005) (0.007) (0.008) Born during Ramadan -0.002 -0.014 0.007 -0.024 0.000 0.002 -0.003 -0.012 0.002 (0.011) (0.017) (0.010) (0.020) (0.012) (0.010) (0.007) (0.009) (0.011) Ram. started in tr. 3 -0.002 -0.018 0.003 -0.015 -0.001 0.003 -0.009 0.001 -0.006 (0.010) (0.016) (0.009) (0.017) (0.011) (0.009) (0.006) (0.009) (0.009) Ram. started in tr. 2 0.004 -0.010 0.007 -0.013 0.012 0.004 -0.001 0.012 0.004 (0.011) (0.016) (0.009) (0.018) (0.011) (0.010) (0.006) (0.009) (0.009) Ram. started in tr. 1 0.012 0.001 0.016 -0.011 0.007 0.003 0.002 0.004 -0.004 (0.010) (0.016) (0.009) (0.018) (0.011) (0.010) (0.006) (0.009) (0.009) Conceived during Ramadan 0.036** 0.024 0.023* 0.025 0.010 0.003 -0.004 -0.002 0.015 (0.013) (0.018) (0.010) (0.020) (0.013) (0.011) (0.007) (0.010) (0.011) N 14904 14907 14923 14885 14921 14912 20078 20059 20075 * p<0.05, ** p<0.01, *** p<0.001 Table shows coefficients and, in parentheses, the standard errors. The upper and lower panel show results from separate regressions. Sample: Indonesian Muslims aged 1 – 15. Data for eye infection, diarrhea and toothache are pooled over IFLS-waves 1, 2 and 3; for the other variables, pooling is over the data from IFLS-waves 2 and 3. All symptoms refer to occurrence in the last four weeks. Standard errors are clustered by person. 1 Stayed in bed due to poor health at least one day last 4 weeks 2 Missed activities due to poor health at least one day last 4 weeks 3 Parent says child is in general (somewhat) unhealthy 4 Runny nose / dry cough
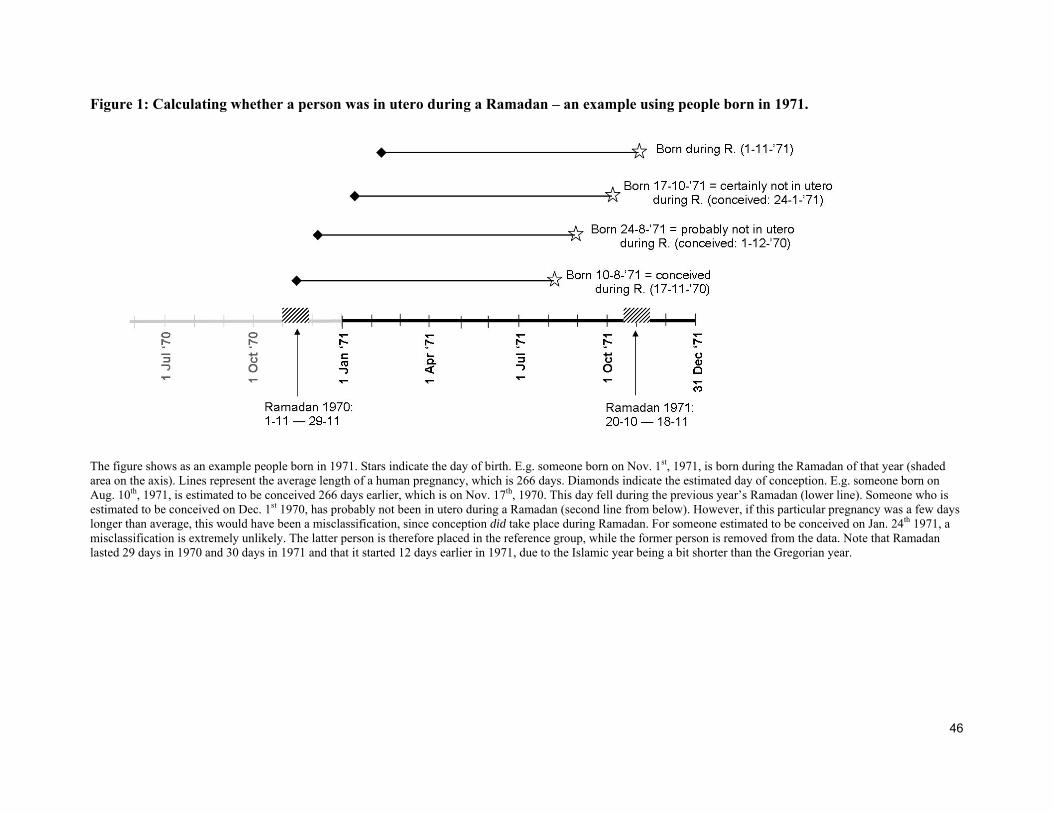
46
Figure 1: Calculating whether a person was in utero during a Ramadan – an example using people born in 1971.
The figure shows as an example people born in 1971. Stars indicate the day of birth. E.g. someone born on Nov. 1st, 1971, is born during the Ramadan of that year (shaded area on the axis). Lines represent the average length of a human pregnancy, which is 266 days. Diamonds indicate the estimated day of conception. E.g. someone born on Aug. 10th, 1971, is estimated to be conceived 266 days earlier, which is on Nov. 17th, 1970. This day fell during the previous year’s Ramadan (lower line). Someone who is estimated to be conceived on Dec. 1st 1970, has probably not been in utero during a Ramadan (second line from below). However, if this particular pregnancy was a few days longer than average, this would have been a misclassification, since conception did take place during Ramadan. For someone estimated to be conceived on Jan. 24th 1971, a misclassification is extremely unlikely. The latter person is therefore placed in the reference group, while the former person is removed from the data. Note that Ramadan lasted 29 days in 1970 and 30 days in 1971 and that it started 12 days earlier in 1971, due to the Islamic year being a bit shorter than the Gregorian year.
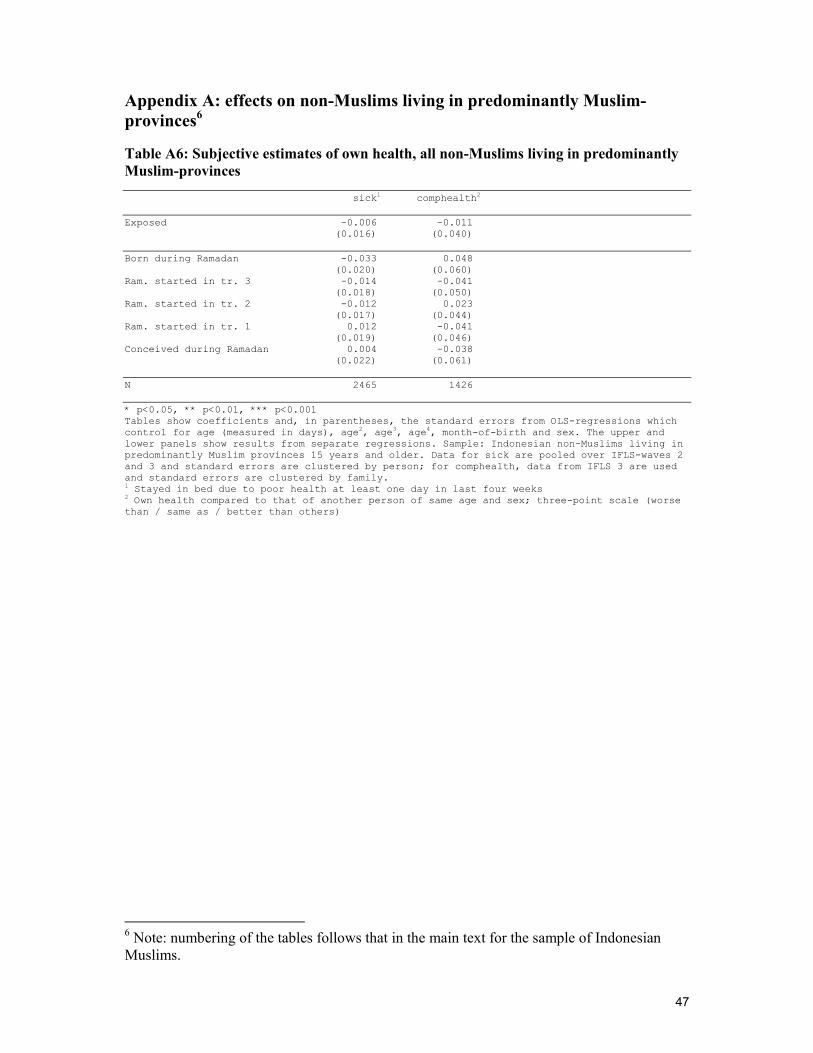
47
Appendix A: effects on non-Muslims living in predominantly Muslim-provinces6 Table A6: Subjective estimates of own health, all non-Muslims living in predominantly Muslim-provinces sick1 comphealth2 Exposed -0.006 -0.011 (0.016) (0.040) Born during Ramadan -0.033 0.048 (0.020) (0.060) Ram. started in tr. 3 -0.014 -0.041 (0.018) (0.050) Ram. started in tr. 2 -0.012 0.023 (0.017) (0.044) Ram. started in tr. 1 0.012 -0.041 (0.019) (0.046) Conceived during Ramadan 0.004 -0.038 (0.022) (0.061) N 2465 1426 * p<0.05, ** p<0.01, *** p<0.001 Tables show coefficients and, in parentheses, the standard errors from OLS-regressions which control for age (measured in days), age2, age3, age4, month-of-birth and sex. The upper and lower panels show results from separate regressions. Sample: Indonesian non-Muslims living in predominantly Muslim provinces 15 years and older. Data for sick are pooled over IFLS-waves 2 and 3 and standard errors are clustered by person; for comphealth, data from IFLS 3 are used and standard errors are clustered by family. 1 Stayed in bed due to poor health at least one day in last four weeks 2 Own health compared to that of another person of same age and sex; three-point scale (worse than / same as / better than others)
6 Note: numbering of the tables follows that in the main text for the sample of Indonesian Muslims.
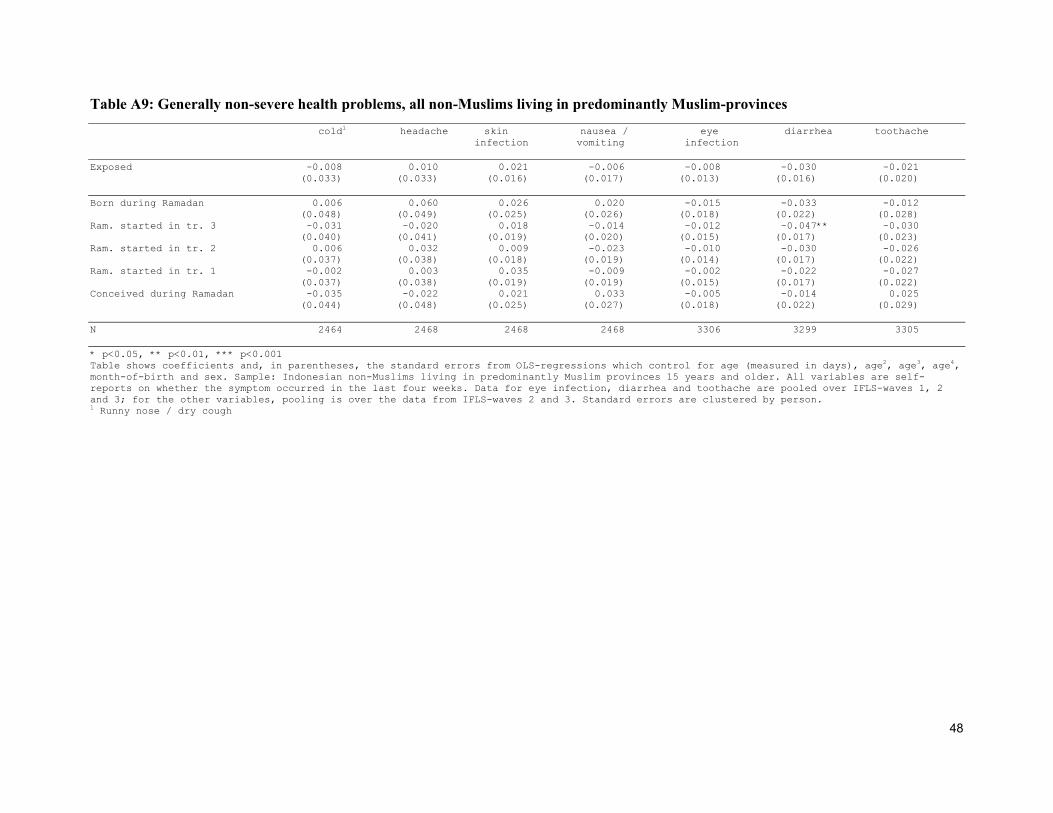
48
Table A9: Generally non-severe health problems, all non-Muslims living in predominantly Muslim-provinces cold1 headache skin nausea / eye diarrhea toothache infection vomiting infection Exposed -0.008 0.010 0.021 -0.006 -0.008 -0.030 -0.021 (0.033) (0.033) (0.016) (0.017) (0.013) (0.016) (0.020) Born during Ramadan 0.006 0.060 0.026 0.020 -0.015 -0.033 -0.012 (0.048) (0.049) (0.025) (0.026) (0.018) (0.022) (0.028) Ram. started in tr. 3 -0.031 -0.020 0.018 -0.014 -0.012 -0.047** -0.030 (0.040) (0.041) (0.019) (0.020) (0.015) (0.017) (0.023) Ram. started in tr. 2 0.006 0.032 0.009 -0.023 -0.010 -0.030 -0.026 (0.037) (0.038) (0.018) (0.019) (0.014) (0.017) (0.022) Ram. started in tr. 1 -0.002 0.003 0.035 -0.009 -0.002 -0.022 -0.027 (0.037) (0.038) (0.019) (0.019) (0.015) (0.017) (0.022) Conceived during Ramadan -0.035 -0.022 0.021 0.033 -0.005 -0.014 0.025 (0.044) (0.048) (0.025) (0.027) (0.018) (0.022) (0.029) N 2464 2468 2468 2468 3306 3299 3305 * p<0.05, ** p<0.01, *** p<0.001 Table shows coefficients and, in parentheses, the standard errors from OLS-regressions which control for age (measured in days), age2, age3, age4, month-of-birth and sex. Sample: Indonesian non-Muslims living in predominantly Muslim provinces 15 years and older. All variables are self-reports on whether the symptom occurred in the last four weeks. Data for eye infection, diarrhea and toothache are pooled over IFLS-waves 1, 2 and 3; for the other variables, pooling is over the data from IFLS-waves 2 and 3. Standard errors are clustered by person. 1 Runny nose / dry cough

49
Table A10: Subjective indicators of coronary heart disease, diabetes type 2 and, as a robustness check, diabetes type 1, non-Muslims living in predominantly Muslim-provinces 50+ chestpain1 woundheal2 urinate3 Exposed -0.068 0.028 -0.068 (0.078) (0.046) (0.079) Born during Ramadan -0.223* -0.030 0.040 (0.102) (0.054) (0.103) Ram. started in tr. 3 -0.084 0.016 -0.103 (0.091) (0.053) (0.095) Ram. started in tr. 2 0.012 0.056 -0.030 (0.086) (0.055) (0.091) Ram. started in tr. 1 -0.080 0.031 -0.161 (0.096) (0.055) (0.094) Conceived during Ramadan -0.004 0.047 -0.059 (0.104) (0.066) (0.115) N 465 465 465 * p<0.05, ** p<0.01, *** p<0.001 Tables shows coefficients and, in parentheses, the standard errors from OLS-regressions which control for age (measured in days), age2, age3, age4, month-of-birth and sex. The upper and lower panels show results from separate regressions. Sample: Indonesian non-Muslims living in predominantly Muslim provinces, 50 years and older. Data are pooled over IFLS-waves 2 and 3. Standard errors are clustered by person. 1 Sometimes feels chest pains on left side or in stairs/up-hill, or when active/walking fast 2 If you have a cut or wound, does it take a long time to heal? 3 Often gets up to urinate at night

50
Table A11: Measurements on blood and blood circulation, all non-Muslims living in predominantly Muslim-provinces anemia1 hiblood2 pulsepres Exposed -0.026 0.063 0.511 (0.039) (0.034) (1.097) Born during Ramadan -0.022 0.059 0.052 (0.058) (0.051) (1.734) Ram. started in tr. 3 0.018 0.053 0.272 (0.047) (0.043) (1.342) Ram. started in tr. 2 -0.057 0.078* 0.202 (0.045) (0.039) (1.312) Ram. started in tr. 1 -0.040 0.074 0.944 (0.044) (0.040) (1.271) Conceived during Ramadan 0.007 0.017 1.222 (0.054) (0.045) (1.464) N 1169 1223 1223 * p<0.05, ** p<0.01, *** p<0.001 Tables shows coefficients and, in parentheses, the standard errors (clustered by family) from OLS-regressions which control for age (measured in days), age2, age3, age4, month-of-birth and sex. The upper and lower panels show results from separate regressions. Sample: Indonesian non-Muslims living in predominantly Muslim provinces 18 years and older. 1 Anemia: hemoglobin level < 13.5 g/dl for men and < 12 g/dl for non-pregnant women 2 high blood pressure: systolic ≥ 140 mmHg and/or diastolic ≥ 90 mmHg
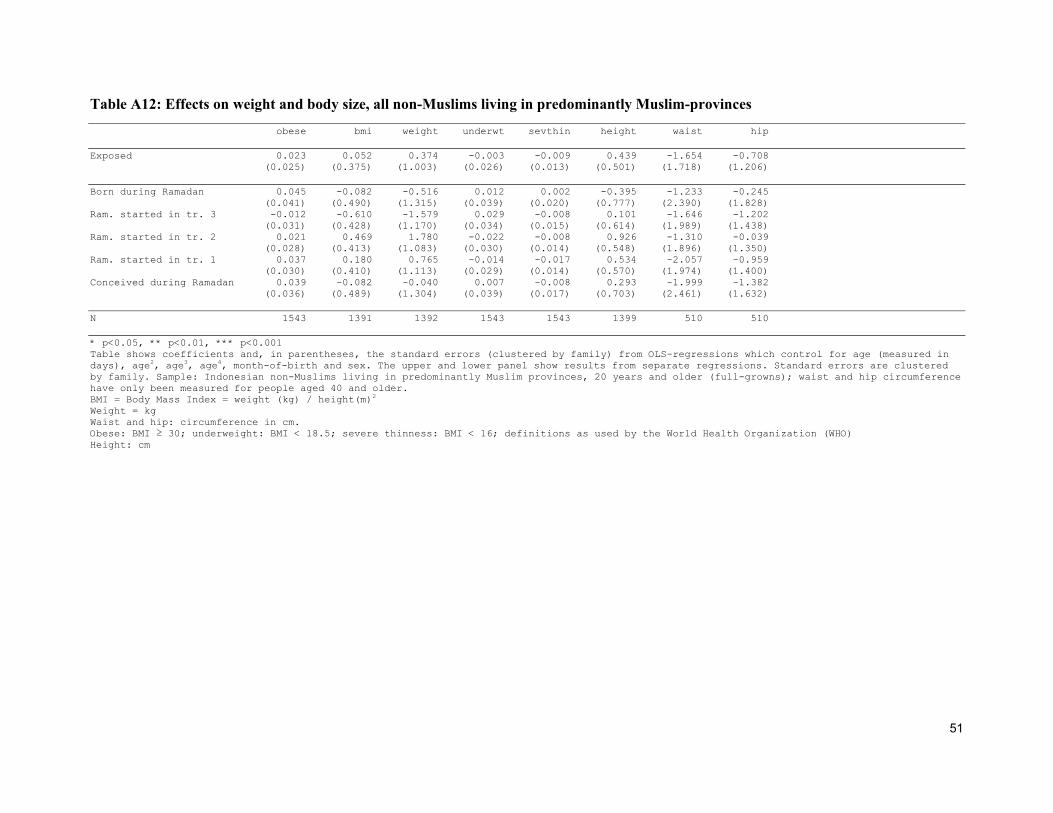
51
Table A12: Effects on weight and body size, all non-Muslims living in predominantly Muslim-provinces obese bmi weight underwt sevthin height waist hip Exposed 0.023 0.052 0.374 -0.003 -0.009 0.439 -1.654 -0.708 (0.025) (0.375) (1.003) (0.026) (0.013) (0.501) (1.718) (1.206) Born during Ramadan 0.045 -0.082 -0.516 0.012 0.002 -0.395 -1.233 -0.245 (0.041) (0.490) (1.315) (0.039) (0.020) (0.777) (2.390) (1.828) Ram. started in tr. 3 -0.012 -0.610 -1.579 0.029 -0.008 0.101 -1.646 -1.202 (0.031) (0.428) (1.170) (0.034) (0.015) (0.614) (1.989) (1.438) Ram. started in tr. 2 0.021 0.469 1.780 -0.022 -0.008 0.926 -1.310 -0.039 (0.028) (0.413) (1.083) (0.030) (0.014) (0.548) (1.896) (1.350) Ram. started in tr. 1 0.037 0.180 0.765 -0.014 -0.017 0.534 -2.057 -0.959 (0.030) (0.410) (1.113) (0.029) (0.014) (0.570) (1.974) (1.400) Conceived during Ramadan 0.039 -0.082 -0.040 0.007 -0.008 0.293 -1.999 -1.382 (0.036) (0.489) (1.304) (0.039) (0.017) (0.703) (2.461) (1.632) N 1543 1391 1392 1543 1543 1399 510 510 * p<0.05, ** p<0.01, *** p<0.001 Table shows coefficients and, in parentheses, the standard errors (clustered by family) from OLS-regressions which control for age (measured in days), age2, age3, age4, month-of-birth and sex. The upper and lower panel show results from separate regressions. Standard errors are clustered by family. Sample: Indonesian non-Muslims living in predominantly Muslim provinces, 20 years and older (full-growns); waist and hip circumference have only been measured for people aged 40 and older. BMI = Body Mass Index = weight (kg) / height(m)2
Weight = kg Waist and hip: circumference in cm. Obese: BMI ≥ 30; underweight: BMI < 18.5; severe thinness: BMI < 16; definitions as used by the World Health Organization (WHO) Height: cm
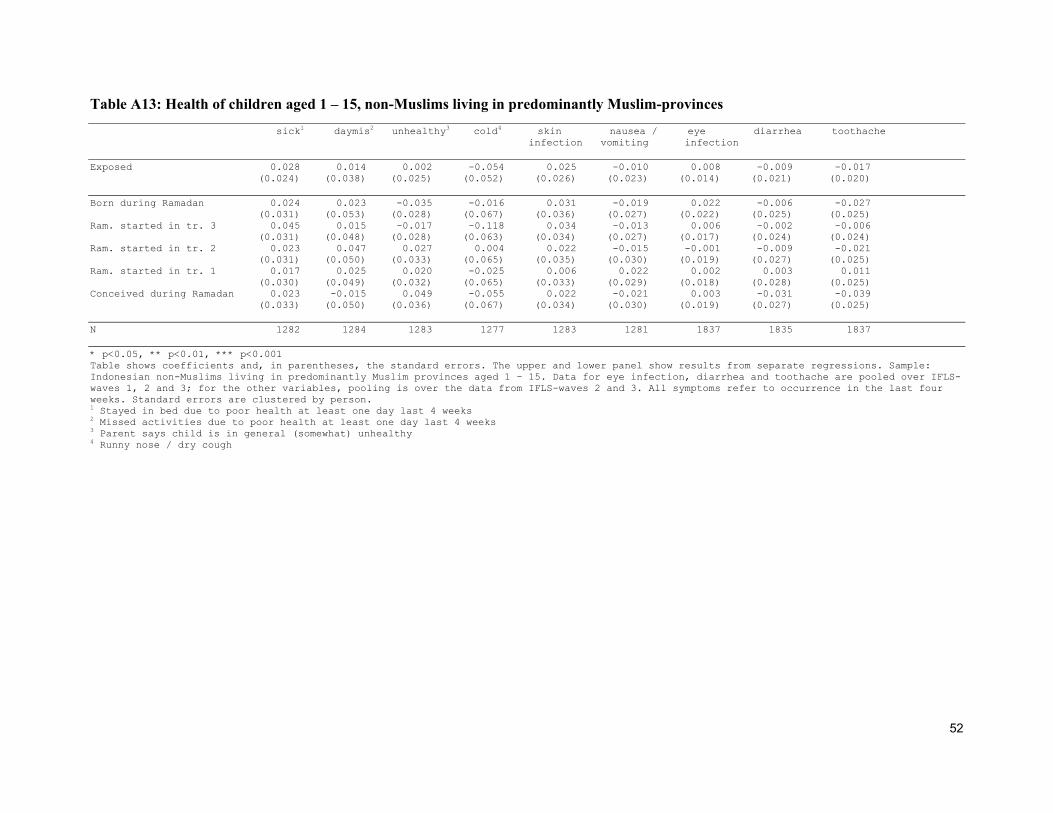
52
Table A13: Health of children aged 1 – 15, non-Muslims living in predominantly Muslim-provinces sick1 daymis2 unhealthy3 cold4 skin nausea / eye diarrhea toothache infection vomiting infection Exposed 0.028 0.014 0.002 -0.054 0.025 -0.010 0.008 -0.009 -0.017 (0.024) (0.038) (0.025) (0.052) (0.026) (0.023) (0.014) (0.021) (0.020) Born during Ramadan 0.024 0.023 -0.035 -0.016 0.031 -0.019 0.022 -0.006 -0.027 (0.031) (0.053) (0.028) (0.067) (0.036) (0.027) (0.022) (0.025) (0.025) Ram. started in tr. 3 0.045 0.015 -0.017 -0.118 0.034 -0.013 0.006 -0.002 -0.006 (0.031) (0.048) (0.028) (0.063) (0.034) (0.027) (0.017) (0.024) (0.024) Ram. started in tr. 2 0.023 0.047 0.027 0.004 0.022 -0.015 -0.001 -0.009 -0.021 (0.031) (0.050) (0.033) (0.065) (0.035) (0.030) (0.019) (0.027) (0.025) Ram. started in tr. 1 0.017 0.025 0.020 -0.025 0.006 0.022 0.002 0.003 0.011 (0.030) (0.049) (0.032) (0.065) (0.033) (0.029) (0.018) (0.028) (0.025) Conceived during Ramadan 0.023 -0.015 0.049 -0.055 0.022 -0.021 0.003 -0.031 -0.039 (0.033) (0.050) (0.036) (0.067) (0.034) (0.030) (0.019) (0.027) (0.025) N 1282 1284 1283 1277 1283 1281 1837 1835 1837 * p<0.05, ** p<0.01, *** p<0.001 Table shows coefficients and, in parentheses, the standard errors. The upper and lower panel show results from separate regressions. Sample: Indonesian non-Muslims living in predominantly Muslim provinces aged 1 – 15. Data for eye infection, diarrhea and toothache are pooled over IFLS-waves 1, 2 and 3; for the other variables, pooling is over the data from IFLS-waves 2 and 3. All symptoms refer to occurrence in the last four weeks. Standard errors are clustered by person. 1 Stayed in bed due to poor health at least one day last 4 weeks 2 Missed activities due to poor health at least one day last 4 weeks 3 Parent says child is in general (somewhat) unhealthy 4 Runny nose / dry cough
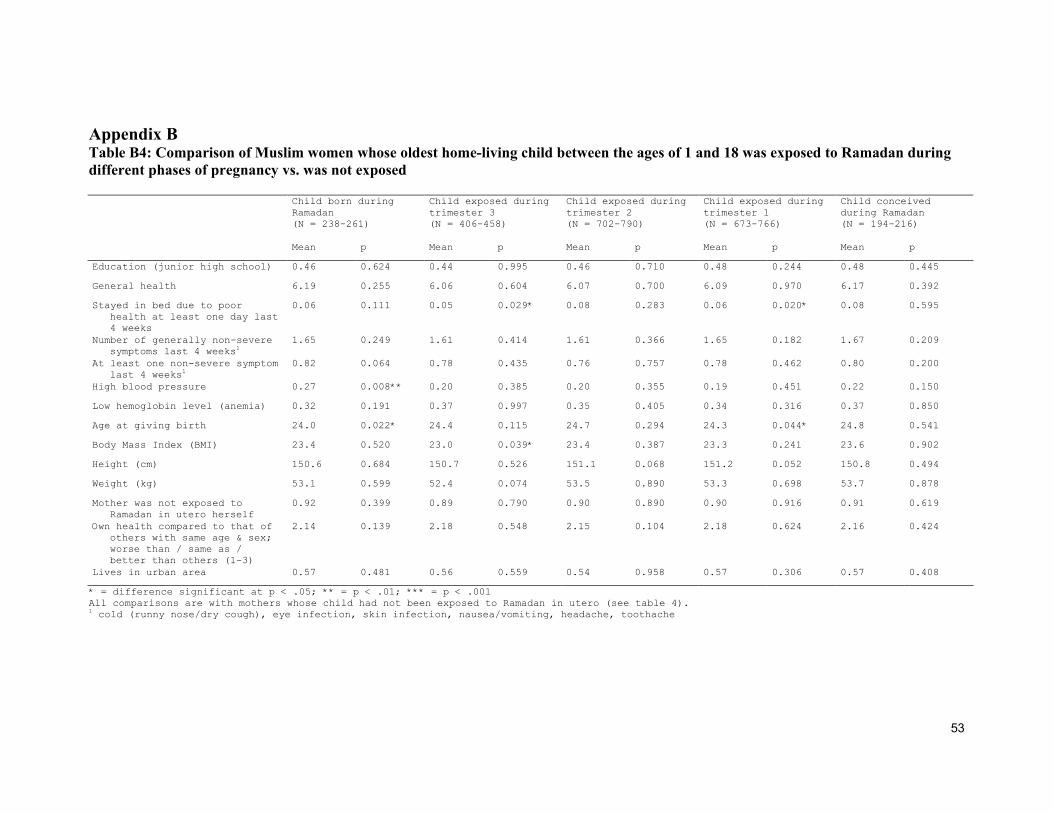
53
Appendix B Table B4: Comparison of Muslim women whose oldest home-living child between the ages of 1 and 18 was exposed to Ramadan during different phases of pregnancy vs. was not exposed Child born during
Ramadan (N = 238-261)
Child exposed during trimester 3 (N = 406-458)
Child exposed during trimester 2 (N = 702-790)
Child exposed during trimester 1 (N = 673-766)
Child conceived during Ramadan (N = 194-216)
Mean p Mean p Mean p Mean p Mean p
Education (junior high school) 0.46 0.624 0.44 0.995 0.46 0.710 0.48 0.244 0.48 0.445
General health 6.19 0.255 6.06 0.604 6.07 0.700 6.09 0.970 6.17 0.392
Stayed in bed due to poor health at least one day last 4 weeks
0.06 0.111 0.05 0.029* 0.08 0.283 0.06 0.020* 0.08 0.595
Number of generally non-severe symptoms last 4 weeks1
1.65 0.249 1.61 0.414 1.61 0.366 1.65 0.182 1.67 0.209
At least one non-severe symptom last 4 weeks1
0.82 0.064 0.78 0.435 0.76 0.757 0.78 0.462 0.80 0.200
High blood pressure 0.27 0.008** 0.20 0.385 0.20 0.355 0.19 0.451 0.22 0.150
Low hemoglobin level (anemia) 0.32 0.191 0.37 0.997 0.35 0.405 0.34 0.316 0.37 0.850
Age at giving birth 24.0 0.022* 24.4 0.115 24.7 0.294 24.3 0.044* 24.8 0.541
Body Mass Index (BMI) 23.4 0.520 23.0 0.039* 23.4 0.387 23.3 0.241 23.6 0.902
Height (cm) 150.6 0.684 150.7 0.526 151.1 0.068 151.2 0.052 150.8 0.494
Weight (kg) 53.1 0.599 52.4 0.074 53.5 0.890 53.3 0.698 53.7 0.878
Mother was not exposed to Ramadan in utero herself
0.92 0.399 0.89 0.790 0.90 0.890 0.90 0.916 0.91 0.619
Own health compared to that of others with same age & sex; worse than / same as / better than others (1-3)
2.14 0.139 2.18 0.548 2.15 0.104 2.18 0.624 2.16 0.424
Lives in urban area 0.57 0.481 0.56 0.559 0.54 0.958 0.57 0.306 0.57 0.408
* = difference significant at p < .05; ** = p < .01; *** = p < .001 All comparisons are with mothers whose child had not been exposed to Ramadan in utero (see table 4). 1 cold (runny nose/dry cough), eye infection, skin infection, nausea/vomiting, headache, toothache
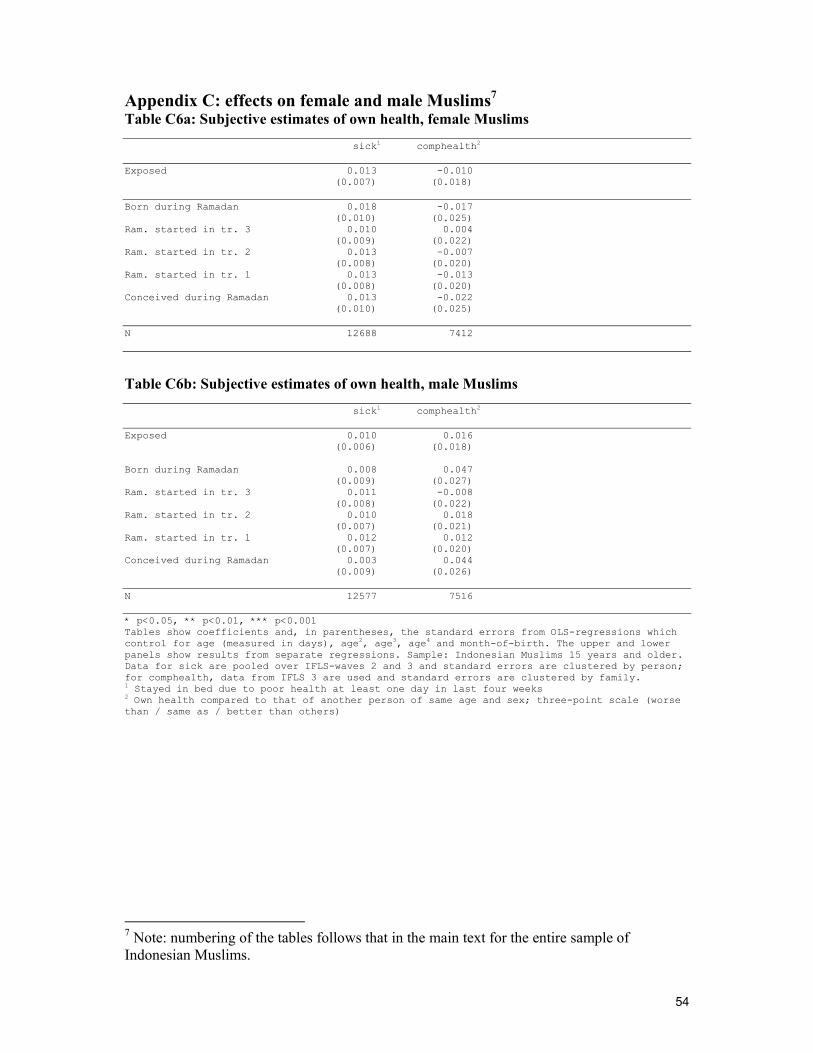
54
Appendix C: effects on female and male Muslims7 Table C6a: Subjective estimates of own health, female Muslims sick1 comphealth2 Exposed 0.013 -0.010 (0.007) (0.018) Born during Ramadan 0.018 -0.017 (0.010) (0.025) Ram. started in tr. 3 0.010 0.004 (0.009) (0.022) Ram. started in tr. 2 0.013 -0.007 (0.008) (0.020) Ram. started in tr. 1 0.013 -0.013 (0.008) (0.020) Conceived during Ramadan 0.013 -0.022 (0.010) (0.025) N 12688 7412
Table C6b: Subjective estimates of own health, male Muslims sick1 comphealth2 Exposed 0.010 0.016 (0.006) (0.018) Born during Ramadan 0.008 0.047 (0.009) (0.027) Ram. started in tr. 3 0.011 -0.008 (0.008) (0.022) Ram. started in tr. 2 0.010 0.018 (0.007) (0.021) Ram. started in tr. 1 0.012 0.012 (0.007) (0.020) Conceived during Ramadan 0.003 0.044 (0.009) (0.026) N 12577 7516 * p<0.05, ** p<0.01, *** p<0.001 Tables show coefficients and, in parentheses, the standard errors from OLS-regressions which control for age (measured in days), age2, age3, age4 and month-of-birth. The upper and lower panels show results from separate regressions. Sample: Indonesian Muslims 15 years and older. Data for sick are pooled over IFLS-waves 2 and 3 and standard errors are clustered by person; for comphealth, data from IFLS 3 are used and standard errors are clustered by family. 1 Stayed in bed due to poor health at least one day in last four weeks 2 Own health compared to that of another person of same age and sex; three-point scale (worse than / same as / better than others)
7 Note: numbering of the tables follows that in the main text for the entire sample of Indonesian Muslims.
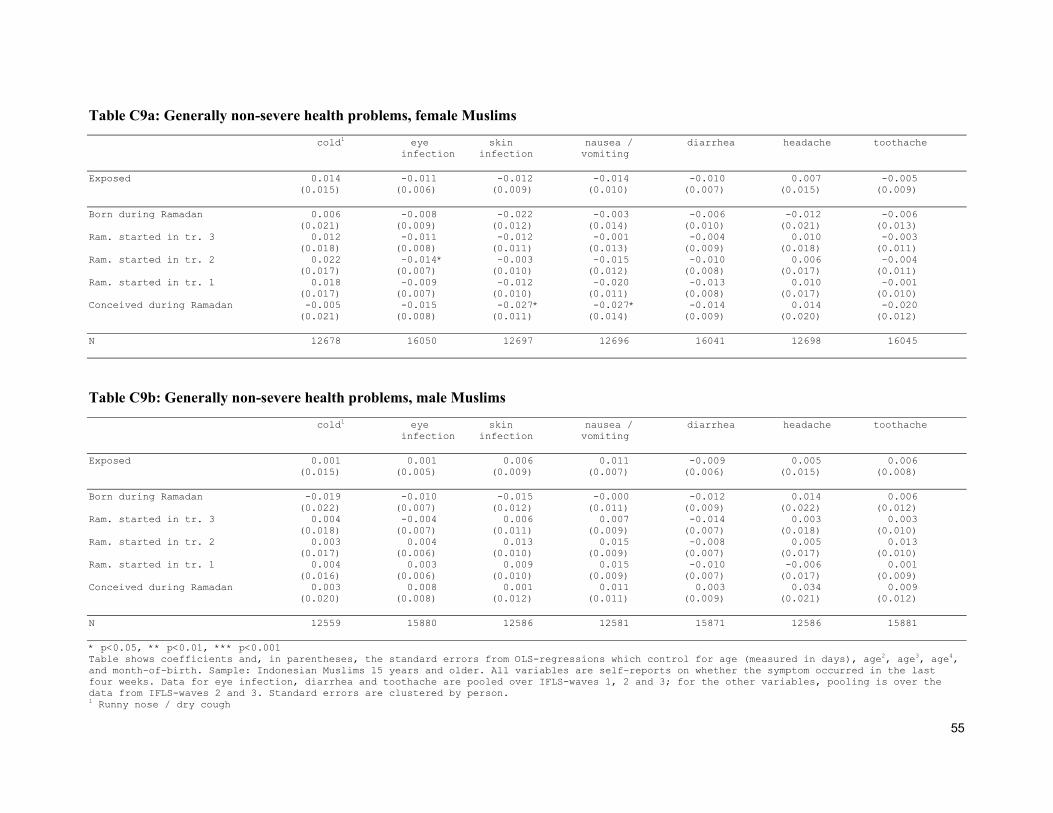
55
Table C9a: Generally non-severe health problems, female Muslims cold1 eye skin nausea / diarrhea headache toothache infection infection vomiting Exposed 0.014 -0.011 -0.012 -0.014 -0.010 0.007 -0.005 (0.015) (0.006) (0.009) (0.010) (0.007) (0.015) (0.009) Born during Ramadan 0.006 -0.008 -0.022 -0.003 -0.006 -0.012 -0.006 (0.021) (0.009) (0.012) (0.014) (0.010) (0.021) (0.013) Ram. started in tr. 3 0.012 -0.011 -0.012 -0.001 -0.004 0.010 -0.003 (0.018) (0.008) (0.011) (0.013) (0.009) (0.018) (0.011) Ram. started in tr. 2 0.022 -0.014* -0.003 -0.015 -0.010 0.006 -0.004 (0.017) (0.007) (0.010) (0.012) (0.008) (0.017) (0.011) Ram. started in tr. 1 0.018 -0.009 -0.012 -0.020 -0.013 0.010 -0.001 (0.017) (0.007) (0.010) (0.011) (0.008) (0.017) (0.010) Conceived during Ramadan -0.005 -0.015 -0.027* -0.027* -0.014 0.014 -0.020 (0.021) (0.008) (0.011) (0.014) (0.009) (0.020) (0.012) N 12678 16050 12697 12696 16041 12698 16045
Table C9b: Generally non-severe health problems, male Muslims cold1 eye skin nausea / diarrhea headache toothache infection infection vomiting Exposed 0.001 0.001 0.006 0.011 -0.009 0.005 0.006 (0.015) (0.005) (0.009) (0.007) (0.006) (0.015) (0.008) Born during Ramadan -0.019 -0.010 -0.015 -0.000 -0.012 0.014 0.006 (0.022) (0.007) (0.012) (0.011) (0.009) (0.022) (0.012) Ram. started in tr. 3 0.004 -0.004 0.006 0.007 -0.014 0.003 0.003 (0.018) (0.007) (0.011) (0.009) (0.007) (0.018) (0.010) Ram. started in tr. 2 0.003 0.004 0.013 0.015 -0.008 0.005 0.013 (0.017) (0.006) (0.010) (0.009) (0.007) (0.017) (0.010) Ram. started in tr. 1 0.004 0.003 0.009 0.015 -0.010 -0.006 0.001 (0.016) (0.006) (0.010) (0.009) (0.007) (0.017) (0.009) Conceived during Ramadan 0.003 0.008 0.001 0.011 0.003 0.034 0.009 (0.020) (0.008) (0.012) (0.011) (0.009) (0.021) (0.012) N 12559 15880 12586 12581 15871 12586 15881 * p<0.05, ** p<0.01, *** p<0.001 Table shows coefficients and, in parentheses, the standard errors from OLS-regressions which control for age (measured in days), age2, age3, age4, and month-of-birth. Sample: Indonesian Muslims 15 years and older. All variables are self-reports on whether the symptom occurred in the last four weeks. Data for eye infection, diarrhea and toothache are pooled over IFLS-waves 1, 2 and 3; for the other variables, pooling is over the data from IFLS-waves 2 and 3. Standard errors are clustered by person. 1 Runny nose / dry cough
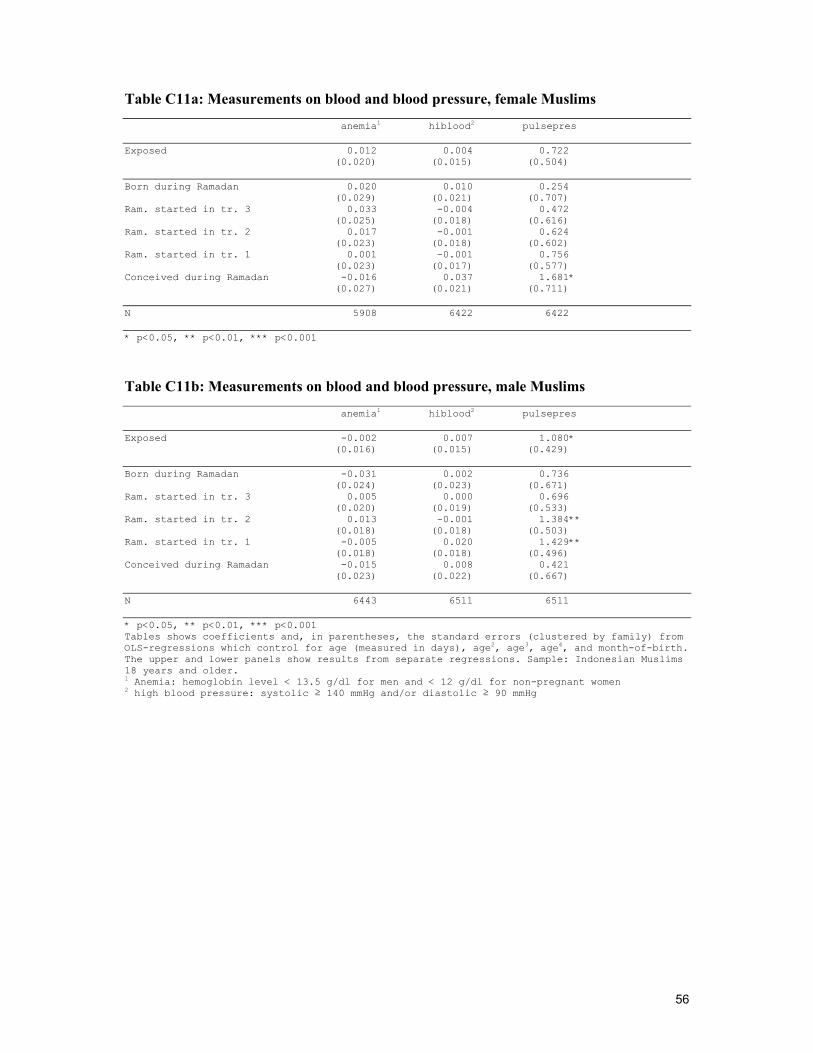
56
Table C11a: Measurements on blood and blood pressure, female Muslims anemia1 hiblood2 pulsepres Exposed 0.012 0.004 0.722 (0.020) (0.015) (0.504) Born during Ramadan 0.020 0.010 0.254 (0.029) (0.021) (0.707) Ram. started in tr. 3 0.033 -0.004 0.472 (0.025) (0.018) (0.616) Ram. started in tr. 2 0.017 -0.001 0.624 (0.023) (0.018) (0.602) Ram. started in tr. 1 0.001 -0.001 0.756 (0.023) (0.017) (0.577) Conceived during Ramadan -0.016 0.037 1.681* (0.027) (0.021) (0.711) N 5908 6422 6422 * p<0.05, ** p<0.01, *** p<0.001
Table C11b: Measurements on blood and blood pressure, male Muslims anemia1 hiblood2 pulsepres Exposed -0.002 0.007 1.080* (0.016) (0.015) (0.429) Born during Ramadan -0.031 0.002 0.736 (0.024) (0.023) (0.671) Ram. started in tr. 3 0.005 0.000 0.696 (0.020) (0.019) (0.533) Ram. started in tr. 2 0.013 -0.001 1.384** (0.018) (0.018) (0.503) Ram. started in tr. 1 -0.005 0.020 1.429** (0.018) (0.018) (0.496) Conceived during Ramadan -0.015 0.008 0.421 (0.023) (0.022) (0.667) N 6443 6511 6511 * p<0.05, ** p<0.01, *** p<0.001 Tables shows coefficients and, in parentheses, the standard errors (clustered by family) from OLS-regressions which control for age (measured in days), age2, age3, age4, and month-of-birth. The upper and lower panels show results from separate regressions. Sample: Indonesian Muslims 18 years and older. 1 Anemia: hemoglobin level < 13.5 g/dl for men and < 12 g/dl for non-pregnant women 2 high blood pressure: systolic ≥ 140 mmHg and/or diastolic ≥ 90 mmHg
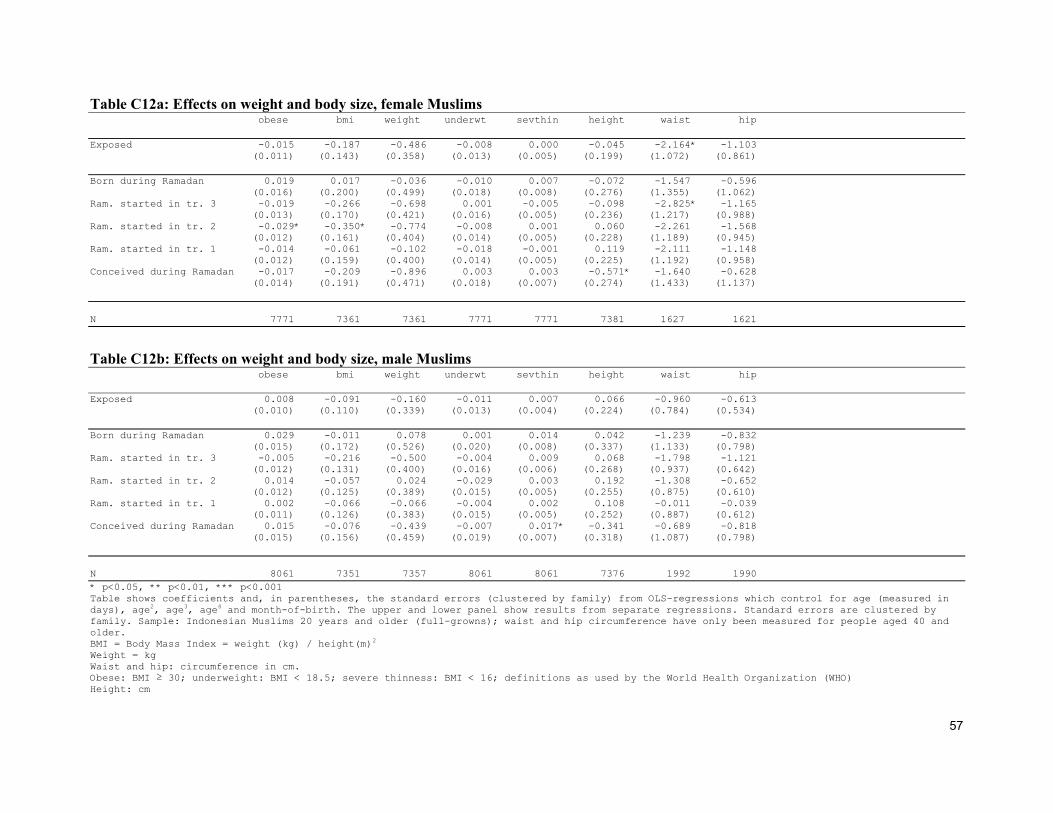
57
Table C12a: Effects on weight and body size, female Muslims obese bmi weight underwt sevthin height waist hip Exposed -0.015 -0.187 -0.486 -0.008 0.000 -0.045 -2.164* -1.103 (0.011) (0.143) (0.358) (0.013) (0.005) (0.199) (1.072) (0.861) Born during Ramadan 0.019 0.017 -0.036 -0.010 0.007 -0.072 -1.547 -0.596 (0.016) (0.200) (0.499) (0.018) (0.008) (0.276) (1.355) (1.062) Ram. started in tr. 3 -0.019 -0.266 -0.698 0.001 -0.005 -0.098 -2.825* -1.165 (0.013) (0.170) (0.421) (0.016) (0.005) (0.236) (1.217) (0.988) Ram. started in tr. 2 -0.029* -0.350* -0.774 -0.008 0.001 0.060 -2.261 -1.568 (0.012) (0.161) (0.404) (0.014) (0.005) (0.228) (1.189) (0.945) Ram. started in tr. 1 -0.014 -0.061 -0.102 -0.018 -0.001 0.119 -2.111 -1.148 (0.012) (0.159) (0.400) (0.014) (0.005) (0.225) (1.192) (0.958) Conceived during Ramadan -0.017 -0.209 -0.896 0.003 0.003 -0.571* -1.640 -0.628 (0.014) (0.191) (0.471) (0.018) (0.007) (0.274) (1.433) (1.137) N 7771 7361 7361 7771 7771 7381 1627 1621
Table C12b: Effects on weight and body size, male Muslims obese bmi weight underwt sevthin height waist hip Exposed 0.008 -0.091 -0.160 -0.011 0.007 0.066 -0.960 -0.613 (0.010) (0.110) (0.339) (0.013) (0.004) (0.224) (0.784) (0.534) Born during Ramadan 0.029 -0.011 0.078 0.001 0.014 0.042 -1.239 -0.832 (0.015) (0.172) (0.526) (0.020) (0.008) (0.337) (1.133) (0.798) Ram. started in tr. 3 -0.005 -0.216 -0.500 -0.004 0.009 0.068 -1.798 -1.121 (0.012) (0.131) (0.400) (0.016) (0.006) (0.268) (0.937) (0.642) Ram. started in tr. 2 0.014 -0.057 0.024 -0.029 0.003 0.192 -1.308 -0.652 (0.012) (0.125) (0.389) (0.015) (0.005) (0.255) (0.875) (0.610) Ram. started in tr. 1 0.002 -0.066 -0.066 -0.004 0.002 0.108 -0.011 -0.039 (0.011) (0.126) (0.383) (0.015) (0.005) (0.252) (0.887) (0.612) Conceived during Ramadan 0.015 -0.076 -0.439 -0.007 0.017* -0.341 -0.689 -0.818 (0.015) (0.156) (0.459) (0.019) (0.007) (0.318) (1.087) (0.798) N 8061 7351 7357 8061 8061 7376 1992 1990 * p<0.05, ** p<0.01, *** p<0.001 Table shows coefficients and, in parentheses, the standard errors (clustered by family) from OLS-regressions which control for age (measured in days), age2, age3, age4 and month-of-birth. The upper and lower panel show results from separate regressions. Standard errors are clustered by family. Sample: Indonesian Muslims 20 years and older (full-growns); waist and hip circumference have only been measured for people aged 40 and older. BMI = Body Mass Index = weight (kg) / height(m)2
Weight = kg Waist and hip: circumference in cm. Obese: BMI ≥ 30; underweight: BMI < 18.5; severe thinness: BMI < 16; definitions as used by the World Health Organization (WHO) Height: cm

58
Table C13a: Health of children aged 1 – 15, female Muslims sick1 daymis2 unhealthy3 cold4 eye skin nausea / diarrhea toothache infection infection vomiting Exposed 0.009 -0.013 0.016 0.013 -0.005 0.006 0.005 -0.012 0.002 (0.012) (0.019) (0.010) (0.021) (0.007) (0.013) (0.011) (0.010) (0.011) Born during Ramadan -0.005 -0.035 0.012 -0.001 -0.006 0.012 -0.009 -0.027* -0.003 (0.016) (0.024) (0.014) (0.028) (0.010) (0.017) (0.014) (0.012) (0.015) Ram. started in tr. 3 -0.000 -0.025 0.015 -0.005 -0.009 -0.006 0.012 -0.005 0.005 (0.014) (0.022) (0.012) (0.024) (0.009) (0.016) (0.013) (0.012) (0.014) Ram. started in tr. 2 0.010 -0.022 0.013 0.005 -0.002 0.018 0.003 0.003 0.012 (0.015) (0.023) (0.013) (0.025) (0.009) (0.016) (0.014) (0.013) (0.014) Ram. started in tr. 1 0.018 -0.001 0.016 0.023 0.000 0.014 0.012 -0.001 0.002 (0.015) (0.023) (0.013) (0.025) (0.009) (0.016) (0.014) (0.013) (0.013) Conceived during Ramadan 0.034 0.026 0.022 0.057 -0.007 0.001 0.001 -0.023 -0.001 (0.018) (0.027) (0.015) (0.029) (0.010) (0.017) (0.015) (0.013) (0.015) N 7379 7382 7390 7372 9966 7389 7385 9957 9965
Table C13b: Health of children aged 1 – 15, male Muslims sick1 daymis2 unhealthy3 cold4 eye skin nausea / diarrhea toothache infection infection vomiting Exposed 0.008 0.004 0.008 -0.027 -0.002 0.002 0.001 0.009 -0.000 (0.012) (0.018) (0.010) (0.021) (0.007) (0.013) (0.011) (0.010) (0.011) Born during Ramadan 0.001 0.009 0.004 -0.045 -0.000 -0.012 0.012 0.003 0.006 (0.016) (0.024) (0.015) (0.028) (0.010) (0.017) (0.015) (0.013) (0.015) Ram. started in tr. 3 -0.004 -0.012 -0.008 -0.020 -0.009 0.003 -0.007 0.006 -0.017 (0.015) (0.022) (0.012) (0.025) (0.008) (0.016) (0.013) (0.012) (0.013) Ram. started in tr. 2 -0.001 0.001 0.002 -0.028 -0.002 0.005 0.005 0.020 -0.004 (0.015) (0.022) (0.013) (0.025) (0.009) (0.016) (0.014) (0.013) (0.013) Ram. started in tr. 1 0.006 0.003 0.016 -0.040 0.004 -0.001 -0.006 0.008 -0.010 (0.015) (0.022) (0.013) (0.025) (0.009) (0.016) (0.014) (0.013) (0.013) Conceived during Ramadan 0.038* 0.021 0.026 -0.003 -0.001 0.018 0.005 0.017 0.028 (0.018) (0.025) (0.014) (0.028) (0.009) (0.018) (0.015) (0.014) (0.016) N 7525 7525 7533 7513 10112 7532 7527 10102 10110 * p<0.05, ** p<0.01, *** p<0.001 Table shows coefficients and, in parentheses, the standard errors. The upper and lower panel show results from separate regressions. Sample: Indonesian Muslims aged 1 – 15. Data for eye infection, diarrhea and toothache are pooled over IFLS-waves 1, 2 and 3; for the other variables, pooling is over the data from IFLS-waves 2 and 3. All symptoms refer to occurrence in the last four weeks. Standard errors are clustered by person. 1 Stayed in bed due to poor health at least one day last 4 weeks 2 Missed activities due to poor health at least one day last 4 weeks 3 Parent says child is in general (somewhat) unhealthy 4 Runny nose / dry cough

59
References
Almond, D. & Mazumder, B. (2008), The Effects of Maternal Fasting During Ramadan on Birth and Adult Outcomes. NBER working papers, No. 14428, National Bureau of Economic Research.
Arab, M. (2004), Ketonuria and Serum Glucose of Fasting Pregnant Women at the End of a
Day in Ramadan. Acta Medica Iranica, 42(3), 209-212. Arab, M. & Nasrollahi, S. (2001), Interrelation of Ramadan Fasting and Birth Weight,
Medical Journal of Islamic Academy of Sciences 14(3), 91-95. Azizi, F. (2002), Research in Islamic Fasting and Health, Annals of Saudi Medicine, 22(3 -4),
186 – 191. Barker, D.J.P. (1997), Fetal nutrition and cardiovascular disease in later life. British Medical
Bulletin, 53(1) 96-108. Barker, D.J.P. (2002), Fetal programming of coronary heart disease. TRENDS in
Endocrinology & Metabolism, 13(9), 364-368. Brace, R. (1997), Physiology of Amniotic Fluid Volume Regulation, Clinical Obstetrics and
Gynecology, 40(2), 280-289. Casey, B.M., McIntire, D.D., Bloom, S.L., Lucas, M.J., Santos, R., Twickler, D.M., Ramus,
R.M. & Leveno, K.J. (2000), Pregnancy outcomes after antepartum diagnosis of oligohydramnios at or beyond 34 weeks’ gestation, American Journal of Obstetrics & Gynecology, 182(4), 909-912.
Central Intelligence Agency (2008), The 2008 World Factbook,
https://www.cia.gov/library/publications/the-world-factbook/geos/id.html, accessed on 11-8-2008.
Franklin, S.S., Larson, M.G., Khan .S.A, Wong, N.D., Leip, E.P., Kannel, W.B. & Levy, D.
(2001), Does the relation of blood pressure to coronary heart disease risk change with aging? The Framingham heart study. Circulation, 103, 1245–1249.
Godfrey, K.M. & Barker, D.J.P. (2000), Fetal nutrition and adult disease. The American
Journal of Clinical Nutrition, 71(suppl), 1344S–52S. Godfrey, K.M. & Barker, D.J.P. (2001), Fetal Programming and Adult Health, Public Health
Nutrition, 4(2B), 611-624. Harding, J.E. (2001), The nutritional basis of the fetal origins of adult disease, International
Journal of Epidemiology, 30, 15-23. Heijmans, B.T., Tobi, E.W., Stein, A.D., Putter, H., Blauw, G.J., Susser, E.S., Slagboom,
P.E. & Lumey, L.H. (2008), Persistent epigenetic differences associated with prenatal exposure to famine in humans, Proceedings of the National Academy of Sciences, 105(44), 17046-17049.

60
Hermann, T.S., Siega-Riz, A.M., Hobel, C.J., Aurora, C. & Dunkel-Schetter, C. (2001),
Prolonged periods without food intake during pregnancy increase risk for elevated maternal corticotropin-releasing hormone concentrations, Am J Obstet Gynecol, 185(2) 403-412.
Hobel, C.J. & Culhane, J. (2003), Role of Psychosocial and Nutritional Stress on Poor
Pregnancy Outcome, The Journal of Nutrition, 133, 1709S-1717S, Supplement: Nutrition as a Preventive Strategy against Adverse Pregnancy Outcomes.
James, W.H. (1971), Cycle day of insemination, coital rate, and sex ratio. The Lancet,
1(7690), 112-114. Joosoph, J., Abu, J. & Yu S.L. (2004), A survey of fasting during pregnancy. Singapore Med
J, 45(12), 583-586. Kieler, H., Axelsson, O., Nilsson, S. & Waldenström, U. (1995), The length of human
pregnancy as calculated by ultrasonographic measurement of the fetal biparietal diameter. Ultrasound in obstetrics & gynecology, 16(5), 353-357.
Leiper, J.B., Molla, A.M. & Molla, A.M. (2003), Effects on health of fluid restriction during
fasting in Ramadan, European Journal of Clinical Nutrition, 57(Suppl 2), S30–S38.
Malhotra, A., Scott, P.H., Scott, J., Gee, H. & Wharton, B.A. (1989), Metabolic changes in Asian Muslim pregnant mothers observing the Ramadan fast in Britain. British Journal of Nutrition, 61, 663-672.
Mathews, F., Johnson, P.J. & Neil, A. (2008), You are what your mother eats: evidence for
maternal preconception diet influencing foetal sex in humans. Proceedings of the Royal Society B, 275, 1661-1668.
Meis, P.J., Rose, J.C. & Swain, M. (1984), Pregnancy Alters Diurnal Variation of Plasma
Glucose Concentration, Chronobiology International, I(2), 145-149. Metcalfe, N.B. and Monaghan, P. (2001), Compensation for a bad start: grow now, pay later?
Trends. Ecol. Evol., 16, 254–260. Metzger, B.E., Ravnikas, V., Vileisis, R.A. & Norbert, F. (1982), “Accelerated starvation”
and the skipped breakfast in late normal pregnancy. The Lancet, 1(8272), 588-592. Mirghani, H.M., Weerasinghe, D.S.L., Ezimokhai, M. & Smith, J.R. (2003), The effect of
maternal fasting on the fetal biophysical profile. International Journal of Gynecology and Obstetrics, 81, 17-21.
Mirghani, H.M., Weerasinghe, S.D., Smith, J.R. and Ezimokhai, M. (2004), The effect of
intermittent maternal fasting on human fetal breathing movements, Journal of Obstetrics and Gynaecology, 24(6),635-637.
61
Mirghani, H.M., Weerasinghe, S.D., Al-Awar, S., Abdulla, L. & Ezimokhai, M. (2005), The Effect of Intermittent Maternal Fasting on Computerized Fetal Heart Tracing, Journal of Perinatology, 25, 90–92.
Painter, R.C., Roseboom, T.J., Van Montfrans, G.A., Bossuyt, P.M.M., Krediet, R.T.,
Osmond, C., Barker, D.J.P. & Bleker, O.P. (2005), Microalbuminuria in Adults after Prenatal Exposure to the Dutch Famine, J Am Soc Nephrol, 16, 189-194.
Phillips, D.I.W. (1996), Insulin resistance as a programmed response to fetal undernutrition.
Diabetologia, 39, 1119–22. Prentice A.M., Prentice A., Lamb W.H., Lunn P.G. & Austin S. (1983), Metabolic
consequences of fasting during Ramadan in pregnant and lactating women. Hum. Nutr. Clin. Nutr., 37C, 283–294.
Rabinerson, D., Dicker, D., Kaplan, B., Ben-Rafael, Z. & Dekel, A. (2000). Hyperemesis
gravidarum during Ramadan, Journal of psychosomatic obstetrics and gynaecology, 21(4), 189-191.
Ravelli, A.C.J., Van der Meulen, J.H.P., Michels, R.P.J., Osmond, C., Barker, D.J.P., Hales,
C.N. & Bleker, O.P. (1998), Glucose tolerance in adults after prenatal exposure to famine, The Lancet, 351, 173–77.
Rich-Edwards, J. W. , Stampfer, M. J. , Manson, J. E., Rosner, B. , Hankinson, S. E., Colditz,
G. A., Willett, W. C. & Hennekens, C. H. (1997), Birth weight and risk of cardiovascular disease in a cohort of women followed up since 1976, BMJ, 315, 396-400.
Robinson, T. & Raisler, J. (2005), ``Each one is a doctor for herself'': Ramadan fasting
among pregnant Muslim women in the United States, Ethnicity & Disease, 15(1 Suppl 1), S1-99-103.
Roseboom, T.J., Van der Meulen, J.H.P., Osmond, C., Barker, D.J.P., Ravelli, A.C.J.,
Schroeder-Tanka, J.M., Van Montfrans, G.A., Michels, R.P.J. & Bleker, O.P. (2000), Coronary heart disease after prenatal exposure to the Dutch famine, 1944–45, Heart, 84, 595–598.
Schaefer, U.M., Songster, G., Xiang, A., Berkowitz, K., Buchanan, T.A., & Kjos, S.L.
(1997), Congenital malformations in offspring of women with hyperglycemia first detected during pregnancy. Am J Obstet Gynecol, 177,1165-1171.
Seckl, J.R. & Holmes, M.C. (2007), Mechanisms of Disease: glucocorticoids, their placental
metabolism and fetal ‘programming’ of adult pathophysiology, Nat Clin Pract Endocrinol Metab, 3, 479–488.
Strauss, J., Beegle, K., Sikoki, B., Dwiyanto, A., Herawati, Y. & Witoelar, F. (2004), The
Third Wave of the Indonesia Family Life Survey (IFLS3): Overview and Field Report. Working paper, WR-144/1-NIA/NICHD, RAND.
62
Trivers, R.L. & Willard, D.E. (1973), Natural Selection of Parental Ability to Vary the Sex Ratio of Offspring, Science, 179(4068), 90 – 92.
Unicef (2008), The State of the World’s Children 2008, New York, USA: Unicef.
CENTRE FOR ECONOMIC PERFORMANCE Recent Discussion Papers
925 Stephen J. Redding The Empirics of New Economic Geography
924 Rafael Gomez Alex Bryson Tobias Kretschmer Paul Willman
Employee Voice and Private Sector Workplace Outcomes in Britain, 1980-2004
923 Bianca De Paoli Monetary Policy Under Alterative Asset Market Structures: the Case of a Small Open Economy
922 L. Rachel Ngai Silvana Tenreyro
Hot and Cold Seasons in the Housing Market
921 Kosuke Aoki Gianluca Benigno Nobuhiro Kiyotaki
Capital Flows and Asset Prices
920 Alex Bryson John Forth Patrice Laroche
Unions and Workplace Performance in Britain and France
919 David Marsden Simone Moriconi
‘The Value of Rude Health’: Employees’ Well Being, Absence and Workplace Performance
918 Richard Layard Guy Mayraz Stephen Nickell
Does Relative Income Matter? Are the Critics Right?
917 Ralf Martin Laure B. de Preux Ulrich J. Wagner
The Impacts of the Climate Change Levy on Business: Evidence from Microdata
916 Paul-Antoine Chevalier Rémy Lecat Nicholas Oulton
Convergence of Firm-Level Productivity, Globalisation, Information Technology and Competition: Evidence from France
915 Ghazala Azmat Nagore Iriberri
The Importance of Relative Performance Feedback Information: Evidence from a Natural Experiment using High School Students
914 L Rachel Ngai Robert M. Samaniego
Accounting for Research and Productivity Growth Across Industries
913 Francesco Caselli Tom Cunningham
Leader Behavior and the Natural Resource Curse
912 Marco Manacorda Edward Miguel Andrea Vigorito
Government Transfers and Political Support

911 Philippe Aghion John Van Reenen Luigi Zingales
Innovation and Institutional Ownership
910 Fabian Waldinger Peer Effects in Science – Evidence from the Dismissal of Scientists in Nazi Germany
909 Tomer Blumkin Yossi Hadar Eran Yashiv
The Macroeconomic Role of Unemployment Compensation
908 Natalie Chen Dennis Novy
International Trade Integration: A Disaggregated Approach
907 Dongshu Ou To Leave or Not to Leave? A Regression Discontinuity Analysis of the Impact of Failing the High School Exit Exam
906 Andrew B. Bernard J. Bradford Jensen Stephen J. Redding Peter K. Schott
The Margins of US Trade
905 Gianluca Benigno Bianca De Paoli
On the International Dimension of Fiscal Policy
904 Stephen J. Redding Economic Geography: A Review of the Theoretical and Empirical Literature
903 Andreas Georgiadis Alan Manning
Change and Continuity Among Minority Communities in Britain
902 Maria Bas Trade, Technology Adoption and Wage Inequalities: Theory and Evidence
901 Holger Breinlich Chiara Criscuolo
Service Traders in the UK
900 Emanuel Ornelas John L. Turner
Protection and International Sourcing
899 Kosuke Aoki Takeshi Kimura
Central Bank's Two-Way Communication with the Public and Inflation Dynamics
898 Alan Manning Farzad Saidi
Understanding the Gender Pay Gap: What’s Competition Got to Do with It?
897 David M. Clark Richard Layard Rachel Smithies
Improving Access to Psychological Therapy: Initial Evaluation of the Two Demonstration Sites
The Centre for Economic Performance Publications Unit
Tel 020 7955 7284 Fax 020 7955 7595 Email [email protected] Web site http://cep.lse.ac.uk