cep discussion paper no 911 february 2009 innovation and
TRANSCRIPT

CEP Discussion Paper No 911
February 2009
Innovation and Institutional Ownership
Philippe Aghion, John Van Reenen and Luigi Zingales
Abstract We find that institutional ownership in publicly traded companies is associated with more innovation
(measured by cite-weighted patents). To explore the mechanism through which this link arises, we
build a model that nests the lazy-manager hypothesis with career-concerns, where institutional owners
increase managerial incentives to innovate by reducing the career risk of risky projects. The data
supports the career concerns model. First, whereas the lazy manager hypothesis predicts a substitution
effect between institutional ownership and product market competition (and managerial entrenchment
generally), the career-concern model allows for complementarity. Empirically, we reject substitution
effects. Second, CEOs are less likely to be fired in the face of profit downturns when institutional
ownership is higher. Finally, using instrumental variables, policy changes and disaggregating by type
of owner we find that the effect of institutions on innovation does not appear to be due to endogenous
selection.
JEL Classifications: O31, O32, O33, G20, G32
Keywords: Innovation, institutional ownership, career concerns, R&D, productivity
This paper was published as part of the Centre’s Productivity and Innovation Programme. The Centre
for Economic Performance is financed by the Economic and Social Research Council.
Acknowledgements This paper is produced as part of the project Science, Innovation, Firms and Markets in a Globalised
World (SCIFI-GLOW), a Collaborative Project funded by the European Commission’s Seventh
Research Framework Programme, Contract number SSH7-CT-2008-217436. Any opinions expressed
here are those of the author(s) and not those of the European Commission. We would like to thank
Tim Besley, Patrick Bolton, Florian Ederer, Oliver Hart, Mark Saunders, David Scharfstein, Jean
Tirole, and participants in seminars at the New Orleans AEA, Chicago, CIAR, LSE, MIT/Harvard,
NBER, Stanford and ZEW Mannheim for helpful comments and assistance. Brian Bushee, Darin
Clay, Adair Morse and Ray Fisman have been extremely generous with their comments and helping
us with their data. Van Reenen gratefully acknowledges the financial support of the ESRC through the
Centre for Economic Performance, Zingales the Initiative on Global Markets and the Stigler Center at
the University of Chicago.
Philippe Aghion is a Professor of Economics at Harvard University. John Van Reenen is
Director of the Centre for Economic Performance and Professor of Economics at the London School
of Economics. Luigi Zingales is Professor of Entrepreneurship and Finance at the University of
Chicago Booth School of Business.
Published by
Centre for Economic Performance
London School of Economics and Political Science
Houghton Street
London WC2A 2AE
All rights reserved. No part of this publication may be reproduced, stored in a retrieval system or
transmitted in any form or by any means without the prior permission in writing of the publisher nor
be issued to the public or circulated in any form other than that in which it is published.
Requests for permission to reproduce any article or part of the Working Paper should be sent to the
editor at the above address.
P. Aghion, J. Van Reenen and L. Zingales, submitted 2009
ISBN 978-0-85328-344-7

Innovation is the main engine of growth. But what determines a �rm�s ability
to innovate? Innovating requires taking risk and forgoing current returns in the
hope of future ones. Furthermore, while any type of �nancing is plagued by moral
hazard and adverse selection, the �nancing of innovation is probably the most
vulnerable to these problems (Arrow, 1962) since the information that needs to
be conveyed is hard to communicate to outsiders. This paper is a �rst attempt at
analyzing the corporate governance of innovation and more speci�cally the role of
institutional owners in fostering (or retarding) innovation.
While the ability to diversify risk across a large mass of investors makes pub-
licly traded companies the ideal locus for innovation, managerial agency problems
might undermine the innovation e¤ort of these companies. In publicly traded com-
panies, the pressure for quarterly results may induce a short term focus (Porter,
1992). And the increased risk of managerial turnover (Kaplan and Minton, 2008)
might dissuade risk-averse senior managers from this activity. Finally, innova-
tion requires e¤ort and �lazy�managers might not exert enough of it. Hence, it
is especially important to study the governance of innovation in publicly traded
companies, which account for a large share of the private investments in Research
and Development (R&D).
Probably the most important phenomenon in corporate governance in the last
thirty years has been the remarkable rise in institutional ownership. While in 1970
institutions owned only 10% of publicly traded equity, by the start of 2006 they
owned more than 60% (see Figure 1). Thus, in this paper we focus on the role of
institutional ownership on the innovation activity of publicly traded companies.
Did the rise in institutional ownership increase short-termism, undermining the
innovation e¤ort? Or did it reassure managers, making them more willing to strike
for the fence? To answer these questions we assemble a rich and original panel
dataset of over 800 major US �rms over the 1990s containing time-varying infor-
2
mation on patent citations, ownership, R&D and governance. We show that there
is a robust positive association between innovation and institutional ownership
even after controlling for �xed e¤ects and other confounding in�uences. Institu-
tions have a small and positive impact on R&D, but a larger positive e¤ect on
the productivity of R&D (as measured by future cite-weighted patents per R&D
dollar).
To uncover the source of this relationship we build a model that nests the
two main reasons for this positive e¤ect. The simplest explanation is manager-
ial slack: managers may prefer a quiet life but institutional investors force them
to innovate. An alternative explanation is based on career concerns. Innovation
carries a risk for the CEO: if things go wrong for purely stochastic reasons, the
board will start to think he is a bad manager and may �re him. This generates a
natural aversion to innovation. If incentive contracts cannot fully overcome this
problem, increased monitoring can improve incentives to innovate by �insulating�
the manager against the reputational consequences of bad income realizations.
According to this view, institutional owners have better incentives (they typically
own a large share of the �rm) and abilities (they typically own stock in many �rms
so they bene�t from economies of scope in monitoring) to monitor. This more
e¤ective monitoring will therefore encourage innovation. The lazy manager hy-
pothesis predicts that product market competition and institutional ownership are
substitutes: if competition is high then there is no need for intensive monitoring as
the manager is disciplined by the threat of bankruptcy to work hard. In contrast,
our career concern model predicts that more intense competition reinforces the
positive e¤ect of institutional investment on managerial incentives.
We �nd that the positive relationship between innovation and institutional
ownership is stronger when product market competition is more intense (or when
CEOs are less �entrenched�due to protection from hostile takeovers), which is
3
consistent with the career concerns hypothesis and inconsistent with the �lazy
manager�one. Another implication of the career concern model is that the deci-
sion to �re the CEO is less a¤ected by a decline in pro�tability when institutional
investment is high. We �nd this is indeed the case. While in the absence of a
large institutional investor a decline in pro�t leads to a high probability the CEO
is dismissed, this probability drops when institutional investors own a substantial
amount of stock.
Next, we try to uncover which institutions have the biggest impact on innova-
tion by using Bushee (1998) classi�cation. We �nd that quasi-indexed institutions
(to use Bushee�s classi�cation) have no association with innovation, while other
forms of institutional owners have an equally positive association with innovation.
We also show that the e¤ect of these non-indexed institutional owners on inno-
vation appeared to grow stronger after the 1992 change in the American Proxy
Rules that increased their in�uence.
Finally, we argue that the correlation between institutional ownership and
innovation is not primarily due to a selection mechanism whereby institutions are
simply better at selecting the companies who will innovate more in the future.
We also show that the exogenous increase in institutional ownership that follows
the addition of a stock to the S&P500, has a positive e¤ect on innovation, even
for the non-indexed investors.
While there is a large literature on the e¤ect of �nancing constraints on R&D
(for surveys see Bond and Van Reenen (2007) and Hall (2002)), there is very
little on the relation between institutional ownership and innovation. Notable
exceptions are Francis and Smith (1995), who �nd a positive correlation between
ownership concentration (which includes institutions) and R&D expenditures and
Eng and Shackell (2001), who �nd a positive correlation of institutions with R&D.
In a similar vain, Bushee (1998) �nds that cuts in R&D following poor earnings
4

performance are less likely the greater is the degree of institutional ownership.
Unlike all these papers, we focus on the actual productivity of the innovation
process, rather than only on the quantity of innovative inputs (R&D expenses).
In addition, our use of an instrument and policy changes allows us to examine
the possibility that this relationship is due to institutions�ability to select the
most innovative �rms. Finally, our model allows us to probe deeper into the
fundamental agency problem underlying this relationship.
Our model is complementary to Edmans (forthcoming). He shows how in-
stitutional ability to sell improves the information embedded into prices and in
so doing improve the incentives to innovate. We take that e¤ect on prices as a
given and derive its impact on a career concern model. The most related paper
is Sapra et al (2008), who independently look at the e¤ect of takeover pressure
on innovation, using both R&D expenditures and patent citations as measures of
corporate governance.
Our paper is organized as follows. Section 1 presents the data, Section 2
the econometric framework, Section 3 the main empirical results on institutional
ownership and innovation. The model is described in Section 4 and its additional
predictions on competition and managerial exit are tested in Section 5. Section 6
discusses various attempts at dealing with the endogeneity issue. Finally, Section
7 o¤ers some concluding comments.
1. Data
We assemble a panel of �rm-level data on innovation and institutional ownership
from a variety of sources. Our starting point is Compustat, which contains ac-
counting information for all U.S. publicly listed �rms since the mid 1950s. Full
details on all the datasets are in the Appendix. While Compustat contains infor-
mation on R&D expenditures, it does not contain patent data. We obtain these
5
by using the NBER match between Compustat and the U.S. Patent and Trade-
mark O¢ ce data. This contains detailed information on almost three million U.S.
patents granted between January 1963 and December 1999 and all citations made
to these patents between 1975 and 2002 (over 16 million)1. Since the value of
these patents di¤er greatly, to capture their importance we weight them by the
number of future citations (�CITES�).
For information on institutional ownership we use the text �les of Compact
Disclosure. Ownership data includes the number of institutional owners, the num-
ber of shares issued and the percent of outstanding shares held by each institu-
tion2. The ownership data covers 91,808 �rm-year observations between 1991 and
2004 (prior to 1991 there are some inconsistencies in the reporting of the own-
ership data which is why this is our �rst year). We then matched these data
with Bushee (1998) classi�cation of institutions, to investigate whether there are
di¤erential e¤ects by the type of institutional owner.
Third, for information on CEO �ring, exits in general and other managerial
characteristics we use the data constructed by Fisman, Khurana and Rhodes-
Kropf (2005) based on careful reading of the �nancial press and the S&P Execu-
Comp database.
Finally, for information on corporate governance and state laws against hos-
tile takeovers we use the Investor Responsibility Research Center (IRRC) which
publishes detailed listings of corporate governance provisions for individual �rms
(see Gompers, Metrick and Ishii, 2003, and Pinnelle, 2000).
1See Hall, Ja¤e and Trajtenberg (2001) and Ja¤e and Trajtenberg (2002).We used Hall�supdate of the citation �les which runs through to 2002.
2All institutional organizations, companies, universities, etc. are required to �le a Form 13-Fwith the SEC on a quarterly basis if they have greater than $100 million in equity assets underdiscretionary management. All common stock holdings of 10,000 or more shares or having avalue of $200,000 or more must be reported. Throughout this paper an institutional owner isde�ned as an institution that �les a 13-F.
6

These datasets do not overlap perfectly so our baseline regressions run between
1991, the �rst year of clean ownership data, and 1999, the last year when we can
realistically construct citation weighted patent counts. Although the exact number
of observations depends on speci�c regression, the sample for which we run the
cite-weighted patents equation contains 6,208 observations on 803 �rms. The
main restriction from the overall Compustat database is that in the �xed e¤ects
estimators we require a �rm to have at least one cited patent in the 1991-1999
period (see Appendix A for more details).
Descriptive statistics are contained in Table 1. We see that our �rms are
large (3,700 employees and $608m in sales at the median). As is well-known the
citation and patents series are very skewed. For example, the mean number of
cite-weighted patents is 176 per �rm-year, but the median number of cites is only
7.
We �rst take a preliminary look at the data in Figures 2 and 3. Figure 2
presents the non-parametric relationship between the log of raw patent counts
and the proportion of �rm�s equity owned by institutions. Figure 3 presents the
same graph but using our preferred future citation weighted patents measure. On
both graphs we show a line of the local linear regression estimated by the lowess
smoother with a bandwidth of 0.8. There is clearly a positive correlation between
the two variables which appears to be broadly monotonic, although the positive
relation does not appear until institutions own about a quarter of the equity.
FIGURES 2 AND 3 HERE
7

2. Econometric modeling strategy
2.1. Modeling Innovation
Consider the �rst moment of the relationship between a count-based measure
of innovation (i.e. future/forward cite-weighted patents), CITESit; of �rm i in
period t and our measure of institutional ownership (INSTITit;the proportion of
stock owned by institutions). The conditional expectation, E(:j:) of this measureof innovation is3:
E(CITESitjxit; �i; � t) = exp(�INSTITit + �xit + �i + � t) (2.1)
where xit are other control variables4, �i is a correlated �rm-speci�c idiosyncratic
e¤ect and � t is a full set of time dummies. Note that we will show the importance
of di¤erent conditioning variables. In particular, we consider speci�cations with
and without controlling for the R&D stock. When the R&D stock is included
in equation (2.1) � indicates whether �rms with higher institutional ownership
(INSTITit) obtain more innovations from their R&D stock (�R&D productiv-
ity�). When we drop R&D from the right hand side � will re�ect both R&D pro-
ductivity and any additional e¤ect of institutions in raising investment in R&D.
We adopt the log-link formulation because of the count-based nature of the
data. Di¤erent assumptions concerning the error term will generate alternative
estimators even though the �rst moment (2.1) is the same. Our baseline is the
Poisson model where the mean equals the variance, but we also consider alter-
natives such as Negative Binomial which relaxes this assumption. Since all our
models will allow the standard errors to have arbitrary heteroscedacity and au-
3See Blundell, Gri¢ th and Van Reenen (1999) and Hausman, Hall and Griliches (1984) fordiscussions of count data models of innovation.
4We consider a range of control variables suggested by the existing literature on models ofinnovation and models of institutional ownership. For example we condition on size and thecapital-labor ratio (see inter alia Hall et al, 2005, and Gompers and Metrick, 2001).
8
tocorrelation (i.e. by clustering the standard errors by �rm) the exact functional
form of the error distribution is not so important.
We introduce �rm �xed e¤ects, �i; into the count data model using the �mean
scaling�method introduced by Blundell, Gri¢ th and Van Reenen (1999). This
relaxes the strict exogeneity assumption underlying the model of Hausman, Hall
and Griliches (1984) who introduced the �xed e¤ect Poisson model (analogously to
the within-group estimator for linear panel data models). Essentially, we exploit
the fact that we have a long pre-sample history on patenting behavior (of up to 25
years per �rm) to construct the pre-sample average of cite-weighted patents. This
can then be used as an initial condition to proxy for unobserved heterogeneity
under certain conditions (in particular, the �rst moments of the variables must be
stationary). Although there will be some �nite sample bias, Monte Carlo evidence
shows that this pre-sample mean scaling estimator performs well compared to
alternative econometric estimators for dynamic panel data models with weakly
endogenous variables5.
Following standard procedures we use patents that are ultimately granted
dated by year of application and we weight these by future citations through
to 2002. To deal with the censoring of patents we have done two things. First,
we estimate only until 1999 allowing for a three year window of future citations
for the last cohort of patents in the data. Second, we include a full set of time
dummies which controls for the fact that patents taken out later in the panel have
less time to be cited than patents taken out earlier in the panel6.
An advantage of these count data models is that we take the zeros explicitly
into account. We compare the results of these models with OLS estimates on the
5Blundell, Gri¢ th and Windmeijer (2002) discuss this extensively using the patents-R&Drelationship for a much earlier version of the Compustat data.
6We also experimented with re-normalizing citations taking into account the year in whichthe patent was taken out (see Hall et al, 2005). These delivered similar results to the unadjustedcitations results presented here.
9

sample of �rms with non-zero patenting, i.e.
lnCITESit = �INSTITit + �xit + �i + � t + �it (2.2)
and with models that use the arbitrary re-scaling and substitute the dependent
variable with ln(1 + CITESit):
2.2. Selection Issues
Although we lag all right hand side variables by one year, the coe¢ cient on in-
stitutional ownership may be biased for many reasons. The main concern is that
institutions select �rms to invest in on the basis of characteristics that are ob-
servable to them but not to us. For example, institutions might invest in �rms
when they anticipate a surge in their innovation. The second problem is that our
measure of institutional ownership might be noisy. Besides recording and classi�-
cation mistakes, the main concern is that di¤erent institutions might behave in a
very di¤erent way. By using the total amount of institutional ownership, rather
than the amount of institutional ownership held by �active�institutions, we are
likely to underestimate their e¤ect.
We tackle these issues in a number of ways. First, the theory delivers additional
predictions concerning the environments where institutions should have di¤eren-
tial e¤ects on innovation (and also predictions on the impact of �rm pro�tability
on CEO �ring). Second, we bring additional data on to bear on the breakdown of
institutions by type of owner (e.g. that quasi-indexed funds should have a lower
impact on innovation as they are likely to collect less information on senior man-
agers). Third, we exploit the policy change in the American Proxy Rules which
after 1992 made it easier for di¤erent institutional owners to forge alliances, moni-
tor CEOs and coordinate more activist policies. If our model is correct then there
should be a stronger e¤ect of institutions after this policy change.
10
Fourthly, while we acknowledge there is no uncontroversial instrumental vari-
able, we consider the inclusion of a �rm in the S&P500 as an instrument for insti-
tutional ownership (see Clay, 2001). An S&P500 �rm is more likely to be owned
by institutions for at several reasons. Managers of non-indexed funds are typically
benchmarked against the S&P500 so there is an incentive for them to weight their
portfolio towards �rms who are in the S&P500. Moreover, �duciary duty laws -
such as ERISA - have been shown to in�uence portfolio selection through their
implied endorsement of broad indexing7. Furthermore, openly indexed funds that
track the S&P500 will be forced to invest in this company. Finally, the exclusion
restriction is likely to be satis�ed because stocks are added to the S&P because
they represent well a certain sector, not for their expected performance. Stan-
dard and Poor�s explicitly states that �...the decision to include a company in
the S&P 500 Index is not an opinion on that company�s investment potential.�
We present some tests of this identifying assumption using information on stock
market returns in the run-up to joining the S&P500.
We implement the instrumental variable estimator by using the control func-
tion approach (see Blundell and Powell, 2001) as we use non-linear count data
models (which have a mass point at zero). We also consider two-stage least squares
results as a robustness test. Econometric details are in Appendix B.
3. Basic empirical �nding
3.1. Innovation and institutional ownership
Table 2 contains the �rst set of results where we measure innovation by cite-
weighted patent counts8. Columns (1) and (2) report the OLS estimates, where
7See Del Gurcio (1996), Wei and Pruitt (1989) or Froot, Scharfstein and Stein (1992) forsupportive evidence.
8We obtained quite similar results just using raw patent counts so we generally omit present-ing the results.
11
ln(CITES) is the dependent variable (so we drop observations with zero cites).
Columns (3) through (8) are proper count data models where we include all the
zeros and avoid arbitrary transformations9. Columns (3) through (5) report the
estimates using Poisson regressions, while columns (6) through (8) report the
Negative Binomial.
Across all the columns of Table 2 the coe¢ cient on institutional ownership lies
between 0.005 and 0.010. A marginal e¤ect of 0.007 implies that an increase of
ten percentage points in institutional ownership (e.g. from the mean of 45.5% to
55.5%) is associated with a seven percent increase in the probability of obtaining
an additional cite-weighted patent (e.g. from the mean of 176 cite weighted patents
to 188). This seems a result of economic as well as statistical signi�cance. In our
sample period between 1991 and 1999 the average level of institutional ownership
for our �rms rose from 40% to 50% (see Figure 1), so ten percentage points is a
reasonable change to consider.
Column (1) of Table 2 simply presents the OLS regressions of ln(CITES) on
institutional ownership with controls for the ln(capital/labor) ratio, ln(sales), four-
digit industry dummies and time dummies. Consistently with the bivariate rela-
tionships in Figures 2 and 3, there is a positive and signi�cant association between
innovation and the �rm�s share of equity owned by institutions. Column (2) in-
cludes the �rm�s R&D stock which, as expected has a positive and signi�cant
association with patent citations (e.g. Hall et al, 2005). Conditioning on R&D
slightly reduces the coe¢ cient of institutional ownership (from 0.006 to 0.005)
suggesting that the main e¤ect of ownership is to alter quality and/or productiv-
ity of R&D rather than through simply stimulating more R&D. If we use ln(R&D)
9See below in Appendix Table A2 for an alternative where we consider ln(1 + CITES) as analternative dependent variable and obtain similar results.
12
as a dependent variable instead of patents, institutional ownership has a signi�-
cant and positive association with �rm R&D investment (even after controlling for
�xed e¤ects) although the magnitude of this e¤ect is small (see Appendix Table
A1). Thus, previous studies which have focused on R&D as the sole measure of
innovation have underestimated the importance of institutional investors.
Columns (3) and (4) of Table 2 repeat the speci�cations of the �rst two columns
but use a Poisson count data model. Since the zeros can now be used the number
of observations increases by about half (from 4,025 to 6,208). The coe¢ cient on
institutional ownership remains signi�cant with a larger marginal e¤ects. Column
(5) includes the controls for �xed e¤ects which are are highly signi�cant, but only
reduce the marginal e¤ect of institutional ownership from 0.008 to 0.007. The
�nal three columns repeat the speci�cations but use the more general Negative
Binomial model10. The qualitative results are very similar - institutional owner-
ship has a positive and signi�cant association with innovation. Note that using
the Hausman et al (1984) approach to controlling for �xed e¤ects in count data
models leads to similar results for the coe¢ cient on institutional ownership. In an
identical speci�cation to column (8) the coe¢ cient is 0.005 with a standard error
of 0.002.
An alternative to direct measures of innovation based on cite weighted patent
counts is to consider total factor productivity. Appendix Table A3 presents some
results estimating �rm-level production functions augmented with institutional
ownership. This Table shows that institutional ownership is associated with a
signi�cant increase in total factor productivity, even after controlling for R&D
and �xed e¤ects11.10In the speci�cations where we include �xed e¤ects the coe¢ cient on the R&D stock falls
signi�cantly. This is probably because of increased attentuation as the R&D stock has relativelylittle within �rm variation (see Griliches and Mairesse, 1998).11This result is robust to more sophisticated methods of estimating production functions (e.g.
de Loecker, 2008).
13

3.2. Simply an e¤ect of ownership concentration?
Could the e¤ect of institutional owners be driven by the omission of ownership
concentration as an additional variable? To address this problem directly in unre-
ported regressions we included various measures of ownership concentration in our
baseline speci�cation. For example, we constructed a variable measuring the pro-
portion of equity held by the top �ve shareholders. This ownership concentration
measure enters positively and (weakly) signi�cantly into an innovation speci�ca-
tion that does not include any measure of institutional ownership, but its e¤ect
is driven to zero when we insert also the institutional ownership variable. For
example, in Table 2, column (5) the coe¢ cient (standard error) on the concentra-
tion measure was 0.004 (0.003) and the institutional ownership variable remained
positive and signi�cant (coe¢ cient of 0.007 with a standard error of 0.002). If we
drop institutional ownership from the regression, however, the coe¢ cient (stan-
dard error) on ownership concentration rises to 0.005 and is signi�cant at the 5%
level.
This result suggests that our �ndings are not driven by the omission of an
ownership concentration variable, but the other way around: the existing �ndings
of the positive e¤ects of ownership concentration may be due to the failure to
distinguish between institutional and non-institutional ownership. This is reason-
able. If there are some �xed costs in setting up e¤ective monitoring across �rms,
institutions, which typically hold large blocks in several companies, they can ex-
ploit these economies and monitor more e¤ectively. Second, the market can more
easily infer from the selling behavior of institutions, which have fewer liquidity
reasons to sell, than from the trading of individuals.
Overall, all these results point in the direction of a positive e¤ect of institu-
tional ownership on innovation. In the next section we address the question of
why this is the case.
14

4. The model
4.1. Basic framework
Consider the following variant of Holmstrom (1982)�s career concerns model.
There are two periods, t = 1; 2: The �rm is run by a manager with unknown
ability � 2 f�; �g: The prior beliefs about � are that:
Pr(� = �) = Pr(� = �) = 1=2:
For notational simplicity we normalize � at zero.
At the beginning of period 1, the manager decides whether or not to innovate.
We denote the innovation decision by i 2 f0; 1g: If the manager does not innovate(i = 0), then her project is assumed to be uninformative about her ability in the
sense that the revenue realization in period 1 is uncorrelated with ability. We
normalize this revenue at zero.
If the manager decides to innovate (i = 1), she must incur an innovation cost
I. Then, if the manager is of high ability (that is with � = �) the period 1 revenue
realization will be equal to:
y1 =
�1 with probability p
0 with probability 1� p
By contrast, if the manager is of low ability, the period 1 revenue realization will
be equal to:
y1 =
�1 with probability �p
0 with probability 1� �p;
where (i) � < 1; so that a lower ability manager is less successful at innovating than
a higher ability manager; and (ii) p = 1 � �; where � is the probability that the
innovation is imitated. The parameter � measures the degree of product market
competition, so where competition is more intense innovation is less likely (the
results are robust to allowing competition to have a positive e¤ect of innovation
as we discuss below).
15
4.2. A career concern model
In the main part of the model we will assume, following Holmstrom (1982),that
the manager is concerned about the impact that her decision will have on the
market perception about her ability. Absent an institutional investor, the market
infers the manager�s ability from observing the period 1 revenue realization. Thus,
by innovating, the manager exposes herself to the risk of losing her job. This in
turn limits her incentive to innovate in the �rst place. In the presence of an
institutional investor who monitors (i.e. collects independent information about
the quality of the manager), the market can infer the manager�s type also from
the institutional investor�s action.
For simplicity, in the model we assume that the institutional investor�s action
is to decide whether to keep the manager. In reality, things are more subtle. Un-
happy institutional investors do not �re the manager directly (since generally they
have no representative on the board), but can pressure the board behind the scene
to do so. Alternatively, they can exercise their exit option and sell, causing the
stock price to drop and triggering the board to act. Edmans (forthcoming) models
precisely this link between institutional investors�exit option and more informa-
tive stock prices. Either way informed institutional investors�action reveals the
manager�s type to the market independently from period 1 revenue realization.
This is all we need.
The timing of moves is as follows: (i) the manager �rst decides whether to
innovate (and pay I); (ii) the institutional investor learns about the manager�s
ability, provided she invests a monitoring cost K; (iii) the �rst period revenue is
realized and based on that realization the market updates its assessment of the
manager�s ability; (iv) the manager decides whether to stay with the �rm, based
on the comparison between her expected wage in period 2 if she remains inside
the �rm versus what she can expects if she reallocates to another sector.
16
To complete our description of the model we make three assumptions:
Assumption 1: The market for managers is fully competitive, and the second
period wage of a manager is equal to her expected ability conditional upon the
information acquired in period 1.
This assumption is identical to that made in Holmstrom (1982).
Assumption 2: The institutional investor acquires perfect information about
the manager�s ability only if the manager innovates
In the context of the model this assumption is justi�ed by the fact that only in-
novation reveals the manager�s ability, since it is only when the manager innovates
that the revenue realization depends upon her ability. Realistically, the implicit
assumption is that the investor can monitor the manager while she undertakes the
innovative strategy and assess her ability independent of the revenue realization.
If no innovative strategy is undertaken, there is no opportunity for the investor to
learn whether the outcome is due to luck or skill.12 After gathering this additional
information, the investor decides whether to have the manager �red.
Assumption 3: Managerial ability is sector-speci�c, thus what happens on
her current job is uncorrelated with the manager�s ability if she moves to another
sector.13 Moreover, a manager who reallocates to another sector incurs a switching
cost equal to �:
Assumption 3 implies that every time a manager is �red and reallocates to
another sector she has a new draw of the distribution of talents, so that her
expected utility equals to:
w =1
2� � �:
This is also the manager�s reservation wage on her current job.
12As we discuss below, if the investor were able to learn about the manager�s ability regardlessof whether she innovates institutional ownership would have a negative e¤ect on innovation,which is the opposite of what we observe in the data.13Below we analyze the polar case where skills are fully non-sector speci�c.
17
4.3. Equilibrium wage and innovation without institutional investor
We �rst consider the benchmark case where no information is acquired by the
institutional investor. We solve the model by backward induction. Suppose that
the manager has decided to innovate. Then, based on the revenue realization in
period 1, the market updates its beliefs about managerial ability using Bayes�
rule. Consequently, the manager�s wage in period 2 if she remains in the �rm, is
given by:
w2(y1) = Pr(� = �=y1)�:
If y1 = 1, then
Pr(� = �=y1 = 1) =p
p+ �p=
1
1 + �:
We thus get:
w2(y1 = 1) =�
1 + �:
Similarly,
w2(y1 = 0) = Pr(� = �=y1 = 0)� =1� p
2� p� �p�:
Assumption 4:
�
1 + �>1
2� � � = w >
1� p
2� p� �p�:
This assumption implies that the manager will leave the �rm whenever her
�rst period revenue performance is low. Note that we always have
1
1 + �>1
2>
1� p
2� p� �p;
so that there is a non-empty set of parameters (�;w; p) which satisfy Assumption
4.
18
Now, moving back to the initial stage of the game, the manager will decide to
innovate if and only if:
U(i = 0) < U(i = 1)� I;
where
U(i = 0) =1
2�
is the ex ante utility conditional upon not innovating (no information is revealed
about the manager in that case, and we implicitly assume that the manager is
then kept on the job in the same sector and paid her expected productivity), and
U(i = 1) = (1
2p+
1
2�p)
�
1 + �+ [1
2(1� p) +
1
2(1� �p)]w: (4.1)
The �rst term on the right hand side of U(i = 1) is the ex ante probability of a
high revenue realization14 times the second period wage conditional upon a high
revenue realization w2(y1 = 1): The second term is the ex ante probability of a low
revenue realization times the manager�s expected payo¤ from moving to another
�rm.
Thus
U(i = 1) =1
2p� +
1
2(2� p� �p)w:
In particular, note that
U(i = 1)� I > U(i = 0)
whenever I and � are not too large.
14That is the ex ante probability of � = � (i.e 12 ) times the probability of a high revenue
conditional upon � = � (i.e. p) plus the probability of � = � (i.e 12 ) times the probability of a
high revenue conditional upon � = � (i.e. �p)
19

4.4. Institutional investment and innovation
We now introduce the institutional investor into the analysis. By learning the true
managerial ability, the institutional investor avoids having to keep a low ability
manager. Let � denote the net expected gain from getting rid of a low ability
manager before the period 1 income realization.15
If the investor owns a fraction of the �rm�s shares16, he will choose to pay
the cost K of learning the manager�s ability whenever
� > K:
Thus, if the investor�s share of pro�ts is su¢ ciently high, he will pay the
learning cost K: In this case, the manager�s expected utility from innovating
becomes17
U(i = 1 : monitor) =1
2� +
1
2w:
We can establish:
Proposition 4.1. Monitoring by an institutional investor, which occurs when the
investor�s share of the �rm�s pro�ts is su¢ ciently large, increases the manager�s
15This gain is computed as follows. First, the wage saving in period 2 from identifying a badmanager beforehand, is equal to �pw2(y1 = 1): The expected gain of getting rid of a low abilitymanager and replacing her by a new manager, is thus equal to this expected wage savings plusthe expected gain from �nding a new manager
� =1
2�pw2(y1 = 1)�
1
2�p+
1
2:1
2(p� �)
or
� =1
2�p(
�
1 + �� 1) + 1
4(p� �);
which is positive for � su¢ ciently small.16The paper takes a partial equilibrium approach by taking the investor�s share as exoge-
nously given. Endogeneizing would involve introducing new considerations such as risk-poolingor the enhancement of managerial initiative, into the model.17When the institutional investor monitors, the manager gets � if she is found out to be of
high ability and w if she is found out to be of low ability.
20
gain from innovating. This positive e¤ect is increased with higher product market
competition �.
Proof: We have:
�U = U(i = 1 : monitor)� U(i = 1) =1
2[�(1� p)� (1� p� �p)w]:
That � > w implies immediately that �U is positive. Furthermore,
d
d�(�U) =
1
2[� � (w + �w)]
is positive since Assumption 4 has �1+�
> w. This establishes the proposition.
Corollary 4.2. Innovation takes place for a larger range of innovation costs I
when the manager is monitored by an institutional investor and this e¤ect is
stronger when competition is higher.
Proof: This results follows immediately from the fact that innovation takes
place whenever
U(i = 1 : monitor)� U(i = 0) > I;
therefore there are values of I such that
U(i = 1 : monitor)� U(i = 0) =1
2w > I >
1
2(p� 1)� + 1
2(2� p� �p)w:
Thus, institutional investment stimulates managerial innovation by insulating the
manager against the reputational risk from a bad revenue realization, and this
e¤ect is stronger when the degree of product market competition is higher (mea-
sured by the imitation probability �).
Remark 1: Consider what happens if the institutional investor �nds out
about the manager�s ability irrespective of whether the manager innovated. In
this case we have:
U(i = 0 : monitor) =1
2� +
1
2w = U(i = 1 : monitor):
21

But then the manager is deterred from innovating altogether, since
U(i = 1 : monitor)� U(i = 0 : monitor) = 0 < I:
This is clearly an extreme outcome due to the fact that innovation has no bene�ts
for the manager, but only a cost. In general, it is reasonable to assume that
innovation can bene�t the manager and that an investor who spends resources to
understand the process can acquire a better perspective about the quality of the
innovative e¤ort made, regardless of the outcome.
Remark 2: One borderline case to our model, is when managers can relocate
costlessly to other sectors (for example because basic skills are general). In this
case
� = 0
which does not violate the above assumptions, in particular Assumption 4. Thus
our above conclusions carry over to that case.
Remark 3: Suppose that, unlike what we have assumed so far, managerial
ability is the same in all sectors. In particular, a manager who is found out to be
bad in one job, is never hired by other sectors. Thus
w = 0
and therefore in the absence of an institutional investor the ex ante utility of a
manager who innovates is equal to
U(i = 1) =1
2p�;
whereas in the presence of an institutional investor who monitors the ex ante
utility conditional upon innovating is equal to
U(i = 1 : monitor) =1
2� = U(i = 0):
22
Hence, in this case, even though it increases the expected utility of a manager
who decides to innovate, monitoring by the institutional investor does not su¢ ce
to induce the manager to innovate.
Remark 4: Consider the following variant of our model where competition
also a¤ects non-innovating managers, e.g. because it forces them to relocate to
another sector. More precisely, the manager must relocate whenever the �rm is
imitated, which in turn we assume to happen with probability 2� in the absence
of innovation. We then have:
U(i = 0) = (1� 2�)12� + 2�w:
In this case, an increase in competition � increases the net gain (U(i = 1)�U(i =0) � I) of an innovating manager in the absence of institutional investor. But it
increases by even more the net gain (U(i = 1 : monitor) � U(i = 0) � I) of an
innovating manager monitored by an institutional investor. Thus the introduction
of an institutional investor magni�es the escape competition e¤ect of innovation,
which in turn reinforces the complementarity between institutional investment
and competition.
4.5. Contrasting with the �lazy manager�story
An alternative explanation to that developed so far, inspired by Hart (1983) and
Schmidt (1997), is that monitoring by institutional investors, together with the
managers�fear of losing the private bene�ts of remaining on the job, would force
the manager to innovate if they are a priori reluctant to do so.
To nest this idea into the same model we assume that the manager draws
private bene�t B from remaining on the job, but that innovating entails a private
cost I to her. Other than that, the manager does not respond to monetary
incentives, whether explicit or implicit. Finally, we assume that the institutional
23
investor will monitor with probability m (which is a function of the size of the
stake it owns). When the investor monitors, it can observe whether the manager
has innovated and can decide whether to �re her. As a result, the investor can use
the �ring threat to force the manager to innovate. The manager can also lose her
job as a result of a copycat innovation, an event that happens with probability �.
More speci�cally, the manager will choose to innovate whenever:
B � I > B(1� �)(1�m):
As in the career concern model, the higher m the more likely it is that the
manager will innovate. However, now, a higher imitation probability � will reduce
the marginal e¤ect of m on the manager�s net gain from innovating, namely [B�I � B(1 � �)(1 � m)]: Thus, unlike in Proposition 1, more competition on the
product market will reduce the e¤ect of institutional investment on managerial
innovation.
5. Testing the predictions of the model
5.1. Institutional ownership and product market competition
So far we have documented a positive association between innovation and insti-
tutional ownership. Now both the career concern model and the lazy manager
story (among other alternatives) deliver the prediction that institutional owner-
ship encourages managers to innovate. Where the two approaches di¤er is in the
interaction between institutional ownership and product market competition. In
the career concern model the two are complements (i.e. the positive e¤ect of
institutions on innovations should be stronger when competition is higher). By
contrast, in the lazy manager story competition and institutions are substitutes
(see Dryden, Nickell and Nicolitsas, 1997). Indeed, in highly competitive environ-
ments there should be little managerial slack and therefore little need for greater
24
monitoring by institutions or other mechanisms (e.g. Schmidt, 1997; Bloom and
Van Reenen, 2007).
Table 3 analyzes the interaction between institutional ownership and product
market competition. As a measure of product market competition we use 1 - the
Lerner Index in the �rm�s three digit industry18. The �rst column reproduces our
baseline �xed e¤ects Poisson model of citations (column (5) of Table 2), including
also our measure of product market competition. Competition has a positive asso-
ciation with innovation, although the e¤ect is not signi�cant, while the coe¢ cient
on institutional ownership remains positive and signi�cant.19
Column (2) introduces an interaction term between institutional ownership
and competition which is positive and signi�cant, consistent with competition
and institutional owners being complements. We then split the sample into obser-
vations with high and low competition based on the median of the Lerner Index.
In column (3) where competition is high, the coe¢ cient on institutional owner-
ship is large, positive and signi�cant whereas in column (4) where competition
is low the coe¢ cient in institutional ownership is smaller and insigni�cant (0.009
vs. 0.002). We illustrate these �ndings by plotting the implied value of patent
citations at di¤erent levels of institutional ownership in Figure 4. This shows
that it is only in the high competition regime that there is an important e¤ect of
institutions on innovation.20
18There is no perfect measure of product market competition. Aghion et al (2005) discusswhy the inverse Lerner is appropriate in these kind of models. We test for some alternativeconstructions of the Lerner as well as alternative measures of �entrenchment�below.19As with Aghion et al (2005) there is some (weak) evidence of an inverted U relationship
between innovation and competition. If we include a term in the square of the (inverse) LernerIndex it is negative, whereas the linear term remains positive. This quadratic term is insigni�-cant, however with a coe¢ cient of -6.852 and a standard error of 24.554.20A concern might be that we have allowed the Lerner Index to change over time, so instead we
consider a time invariant measure, averaging the Lerner over our sample period. We repeat the
25
At face value, Table 3 seems inconsistent with the �lazy manager�interpreta-
tion and consistent with the simple career concerns model outlined in the previous
section.
5.2. Institutional ownership and CEO entrenchment
A further implication of the lazy manager hypothesis is that the bene�ts of in-
stitutional ownership should be felt most sharply where agency costs are higher
and managers are more �entrenched�. Apart from higher competition there are
several settings where managers have less ability to slack. First, where the market
for corporate control is strong (e.g. via a credible threat of a hostile takeover),
this should also discipline CEOs. Second, if shareholders have more power the
CEO will be less entrenched. As before, under the lazy manager hypothesis insti-
tutional ownership should have more of an e¤ect when managers are entrenched,
while under the career concern hypothesis the impact of institutional ownership
on innovation should be weaker when managers are entrenched.
To measure the degree of entrenchment of CEOs it has become standard to use
the index introduced by Gompers et al (2003), which is built upon the number of
anti-takeovers provision in place (including relevant state anti-takeover statues).
The shortcomings of this measure is that most of these devices were introduced
in the late 1980s, when hostile takeovers were rampant, and became e¤ectively
useless with the demise of hostile takeovers. Nevertheless, that boards were willing
to approve these statues provide an indication of the degree of control of the CEO
over the board.
speci�cations using this alternative measure in the �nal four columns with very similar results.For example, the interaction term between competition and institutional ownership in column(3) remained positive and signi�cant (coe¢ cient of 0.087 with a standard error of 0.033). Wealso estimated the Lerner correcting for capital intensity as in Aghion et al (2005) and Nickell(1996). Again, the interaction term remained positive and signi�cant (a coe¢ cient of 0.104 witha standard error of 0.043).
26
Table 4 investigates the interaction between managerial entrenchment and in-
stitutional ownership. As a measure of entrenchment, the �rst four columns use
the index for state takeover laws and the last four columns the Gompers Index of
CEO power. The �rst column presents the linear e¤ects of institutional ownership
and state laws protecting �rms from takeovers. The coe¢ cient on institutional
ownership is positive whereas that on the entrenchment variable is negative (but
insigni�cant). Column (2) includes an interaction which has a negative and sig-
ni�cant coe¢ cient. This is the opposite of the lazy manager story - empirically,
institutional ownership is less e¤ective when managers are more entrenched. Col-
umn (3) estimates the model on the sub-sample when the legal index is below
the median level of entrenchment, while column (4) uses the sub-sample when
managers are more entrenched. Consistently with column (3), the coe¢ cient on
institutional ownership is large and signi�cant in the sub-sample where managers
are not entrenched whereas it is smaller and insigni�cant when state laws protect
managers.
Column (5) of Table 4 shows that ownership is still positively correlated with
innovation even when we condition on the Gompers Index (higher values indicate
more CEO power over shareholders). The Gompers Index is negatively associ-
ated with innovation and this is signi�cant at the 10% level. In column (6) the
interaction between institutional ownership and the Gompers Index is negative
and signi�cant. This again suggests that institutions are more important when
managers are less entrenched. When we split the sample by the median value
of the Gompers Index, institutional ownership looks equally important in both
sub-samples. So there is no evidence of a substitution e¤ect between institutional
ownership and entrenchment
27
The evidence from Table 4 (like that of Table 3) appears to be inconsistent with
the lazy manager interpretation of the positive e¤ect of institutional ownership
on innovation, and more in line with the career concern one.
5.3. Institutional ownership and managerial turnover
A third prediction of the career concern model is that managerial turnover should
be less sensitive to performance in the presence of institutional investors. By
contrast, under the lazy manager story institutional ownership should not reduce
the impact of bad realization of pro�ts on the probability of managerial turnover.
If anything it should increase that impact because it makes it easy to resolve the
collective action problem in �ring the manager.
Table 5 presents evidence on the interaction between pro�tability changes and
institutional ownership on forced managerial turnover. We use the data from
Fisman et al (2005)21 which has information on CEO �rings constructed from
detailed readings of contemporary accounts in the �nancial press such as the
Wall Street Journal. Since this covered only the larger S&P500 �rms until 1995,
we only have a sub-sample of our main dataset (249 �rms)22. The dependent
variable in Table 5 is equal to unity if a CEO was �red and zero otherwise,
and we estimate by probit. We start by replicating Fisman et al (2005). In
particular, in the �rst column we regress whether the CEO was �red that year
on the lagged change in pro�tability (pro�ts normalized by assets). Like them,
we �nd that higher pro�tability growth is associated with a (weakly) signi�cantly
lower probability that the CEO will be �red. Column (2), then, interacts the
pro�tability variable with the proportion of equity owned by institutions. The
21We would like to thank Ray Fisman for kindly supplying the data to us.22Given this much smaller sample size we use ownership in the �rst year of our sample (1991).
This enables us to use more of the CEO �ring data. We assume ownership does not changemuch for four years prior to 1991 and after 1991 and estimate on 1988-1995 in column (1) ofTable 5. We show our results are robust to using a shorter time window in column (4).
28
coe¢ cient on this interaction is positive and signi�cant and indicates that �rms
with greater institutional ownership are signi�cantly less likely to �re their CEOs
when there is �bad news�. This is in line with the career concern model presented
above and inconsistent with the lazy manager story. Since Figure 2 suggested that
institutional ownership mattered when more than 25% of the stock was owned by
institutions, instead of the continuous variable in column (3) as interaction term
we use an indicator variable equal to one if institutional owners controlled more
than a quarter of shares. The results are very similar.
Column (4) presents a robustness test obtained by restricting the sample to
the post 1991 period. If anything the results are stronger. Since some CEOs leave
their job also voluntarily, as a control we can test whether institutional owner-
ship a¤ects also these voluntary departures. To do so, we change the dependent
variable in column (5) to be only voluntary departures (i.e. all exits except �r-
ings). Consistent with our interpretation the coe¢ cient on the interaction term is
insigni�cant (and has actually a reversed sign). So Table 5 is broadly consistent
with our careers concern model suggesting that institutional ownership partially
insulates CEOs from short-term pressures (and in so doing encourages them to
invest in risky innovation).
5.4. Disaggregating the type of Institutional Ownership
We can gather additional insights on the mechanism through which institutional
ownership a¤ects innovation by di¤erentiating among institutions on the basis of
their style of investing. Bushee (1998) classi�es institutional investors in three
groups: �quasi-indexed�(institutions that are widely diversi�ed and do not trade
much), �dedicated� (institutions whose holdings are more concentrated, but do
not trade much), and �transient�(institutions whose holdings are diversi�ed but
29
trade often in and out from individual stocks). We follow this classi�cation.23 In
our sample quasi-indexers own 25% of �rm equity, dedicated investors owned 10%
and transients own 8%.
Table 6 presents the results from using this information. Column (1) presents
the baseline results on the sub-sample where we were able to obtain this classi-
�cation. It shows that the results remain quite stable: there is still a positive
and signi�cant association between institutional owners and innovation with a
very similar marginal e¤ect to Table 2. In column (2) we divide the institutional
ownership variable into the three groups. The coe¢ cients on the dedicated and
transient institutions are positive, signi�cant and similar to each other (we can-
not reject that they take the same coe¢ cient, p-value = 0.599). By contrast, the
coe¢ cient on the quasi-indexed institutions is close to zero and insigni�cant. In
column (3) we illustrate this by including the standard institutional ownership
variable from column (1) and the proportion of equity owned by quasi-indexed
institutions. The marginal e¤ect of institutions as a whole is 0.015 and signi�cant
whereas the coe¢ cient on quasi-indexed institutions is negative and signi�cant.
Taken literally, this indicates that there is a negative e¤ect of switching ownership
towards quasi-indexers from other institutions (and no e¤ect from increasing their
share of equity at the expense of non-institutional owners).
The absence of any e¤ect of quasi-indexed funds is broadly consistent with the
model we present. The fact that dedicated institutions are not much better than
transient institutions is perhaps more surprising. One possible interpretation is
that for institutional investor to have an impact they need to have either signi�cant
23We are very grateful to Brian Bushee for providing us with this data. See Data Appendixfor how Bushee constructs these measures.
30
voice (as dedicated institution) or a strong exit option (as transient ones). Quasi-
indexers seem to have neither.
Next, we consider a policy change in corporate governance rules that was favor-
able to institutional ownership. In 1992 the American Proxy Rules were changed
making it easier for di¤erent institutional owners to forge alliances, monitor CEOs
and coordinate more activist policies24. If our model is correct then there should
be a stronger e¤ect of institutions after this policy change. Column (4) is our
preferred �breakdown�speci�cation where we drop the quasi-indexed funds from
the de�nition of institutional ownership. The �nal column adds an interaction
between non-indexed institutional ownership and the post policy period. Exactly
as we would predict, this interaction is positive and signi�cant at the 10% level.
The coe¢ cient on institutions increases from 0.010 to 0.017 following the rule
change. Furthermore, the positive interaction between competition and institu-
tional ownership shown in column (2) of Table 3 is also signi�cantly stronger in
the post-policy period (p-value = 0.003).
6. Some attempts at controlling for endogeneity
As discussed above, we are concerned that the positive correlation between in-
stitutional ownership and innovation is driven by selection. The evidence in the
previous section suggests that this is not likely to be the case as the pattern of
results is consistent with our career concerns model where institutional owners
have a positive e¤ect on innovation. In this section we consider an instrumental
variable strategy using the �rms�s addition to the S&P500 index. As discussed in
24The changes permitted an unlimited number of shareholders to coordinate activist e¤ortsand share information about governance issues in their portfolio �rms provided they suppliedthe SEC with a brief description of any substantive discussions. Before this change if a group often or more owners wanted to discuss issues such as �rm or management performance a detailed�ling had to be made to the SEC prior to the meeting.
31
Section 2, additions to the S&P500 are likely to increase institutional ownership
because fund managers are typically benchmarked against this index, but are un-
likely to have a direct impact on future innovation (we noted that Standard &
Poor themselves claim that their selection rule is independent of their expectation
of the �rm�s future performance).
Table 7 reports the results. The �rst column reproduces the basic Poisson
results of Table 2 column (3) and column (2) presents the �rst stage where we
regress institutional ownership on a dummy equal to unity if the �rm was in the
S&P500 (and all the other controls). As expected the instrument is positive and
highly signi�cant. Institutions own about 9.2 percentage points more of the equity
in �rms that are included in the S&P500 Index than we would expect from the
observable characteristics of these �rms. Column (3) presents estimates where we
use the control function method of dealing with endogeneity25. Interestingly, the
ownership variable remains signi�cant with a coe¢ cient that is much larger than
column (1). This OLS bias towards zero could be because of attenuation bias
related to measurement error or because institutions pick �rms who are under-
performing (but may improve in the future). At face value, this result suggests
that we are underestimating the positive e¤ect of ownership on innovation by
treating institutions as exogenous.
The next three columns of Table 7 repeats the speci�cations but include �xed
e¤ects. Column (4) shows the standard result treating institutional ownership as
exogenous and column (5) has the �rst stage. The external instrument remains
highly signi�cant. In column (6) we control for the endogeneity and again, the
coe¢ cient on ownership remains positive and signi�cant with a higher marginal
25This uses just a �rst order term in the polynomial for the control function. The secondorder term was insigni�cant (p-value = 0.274). The coe¢ cient on institutional ownership was0.035 (standard error = 0.015) when both linear and quadratic terms of the control functionwere included.
32
e¤ect than column (4). Note, however, that exogeneity is not rejected at the 5%
level in column (6) whereas it is rejected at the 1% level in column (3). This
suggests that the �xed e¤ects deal with a substantial part of the endogeneity
bias, and to the extent it is a problem the bias causes us to underestimate the
importance of institutions26.
A concern with this instrumental variable strategy is that the �rst stage could
be driven solely by the quasi-indexers which appear to have little association
with innovation. To examine this we present the results just using non-indexed
institutions in columns (7) through (9). Column (7) repeats the basic Poisson
speci�cation and column (8) shows that S&P membership increases non-indexed
institutional share by 2.7 percentage points. This is lower than for quasi-indexers,
but is still signi�cant27. In column (9) we show that this re�ned institutional
ownership variable has a large and signi�cant e¤ect on innovation, even after
controlling for selection.
While the inclusion to the S&P500 should be orthogonal to a �rm�s future
performance, it is not completely random. Standard & Poor�s wants to ensure
that the index is representative and that is relatively stable over time. Hence,
it avoids choosing companies that are at serious risk of bankruptcy and prefers
26A concern with this IV strategy is that the treatment �rms (which joined the S&P500) arenot well matched with the rest of the sample (the implicit control group). To examine this weuse a propensity score matching technique. We estimate the propensity to join the S&P500 as afunction of the exogenous �rm characteristics (including �xed e¤ects). Very few �rms that aremembers of the S&P500 have a predicted probability below 0.24 (roughly the sample median).Hence, we trim the sample below this threshold so that treatment and control have commonsupport and re-estimate the IV results on this sub-sample. The results (not reported) are verysimilar: we estimate a treatment e¤ect of 0.026 (standard error = 0.013) on this sub-sample of3,099 observations compared to 0.029 (standard error = 0.013) on the full sample of 6,028.27If we use quasi-indexers as the dependent variable in column (8) the coe¢ cient on the
S&P500 dummy is unsurprisingly much larger: 8.446 with a standard error of 0.636.
33

large companies with a good past performance. Thus, in order to be included in
the S&P500 index a company must have been small in the past (which explains
why was not already in the index) and large today. Given these rules, it is not
surprising that companies that are added on average experience large stock re-
turns in the three years preceding their inclusion. As a result, the apparent e¤ect
of S&P500 addition on innovation could be purely spurious, due to the fact that
stock performance anticipates the rise in innovation. To test this we control in
the column (10) for the cumulative stock returns over the previous three years
as an additional variable. Note that this �run up�exercise is a very tough test,
as innovation is positively associated with stock prices (see Hall et al, 2005) thus
making it hard to identify an independent e¤ect of institutional ownership on
innovation. Although the coe¢ cient on the run-up is positive and weakly signif-
icant, the coe¢ cient on institutional ownership falls only slightly (from 0.083 to
0.082) and remains signi�cant.
To further validate the quality of the instrument we perform a small event
studies on the change in institutional ownership and cite-weighted patents around
the time a stock is added to the S&P500 index. We use a window of 7 years,
three years prior to the year when the �rm was added, the year itself and three
years after the �rm was added (a similar story emerges from adding or subtracting
an extra year to the window). In Figure 5 we show that the year in which the
�rm joined the S&P500 there was a large increase in institutional ownership. In
Figure 6 we see that cite-weighted patents increase after joining. There is little
contemporaneous e¤ect but in the following two years the number of cite-weighted
patents increased by about 2.6, a 37% increase with respect to the median.
One potential source of concern with this picture is that the e¤ect of institu-
34

tional ownership on innovation occurs too rapidly: the bulk being concentrated in
the �rst two to three years after the S&P 500 addition. This result, however, is not
inconsistent with our interpretation. At any moment in time in high R&D com-
panies there are a lot of unpatented ideas, since patenting them requires money
and e¤ort. Consider, for example, the Xerox Palo Alto Research Center (PARC)
in the 1970s where several famous ideas (like the computer mouse and Graphical
User Interface) were around, but were not patented. When a manager decides
to focus more on innovation, the �rst e¤ect we should observe (as we do) is an
increase in the number of patented ideas. Obviously, if this push were not followed
by an equal push in all the phases of the innovation process, it will lead just to
a temporary blip in the number of new patents. Since we observe a sustained
increase, it implies that this push toward more innovation a¤ects all the phases
of the innovation process.
7. Conclusions
Given the importance innovation has on growth and the wealth of nations, it is
paramount to understand the incentives to innovate at the �rm level. This paper
tries to do so by studying the relationship between innovation and institutional
ownership.
Contrary to the view that institutional ownership induces a short-term focus
in managers, we �nd that their presence boosts innovation, even after accounting
for an increase in R&D and the potential endogeneity of institutional ownership.
This positive impact could derive from the disciplinary e¤ect of institutions on
lazy managers or from the reassurance they provide to managers concerned about
their career. We develop a simple model that nests these two hypotheses, we are
able to derive three implications able to distinguish between them. In all three
cases, the data seems to support the career concern model and reject the lazy
35
manager one. Institutions are more important for innovation when competition
is higher and when managers are less entrenched. Moreover, the probability of
CEO �ring after poor performance is reduced with more institutional ownership.
The evidence from disaggregating institutional ownership, using policy changes
and membership of the S&P500 as an instrument suggest that these relationships
do not simply arise from endogenous selection.
These results suggest that risk considerations at the managerial level play an
important role in preventing innovation. Given the positive externality innovation
entails (see Bloom, Schankerman and Van Reenen, 2007), it might be useful to
think about public policies able to reduce the innovation risk for managers of
publicly traded companies such as greater Board representation of institutional
investors.
This paper has also interesting implications for corporate governance in gen-
eral. If career concerns, not the desire to live a quiet life or to build an empire,
are the main source of managerial agency problems, then many of the public pol-
icy prescriptions change. For example, boards composed mostly of outsiders can
jeopardize the ability of the board to separate luck from skill in the CEO perfor-
mance, increasing her risk aversion and jeopardizing innovation (see also Adams
and Ferreira, 2005).
There are many directions this research could and should be taken. One po-
tentially important omission is that we have abstracted away from the impact
institutional owners may have on the design of incentive contracts to overcome
the disincentives to innovate (and how this interacts with competition). This
would be a fruitful line of future research currently pursued by Manso (2008) and
Holden (2008).
36
ReferencesAdams, Renee and Ferreira, Daniel (2007) \A Theory of Friendly Boards�Journal of Finance, 62 (1). pp. 217-250.
Aghion, Philippe, Bloom, Nick, Blundell, Richard,Gri¢ th, Rachel andHowitt, Peter (2005) �Competition and Innovation: An Inverted U Relation-ship?�Quarterly Journal of Economics, 120(2), pp. 701-728
Arrow, Kenneth (1962) �Economic Welfare and the Allocation of Resourcesfor Innovation�, in Richard Nelson (ed.), The Rate and Direction of InventiveActivity. Chicago: Chicago University Press
Bartelsman, Erik, Becker, Randy and Gray, Wayne (2000) NBER Pro-ductivity Database, available at www.nber.org
Bloom, Nick, Schankerman, Mark and Van Reenen, John (2007) �Tech-nology Spillovers and Product Market rivalry�NBER Working Paper No. 13060
Bloom, Nick and Van Reenen, John (2007) �Measuring and Explaining Man-agement Practices across �rms and countries�, Quarterly Journal of Economics,122(4), 1351�1408
Blundell, Richard and Powell, James (2004) �Endogeneity in Semiparamet-ric Binary Response Models�Review of Economic Studies 71(3) pp. 655-679
Blundell, Richard, Gri¢ th, Rachel and Van Reenen, John (1999) �MarketShares, Market Value and Innovation in a Panel of British Manufacturing Firms�Review of Economic Studies, 66, pp. 529-554
Blundell, Richard, Gri¢ th, Rachel and Windmeijer, Frank (2002) �Indi-vidual E¤ects and Dynamic Feedback in Count Data Models�Journal of Econo-metrics, 108, pp. 113-131
Bond, Stephen and Van Reenen, John (2007) �Micro-econometric models ofinvestment and employment�in Jim Heckman and Ed Leamer (eds) Handbook ofEconometrics Volume VI, Amsterdam: Kluwer
Bushee, Brian (1998) �The In�uence of Institutional Investors on Myopic R&DInvestment Behavior�Accounting Review, 73(3), 305-353
Bushee, Brian (2001) �Do Institutional Investors Prefer Near-Term Earningsover Long-Run Value?�Contemporary Accounting Research, 18(2) pp. 207-46
Clay, Darin (2001) �Institutional Ownership, CEO Incentives and Firm Value�University of Chicago PhD Dissertation
Chen, Xia, Harford, Jarrad and Kai Li (2007) �Monitoring: Which Institu-tions Matter�Journal of Financial Economics, 86, 279-305
37

Criscuolo, Chiara (2006) �Does Ownership Structure A¤ect Productivity: Ev-idence from the UK�, mimeo University College London
De Loecker, Jan (2008) �Product Di¤erentiation, Multiproduct Firms and Es-timating the Impact of Trade Liberalization on Productivity�, Princeton mimeo
Del Guercio, Diane (1996) �The Distorting E¤ect of the Prudent Man Law ofInstitutional Equity Investments�Journal of Financial Economics, 40, pp. 31-62
Demsetz, Harold and Lehn, Kenneth (1985) �The Structure of CorporateOwnership: Causes and Consequences� Journal of Political Economy, 93, pp.1155-1177
Dilhon, Upinder and Johnson, Herb (1991) �Changes in the Standard andPoor�s 500 List�Journal of Business, 64(1), pp.75-85
Dryden, Neil, Nickell, Stephen and Nicolitsas, Daphne (1997) �WhatMakes Firms Perform Well?�, European Economic Review, 41, pp.783-96.
Edmans, Alex, (forthcoming), �Blockholder, Trading, Market E¢ ciency, andManagerial Myopia,�, Journal of Finance.
Eng, Li and Shackell, Margaret (2001) �The Impact of Long-Run Perfor-mance Plans and Institutional Ownership for Firms Research and DevelopmentExpenditures�Journal of Accounting, Auditing and Finance, 16(2), 1177-149
Fisman, Ray, Khurana, Rakesh and Rhodes-Kropf, Matthew (2005)�Governance and CEO Turnover: Do Something or Do the Right Thing?�Uni-versity of Columbia mimeo
Froot, Kenneth, Scharfstein, David and Stein, Jeremy (1992) �Herd onthe Street: Informational Ine¢ ciencies in a Market with Short-Term Speculation�,Journal of Finance, 47, pp. 1461-1484
Gompers, Paul, and Metrick, Andrew (2001), �Institutional Investors andEquity Prices�Quarterly Journal of Economics, 118, pp. 107-155
Gompers, Paul, Ishi, Joy and Metrick, Andrew (2003), �Corporate Gov-ernance and Equity Prices" Quarterly Journal of Economics, 118, pp. 107-155
Gomes, Joao (2001) �Financing Investment�American Economic Review 91(5),pp. 1263-1285
Griliches, Zvi and Mairesse, Jacques (1998) �Production Functions: TheSearch for Identi�cation�in Strom, Steinar (ed) Econometrics and Economic The-ory in the Twentieth Century, Cambridge University Press
Hall, Bronwyn (2002) �The Financing of Innovation�NBER Working PaperNo. 8773
38
Hall, Bronwyn, Ja¤e, Adam and Trajtenberg, Manuel (2001) �The NBERPatent Citation Data File: Lessons, Insights and Methodological Tools�. NBERWorking Paper 8498.
Hall, Bronwyn, Ja¤e, Adam and Trajtenberg, Manuel (2005), �MarketValue and Patent Citations: A First Look�, RAND Journal of Economics, 36,pp.16-38
Hart, Oliver (1983) �Market Competition as an Incentive Scheme�Bell Journalof Economics, 14(2), 366-382
Holden, Richard (2008) �Does CompetitionMake FirmsMore E¢ cient?�mimeo,MIT
Hausman, Jerry, Hall, Bronwyn and Griliches, Zvi (1984) �EconometricModels for Count Data and an Application to the Patents-R&D Relationship�Econometrica, 52, pp. 909-938
Holmstrom, Bengt (1982) �Managerial Incentive Problems - A Dynamic Per-spective� in Essays in Economics and Management in honor of Lars Wahlbeck,Helsinki: Swedish School of Economics
Ja¤e, Adam and Trajtenberg, Manuel (2002), Citations and Innovations:A Window on the Knowledge Economy, Cambridge: MIT Press
Kaplan, Steven and Bernadette Minton (2006) �How Has CEO TurnoverChanged? Increasingly Performance Sensitive Boards and Increasingly UneasyCEOs�, Chicago mimeo
Kaplan, Stephen and Zingales, Luigi �Do Investment-Cash Flow Sensitiv-ities Provide Useful Measures of Financial Constraints?� Quarterly Journal ofEconomics, 112(1), 169-215
Klette, Tor and Griliches, Zvi (1996), �The Inconsistency of Common ScaleEstimators When Output Prices Are Unobserved and Endogenous,� Journal ofApplied Econometrics, 11, pp. 343-361
Manso, Gustavo (2007) �Motivating Innovation�, mimeo, MIT
Morck, Randall, Schleifer, Andrei and Vishny, Robert (1988) �Manage-ment Ownership and Market Valuation: An Empirical Analysis�Journal of Fi-nancial Economics, 20, pp. 293-315
Morck, Randall, Schleifer, Andrei and Vishny, Robert (1989) �AlternativeMechanisms for Corporate Control�American Economic Review, 79, 842-852
Pinnell, Maria Carmen S. (2000) State Takeovers Laws, Washington DC: In-vestor Responsibility Research Center
Porter, Michael (1992) �Capital Disadvantage: America�s Failing Capital In-
39
vestment System�Harvard Business Review (September-October), pp. 65-83.
Sapra, Haresh, Ajay Subramanian, Krishnamurthy Subramanian, (2008),�Corporate Governance and Innovation: Theory and Evidence�, Chicago mimeo.
Schumpeter, Joseph (1942) Capitalism, Socialism and Democracy, New York:Harper and Brothers
Schelberg, Neil and Bitman, Craig (1999) �Corporate Governance underERISA: The Power to In�uence Corporations� Employee Bene�ts Journal, 24,21-28
Schmidt, Klaus (1997), �Managerial Incentives and Product Market Competi-tion�, Review of Economic Studies, LXIV (2), 191-213.
Appendices
A. Data Appendix
A.1. Main Dataset
We combine several �rm level panel datasets. Because we are using patents(weighted by total future citations) as our key measure of innovation, we relyon the matching of the US Patents and Trademark Dataset (USPTO) with Com-pustat lodged at the NBER (see Hall et al, 2001, and Ja¤e and Trajtenberg,2002, for details). The matching was performed based on the ownership struc-ture in 1989, so our sample is of a cohort of �rms who were publicly listed in1989 or entered subsequently. We follow these �rms through the 1990s (includingthose who subsequently died). We use the updated version of the NBER matchcontaining patent citations through to 2002 (downloaded from Bronwyn Hall�swebsite, http://elsa.berkeley.edu/~bhhall/bhdata.html). All patents granted be-tween 1963 and 1999 are included (just under 3 million patents) and citationinformation is available from 1975 to 2002 (over 16 million citations). The needto have some patent data is the main reason why our sample is much smaller thanthe full Compustat sample.The second dataset we draw on is the text �les from Compact Disclosure.
This is an electronic version of the 13-F forms that all institutional organiza-tions are obliged to lodge at the SEC on a quarterly basis if they have at least$100m in equity assets under discretionary management. The data includes thenumbers of institutional owners, the number of share issues and the percentageof outstanding shares held by each institution (our key measure of institutional
40
ownership). This dataset is not wholly consistent before 1990, so we use own-ership data from 1991 onwards. The ownership data covers almost all the �rmsin the Computsat-USPTO match (we lose only three observations due to own-ership changes in 1990), so the merging of the two datasets is straightforward.Compact Disclosure identi�es �ve types of institutional owners: banks, insurancecompanies, investment companies, independent investment advisors and �other�which includes internally managed pension funds, colleges and universities, foun-dations and other miscellaneous institutions and endowments (law �rms, privateinvestment partnerships, etc.).The merged dataset consists of 1,078 �rms and 7,923 observations between
1991 (the �rst year of the ownership data) and 1999 (the last year of the patentdata). We are able to use lags of patent information back to 1969, however, soour patent stock variables include all this past information. Since our preferredregressions use �xed e¤ects we condition our sample on �rms who received at leastcitations and had at least two years of non-missing data on all variables between1991 and 1999 over this period. This leaves us with 6,208 observations on 803�rms which is our baseline sample. The reason for the drop in sample is thatmany �rms in the NBER USPTO/Compustat match patented prior to 1991 butnot in the 1991-1999 period, and of those that did patent, many did not receivecitations.Descriptive statistics are in Table 1.
A.2. Other datasets for robustness tests
In the robustness tests we also use other �rm-level datasets. These datasets coversub-samples of the �rms in our database, so this is the reason why the number ofobservations in smaller in these regressions.
A.2.1. Entrenchment of managers
For information on governance we use the Investor Responsibility Research Center(IRRC) which publishes detailed listings of corporate governance provisions forindividual �rms in Corporate Takeover Defenses. The data on state takeoverlegislation is from Pinnell (2000). Gompers et al (2003) construct an index ofCEO power (relative to shareholders) as the sum of up to 24 unique provisionsto do with how incumbent mangers can be protected. We split out the state lawsub-index of Gompers Index which is the simple average of the existence of sixdi¤erent laws.
41
A.2.2. CEO Firings Data
This data is from Fisman, Khurana and Rhodes-Kropf (2005). They followed asample of largest �rms in 1980 (the publicly traded Fortune 500 companies plusthe 100 largest commercial banks, 100 largest �nancial services �rms, 100 largestretail �rms and 50 largest transportation �rms) until 1995. The key variable theyconstruct is whether the CEO was forcibly removed from his job, as opposed toanother form of exit (e.g. if retired or ill). They do this by examining all CEOdepartures prior to the age of 61. They then use reports from the Wall StreetJournal and New York Times to distinguish the type of exit. For informationon managerial characteristics (such as CEO tenure) we use the S&P ExecuCompdatabase. We are grateful to Ray Fisman for supplying us with this data. Wemeasure pro�tability following Fisman et al (2005) by the ratio of operating pro�tsdivided by the sum of current assets and property, plant and equipment. Tenureis the number of years a CEO has held this position.
A.2.3. Disaggregation by type of Institutional Owner
It is possible to distinguish the name of the institutional owner from CompactDisclosure. Following Bushee (1998, 2001) we divide all institutions into threetypes: quasi-indexers, transient and dedicated. Bushee determined which �rmsfall into which category by using a factor analysis method where a larger groupof institutional ownership characteristics are reduced to three: BLOCK (whetherthe institution tends to have large blockholdings or is very diversi�ed), PTURN(whether the portfolio held is stable or turns over rapidly) and MOMENTUM(whether the institution reduces shareholding quickly in response to �bad news�).Using these three factors he creates three clusters of institutional ownership types.�Quasi-indexers�have low values of all three factors: they are diversi�ed, havelow turnover and are relatively insensitive to bad news. �Dedicated� investorshave high blockholdings in single �rms, low portfolio turnover and are insensitiveto bad news. The �nal group of �transients�have low blockholdings in any one�rm, high turnover and high momentum. Brian Bushee kindly supplied us withthe data breaking institutional owners into these three classes for more recentdata that we could match in to our sample.Using this categorization we can calculate for each year, what proportion of a
�rm�s shares are held by each of these institutional investors. To ensure that thedata is consistent with use only observations where our measure of institutionalownership and Bushee�s where within 5% of each other (the correlation betweenthe two measures is over 0.99).
42
B. Econometric Details
Under exogeneity of INSTITit we have the moment condition:
E(�itjINSTITit; xit; �i; � t) = 1where �it is the error term associated with the sample analog of (2.1). This willnot hold under endogeneity of INSTITit:We assume that the instrument zit(membership of the S&P500) obeys the reduced form:
INSTITit = �zit + �oxit + �oi + � ot + �oit
withE(�oitjxoit; �oi ; � ot ) = 1
so that controlling for �oit in the conditional moment condition is su¢ cient to re-move the endogeneity bias. In estimation we use the extended moment condition:
E(CITESitjxit; �i; � t; �oit) = exp(�INSTITit + �xit + �i + � t + �(�oit)) (B.1)
where �(�oit) is a non-parametric function of �oit (empirically we used a polynomial
series expansion). A simple test for exogeneity is the joint signi�cance of theresiduals in equation (B.1).
43
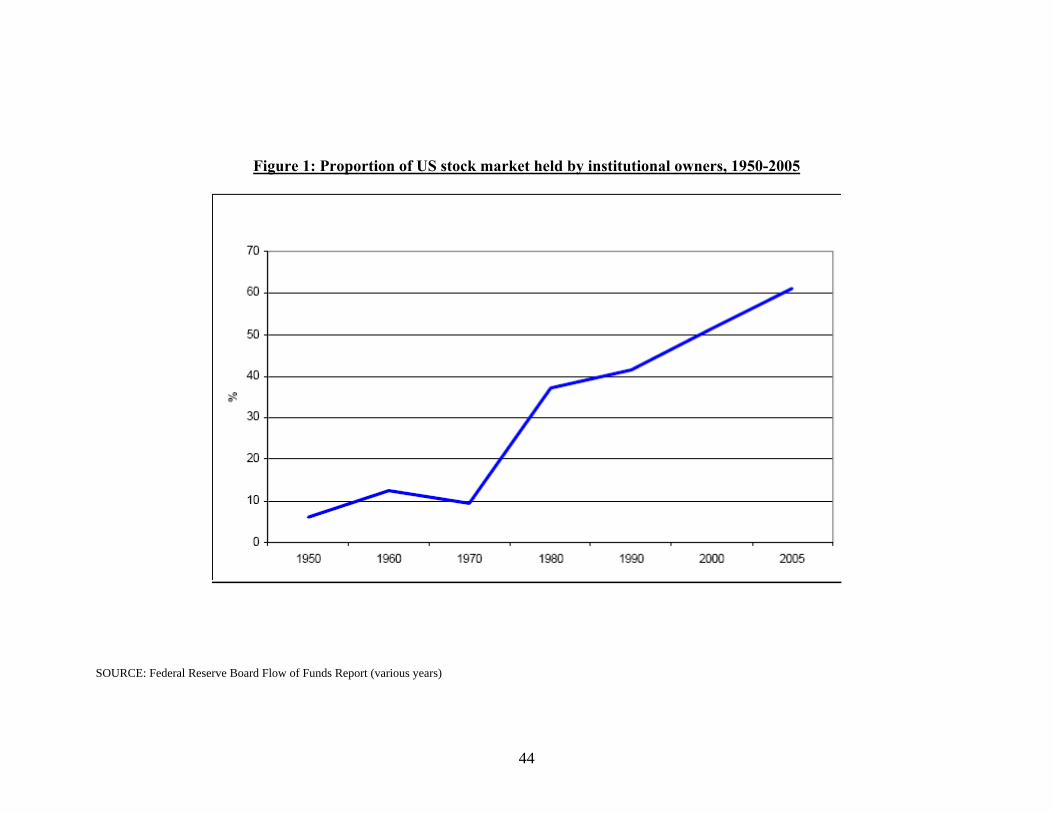
44
Figure 1: Proportion of US stock market held by institutional owners, 1950-2005
SOURCE: Federal Reserve Board Flow of Funds Report (various years)
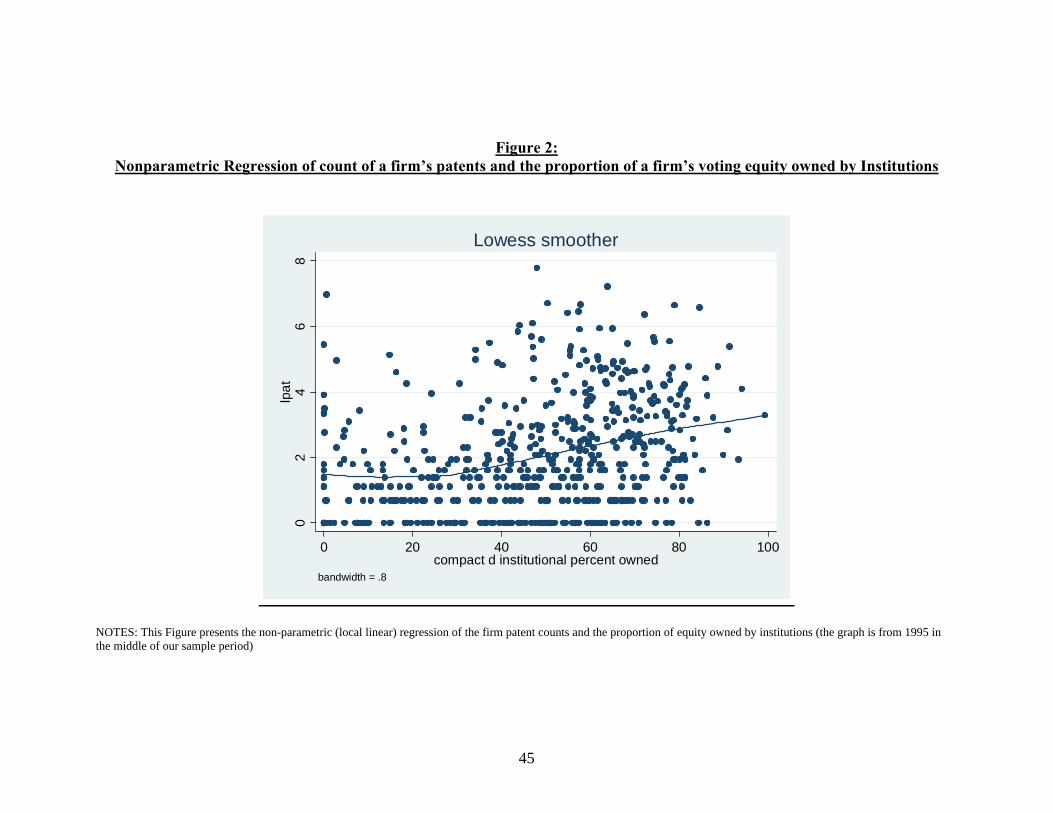
45
Figure 2:
Nonparametric Regression of count of a firm’s patents and the proportion of a firm’s voting equity owned by Institutions
02
46
8lp
at
0 20 40 60 80 100compact d institutional percent owned
bandwidth = .8
Lowess smoother
NOTES: This Figure presents the non-parametric (local linear) regression of the firm patent counts and the proportion of equity owned by institutions (the graph is from 1995 in the middle of our sample period)

46
Figure 3: Nonparametric Regression of ln(CITES) - patents weighted by future citations - and the proportion of a firm’s stock owned by Institutions
02
46
810
lcite
s
0 20 40 60 80 100compact d institutional percent owned
bandwidth = .8
Lowess smoother
NOTES: This Figure presents the non-parametric (local linear) regression of firm patents weighted by future citations and the proportion of equity owned by institutions (the graph is from 1995 in the middle of our sample period)
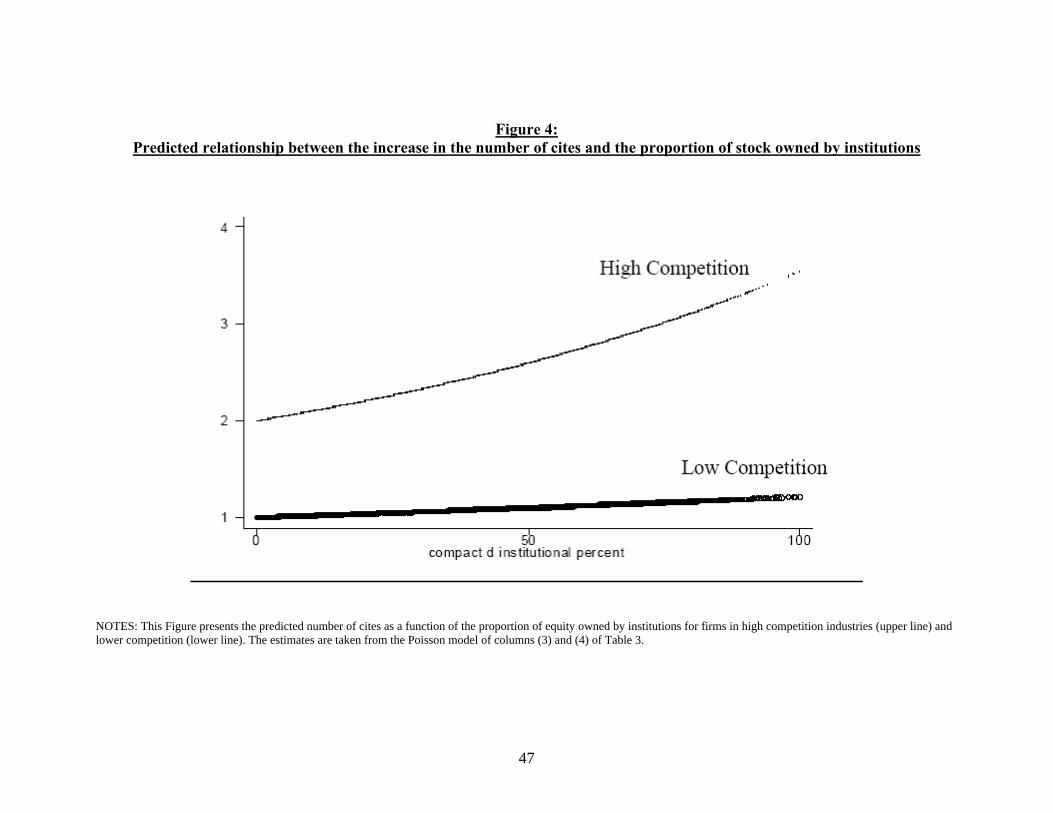
47
Figure 4: Predicted relationship between the increase in the number of cites and the proportion of stock owned by institutions
NOTES: This Figure presents the predicted number of cites as a function of the proportion of equity owned by institutions for firms in high competition industries (upper line) and lower competition (lower line). The estimates are taken from the Poisson model of columns (3) and (4) of Table 3.

48
Figure 5: Change in the cumulative proportion of institutional ownership before and after a firm is added to the S&P500 (7 year window)
NOTES: The graph shows the cumulated mean change in the proportion of equity owned by institutions up to three years before and three years after a firm becomes a member of the S&P 500 Index (years -1 to 0 is the year the firm was added). For example, in the year a firm joined the S&P 500 8.1 percentage points more of its stock became owned by institutions. The following year institutional owners increased this proportion by 4.2 percentage points, and so on.
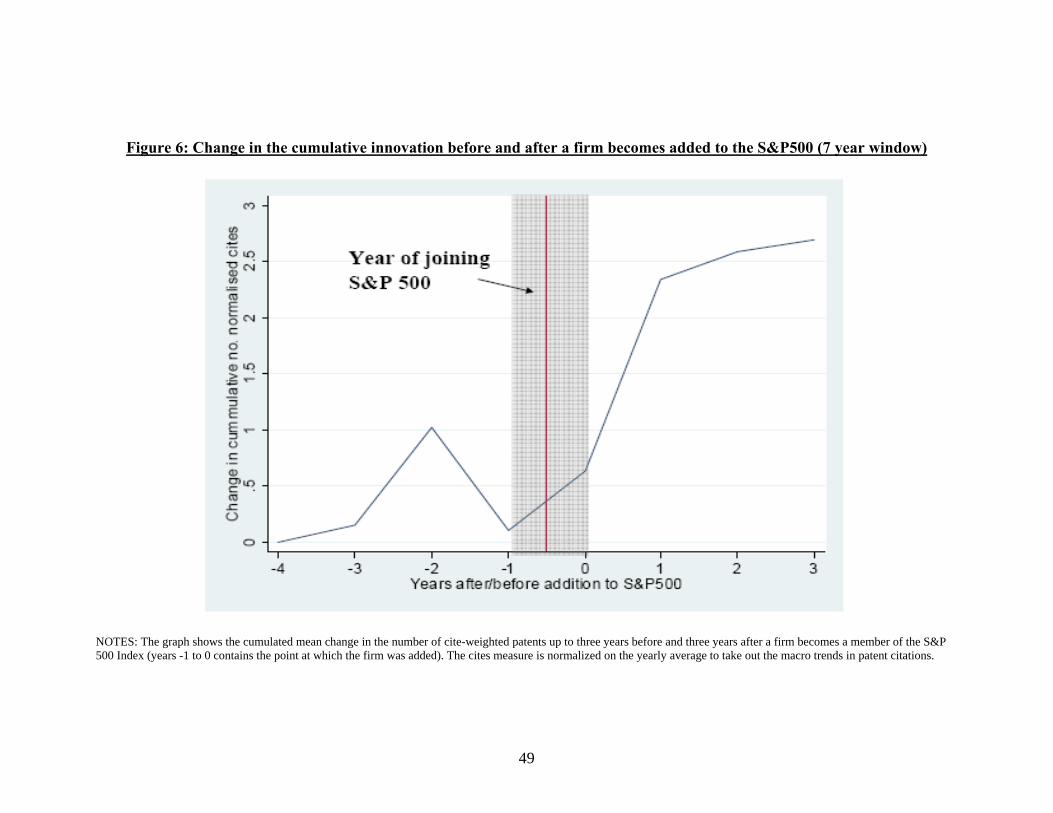
49
Figure 6: Change in the cumulative innovation before and after a firm becomes added to the S&P500 (7 year window)
NOTES: The graph shows the cumulated mean change in the number of cite-weighted patents up to three years before and three years after a firm becomes a member of the S&P 500 Index (years -1 to 0 contains the point at which the firm was added). The cites measure is normalized on the yearly average to take out the macro trends in patent citations.
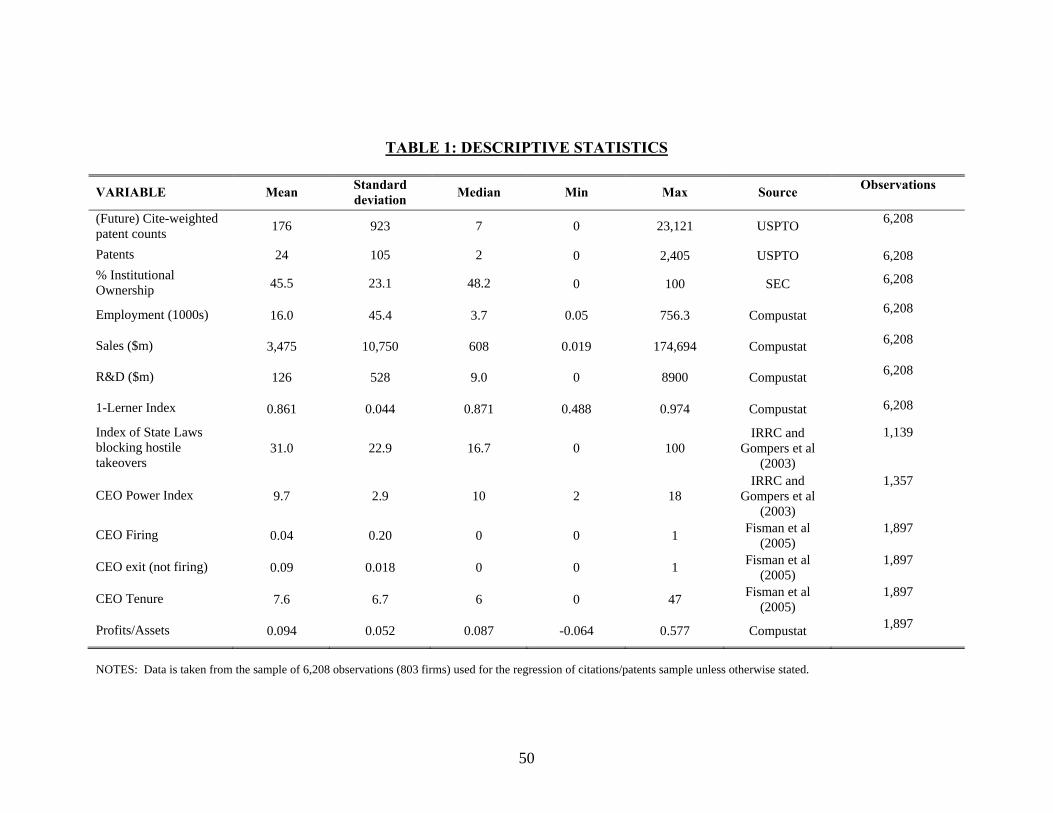
50
TABLE 1: DESCRIPTIVE STATISTICS
VARIABLE Mean Standard
deviation Median Min Max Source Observations
(Future) Cite-weighted patent counts 176 923 7 0 23,121 USPTO 6,208
Patents 24 105 2 0 2,405 USPTO 6,208 % Institutional Ownership 45.5 23.1 48.2 0 100 SEC 6,208
Employment (1000s) 16.0 45.4 3.7 0.05 756.3 Compustat 6,208
Sales ($m) 3,475 10,750 608 0.019 174,694 Compustat 6,208
R&D ($m) 126 528 9.0 0 8900 Compustat 6,208
1-Lerner Index 0.861 0.044 0.871 0.488 0.974 Compustat 6,208
Index of State Laws blocking hostile takeovers
31.0 22.9 16.7 0 100 IRRC and
Gompers et al (2003)
1,139
CEO Power Index 9.7 2.9 10 2 18 IRRC and
Gompers et al (2003)
1,357
CEO Firing 0.04 0.20 0 0 1 Fisman et al (2005)
1,897
CEO exit (not firing) 0.09 0.018 0 0 1 Fisman et al (2005)
1,897
CEO Tenure 7.6 6.7 6 0 47 Fisman et al (2005)
1,897
Profits/Assets 0.094 0.052 0.087 -0.064 0.577 Compustat 1,897
NOTES: Data is taken from the sample of 6,208 observations (803 firms) used for the regression of citations/patents sample unless otherwise stated.
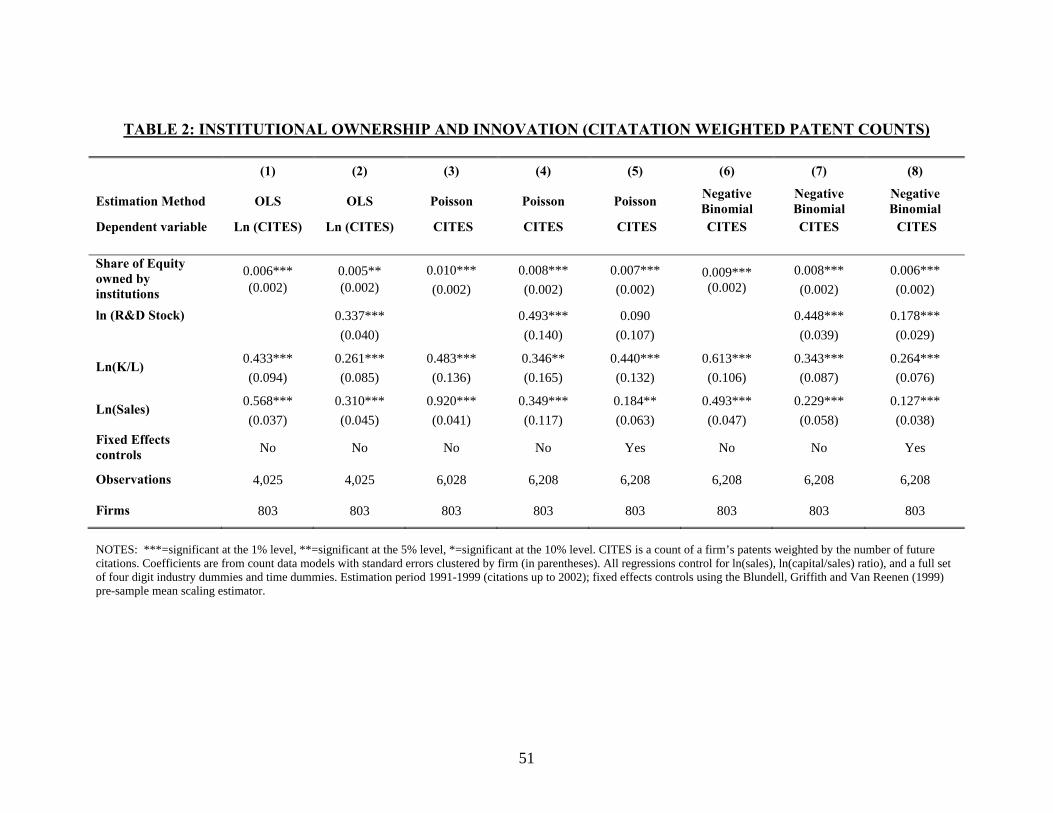
51
TABLE 2: INSTITUTIONAL OWNERSHIP AND INNOVATION (CITATATION WEIGHTED PATENT COUNTS)
(1) (2) (3) (4) (5) (6) (7) (8)
Estimation Method OLS OLS Poisson Poisson Poisson Negative Binomial
Negative Binomial
Negative Binomial
Dependent variable
Ln (CITES)
Ln (CITES)
CITES
CITES
CITES
CITES
CITES
CITES
Share of Equity owned by institutions
0.006*** (0.002)
0.005** (0.002)
0.010*** (0.002)
0.008*** (0.002)
0.007*** (0.002)
0.009*** (0.002)
0.008*** (0.002)
0.006*** (0.002)
ln (R&D Stock)
0.337*** (0.040)
0.493*** (0.140)
0.090 (0.107)
0.448*** (0.039)
0.178*** (0.029)
Ln(K/L) 0.433*** (0.094)
0.261*** (0.085)
0.483*** (0.136)
0.346** (0.165)
0.440*** (0.132)
0.613*** (0.106)
0.343*** (0.087)
0.264*** (0.076)
Ln(Sales) 0.568*** (0.037)
0.310*** (0.045)
0.920*** (0.041)
0.349*** (0.117)
0.184** (0.063)
0.493*** (0.047)
0.229*** (0.058)
0.127*** (0.038)
Fixed Effects controls No No No No Yes No No Yes
Observations 4,025 4,025 6,028 6,208 6,208 6,208 6,208 6,208
Firms 803 803 803 803 803 803 803 803
NOTES: ***=significant at the 1% level, **=significant at the 5% level, *=significant at the 10% level. CITES is a count of a firm’s patents weighted by the number of future citations. Coefficients are from count data models with standard errors clustered by firm (in parentheses). All regressions control for ln(sales), ln(capital/sales) ratio), and a full set of four digit industry dummies and time dummies. Estimation period 1991-1999 (citations up to 2002); fixed effects controls using the Blundell, Griffith and Van Reenen (1999) pre-sample mean scaling estimator.
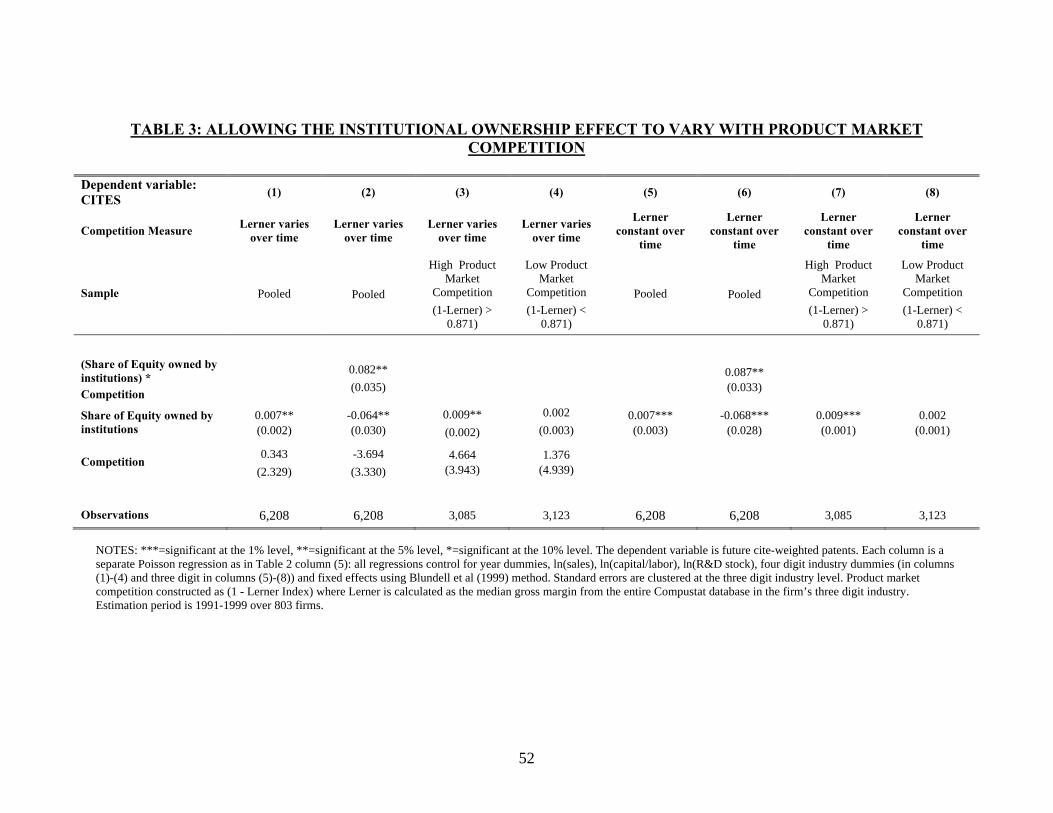
52
TABLE 3: ALLOWING THE INSTITUTIONAL OWNERSHIP EFFECT TO VARY WITH PRODUCT MARKET COMPETITION
Dependent variable: CITES
(1) (2) (3) (4) (5) (6) (7) (8)
Competition Measure Lerner varies over time
Lerner varies over time
Lerner varies over time
Lerner varies over time
Lerner constant over
time
Lerner constant over
time
Lerner constant over
time
Lerner constant over
time
Sample Pooled Pooled
High Product Market
Competition (1-Lerner) >
0.871)
Low Product Market
Competition (1-Lerner) <
0.871)
Pooled Pooled
High Product Market
Competition (1-Lerner) >
0.871)
Low Product Market
Competition (1-Lerner) <
0.871)
(Share of Equity owned by institutions) * Competition
0.082** (0.035)
0.087** (0.033)
Share of Equity owned by institutions
0.007** (0.002)
-0.064** (0.030)
0.009** (0.002)
0.002 (0.003)
0.007*** (0.003)
-0.068*** (0.028)
0.009*** (0.001)
0.002 (0.001)
Competition 0.343 (2.329)
-3.694 (3.330)
4.664 (3.943)
1.376 (4.939)
Observations 6,208 6,208 3,085 3,123 6,208 6,208 3,085 3,123
NOTES: ***=significant at the 1% level, **=significant at the 5% level, *=significant at the 10% level. The dependent variable is future cite-weighted patents. Each column is a separate Poisson regression as in Table 2 column (5): all regressions control for year dummies, ln(sales), ln(capital/labor), ln(R&D stock), four digit industry dummies (in columns (1)-(4) and three digit in columns (5)-(8)) and fixed effects using Blundell et al (1999) method. Standard errors are clustered at the three digit industry level. Product market competition constructed as (1 - Lerner Index) where Lerner is calculated as the median gross margin from the entire Compustat database in the firm’s three digit industry. Estimation period is 1991-1999 over 803 firms.
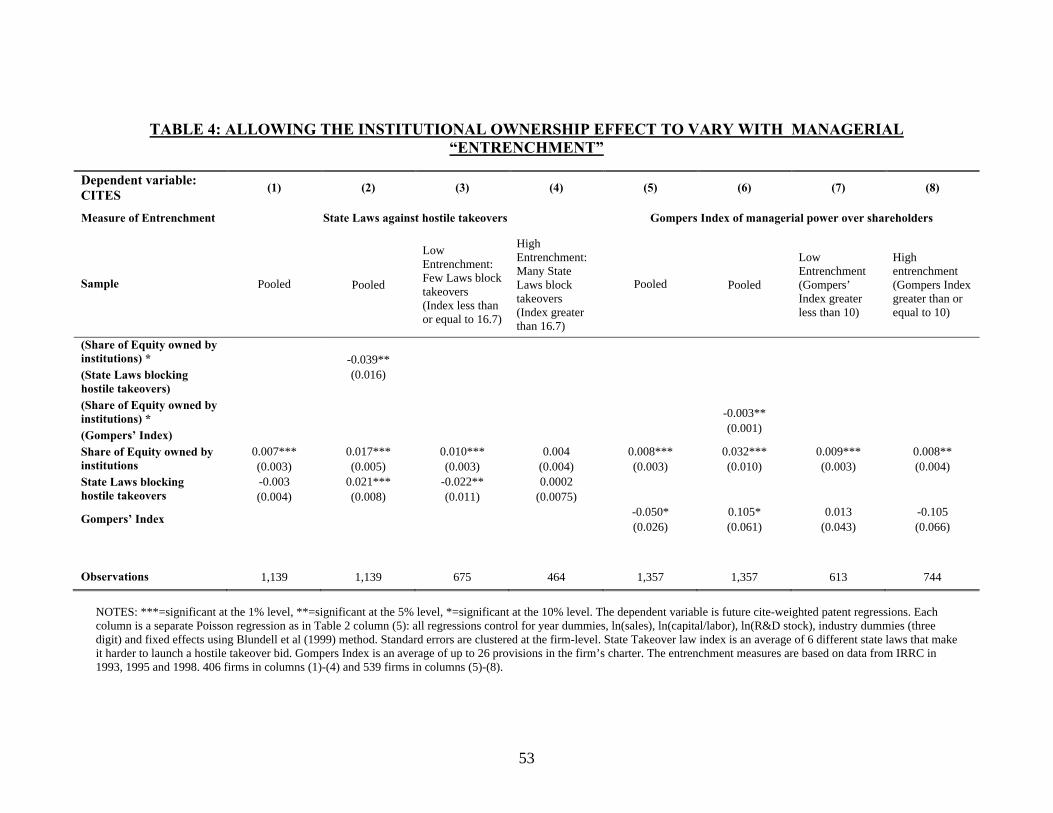
53
TABLE 4: ALLOWING THE INSTITUTIONAL OWNERSHIP EFFECT TO VARY WITH MANAGERIAL “ENTRENCHMENT”
Dependent variable: CITES
(1) (2) (3) (4) (5) (6) (7) (8)
Measure of Entrenchment State Laws against hostile takeovers Gompers Index of managerial power over shareholders
Sample Pooled Pooled
Low Entrenchment: Few Laws block takeovers (Index less than or equal to 16.7)
High Entrenchment: Many State Laws block takeovers (Index greater than 16.7)
Pooled Pooled
Low Entrenchment (Gompers’ Index greater less than 10)
High entrenchment (Gompers Index greater than or equal to 10)
(Share of Equity owned by institutions) * (State Laws blocking hostile takeovers)
-0.039** (0.016)
(Share of Equity owned by institutions) * (Gompers’ Index)
-0.003** (0.001)
Share of Equity owned by institutions
0.007*** (0.003)
0.017*** (0.005)
0.010*** (0.003)
0.004 (0.004)
0.008*** (0.003)
0.032*** (0.010)
0.009*** (0.003)
0.008** (0.004)
State Laws blocking hostile takeovers
-0.003 (0.004)
0.021*** (0.008)
-0.022** (0.011)
0.0002 (0.0075)
Gompers’ Index -0.050* (0.026)
0.105* (0.061)
0.013 (0.043)
-0.105 (0.066)
Observations 1,139 1,139 675 464 1,357 1,357 613 744
NOTES: ***=significant at the 1% level, **=significant at the 5% level, *=significant at the 10% level. The dependent variable is future cite-weighted patent regressions. Each column is a separate Poisson regression as in Table 2 column (5): all regressions control for year dummies, ln(sales), ln(capital/labor), ln(R&D stock), industry dummies (three digit) and fixed effects using Blundell et al (1999) method. Standard errors are clustered at the firm-level. State Takeover law index is an average of 6 different state laws that make it harder to launch a hostile takeover bid. Gompers Index is an average of up to 26 provisions in the firm’s charter. The entrenchment measures are based on data from IRRC in 1993, 1995 and 1998. 406 firms in columns (1)-(4) and 539 firms in columns (5)-(8).
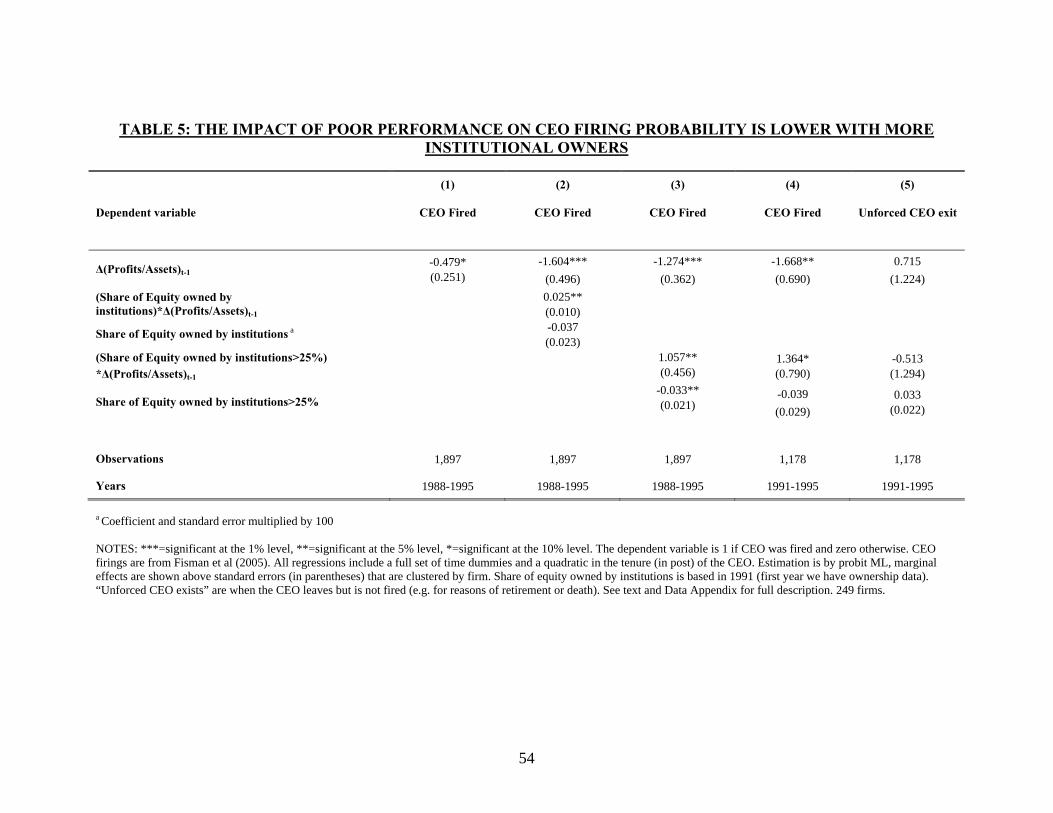
54
TABLE 5: THE IMPACT OF POOR PERFORMANCE ON CEO FIRING PROBABILITY IS LOWER WITH MORE INSTITUTIONAL OWNERS
(1) (2) (3) (4) (5)
Dependent variable CEO Fired CEO Fired CEO Fired CEO Fired Unforced CEO exit
Δ(Profits/Assets)t-1 -0.479* (0.251)
-1.604*** (0.496)
-1.274*** (0.362)
-1.668** (0.690)
0.715 (1.224)
(Share of Equity owned by institutions)*Δ(Profits/Assets)t-1
0.025** (0.010)
Share of Equity owned by institutions a -0.037 (0.023)
(Share of Equity owned by institutions>25%) *Δ(Profits/Assets)t-1
1.057**
(0.456) 1.364* (0.790)
-0.513 (1.294)
Share of Equity owned by institutions>25% -0.033**
(0.021) -0.039 (0.029)
0.033 (0.022)
Observations 1,897 1,897 1,897 1,178 1,178
Years 1988-1995 1988-1995 1988-1995 1991-1995 1991-1995
a Coefficient and standard error multiplied by 100 NOTES: ***=significant at the 1% level, **=significant at the 5% level, *=significant at the 10% level. The dependent variable is 1 if CEO was fired and zero otherwise. CEO firings are from Fisman et al (2005). All regressions include a full set of time dummies and a quadratic in the tenure (in post) of the CEO. Estimation is by probit ML, marginal effects are shown above standard errors (in parentheses) that are clustered by firm. Share of equity owned by institutions is based in 1991 (first year we have ownership data). “Unforced CEO exists” are when the CEO leaves but is not fired (e.g. for reasons of retirement or death). See text and Data Appendix for full description. 249 firms.

55
TABLE 6: DISAGGREGATING OWNERSHIP BY TYPE OF INSTITUTION
(1) (2) (3) (4) (5)
Dependent variable CITES CITES CITES CITES CITES
Share of Equity Owned by institutions 0.007** (0.002)
0.015*** (0.004)
Share of Equity Owned by quasi-indexed institutions 0.001
(0.004) -0.015* (0.007)
Share of Equity Owned by “dedicated” institutions
0.013** (0.006)
Share of Equity Owned by “transient” institutions
0.017** (0.007)
Share of equity owned by non-quasi-indexed funds 0.015***
(0.004) 0.010* (0.005)
Post Policy* Share of equity owned by non-indexers 0.007*
(0.004)
Exogeneity test
Observations 3,074 3,074 3,074 3,074 3,074
NOTES: *** = significant at the 1% level, **=significant at the 5% level, *=significant at the 10% level. The dependent variable is CITES the number of patents weighted by future citations. Poisson models with controls for fixed effects (Blundell et al, 1999), ln(sales), ln(capital/labor ratio), ln(R&D stock) and full set of time dummies and four digit industry dummies. Standard errors clustered by firm. All specifications identical to Table 2 column (5). The definitions of different institutional ownership types follows Bushee (1998) – see Data Appendix for details. 659 firms.
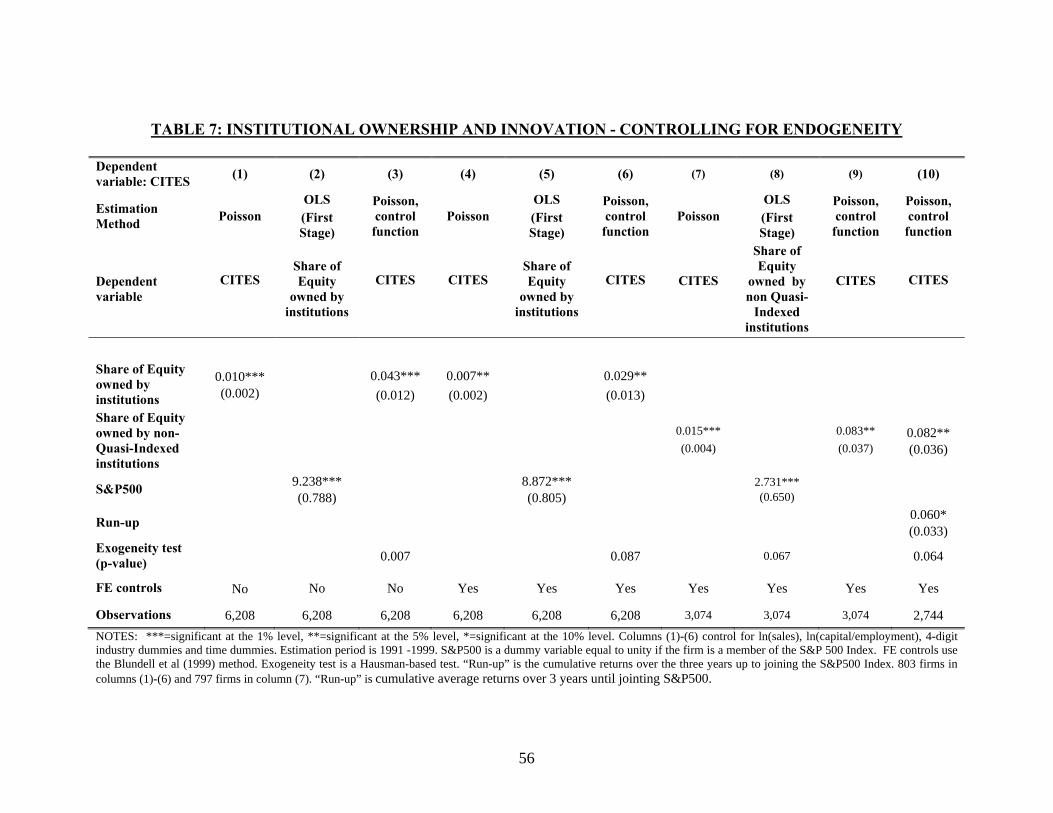
56
TABLE 7: INSTITUTIONAL OWNERSHIP AND INNOVATION - CONTROLLING FOR ENDOGENEITY Dependent variable: CITES (1) (2) (3) (4) (5) (6) (7) (8) (9) (10)
Estimation Method Poisson
OLS (First Stage)
Poisson, control function
Poisson OLS (First Stage)
Poisson, control function
Poisson OLS (First Stage)
Poisson, control
function
Poisson, control
function
Dependent variable
CITES
Share of Equity
owned by institutions
CITES
CITES
Share of Equity
owned by institutions
CITES
CITES
Share of Equity
owned by non Quasi-
Indexed institutions
CITES
CITES
Share of Equity owned by institutions
0.010*** (0.002)
0.043*** (0.012)
0.007** (0.002)
0.029** (0.013)
Share of Equity owned by non-Quasi-Indexed institutions
0.015*** (0.004)
0.083** (0.037)
0.082** (0.036)
S&P500 9.238*** (0.788) 8.872***
(0.805) 2.731*** (0.650)
Run-up 0.060* (0.033)
Exogeneity test (p-value) 0.007 0.087 0.067 0.064
FE controls No No No Yes Yes Yes Yes Yes Yes Yes
Observations 6,208 6,208 6,208 6,208 6,208 6,208 3,074 3,074 3,074 2,744 NOTES: ***=significant at the 1% level, **=significant at the 5% level, *=significant at the 10% level. Columns (1)-(6) control for ln(sales), ln(capital/employment), 4-digit industry dummies and time dummies. Estimation period is 1991 -1999. S&P500 is a dummy variable equal to unity if the firm is a member of the S&P 500 Index. FE controls use the Blundell et al (1999) method. Exogeneity test is a Hausman-based test. “Run-up” is the cumulative returns over the three years up to joining the S&P500 Index. 803 firms in columns (1)-(6) and 797 firms in column (7). “Run-up” is cumulative average returns over 3 years until jointing S&P500.

57
TABLE A1: R&D AND INSTITUTIONAL OWNERSHIP
(1) (3) (4)
Estimation Method OLS OLS OLS
Dependent variable Ln (R&D Expenditure)
Ln (R&D Expenditure)
Ln (R&D Expenditure)
Share of Equity owned by institutions
0.038** (0.003)
0.006*** (0.001)
0.002** (0.001)
controls Ln(capital-labor ratio), four digit industry dummies Ln(capital-labor ratio), fixed effects
Observations 4,922 4,922 4,922
NOTES: ***=significant at the 1% level, **=significant at the 5% level, *=significant at the 10% level. Columns control for ln(sales) and time dummies. All standard errors clustered by firm. Estimation period 1991-1999. 653 firms.

58
TABLE A2: OWNERSHIP AND INNOVATION INSTRUMENTAL VARIABLE REGRESSIONS; ALTERNATIVE
TRANSFORMATION OF DEPENDENT VARIABLE
(1) (2) (3)
Estimation Method OLS OLS
(First Stage) IV
Dependent variable Ln (1+CITES)
citation weighted patent counts Share of Equity owned by
institutions Ln (1+CITES)
citation weighted patent counts
Share of Equity owned by institutions 0.007** (0.002)
0.122** (0.035)
S&P500 7.8254***
(0.724)
Observations 6,208 6,208 6,208
NOTES: ***=significant at the 1% level, **=significant at the 5% level, *=significant at the 10% level. Columns control for ln(sales), ln(capital/employment), ln(R&D stock/employment), four digit industry dummies and time dummies. All standard errors clustered by firm. Estimation period 1992-1999. S&P500 is a dummy variable equal to unity if the firm is a member of the S&P 500 Index. 803 firms.
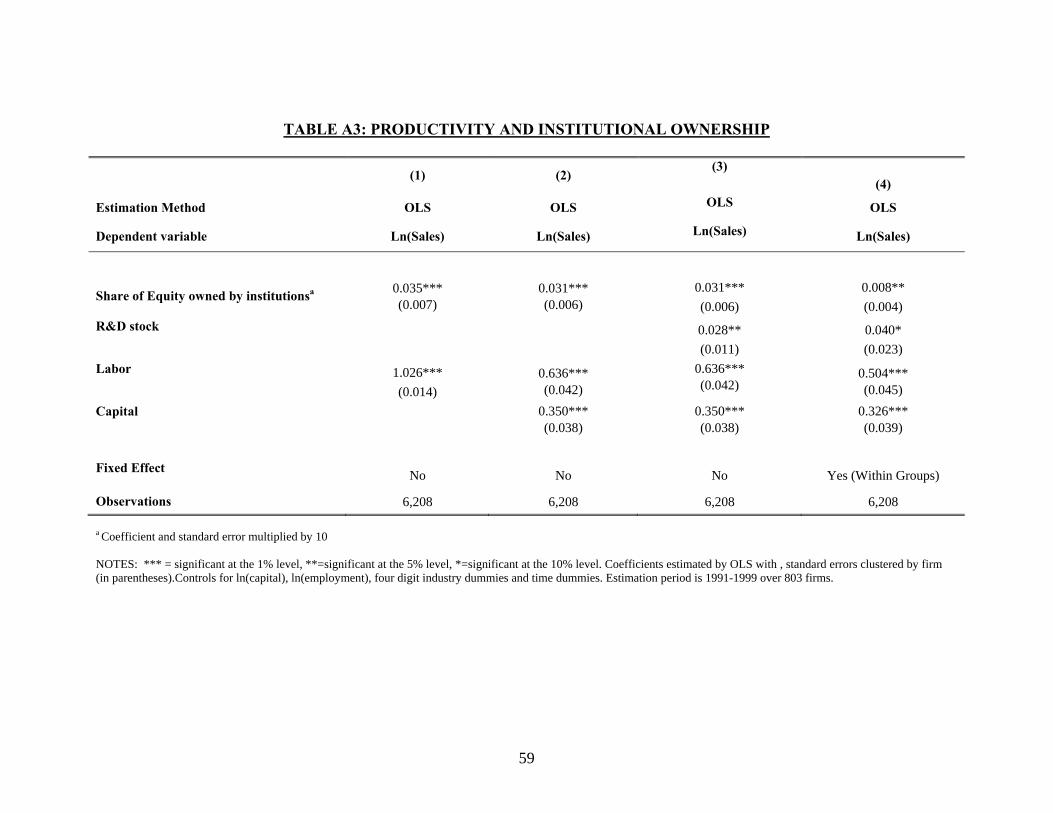
59
TABLE A3: PRODUCTIVITY AND INSTITUTIONAL OWNERSHIP
(1) (2) (3)
(4)
Estimation Method OLS OLS OLS OLS
Dependent variable Ln(Sales) Ln(Sales) Ln(Sales) Ln(Sales)
Share of Equity owned by institutionsa 0.035*** (0.007)
0.031*** (0.006)
0.031*** (0.006)
0.008** (0.004)
R&D stock
0.028** (0.011)
0.040* (0.023)
Labor 1.026*** (0.014)
0.636*** (0.042)
0.636*** (0.042)
0.504*** (0.045)
Capital
0.350*** (0.038)
0.350*** (0.038)
0.326*** (0.039)
Fixed Effect No No No Yes (Within Groups)
Observations 6,208 6,208 6,208 6,208 a Coefficient and standard error multiplied by 10 NOTES: *** = significant at the 1% level, **=significant at the 5% level, *=significant at the 10% level. Coefficients estimated by OLS with , standard errors clustered by firm (in parentheses).Controls for ln(capital), ln(employment), four digit industry dummies and time dummies. Estimation period is 1991-1999 over 803 firms.

CENTRE FOR ECONOMIC PERFORMANCE Recent Discussion Papers
910 Fabian Waldinger Peer Effects in Science – Evidence from the Dismissal of Scientists in Nazi Germany
909 Tomer Blumkin Yossi Hadar Eran Yashiv
The Macroeconomic Role of Unemployment Compensation
908 Natalie Chen Dennis Novy
International Trade Integration: A Disaggregated Approach
907 Dongshu Ou To Leave or Not to Leave? A Regression Discontinuity Analysis of the Impact of Failing the High School Exit Exam
906 Andrew B. Bernard J. Bradford Jensen Stephen J. Redding Peter K. Schott
The Margins of US Trade
905 Gianluca Benigno Bianca De Paoli
On the International Dimension of Fiscal Policy
904 Stephen J. Redding Economic Geography: A Review of the Theoretical and Empirical Literature
903 Andreas Georgiadis Alan Manning
Change and Continuity Among Minority Communities in Britain
902 Maria Bas Trade, Technology Adoption and Wage Inequalities: Theory and Evidence
901 Holger Breinlich Chiara Criscuolo
Service Traders in the UK
900 Emanuel Ornelas John L. Turner
Protection and International Sourcing
899 Kosuke Aoki Takeshi Kimura
Central Bank's Two-Way Communication with the Public and Inflation Dynamics
898 Alan Manning Farzad Saidi
Understanding the Gender Pay Gap: What’s Competition Got to Do with It?
897 David M. Clark Richard Layard Rachel Smithies
Improving Access to Psychological Therapy: Initial Evaluation of the Two Demonstration Sites
896 Giorgio Barba Navaretti Riccardo Faini Alessandra Tucci
Does Family Control Affect Trade Performance? Evidence for Italian Firms

895 Jang Ping Thia Why Capital Does Not Migrate to the South: A New Economic Geography Perspective
894 Kristian Behrens Frédéric Robert-Nicoud
Survival of the Fittest in Cities: Agglomeration, Selection and Polarisation
893 Sharon Belenzon Mark Schankerman
Motivation and Sorting in Open Source Software Innovation
892 Guy Michaels Ferdinand Rauch Stephen J. Redding
Urbanization and Structural Transformation
891 Nicholas Bloom Christos Genakos Ralf Martin Raffaella Sadun
Modern Management: Good for the Environment or Just Hot Air?
890 Paul Dolan Robert Metcalfe
Comparing willingness-to-pay and subjective well- being in the context of non-market goods
889 Alberto Galasso Mark Schankerman
Patent Thickets and the Market for Innovation: Evidence from Settlement of Patent Disputes
888 Raffaella Sadun Does Planning Regulation Protect Independent Retailers?
887 Bernardo Guimaraes Kevin Sheedy
Sales and Monetary Policy
886 Andrew E. Clark David Masclet Marie-Claire Villeval
Effort and Comparison Income Experimental and Survey Evidence
885 Alex Bryson Richard B. Freeman
How Does Shared Capitalism Affect Economic Performance in the UK?
884 Paul Willman Rafael Gomez Alex Bryson
Trading Places: Employers, Unions and the Manufacture of Voice
883 Jang Ping Thia The Impact of Trade on Aggregate Productivity and Welfare with Heterogeneous Firms and Business Cycle Uncertainty
882 Richard B. Freeman When Workers Share in Profits: Effort and Responses to Shirking
881 Alex Bryson Michael White
Organizational Commitment: Do Workplace Practices Matter?
The Centre for Economic Performance Publications Unit
Tel 020 7955 7284 Fax 020 7955 7595 Email [email protected] Web site http://cep.lse.ac.uk