all-atom structural investigation of kinesin microtubule...
TRANSCRIPT

All-Atom Structural Investigation of Kinesin−Microtubule ComplexConstrained by High-Quality Cryo-Electron-Microscopy MapsMinghui Li and Wenjun Zheng*
Physics Department, University at Buffalo, Buffalo, New York 14260, United States
*S Supporting Information
ABSTRACT: In this study, we have performed a comprehensive structuralinvestigation of three major biochemical states of a kinesin complexed withmicrotubule under the constraint of high-quality cryo-electron-microscopy (EM)maps. In addition to the ADP and ATP state which were captured by X-raycrystallography, we have also modeled the nucleotide-free or APO state for whichno crystal structure is available. We have combined flexible fitting of EM maps withregular molecular dynamics simulations, hydrogen-bond analysis, and free energycalculation. Our APO-state models feature a subdomain rotation involving loopL2 and α6 helix of kinesin, and local structural changes in active site similar to arelated motor protein, myosin. We have identified a list of hydrogen bonds involvingkey residues in the active site and the binding interface between kinesin andmicrotubule. Some of these hydrogen bonds may play an important role in couplingmicrotubule binding to ATPase activities in kinesin. We have validated our modelsby calculating the binding free energy between kinesin and microtubule, which quantitatively accounts for the observation ofstrong binding in the APO and ATP state and weak binding in the ADP state. This study will offer promising targets for futuremutational and functional studies to investigate the mechanism of kinesin motors.
Kinesins, a superfamily of microtubule (MT)-based motorproteins, are involved in numerous cellular functions,
ranging from cell division to transportation of cellular cargos.1,2
Kinesin converts the chemical energy from ATP hydrolysis tomechanical work that drives its movement along the MT track,1
which is composed of repeating dimeric subunits formed byα- and β-tubulin monomers.3 A kinesin molecule consists of acatalytic core domain which exhibits MT-stimulated ATPaseactivity,4 a neck region serving as a mechanical amplifier,5 astalk domain for dimerization, and a tail domain for cargobinding.The primary biochemical pathway of a monomeric kinesin in
the presence of MT has been outlined by extensive kineticstudies.6−10 Starting from a weak MT-binding ADP state, MTbinding to kinesin causes ADP release,11 which leads to a strongMT-binding APO state. Then ATP binding is thought totrigger force generation via the docking of neck linker along thecatalytic core domain in the ATP state.5,12 ATP hydrolysis andsubsequent release of inorganic phosphate (Pi) return kinesinto the ADP state. The kinetic cycling through the above threemain states (ADP state → APO state → ATP state) under-scores the biological functions of kinesin motors.The structural basis of kinesin’s kinetics remains elusive
because detailed structural information is not available for allbiochemical states of kinesin. High-resolution crystal structureswere only solved for kinesins bound with various nucleotideanalogues in the absence of MT.13−15 Although comparisons ofdistinct kinesin crystal structures have revealed key conforma-tional changes (such as α4-helix movement and neck-linkerdocking) underlying force generation,16 such conformational
changes seem to be decoupled from the chemical and structuralchanges in the active site.17 This is not unexpected given thegeneral observation that MT binding is required for theactivation of ATPase activities in kinesin (including ATPhydrolysis and ADP release).18 How does MT binding impactkinesin structurally and dynamically? To answer this importantquestion, many efforts have been made to model a kinesin−MTcomplex by fitting a kinesin crystal structure and an MTmodel19,20 into cryo-electron microscopy (EM) maps ofkinesin-decorated MT filaments.12,14,21−25 Thanks to recentimprovement in resolution, EM imaging of kinesin−MTcomplexes26−29 has enabled well-constrained fitting of kinesinstructures into EM maps and identification of local structuralchanges in active site and MT-binding interface. The EM-constrained modeling of kinesins has highlighted theimportance of probing those local structural changes29 withhigh resolution.Computer modeling techniques, ranging from kinetic
modeling30,31 to structure-based coarse-grained32−36 and all-atom37 simulations, have complemented experimental effortsto probe kinesin motor function. Molecular Dynamics (MD)simulations37 based on all-atom force fields38 provide a power-ful tool for investigating protein dynamics in solution for tensof nanoseconds. Previously, MD simulations were performedto investigate the structural dynamics of various kinesins in the
Received: March 19, 2012Revised: May 28, 2012Published: May 31, 2012
Article
pubs.acs.org/biochemistry
© 2012 American Chemical Society 5022 dx.doi.org/10.1021/bi300362a | Biochemistry 2012, 51, 5022−5032

absence39−42 and presence43 of MT. In a previous study, weconducted 30-ns MD simulations of kinesin−MT complex inthe ADP and ATP state, and then calculated the change inkinesin−MT binding free energy following alanine scanningmutagenesis of conventional kinesin and KIF1A.44 Recently,many computational techniques have been developed toincorporate cryo-EM data as a constraint for structural modelingvia “flexible fitting” optimizing the fitting with the EM mapsby utilizing the flexibility of a protein structure.45−52 Forexample, the MDFF program flexibly fits a molecule into an EMmap within the framework of MD simulation, which preservesthe correct stereochemistry and secondary structures of themolecule with each atom being steered toward high-EM-densityregions.53,54 The MDFF program has been used to model thecomplex between actins and myosin which is evolutionarilyrelated to kinesin.55
This study aims to investigate how MT binding affects theglobal and local structures of kinesin in the ADP, ATP, andAPO state. To that end, we have combined MDFF,53,54 regularMD simulations, MD-based hydrogen-bond analysis, and freeenergy calculation. Our APO-state models feature a subdomainrotation involving loop L2 and α6 helix, and local structuralchanges in the active site highly similar to myosin motors. Wehave identified a list of hydrogen bonds involving key residuesin the active site and the binding interface between kinesinand MT. We have validated our models by calculating thebinding free energy between kinesin and MT, and comparing itwith experimental binding data. This study has offered, to ourknowledge, the most comprehensive structural investigation of
major biochemical states of kinesin in the presence of MT withatomic details.
■ METHODS
Structural Modeling of Kinesin and Tubulin Dimer.We structurally model the following three biochemical statesof human conventional kinesin motor domain (referred askinesin):
ADP State. An ADP-state kinesin model is built based on acrystal structure of ADP-bound kinesin (PDB id: 1BG2).56
As found in ref 29, the α4 helix in 1BG2 (with four turns) istoo short to fully fit the corresponding EM densities. So weremodeled the α4 helix using the conformation of an extendedα4 helix (with six turns) from a crystal structure of ADP-boundEg5 (PDB id: 1II6).57 Such homology modeling is madepossible by the high sequence similarity between Eg5 andkinesin (with ∼40% sequence identity). We modeled thebackbone coordinates of residues 247−256 of 1BG2 with thatof residues 281−290 of 1II6, and add the side chains using theSwiss Modeler server (http://swissmodel.expasy.org/). Follow-ing the extension of the α4 helix, the shortened loop L11(residues 237−249) is remodeled to maintain the chainconnectivity between L11 and α4 helix. For L11 modeling,we keep the coordinates of residues 237−242 from 1BG2, andremodel residues 243−246 with the Swiss Modeler.
ATP State. An ATP-state kinesin model is built based on acrystal structure of ADP-bound kinesin with a docked necklinker (PDB id: 1MKJ).17 We use an AMPPNP-bound Eg5structure (PDB id: 3HQD)58 as a template to model several
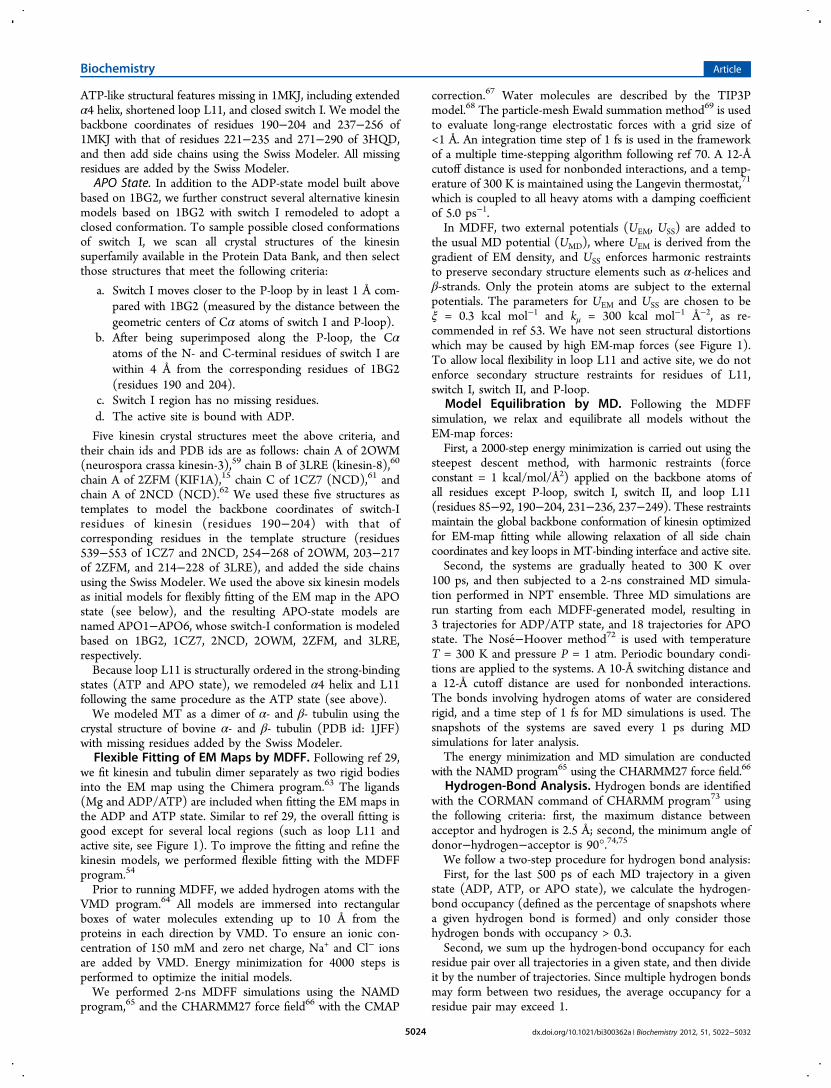
Figure 1. Comparison of rigidly fitted and flexibly fitted models of kinesin and tubulin dimer overlaid with EM maps in the following states: (a) ADPstate, (b−g) APO state (models APO1−6, see Methods), (h) ATP state. The rigidly fitted models are colored red, and the flexibly fitted models arecolored blue. Key secondary structure elements (α2, α3, α4, α6 helices, and L2, L7, L11 loops) and active-site motifs (P-loop and switch I) of kinesinare labeled.
Biochemistry Article
dx.doi.org/10.1021/bi300362a | Biochemistry 2012, 51, 5022−50325023
ATP-like structural features missing in 1MKJ, including extendedα4 helix, shortened loop L11, and closed switch I. We model thebackbone coordinates of residues 190−204 and 237−256 of1MKJ with that of residues 221−235 and 271−290 of 3HQD,and then add side chains using the Swiss Modeler. All missingresidues are added by the Swiss Modeler.APO State. In addition to the ADP-state model built above
based on 1BG2, we further construct several alternative kinesinmodels based on 1BG2 with switch I remodeled to adopt aclosed conformation. To sample possible closed conformationsof switch I, we scan all crystal structures of the kinesinsuperfamily available in the Protein Data Bank, and then selectthose structures that meet the following criteria:
a. Switch I moves closer to the P-loop by in least 1 Å com-pared with 1BG2 (measured by the distance between thegeometric centers of Cα atoms of switch I and P-loop).
b. After being superimposed along the P-loop, the Cαatoms of the N- and C-terminal residues of switch I arewithin 4 Å from the corresponding residues of 1BG2(residues 190 and 204).
c. Switch I region has no missing residues.d. The active site is bound with ADP.
Five kinesin crystal structures meet the above criteria, andtheir chain ids and PDB ids are as follows: chain A of 2OWM(neurospora crassa kinesin-3),59 chain B of 3LRE (kinesin-8),60
chain A of 2ZFM (KIF1A),15 chain C of 1CZ7 (NCD),61 andchain A of 2NCD (NCD).62 We used these five structures astemplates to model the backbone coordinates of switch-Iresidues of kinesin (residues 190−204) with that ofcorresponding residues in the template structure (residues539−553 of 1CZ7 and 2NCD, 254−268 of 2OWM, 203−217of 2ZFM, and 214−228 of 3LRE), and added the side chainsusing the Swiss Modeler. We used the above six kinesin modelsas initial models for flexibly fitting of the EM map in the APOstate (see below), and the resulting APO-state models arenamed APO1−APO6, whose switch-I conformation is modeledbased on 1BG2, 1CZ7, 2NCD, 2OWM, 2ZFM, and 3LRE,respectively.Because loop L11 is structurally ordered in the strong-binding
states (ATP and APO state), we remodeled α4 helix and L11following the same procedure as the ATP state (see above).We modeled MT as a dimer of α- and β- tubulin using the
crystal structure of bovine α- and β- tubulin (PDB id: 1JFF)with missing residues added by the Swiss Modeler.Flexible Fitting of EM Maps by MDFF. Following ref 29,
we fit kinesin and tubulin dimer separately as two rigid bodiesinto the EM map using the Chimera program.63 The ligands(Mg and ADP/ATP) are included when fitting the EM maps inthe ADP and ATP state. Similar to ref 29, the overall fitting isgood except for several local regions (such as loop L11 andactive site, see Figure 1). To improve the fitting and refine thekinesin models, we performed flexible fitting with the MDFFprogram.54
Prior to running MDFF, we added hydrogen atoms with theVMD program.64 All models are immersed into rectangularboxes of water molecules extending up to 10 Å from theproteins in each direction by VMD. To ensure an ionic con-centration of 150 mM and zero net charge, Na+ and Cl− ionsare added by VMD. Energy minimization for 4000 steps isperformed to optimize the initial models.We performed 2-ns MDFF simulations using the NAMD
program,65 and the CHARMM27 force field66 with the CMAP
correction.67 Water molecules are described by the TIP3Pmodel.68 The particle-mesh Ewald summation method69 is usedto evaluate long-range electrostatic forces with a grid size of<1 Å. An integration time step of 1 fs is used in the frameworkof a multiple time-stepping algorithm following ref 70. A 12-Åcutoff distance is used for nonbonded interactions, and a temp-erature of 300 K is maintained using the Langevin thermostat,71
which is coupled to all heavy atoms with a damping coefficientof 5.0 ps−1.In MDFF, two external potentials (UEM, USS) are added to
the usual MD potential (UMD), where UEM is derived from thegradient of EM density, and USS enforces harmonic restraintsto preserve secondary structure elements such as α-helices andβ-strands. Only the protein atoms are subject to the externalpotentials. The parameters for UEM and USS are chosen to beξ = 0.3 kcal mol−1 and kμ = 300 kcal mol−1 Å−2, as re-commended in ref 53. We have not seen structural distortionswhich may be caused by high EM-map forces (see Figure 1).To allow local flexibility in loop L11 and active site, we do notenforce secondary structure restraints for residues of L11,switch I, switch II, and P-loop.
Model Equilibration by MD. Following the MDFFsimulation, we relax and equilibrate all models without theEM-map forces:First, a 2000-step energy minimization is carried out using the
steepest descent method, with harmonic restraints (forceconstant = 1 kcal/mol/Å2) applied on the backbone atoms ofall residues except P-loop, switch I, switch II, and loop L11(residues 85−92, 190−204, 231−236, 237−249). These restraintsmaintain the global backbone conformation of kinesin optimizedfor EM-map fitting while allowing relaxation of all side chaincoordinates and key loops in MT-binding interface and active site.Second, the systems are gradually heated to 300 K over
100 ps, and then subjected to a 2-ns constrained MD simula-tion performed in NPT ensemble. Three MD simulations arerun starting from each MDFF-generated model, resulting in3 trajectories for ADP/ATP state, and 18 trajectories for APOstate. The Nose−́Hoover method72 is used with temperatureT = 300 K and pressure P = 1 atm. Periodic boundary condi-tions are applied to the systems. A 10-Å switching distance anda 12-Å cutoff distance are used for nonbonded interactions.The bonds involving hydrogen atoms of water are consideredrigid, and a time step of 1 fs for MD simulations is used. Thesnapshots of the systems are saved every 1 ps during MDsimulations for later analysis.The energy minimization and MD simulation are conducted
with the NAMD program65 using the CHARMM27 force field.66
Hydrogen-Bond Analysis. Hydrogen bonds are identifiedwith the CORMAN command of CHARMM program73 usingthe following criteria: first, the maximum distance betweenacceptor and hydrogen is 2.5 Å; second, the minimum angle ofdonor−hydrogen−acceptor is 90°.74,75We follow a two-step procedure for hydrogen bond analysis:First, for the last 500 ps of each MD trajectory in a given
state (ADP, ATP, or APO state), we calculate the hydrogen-bond occupancy (defined as the percentage of snapshots wherea given hydrogen bond is formed) and only consider thosehydrogen bonds with occupancy > 0.3.Second, we sum up the hydrogen-bond occupancy for each
residue pair over all trajectories in a given state, and then divideit by the number of trajectories. Since multiple hydrogen bondsmay form between two residues, the average occupancy for aresidue pair may exceed 1.
Biochemistry Article
dx.doi.org/10.1021/bi300362a | Biochemistry 2012, 51, 5022−50325024

Calculation of Kinesin−MT Binding Free Energy.Following our previous paper,44 we calculate the kinesin−MTbinding free energy ΔG in three states (ADP, ATP, and APOstate). We extract 10 snapshots of the last 500 ps of MDtrajectories in each state. For each snapshot, we calculate ΔGusing a continuum solvent model (see ref 76), which expressesΔG as ΔGnp + ΔGelec. Here the nonpolar contribution ΔGnp =αEvdW is empirically written as a fraction (α < 1) of the van derWaals (vdW) interaction energy EvdW between kinesin andtubulin dimer, and the electrostatic contribution ΔGelec =βΔEelec is written as a fraction (β < 1) of the change in electro-static energy ΔEelec from unbound kinesin and MT to kinesin−MT complex. Eelec is calculated using the Poisson−Boltzmann(PB) method.77,78 α = 0.158 and β = 0.153 were calibratedusing mutational data in our previous paper.44 The average andstandard error of ΔG are calculated for all snapshots collectedin each state following ref 44.Estimation of Kinesin−MT Binding Free Energy from
Binding Experiments. Ma and Taylor measured thedissociation constants (KD) of kinesin construct K3328 in thepresence of ADP (KD ∼ 16 μM with 10 mM NaCl buffer),ADP-AlF4 (KD∼ 1 μM with 50 mM NaCl + NaF buffer), andunder nucleotide-free conditions (KD ∼ 0.7 μM with 100 mMNaCl buffer), which correspond to the ADP state, ATP state,and APO state, respectively. As observed by Ma and Taylor,18
the dependence of logarithm of KD on ionic strength isessentially linear up to 100 mM NaCl and the slopes areindependent of nucleotide. Therefore, one can estimate thebinding affinity of kinesin under the same ionic condition(10 mM NaCl buffer) using ΔGexp = kBT ln(KD) (temperatureT = 22 °C, kB is Boltzmann constant) and obtain −6.5 kcal/molin the ADP state, −9.7 kcal/mol in the APO state, and−8.3 kcal/mol in the ATP state. The differences in ΔG areessentially independent of ion concentration.18
■ RESULTS AND DISCUSSIONStructural Modeling of ADP, ATP, and APO State of
Kinesin. We have structurally modeled the ADP, ATP, andAPO state of human conventional kinesin motor domain.For the ADP state, we used a crystal structure of ADP-bound
kinesin (PDB id: 1BG2), where the α4 helix is extended by ∼2turns to improve the fitting of the EM map (see Methods).29
For the ATP state, we used another crystal structure of ADP-bound kinesin (PDB id: 1MKJ) where the α4 helix undergoesboth rotation and translation relative to 1BG2, allowing theneck linker to dock with kinesin motor domain.17 However,this structure lacks ATP-like structural features in the active site(such as a closed switch-I conformation). Therefore, we haveused an AMPPNP-bound Eg5 structure (PDB id: 3HQD)58 asa template to remodel switch I, α4 helix, and loop L11 (seeMethods).The modeling of APO state is more challenging for the lack
of a nucleotide-free crystal structure of kinesin (kinesin isstructurally unstable in the absence of nucleotide and MT, seeref 79). To meet this challenge, we have constructed six kinesinmodels (see Methods) and used them as initial models to flexiblyfit into the EM map of kinesin-decorated MT in the APO state(see below). For five of the six kinesin models, the switch Iregion is remodeled to adopt a closed conformation, which offersa better fit to the EM map in the APO state featuring a bridgebetween the densities of switch I and P-loop.28
Flexible Fitting of EM Maps in the ADP, ATP, and APOState. In a previous study, Sindelar and Downing performed a
rigid fitting of kinesin and tubulin dimer into the EM maps ofkinesin-decorated MT.29 They solved three EM maps in thepresence of ADP, ADP-AlFx, and in the absence of nucleotide,which correspond to the ADP, ATP, and APO state, res-pectively.29 The unprecedentedly high resolutions (8−9 Å, seeref 29) allow them to not only determine the orientation ofkinesin on MT, but also resolve secondary structures like α-helices.29 They found that the kinesin crystal structure does not fitwell with the EM densities in some regions, especially in active siteand kinesin−MT interface,29 which was attributed to conforma-tional changes induced by the binding of kinesin with MT.To model the MT-induced conformational changes in
kinesin, we have employed the MDFF program to flexibly fitthe kinesin models in three states (ADP, ATP, and APO state)and tubulin dimer into corresponding EM maps of kinesin-decorated MT.29 Following ref 29, we first fit kinesin andtubulin dimer as two rigid bodies into each EM map using theChimera program.63 Then we performed three independentMDFF simulations starting from each rigidly fitted model, andkept the final frame of the simulation that best fits the EM map.We also checked to make sure that the three MDFF runs yieldstructurally converging models. To evaluate fitting quality, wehave calculated the local cross-correlation coefficient (CCC)for EM densities within the molecular envelope of kinesin (seeTable S1, Supporting Information).The MDFF simulations have generated models that fit better
with the EM maps. The CCC values increase from 0.636 to0.721 for ADP-state map, from 0.664 to 0.774 on average forAPO-state map, and from 0.704 to 0.742 for ATP-state map.The better fitting for the APO and ATP state than the ADPstate may be attributed to the stronger binding between kinesinand MT in the APO and ATP state than the ADP state.Then we visually compare the fitting of EM densities by
both rigidly fitted models and MDFF-generated models (seeFigure 1):For the ADP state (see Figure 1a), we have observed
extensive structural changes within kinesin after flexible fitting.α3 helix and switch I move upward (away from MT), causingthe N-terminal part of switch I to move closer to ADP whichremains exposed to solvent. Switch I partially sticks out of EMdensities, suggesting its high flexibility. The two-turn helix inswitch I is preserved during MDFF simulation. Similar to ref 29,the extended α4 helix fits well into the EM map. However, loopL11 is mostly out of EM densities, which points to its highflexibility in the ADP state consistent with weak kinesin−MTbinding in the ADP state. Other conformational changes havebeen observed in P-loop, α2 helix, α6 helix, loop L2, and loop L7.For APO state (see Figure 1b−g), we have generated six
kinesin models with MDFF after remodeling switch I usingdifferent kinesin structures as template (see Methods). Despitelarge structural variations in switch I, all models share thecommon feature of switch I and P-loop moving toward eachother to fill the bridge density between them. As a result, theactive site becomes more closed, although its local conformationcannot be uniquely determined by fitting EM densities. Theextended α4 helix fits well into the EM densities after movingdownward (toward MT) together with loop L11, which maylead to stronger binding between kinesin and MT in the APOstate.For the ATP state (see Figure 1h), several structural changes
within kinesin have been observed after flexible fitting. Forexample, switch I moves closer to ATP. The first turn of
Biochemistry Article
dx.doi.org/10.1021/bi300362a | Biochemistry 2012, 51, 5022−50325025

extended α4 helix is partially unwound to allow better fitting ofloop L11 into EM densities.To assess the conformational stability of MDFF simulations,
we have calculated the root mean squared deviation (rmsd) forall backbone atoms relative to the rigidly fitted models (seeFigure S1, Supporting Information). For all MDFF runs, theRMSDs are saturated near 1.5−2.0 Å within 2 ns of simulationtime.We have calculated the kinesin−MT contact surface area using
the VMD program. The flexible fitting has greatly increasedthe contact surface area for all three states (from 2151.8 Å2 to2607.4 Å2 for ADP state, from 2090.2 Å2 to 2741.0 Å2 on averagefor APO state, from 2224.5 Å2 to 2652.1 Å2 for ATP state). Theobservation of contact surface area ascending in the order ofADP, ATP, and APO state agrees with the experimental ob-servation of kinesin−MT binding affinity increasing in the sameorder (see below).Analysis of Conformational Changes among the ADP,
APO, and ATP State. Following the flexible fitting, we havecompared the kinesin models in three states (ADP, APO, andATP state), which has revealed significant conformational changesaccompanying kinesin−MT binding, ADP release, and ATPbinding.To explore the global and local motions of kinesin relative to
MT, we superimpose all the MDFF-generated models along thetubulin dimer.We first compared the ADP and ATP state. As found pre-
viously,29 kinesin undergoes a rotation of ∼13° from the ADPto ATP state. This rotation was also observed in other kinesinssuch as mouse KIF1A,26 Caenorhabditis elegans UNC10480 andrat conventional kinesin,81 with the angle varying from 5° to20°. It remains controversial whether this rotation contributesto the unidirectional movement of kinesin along MT.82,83 Theabove rotation can be decomposed into two rotations: first,kinesin rotates in the counterclockwise direction as viewedfrom the top of kinesin (see Figure 2a); second, kinesin tilts likea seesaw in the counterclockwise direction as viewed along theMT axis (see Figure 2b). Sindelar proposed that the seesawmotion controls the allosteric coupling between active siteclosing and neck linker docking.29 Indeed, the seesaw motion iscoupled to an upward movement of the right side of kinesinwhere neck linker is docked (see Figure 2b). Therefore, it maybe induced by a force that pulls the neck linker away from MT.Indeed, an upward load was found to increase the stepping rateof kinesin motor.84 Besides the above rotation of kinesin,we have also found a translation of kinesin to the left side by∼3.3 Å (see Figure 2a), which may allow the control of ADP-ATP exchange by a sideway pulling force.85
Next, we compare the ADP and APO states. Similar to ref 29,we have observed a small rotation (∼1.4° on average) from theADP to APO state, which is accompanied by a small transla-tion (∼1.2 Å on average) toward the minus end of MT (seeFigure 2a). Such a backward translation of kinesin may allow abackward pulling force to induce the transition from the weak-to strong-binding state. This is consistent with a single-moleculestudy that found the unbinding force obtained by loading directedtoward the minus end of MT was 45% greater than that for plus-end-directed loading.86 Therefore, the strain developed within akinesin dimer could kinetically coordinate the two heads such thatthe front head (under backward strain) stays bound to MT whilethe trailing head can detach.Besides the global motion of kinesin, we have also observed
local changes in the kinesin−MT interface (see Figure 2c). For
example, loop L7 moves closer to microtubules in the APO andATP state (relative to ADP state), which may enable strongbinding between kinesin and microtubules. Loop L8 movesslightly away from microtubules in the ATP state (relative toADP and APO state). α4 helix moves slightly downward fromthe ADP state to the APO and ATP state, which isaccompanied by a leftward shift and local restructuring ofloop L11. α6 helix moves to a new position in the APO state(relative to ADP and ATP state), which is associated with asubdomain rotation within kinesin (see below).To explore the tertiary structural changes within kinesin, we
superimpose all the MDFF-generated kinesin models with acrystal structure of ADP-bound kinesin (PDB id: 1BG2) alongthe central β-sheet (residues 8−15, 79−84, 126−138, 205−216,222−231, 295−302). In addition to previously discoveredstructural changes between the ADP and ATP state14,17 (suchas the rotation and translation of α4 helix, docking of necklinker, etc.), we have found that a subdomain of kinesin(comprised of residues 20−49 and 306−320) rotates by ∼3.2°,6.6°, and 9.0° in the ADP, ATP, and APO state (relative to1BG2, see Figure 2d). Notably, this subdomain adopts a newconformation in the APO state instead of an intermediateconformation between the ADP and ATP state. The involvementof loop L2 and α6 helix in this subdomain rotation hints at afunctional role in modulating kinesin−MT binding.To explore the nucleotide-dependent structural changes in
the active site (consisting of three conserved motifs: P-loop,switch I, and switch II), we superimpose all the MDFF-generated kinesin models with a crystal structure of ADP-bound kinesin (PDB id: 1BG2) along the P-loop, then weexamine the structural motions of switch I and switch II relative
Figure 2. Conformational changes among the ADP, APO, and ATPstates: (a) top view of the global motions of kinesin relative to MT(the rotation from the ADP to ATP state is shown by a red curvedarrow, the translation from the ADP to APO/ATP state is shown by agreen/red block arrow); (b) side view of the seesaw motion of kinesinrelative to MT (shown by curved arrows); (c) bottom view (with MTremoved) of the movements of structural elements involved inkinesin−MT binding (including loop L7, L8, L11, L12, and α4, α5, α6helix); (d) subdomain rotation within kinesin in the ADP, APO, andATP state (relative to a crystal structure of kinesin colored silver).Models of the ADP, APO, and ATP state are colored blue, green, andred, respectively. Same color scheme applies to rotational axes inpanels (a), (b), and (d). The viewing directions of panel (a−c) areshown in the upper-right cartoon.
Biochemistry Article
dx.doi.org/10.1021/bi300362a | Biochemistry 2012, 51, 5022−50325026

to the P-loop (see Figure 3a). Since the P-loop forms the mostextensive interactions with the bound nucleotide, a P-loop-centric
view allows us to probe relative motions between switch I/II andthe nucleotide. Among the three active-site motifs, switch Iundergoes the largest structural changes as kinesin proceeds fromthe ADP state to APO state and then the ATP state in thepresence of microtubules (see Figure 3a):
a. In the ADP state, the N-terminal part of switch I clampsdownward (toward P-loop) upon binding with micro-tubules, which is consistent with the EPR finding that theactive site is closed after the ADP-bound kinesin bindswith MT.88
b. In the APO state, switch I shifts leftward (toward switchII) and its N-terminal part is highly flexible, which mayenable ADP to exit and ATP to enter the active site.
c. In the ATP state, switch I shifts rightward to tightly closethe active site, which allows ATP hydrolysis to occur.
Our finding echoes the observation of considerable variationsin switch I among kinesin crystal structures with bound ADP,particularly in the N-terminal part (loop L9).89 Switch I alsoundergoes a change in secondary structure from a two-turnhelix flanked by a short loop in the ADP state to an extendedloop in the ATP state90 (see Figure 3a). We have also observedsmaller motions of switch II coupled to switch-I motions, whichmay further fine-tune the opening/closing of the active site (seeFigure 3a).The active-site motifs are highly conserved between kinesin
and myosin. For both kinesin and myosin, switch I and switchII are thought to move closer to the nucleotide in theprehydrolysis state, forming interactions with the γ-phosphateof ATP to enable ATP hydrolysis.90 Indeed, our modeling hasrevealed intriguingly similar structural changes in switch I andswitch II between kinesin and myosin. Similar to kinesin, switchI of myosin shifts leftward upon ADP release and then shiftsrightward to close the active site for ATP hydrolysis (seeFigure 3b), and switch II of myosin also undergoes similarchanges with larger scale.Analysis of Hydrogen Bonds in the ADP, APO, and
ATP State. Following the MDFF simulations, we haveperformed MD simulations to relax and equilibrate the localconformations of active-site motifs (P-loop, switch I, andswitch II) and loop L11, while restraining the backbone atoms
of the rest of system (see Methods). Three 2 ns-long MDsimulations have been conducted starting from each MDFF-generated model, resulting in 3, 3, and 18 MD trajectories forthe ADP, ATP, and APO state. The backbone RMSDs achieveequilibrium within 2 ns of simulation time (see Figure S2,Supporting Information).On the basis of the last 500 ps of MD simulations, we have
analyzed the hydrogen bonds (HB) (including salt bridges)formed in the ADP, or ATP or APO state with an averageoccupancy >0.3 (see Methods). We focus on two groups ofHBs: those involving residues of active-site motifs (P-loop,switch I and switch II) and those between kinesin and MT. Theresults are shown in Table 1 and Figure 4.
HBs Involving Active-Site Motifs. a. HBs betweenKinesin and Ligand. In the ADP and ATP state, the residuesthat form HBs with the ligand are mainly from P-loop (residues88−93). In the ADP state, an HB forms between ADP andS201 of switch I as a result of switch I closing (see Figure 4a).In the ATP state, one HB forms between N198 of switch I andATP (see Figure 4c). Two HBs were thought to be importantfor ATP hydrolysis: one is between S202 of switch I and Pi,13,91
and the other is between G234 of switch II and Pi.13 In our MDsimulations in the ATP state, we have observed the first HB(with occupancy ∼ 0.2) but not the second one. We note thatthe distance between atom N of G234 and Pi oxygen is only∼5 Å, so a small displacement of 1−2 Å will bring them withinHB distance.
b. HBs within Each Active-Site Motif. Within switch I, 8 and7 HBs are formed in the ADP and ATP state, respectively.However, only one remains in the APO state due to highflexibility in switch I. Within P-loop, 1, 2, and 2 HBs are formedin the ADP, APO, and ATP state, respectively. Within switch II,two HBs are formed in the ATP state. Some of these HBs maybe required to maintain the closure of the active site fornucleotide binding. For example, an HB forms between R190and S202 of switch I in the ATP state (see Figure 4c), whosedisruption by R190A mutation was found to cause reducedmotility.17
c. HBs between Active-Site Motifs. Between switch II and P-loop, 1, 4, and 2 HBs are formed in the ADP, APO, and ATPstate, respectively. For example, an HB forms between E236and T87 (see Figure 4a−c), which locks switch II in a closedconformation. The occupancy of this HB is low in the APOstate but high in the ADP and ATP state, which is consistentwith our observation that switch II further opens in the APOstate relative to the ADP and ATP state (see Figure 3a).Between switch I and II, 1 and 2 HBs are formed in the APO
and ATP state, respectively. For example, a salt bridge formsbetween R203 and E236 in the APO and ATP state (see Figure4b,c). This salt bridge was thought to be essential to maintain aclosed active site for hydrolysis and its breaking is required forPi release.13 In agreement with this proposal, a mutation R210Ain Drosophila kinesin (corresponding to R203 of kinesin)caused defective ATPase,92 and the mutations E237A andE237D in rat kinesin (corresponding to E236 of kinesin)reduced or abolished MT-dependent ATPase.93
d. HBs between Active Site and Loop L11. In the ADPstate, loop L11 forms 1 HB with switch II, and 2 HBs withswitch I. For example, a salt bridge forms between R203 ofswitch I and E250 of L11 (on the extended α4 helix) (seeFigure 4a), which was proposed to modulate the seesawmotion in ref 29. This salt bridge also forms (with loweroccupancy) in the APO state (see Figure 4b) but not in
Figure 3. Active-site conformational changes among the ADP, APO,and ATP state: (a) movements of switch I and II in the active site ofkinesin (S202 of switch I and G234 of switch II are shown as spheres);(b) movements of switch I and II in active site of myosin (S218 ofswitch I and G457 of switch II are shown as spheres). Models of theADP, APO, and ATP state are colored blue, green, and red,respectively. The ADP-bound crystal structure of kinesin (PDB id:1BG2) is colored cyan.
Biochemistry Article
dx.doi.org/10.1021/bi300362a | Biochemistry 2012, 51, 5022−50325027

the ATP state. In support of the importance of this saltbridge, a mutation E250A resulted in defective MT-activatedATPase.87 In KIF1A, it was observed that the correspond-ing salt bridge between R216 and E267 stabilizes a raisedconformation of L11 that contributes to weak binding ordetachment of KIF1A;13 R216 and E267 were also proposedto constitute a latch that stabilizes Mg binding in the ADPstate.15
In the ATP state, loop L11 forms 2 HBs with both switch Iand II. For example, an HB forms between E236 of switch IIand N255 of L11 (see Figure 4c). This HB is also present in theAPO state (with lower occupancy) but not in the ADP state.This HB may play a role in coupling MT binding with ADPrelease as supported by two decoupling mutations N650Kand E631A of KAR3 (corresponding to N255 and E236 ofkinesin),94 and an N256K mutation of rat kinesin (correspondingto N255 of kinesin) that blocked MT stimulation of ADP releaseand ATP hydrolysis.93
HBs Involved in Kinesin−MT Binding. We have foundthat 19, 19, and 12 HBs are formed between kinesin and MT inthe ADP, APO, and ATP state, respectively. The finding offewer HBs in the ATP state than the ADP or APO state doesnot contradict the strong kinesin−MT binding in the ATP state.In fact, hydrophobic interactions contribute more than electro-static interactions to kinesin−MT binding in the ATP state.95
Next, we discuss HBs involving the following MT-bindingmotifs (see Table 1 and Figure 4):6, 8, and 5 HBs form between loop L12 (residues T273,
Y274, R278, D279, R284) and β-tubulin in the ADP, APO, and
ATP state, respectively. R278 is involved in multiple HBs, sup-porting its importance in kinesin−MT interactions as revealedin an alanine-scanning mutagenesis study.87 Although L12 isinvolved in all three states, one HB (between R284 of L12 andE196 of β-tubulin) only forms in the APO and ATP state (seeFigure 4b,c), which may contribute discriminatively to strong-binding states.4, 3, and 3 HBs form between loop L11 (residues K237,
K240, K252, N255) and α-tubulin in the ADP, APO, and ATPstate, respectively. The HBs involving K252 and N255 maystabilize the extended α4 helix.29 Although L11 is involved in allthree states, one HB (between N255 of L11 and M413 ofα-tubulin) only forms in the APO and ATP state (see Figure4b,c), and K237 forms more HBs in the APO and ATP statethan the ADP state (see Figure 4a,b,c); these interactions maycontribute discriminatively to strong-binding states.5, 3, and 1 HBs form between loop L8 (residues H156, E157,
K159, R161) and β-tubulin in the ADP, APO, and ATP state,respectively. L8 is more involved in kinesin−MT binding in theADP and APO state than the ATP state, which is consistentwith our observation that L8 changes little between the ADPand APO state and moves away from MT in the ATP state (seeFigure 2c). In agreement with our finding, it was found thattriple-alanine substitutions in L8 (E157A/K159A/Y164A) onlycaused slight reduction to the MT gliding velocity,87 suggestingthat L8 is not essential for MT activation of ATPase activity.One HB forms between K141 of loop L7 and E159 of
β-tubulin in the ATP state (see Figure 4c), and in the APO statewith low occupancy. The importance of this HB is supported by
Table 1. Results of Hydrogen-Bond Analysis Based on MD Simulations in the ADP, APO, and ATP Statea
ADP state APO state ATP state
HB typeresidue-pairoccupancy
residue-pairoccupancy
residue-pairoccupancy
involvingactive site
k_S88 ADP 0.97 k_S88 ATP 0.84
k_S89 ADP 0.67 k_S89 ATP 1.00
k_G90 ADP 0.99 k_G90 ATP 1.28
k_K91 ADP 2.52 k_K91 ATP 1.90
k_T92 ADP 2.59 k_T92 ATP 1.92
k_H93 ADP 1.00 k_H93 ATP 1.00
k_S201 ADP 0.67 k_N198 ATP 0.71
k_Q86 k_K91 0.89 k_G85 k_A233 0.43 k_Q86 k_K91 0.73
k_T87 k_E236 1.39 k_Q86 k_S89 0.85 k_Q86 k_S89 0.99
k_V192 k_V194 0.30 k_Q86 k_T87 0.37 k_T87 k_E236 0.98
k_N196 k_E199 0.49 k_T87 k_E236 0.53 k_K91 k_A233 0.82
k_N196 k_H200 0.81 k_K91 k_D231 0.92 k_R190 k_S202 0.98
k_M197 k_S201 0.92 k_K91 k_L232 0.45 k_A193 k_S201 1.99
k_N198 k_S202 1.03 k_H200 k_S204 0.38 k_T195 k_M197 0.65
k_E199 k_R203 1.63 k_R203 k_E236 0.82 k_T195 k_N198 1.91
k_H200 k_R203 0.79 k_R203 k_E250 0.44 k_T195 k_T241 0.79
k_H200 k_S204 0.86 k_N196 k_T241 0.95
k_R203 k_E244 0.31 k_N198 k_H200 0.90
k_R203 k_E250 2.07 k_S201 k_R203 0.83
k_E236 k_K240 0.33 k_S202 k_D231 1.00
k_S202 k_R203 1.07
k_R203 k_E236 1.89
k_L232 k_G234 0.52
ADP state APO state ATP state
HB typeresidue-pairoccupancy
residue-pairoccupancy
residue-pairoccupancy
k_G234 k_E236 0.31
k_E236 k_N255 1.31
k_E236 k_T241 1.11
betweenkinesinand MT
k_K44 a_E423 1.04 k_K44 a_E423 0.70 k_K237 a_E414 1.00
k_S235 a_E414 0.66 k_R203 a_E414 0.57 k_K237 a_E417 0.99
k_K237 a_E417 0.54 k_K237 a_E414 0.66 k_N255 a_M413 0.55
k_K240 a_E414 1.08 k_K237 a_E417 1.00 k_S310 a_E420 0.99
k_K240 a_G412 0.58 k_N255 a_M413 0.40 k_R321 a_E415 0.45
k_K252 a_E411 0.76 k_K313 a_E420 0.91
k_K313 a_E420 0.52 k_S314 a_E414 0.77
k_R321 a_E415 1.43 k_R321 a_E415 1.76
k_E157 b_E420 0.38 k_E157 b_E420 0.76 k_K141 b_E159 0.55
k_E157 b_S423 1.18 k_H156 b_E420 0.89 k_H156 b_E420 0.97
k_K159 b_E415 0.33 k_R161 b_D427 1.60 k_T273 b_Q434 0.35
k_R161 b_D427 2.45 k_Y274 b_D427 0.59 k_Y274 b_D427 1.35
k_R161 b_S423 0.42 k_Y274 b_E431 0.32 k_Y274 b_R264 1.00
k_Y274 b_E431 1.00 k_R278 b_D427 0.32 k_R278 b_V195 1.13
k_Y274 b_Q434 0.31 k_R278 b_E196 0.52 k_R284 b_E196 2.43
k_R278 b_E196 1.84 k_R278 b_E431 0.95
k_R278 b_E431 1.00 k_D279 b_R264 0.59
k_R278 b_R264 0.62 k_R284 b_E196 0.59
k_D279 b_R264 1.00 k_R284 b_E420 0.47ak: kinesin, a: α-tubulin, b: β-tubulin.
Biochemistry Article
dx.doi.org/10.1021/bi300362a | Biochemistry 2012, 51, 5022−50325028

the finding that mutation R153A of KIF1A (corresponding toK141 of kinesin) caused impaired MT-activated ATPase.15
One HB forms between K44 of loop L2 and E423 ofα-tubulin in the ADP and APO state (see Figure 4a,b), supportingits role in MT binding as found by EM21 and computation.44
2, 3, and 2 HBs form between α6 helix (residues S310,K313, S314, R321) and α-tubulin in the ADP, APO, and ATPstate, respectively. For example, an HB forms between R321of α6 helix and E415 of α-tubulin in all three states (seeFigure 4a,b,c). A mutational study of MT identified E415 ofα-tubulin as important for coupling MT binding and ADPrelease,96 and the binding partner of E415 was proposed to beK237 of kinesin. In our models, the binding partner of E415 isR321, while K237 interacts with E414 and E417 of α-tubulin.The functional importance of R321 was shown in a recentmutational study.97
Many of the above residues were also identified as importantto kinesin−MT binding by both experimental and computa-tional mutagenesis studies.44,87
Calculation of Kinesin−MT Binding Free Energy in theADP, APO, and ATP state. Biochemical measurements ofkinesin−MT binding/dissociation were conducted under differ-ent nucleotide conditions.8,18 It was found that the bindingaffinity increases in the order of ADP, ATP, APO state, with adifference of 3.2 kcal/mol between the APO and ADP state,and 1.8 kcal/mol between the ATP and ADP state (see Methods).These results impose an energetic constraint on the structuralmodels of the three states.
To validate our models using the binding data, we havecalculated the kinesin−MT binding free energy (ΔG) using anMD-based protocol introduced in our previous paper.44 In thisprotocol, we express ΔG in terms of the van der Waals interactionenergy between kinesin and MT, and the electrostatic energycalculated using the Poisson−Boltzmann method.44 Because ofhigh uncertainty in entropy calculation, we do not include theentropic contribution to ΔG, which results in a negative shift ofΔG by 7−15 kcal/mol.44 The calculated ΔG for ADP, APO, andATP state is −18.98 ± 0.44, −21.91 ± 0.18, and −21.54 ± 0.35kcal/mol, respectively (see Table S2, Supporting Information).Therefore, our calculation indicates that the binding affinity in theAPO and ATP state is higher than the ADP state by 2.9 and 2.5kcal/mol, respectively. This is in good agreement withexperimental results, which supports the validity of our models.To probe the physical origin of stronger kinesin−MT
binding in the APO and ATP state than the ADP state, wehave conducted a breakdown of ΔG into polar and nonpolarcontributions. The polar or electrostatic contribution to ΔG inthe ADP, APO, and ATP state is −5.74, −5.47, and −5.09 kcal/mol, respectively. The nonpolar or van der Waals contributionto ΔG in the ADP, APO, and ATP state is −13.24, −16.43, and−16.45 kcal/mol, respectively. Therefore, stronger nonpolarinteractions are responsible for the stronger kinesin−MTbinding in the APO and ATP state than the ADP state, whileelectrostatic interactions are most involved in the weak-bindingADP state.
Relating Our Modeling to MT-Activated ADP Release.Our structural modeling of kinesin complexed with MT in the
Figure 4. Key hydrogen bonds in the following states: (a) ADP, (b) APO, and (c) ATP state. Key structural elements of kinesin are colored asfollows: P-loop (blue), switch I (red), switch II (green), α4 helix and loop L11 (yellow), α6 helix (orange), loop L2 (tan), loop L7 (purple), loopL12 (pink). Hydrogen bonds are shown as short cyan lines. Residues involved in the displayed hydrogen bonds are shown as side chains and labeled.
Biochemistry Article
dx.doi.org/10.1021/bi300362a | Biochemistry 2012, 51, 5022−50325029

ADP and APO state has shed new light on the structuralmechanism of MT-activated ADP release. Our modeling of theAPO state has revealed a structurally flexible switch I, whichadopts a closed conformation after a pronounced displacement(relative to the ADP state). Our finding supports the proposalof MT-induced switch-I displacement that perturbs Mgcoordination and thereby stimulates the release of MgADP.94
In addition, our modeling predicts a slight opening of switch IIin the APO state, which may further destabilize MgADPcoordination by switch II.89,98 Unlike switch I and II, theP-loop remains relatively rigid in the APO state although itmoves relative to MT.How does MT binding trigger the movements of switch I
and II in the active site? We have identified a number of HBswhich may mediate the signaling from MT-binding residues(such as K141 of loop L7, K237 and N255 of loop L11) toactive-site residues (such as R203 of switch I, E236 of switchII). Alternatively, an HB between R203 of switch I and E414of α-tubulin may directly couple MT and the active site. Thefunctional importance of R203, E236, and N255 wasdemonstrated by mutational studies.12,99
■ CONCLUSION
In conclusion, we have performed all-atom structural modelingof three main biochemical states of a kinesin complexed withMT under the constraint of high-quality cryo-EM maps. Inaddition to the ADP and ATP state captured by previouscrystallographic studies, we have modeled the structurallyunknown APO state which features a subdomain rotationinvolving loop L2 and α6 helix, and local changes in the activesite similar to the myosin motor. We have identified a list ofhydrogen bonds involving key residues in the active site and thebinding interface between kinesin and MT. Some of thesehydrogen bonds may mediate the coupling between MTbinding and ATPase activities. We have validated our modelsby calculating the binding free energy between kinesin and MT,which quantitatively accounts for the observation of strongbinding in the APO and ATP state and weak binding in theADP state.
■ ASSOCIATED CONTENT
*S Supporting InformationTable S1: The cross-correlation coefficients for all models builtby rigid fitting and flexible fitting.Table S2: Results of binding free energy calculation between
kinesin and MT.Figure S1: The backbone rmsd for MDFF simulations.Figure S2: The backbone rmsd for MD simulations.This material is available free of charge via the Internet in
http://pubs.acs.org
■ AUTHOR INFORMATION
Corresponding Author*E-mail: [email protected]. Tel: (716) 6452947. Fax: (716)6452507.
FundingAmerican Heart Association (Grant No. 0835292N) andNational Science Foundation (Grant No. 0952736).
NotesThe authors declare no competing financial interest.
■ ACKNOWLEDGMENTSWe thank Dr. Sindelar for generously providing his high-qualityEM maps for kinesin-decorated MT.
■ ABBREVIATIONS USEDADP, adenosine diphosphate; ATP, adenosine triphosphate;CCC, cross-correlation coefficient; EM, electron microscopy;HB, hydrogen bond; Pi, inorganic phosphate; MT, micro-tubule; MD, molecular dynamics; PDB, Protein Data Bank;rmsd, root mean squared deviation
■ REFERENCES(1) Hirokawa, N. (1998) Kinesin and dynein superfamily proteinsand the mechanism of organelle transport. Science 279, 519−526.(2) Valentine, M. T., Fordyce, P. M., and Block, S. M. (2006) Eg5steps it up! Cell Div. 1, 31.(3) Tucker, C., and Goldstein, L. S. (1997) Probing the kinesin-microtubule interaction. J. Biol. Chem. 272, 9481−9488.(4) Case, R. B., Rice, S., Hart, C. L., Ly, B., and Vale, R. D. (2000)Role of the kinesin neck linker and catalytic core in microtubule-basedmotility. Curr. Biol. 10, 157−160.(5) Vale, R. D., Case, R., Sablin, E., Hart, C., and Fletterick, R. (2000)Searching for kinesin’s mechanical amplifier. Philos. Trans. R. Soc.London B Biol. Sci. 355, 449−457.(6) Valentine, M. T., and Gilbert, S. P. (2007) To step or not to step?How biochemistry and mechanics influence processivity in kinesin andEg5. Curr. Opin. Cell. Biol. 19, 75−81.(7) Gilbert, S. P., Webb, M. R., Brune, M., and Johnson, K. A. (1995)Pathway of processive ATP hydrolysis by kinesin. Nature 373, 671−676.(8) Ma, Y. Z., and Taylor, E. W. (1997) Kinetic mechanism of amonomeric kinesin construct. J. Biol. Chem. 272, 717−723.(9) Moyer, M. L., Gilbert, S. P., and Johnson, K. A. (1998) Pathwayof ATP hydrolysis by monomeric and dimeric kinesin. Biochemistry 37,800−813.(10) Cross, R. A. (2004) The kinetic mechanism of kinesin. TrendsBiochem. Sci. 29, 301−309.(11) Hackney, D. D. (1988) Kinesin ATPase: rate-limiting ADPrelease. Proc. Natl. Acad. Sci. U. S. A. 85, 6314−6318.(12) Rice, S., Lin, A. W., Safer, D., Hart, C. L., Naber, N., Carragher,B. O., Cain, S. M., Pechatnikova, E., Wilson-Kubalek, E. M., Whittaker,M., Pate, E., Cooke, R., Taylor, E. W., Milligan, R. A., and Vale, R. D.(1999) A structural change in the kinesin motor protein that drivesmotility. Nature 402, 778−784.(13) Nitta, R., Kikkawa, M., Okada, Y., and Hirokawa, N. (2004)KIF1A alternately uses two loops to bind microtubules. Science 305,678−683.(14) Kikkawa, M., Sablin, E. P., Okada, Y., Yajima, H., Fletterick, R. J.,and Hirokawa, N. (2001) Switch-based mechanism of kinesin motors.Nature 411, 439−445.(15) Nitta, R., Okada, Y., and Hirokawa, N. (2008) Structural modelfor strain-dependent microtubule activation of Mg-ADP release fromkinesin. Nat. Struct. Mol. Biol. 15, 1067−1075.(16) Vale, R. D., and Milligan, R. A. (2000) The way things move:looking under the hood of molecular motor proteins. Science 288, 88−95.(17) Sindelar, C. V., Budny, M. J., Rice, S., Naber, N., Fletterick, R.,and Cooke, R. (2002) Two conformations in the human kinesinpower stroke defined by X-ray crystallography and EPR spectroscopy.Nat. Struct. Biol. 9, 844−848.(18) Ma, Y. Z., and Taylor, E. W. (1995) Mechanism of microtubulekinesin ATPase. Biochemistry 34, 13242−13251.(19) Nogales, E., Wolf, S. G., and Downing, K. H. (1998) Structureof the alpha beta tubulin dimer by electron crystallography. Nature391, 199−203.(20) Nogales, E., Whittaker, M., Milligan, R. A., and Downing, K. H.(1999) High-resolution model of the microtubule. Cell 96, 79−88.
Biochemistry Article
dx.doi.org/10.1021/bi300362a | Biochemistry 2012, 51, 5022−50325030

(21) Sosa, H., Dias, D. P., Hoenger, A., Whittaker, M., Wilson-Kubalek, E., Sablin, E., Fletterick, R. J., Vale, R. D., and Milligan, R. A.(1997) A model for the microtubule-Ncd motor protein complexobtained by cryo-electron microscopy and image analysis. Cell 90,217−224.(22) Kozielski, F., Arnal, I., and Wade, R. H. (1998) A model of themicrotubule-kinesin complex based on electron cryomicroscopy andX-ray crystallography. Curr. Biol. 8, 191−198.(23) Hoenger, A., Sack, S., Thormahlen, M., Marx, A., Muller, J.,Gross, H., and Mandelkow, E. (1998) Image reconstructions ofmicrotubules decorated with monomeric and dimeric kinesins:comparison with X-ray structure and implications for motility. J. CellBiol. 141, 419−430.(24) Hirose, K., Lowe, J., Alonso, M., Cross, R. A., and Amos, L. A.(1999) Congruent docking of dimeric kinesin and ncd into three-dimensional electron cryomicroscopy maps of microtubule-motorADP complexes. Mol. Biol. Cell 10, 2063−2074.(25) Kikkawa, M., Okada, Y., and Hirokawa, N. (2000) 15 Åresolution model of the monomeric kinesin motor, KIF1A. Cell 100,241−252.(26) Kikkawa, M., and Hirokawa, N. (2006) High-resolution cryo-EM maps show the nucleotide binding pocket of KIF1A in open andclosed conformations. EMBO J. 25, 4187−4194.(27) Hirose, K., Akimaru, E., Akiba, T., Endow, S. A., and Amos, L. A.(2006) Large conformational changes in a kinesin motor catalyzed byinteraction with microtubules. Mol. Cell 23, 913−923.(28) Sindelar, C. V., and Downing, K. H. (2007) The beginning ofkinesin’s force-generating cycle visualized in 9-Å resolution. J. Cell Biol.177, 377−385.(29) Sindelar, C. V., and Downing, K. H. (2010) An atomic-levelmechanism for activation of the kinesin molecular motors. Proc. Natl.Acad. Sci. U. S. A. 107, 4111−4116.(30) Fisher, M. E., and Kolomeisky, A. B. (2001) Simplemechanochemistry describes the dynamics of kinesin molecules.Proc. Natl. Acad. Sci. U. S. A. 98, 7748−7753.(31) Peskin, C. S., and Oster, G. (1995) Coordinated hydrolysisexplains the mechanical behavior of kinesin. Biophys. J. 68, 202S−210S.Discussion 210S−211S.(32) Zheng, W., and Doniach, S. (2003) A comparative study ofmotor-protein motions by using a simple elastic-network model. Proc.Natl. Acad. Sci. U. S. A. 100, 13253−13258.(33) Zheng, W., and Brooks, B. R. (2005) Normal-modes-basedprediction of protein conformational changes guided by distanceconstraints. Biophys. J. 88, 3109−3117.(34) Zheng, W., Brooks, B. R., and Hummer, G. (2007) Proteinconformational transitions explored by mixed elastic network models.Proteins 69, 43−57.(35) Zheng, W., and Tekpinar, M. (2009) Large-scale evaluation ofdynamically important residues in proteins predicted by theperturbation analysis of a coarse-grained elastic model. BMC Struct.Biol. 9, 45.(36) Hyeon, C., and Onuchic, J. N. (2007) Mechanical control of thedirectional stepping dynamics of the kinesin motor. Proc. Natl. Acad.Sci. U. S. A. 104, 17382−17387.(37) Karplus, M., and McCammon, J. A. (2002) Molecular dynamicssimulations of biomolecules. Nat. Struct. Biol. 9, 646−652.(38) Mackerell, A. D., Jr. (2004) Empirical force fields for biologicalmacromolecules: overview and issues. J. Comput. Chem. 25, 1584−1604.(39) Behnke-Parks, W. M., Vendome, J., Honig, B., Maliga, Z.,Moores, C., and Rosenfeld, S. S. (2011) Loop L5 acts as aconformational latch in the mitotic kinesin Eg5. J. Biol. Chem. 286,5242−5253.(40) Zhang, W. (2011) Exploring the intermediate states of ADP-ATP exchange: a simulation study on Eg5. J. Phys. Chem. B 115, 784−795.(41) Naber, N., Larson, A., Rice, S., Cooke, R., and Pate, E. (2011)Multiple conformations of the nucleotide site of Kinesin family motorsin the triphosphate state. J. Mol. Biol. 408, 628−642.
(42) Hwang, W., Lang, M. J., and Karplus, M. (2008) Forcegeneration in kinesin hinges on cover-neck bundle formation. Structure16, 62−71.(43) Aprodu, I., Soncini, M., and Redaelli, A. (2008) Interactionforces and interface properties of KIF1A kinesin-alphabeta tubulincomplex assessed by molecular dynamics. J. Biomech. 41, 3196−3201.(44) Li, M. H., and Zheng, W. J. (2011) Probing the structural andenergetic basis of kinesin-microtubule binding using computationalalanine-scanning mutagenesis. Biochemistry 50, 8645−8655.(45) Topf, M., Lasker, K., Webb, B., Wolfson, H., Chiu, W., and Sali,A. (2008) Protein structure fitting and refinement guided by cryo-EMdensity. Structure 16, 295−307.(46) Jolley, C. C., Wells, S. A., Fromme, P., and Thorpe, M. F. (2008)Fitting low-resolution cryo-EM maps of proteins using constrainedgeometric simulations. Biophys. J. 94, 1613−1621.(47) Velazquez-Muriel, J. A., Valle, M., Santamaria-Pang, A.,Kakadiaris, I. A., and Carazo, J. M. (2006) Flexible fitting in 3D-EMguided by the structural variability of protein superfamilies. Structure14, 1115−1126.(48) Tan, R. K., Devkota, B., and Harvey, S. C. (2008) YUP.SCX:coaxing atomic models into medium resolution electron density maps.J. Struct. Biol. 163, 163−174.(49) Schroder, G. F., Brunger, A. T., and Levitt, M. (2007)Combining efficient conformational sampling with a deformable elasticnetwork model facilitates structure refinement in low resolution.Structure 15, 1630−1641.(50) Tama, F., Miyashita, O., and Brooks, C. L., 3rd (2004) Normalmode based flexible fitting of high-resolution structure into low-resolution experimental data from cryo-EM. J. Struct. Biol. 147, 315−326.(51) Suhre, K., Navaza, J., and Sanejouand, Y. H. (2006) NORMA: atool for flexible fitting of high-resolution protein structures into low-resolution electron-microscopy-derived density maps. Acta Crystallogr.D Biol Crystallogr. 62, 1098−1100.(52) Zheng, W. (2011) Accurate flexible fitting of high-resolutionprotein structures into cryo-electron microscopy maps using coarse-grained pseudo-energy minimization. Biophys. J. 100, 478−488.(53) Trabuco, L. G., Villa, E., Mitra, K., Frank, J., and Schulten, K.(2008) Flexible fitting of atomic structures into electron microscopymaps using molecular dynamics. Structure 16, 673−683.(54) Trabuco, L. G., Villa, E., Schreiner, E., Harrison, C. B., andSchulten, K. (2009) Molecular dynamics flexible fitting: a practicalguide to combine cryo-electron microscopy and X-ray crystallography.Methods 49, 174−180.(55) Lorenz, M., and Holmes, K. C. (2010) The actin-myosininterface. Proc. Natl. Acad. Sci. U. S. A. 107, 12529−12534.(56) Kull, F. J., Sablin, E. P., Lau, R., Fletterick, R. J., and Vale, R. D.(1996) Crystal structure of the kinesin motor domain reveals astructural similarity to myosin. Nature 380, 550−555.(57) Turner, J., Anderson, R., Guo, J., Beraud, C., Fletterick, R., andSakowicz, R. (2001) Crystal structure of the mitotic spindle kinesinEg5 reveals a novel conformation of the neck-linker. J. Biol. Chem. 276,25496−25502.(58) Parke, C. L., Wojcik, E. J., Kim, S., and Worthylake, D. K.(2010) ATP hydrolysis in Eg5 kinesin involves a catalytic two-watermechanism. J. Biol. Chem. 285, 5859−5867.(59) Marx, A., Muller, J., Mandelkow, E. M., Woehlke, G., Bouchet-Marquis, C., Hoenger, A., and Mandelkow, E. (2008) X-ray structureand microtubule interaction of the motor domain of Neurosporacrassa NcKin3, a kinesin with unusual processivity. Biochemistry 47,1848−1861.(60) Peters, C., Brejc, K., Belmont, L., Bodey, A. J., Lee, Y., Yu, M.,Guo, J., Sakowicz, R., Hartman, J., and Moores, C. A. (2010) Insightinto the molecular mechanism of the multitasking kinesin-8 motor.EMBO J. 29, 3437−3447.(61) Kozielski, F., De Bonis, S., Burmeister, W. P., Cohen-Addad, C.,and Wade, R. H. (1999) The crystal structure of the minus-end-directed microtubule motor protein ncd reveals variable dimerconformations. Structure 7, 1407−1416.
Biochemistry Article
dx.doi.org/10.1021/bi300362a | Biochemistry 2012, 51, 5022−50325031

(62) Sablin, E. P., Case, R. B., Dai, S. C., Hart, C. L., Ruby, A., Vale,R. D., and Fletterick, R. J. (1998) Direction determination in theminus-end-directed kinesin motor ncd. Nature 395, 813−816.(63) Pettersen, E. F., Goddard, T. D., Huang, C. C., Couch, G. S.,Greenblatt, D. M., Meng, E. C., and Ferrin, T. E. (2004) UCSFchimera - A visualization system for exploratory research and analysis.J. Comput. Chem. 25, 1605−1612.(64) Humphrey, W., Dalke, A., and Schulten, K. (1996) VMD: visualmolecular dynamics. J. Mol. Graph. 14 (33−38), 27−38.(65) Phillips, J. C., Braun, R., Wang, W., Gumbart, J., Tajkhorshid, E.,Villa, E., Chipot, C., Skeel, R. D., Kale, L., and Schulten, K. (2005)Scalable molecular dynamics with NAMD. J. Comput. Chem. 26, 1781−1802.(66) MacKerell, A. D., Bashford, D., Bellott, M., Dunbrack, R. L.,Evanseck, J. D., Field, M. J., Fischer, S., Gao, J., Guo, H., Ha, S.,Joseph-McCarthy, D., Kuchnir, L., Kuczera, K., Lau, F. T. K., Mattos,C., Michnick, S., Ngo, T., Nguyen, D. T., Prodhom, B., Reiher, W. E.,Roux, B., Schlenkrich, M., Smith, J. C., Stote, R., Straub, J., Watanabe,M., Wiorkiewicz-Kuczera, J., Yin, D., and Karplus, M. (1998) All-atomempirical potential for molecular modeling and dynamics studies ofproteins. J. Phys. Chem. B 102, 3586−3616.(67) Mackerell, A. D., Jr., Feig, M., and Brooks, C. L., 3rd (2004)Extending the treatment of backbone energetics in protein force fields:limitations of gas-phase quantum mechanics in reproducing proteinconformational distributions in molecular dynamics simulations. J.Comput. Chem. 25, 1400−1415.(68) Foloppe, N., and MacKerell, A. D. (2000) All-atom empiricalforce field for nucleic acids: I. Parameter optimization based on smallmolecule and condensed phase macromolecular target data. J. Comput.Chem. 21, 86−104.(69) Deserno, M., and Holm, C. (1998) How to mesh up Ewaldsums. I. A theoretical and numerical comparison of various particlemesh routines. J. Chem. Phys. 109, 7678−7693.(70) Schlick, T., Skeel, R. D., Brunger, A. T., Kale, L. V., Board, J. A.,Hermans, J., and Schulten, K. (1999) Algorithmic challenges incomputational molecular biophysics. J. Comput. Phys. 151, 9−48.(71) Brunger, A., Brooks, C. L., and Karplus, M. (1984) Stochasticboundary-conditions for molecular-dynamics simulations of St2 water.Chem. Phys. Lett. 105, 495−500.(72) Martyna, G. J., Hughes, A., and Tuckerman, M. E. (1999)Molecular dynamics algorithms for path integrals in constant pressure.J. Chem. Phys. 110, 3275−3290.(73) Brooks, B. R., Bruccoleri, R. E., Olafson, B. D., States, D. J.,Swaminathan, S., and Karplus, M. (1983) Charmm - A program formacromolecular energy, minimization, and dynamics calculations. J.Comput. Chem. 4, 187−217.(74) Shahbazi, Z., Ilies, H. T., and Kazerounian, K. (2010) Hydrogenbonds and kinematic mobility of protein molecules. J. Mechan. Robot.2, No. 021009.(75) Xu, D., Tsai, C. J., and Nussinov, R. (1997) Hydrogen bondsand salt bridges across protein-protein interfaces. Protein Eng. 10, 999−1012.(76) Eriksson, M. A., and Roux, B. (2002) Modeling the structure ofagitoxin in complex with the Shaker K+ channel: a computationalapproach based on experimental distance restraints extracted fromthermodynamic mutant cycles. Biophys. J. 83, 2595−2609.(77) Gilson, M. K., and Honig, B. H. (1988) Energetics of charge-charge interactions in proteins. Proteins 3, 32−52.(78) Im, W., Beglov, D., and Roux, B. (1998) Continuum SolvationModel: computation of electrostatic forces from numerical solutions tothe Poisson-Boltzmann equation. Comput. Phys. Commun. 111, 59−75.(79) Muller, J., Marx, A., Sack, S., Song, Y. H., and Mandelkow, E.(1999) The structure of the nucleotide-binding site of kinesin. Biol.Chem. 380, 981−992.(80) Al-Bassam, J., Cui, Y., Klopfenstein, D., Carragher, B. O., Vale,R. D., and Milligan, R. A. (2003) Distinct conformations of the kinesinUnc104 neck regulate a monomer to dimer motor transition. J. CellBiol. 163, 743−753.
(81) Skiniotis, G., Cochran, J. C., Muller, J., Mandelkow, E., Gilbert,S. P., and Hoenger, A. (2004) Modulation of kinesin binding by the C-termini of tubulin. EMBO J. 23, 989−999.(82) Kikkawa, M. (2008) The role of microtubules in processivekinesin movement. Trends Cell Biol. 18, 128−135.(83) Amos, L. A., and Hirose, K. (2007) A cool look at the structuralchanges in kinesin motor domains. J. Cell Sci. 120, 3919−3927.(84) Gittes, F., Meyhofer, E., Baek, S., and Howard, J. (1996)Directional loading of the kinesin motor molecule as it buckles amicrotubule. Biophys. J. 70, 418−429.(85) Block, S. M., Asbury, C. L., Shaevitz, J. W., and Lang, M. J.(2003) Probing the kinesin reaction cycle with a 2D optical forceclamp. Proc. Natl. Acad. Sci. U. S. A. 100, 2351−2356.(86) Kawaguchi, K., Uemura, S., and Ishiwata, S. (2003) Equilibriumand transition between single- and double-headed binding of kinesin asrevealed by single-molecule mechanics. Biophys. J. 84, 1103−1113.(87) Woehlke, G., Ruby, A. K., Hart, C. L., Ly, B., Hom-Booher, N.,and Vale, R. D. (1997) Microtubule interaction site of the kinesinmotor. Cell 90, 207−216.(88) Naber, N., Minehardt, T. J., Rice, S., Chen, X., Grammer, J.,Matuska, M., Vale, R. D., Kollman, P. A., Car, R., Yount, R. G., Cooke,R., and Pate, E. (2003) Closing of the nucleotide pocket of kinesin-family motors upon binding to microtubules. Science 300, 798−801.(89) Sack, S., Kull, F. J., and Mandelkow, E. (1999) Motor proteinsof the kinesin family. Structures, variations, and nucleotide bindingsites. Eur. J. Biochem. 262, 1−11.(90) Vale, R. D. (1996) Switches, latches, and amplifiers: commonthemes of G proteins and molecular motors. J. Cell Biol. 135, 291−302.(91) Smith, C. A., and Rayment, I. (1996) X-ray structure of themagnesium(II).ADP.vanadate complex of the Dictyostelium discoideummyosin motor domain to 1.9 Å resolution. Biochemistry 35, 5404−5417.(92) Farrell, C. M., Mackey, A. T., Klumpp, L. M., and Gilbert, S. P.(2002) The role of ATP hydrolysis for kinesin processivity. J. Biol.Chem. 277, 17079−17087.(93) Auerbach, S. D., and Johnson, K. A. (2005) Kinetic effects ofkinesin switch I and switch II mutations. J. Biol. Chem. 280, 37061−37068.(94) Yun, M., Zhang, X., Park, C. G., Park, H. W., and Endow, S. A.(2001) A structural pathway for activation of the kinesin motorATPase. EMBO J. 20, 2611−2618.(95) Grant, B. J., McCammon, J. A., Caves, L. S., and Cross, R. A.(2007) Multivariate analysis of conserved sequence-structure relation-ships in kinesins: coupling of the active site and a tubulin-binding sub-domain. J. Mol. Biol. 368, 1231−1248.(96) Uchimura, S., Oguchi, Y., Hachikubo, Y., Ishiwata, S., and Muto,E. (2010) Key residues on microtubule responsible for activation ofkinesin ATPase. EMBO J. 29, 1167−1175.(97) Grant, B. J., Gheorghe, D. M., Zheng, W., Alonso, M., Huber, G.,Dlugosz, M., McCammon, J. A., and Cross, R. A. (2011) Electrostaticallybiased binding of kinesin to microtubules. PLoS Biol. 9, e1001207.(98) Kull, F. J., and Endow, S. A. (2002) Kinesin: switch I & II andthe motor mechanism. J. Cell Sci. 115, 15−23.(99) Song, H., and Endow, S. A. (1998) Decoupling of nucleotide-and microtubule-binding sites in a kinesin mutant. Nature 396, 587−590.
Biochemistry Article
dx.doi.org/10.1021/bi300362a | Biochemistry 2012, 51, 5022−50325032