algn q221 financial slides draft 07.27.21 1045pm
TRANSCRIPT

1© 2021 Align Technology, Inc. All rights reserved. 1
Financial ResultsQ2 2021Align Technology, Inc.
For Align Technology and many companies, Q2 2020 was significantly impacted by COVID-19 business disruptions and comparisons of our results for Q2 2021 should be considered accordingly.

2© 2021 Align Technology, Inc. All rights reserved.
Conference Call Contacts
• Speakers:‐ Joe Hogan, President and CEO
‐ John Morici, CFO
‐ Shirley Stacy, VP, Corporate Communications & Investor Relations
• Replay and Webcast Archive:‐ Telephone replay will be available through 5:30pm ET,
August 11, 2021
‐ Domestic callers: 877-660-6853
‐ International callers: 201-612-7415
‐ Conference # 13720779
‐ Audio webcast archive will be available at http://investor.aligntech.com for one month
Align Technology, Inc. – Q2 2021 Financial Results
• Website: http://investor.aligntech.com/• Email: [email protected]• Tel: (602) 742-2000 • Corporate and Investor Communications:
‐ Shirley Stacy, [email protected]
‐ Madelyn Homick, [email protected]

3© 2021 Align Technology, Inc. All rights reserved.
Safe Harbor and Forward-Looking Statement• This presentation contains forward-looking statements, including quotations from management regarding the value and broad impact of intraoral scanners in dental and orthodontic practices, the potential
impact of marketing campaigns and initiatives as well as statements regarding new facilities and capital improvements and project timing and costs, our expectations for the benefits of new and amendedcustomer agreements, our expectations for our new products, features, and accessories and their availability, our expectations regarding the continuing impact of COVID-19, our beliefs concerning ourcompetitive positioning, ability to execute on our strategic growth initiatives, seasonality, and market opportunities, and statements regarding certain business metrics on either or both a GAAP or non-GAAPbasis for 2021, including, but not limited to, anticipated net revenues and growth rate for the year and, in particular, the second half of 2021, operating margin, and in connection with the timing, means andamount of anticipated stock repurchases. Forward-looking statements contained in our earnings release relating to expectations about future events or results are based upon information available to Align asof the date hereof. Readers are cautioned that these forward-looking statements are only predictions and are subject to risks, uncertainties, and assumptions that are difficult to predict. As a result, actualresults may differ materially and adversely from those expressed in any forward-looking statement.
• Factors that might cause such a difference include, but are not limited to:
• the impact of the COVID-19 pandemic on the health and safety of our employees, customers, patients, and our suppliers, as well as the physical and economic impacts of the various recommendations,orders, and protocols issued by local and national governmental agencies in light of continual evolution of the pandemic, including any periodic reimplementation of preventative measures in variousglobal locations;
• difficulties predicting customer and consumer purchasing behavior and changes in consumer spending habits as a result of, among other things, prevailing economic conditions, levels of employment,salaries and wages, and consumer confidence, particularly in light of the pandemic and as pandemic-related restrictions are eased regionally and globally;
• unexpected or rapid changes in the growth or decline of our domestic and/or international markets;• increasing competition from existing and new competitors;• rapidly evolving and groundbreaking advances that fundamentally alter the dental industry or the way new and existing customers market and provide products and services to consumers;• the ability to protect our intellectual property rights;• continued compliance with regulatory requirements;• declines in, or the slowing of the growth of, sales of our intra-oral scanners domestically and/or internationally and the impact either would have on the adoption of Invisalign products;• the willingness and ability of our customers to maintain and/or increase product utilization in sufficient numbers;• the possibility that the development and release of new products or enhancements to existing products do not proceed in accordance with the anticipated timeline or may themselves contain bugs or
errors requiring remediation and that the market for the sale of these new or enhanced products may not develop as expected;• a tougher consumer demand environment in China generally, especially for manufacturers and service providers whose headquarters or primarily operations are not based in China;• the risks relating to our ability to sustain or increase profitability or revenue growth in future periods (or minimize declines) while controlling expenses;• the impact of excess or constrained capacity at our manufacturing and treat operations facilities and pressure on our internal systems and personnel;• the compromise of customer and/or patient data for any reason;• the timing of case submissions from our doctors within a quarter as well as an increased manufacturing costs per case;• foreign operational, political and other risks relating to our international manufacturing operations; and• the loss of key personnel or work stoppages.
• The foregoing and other risks are detailed from time to time in our periodic reports filed with the Securities and Exchange Commission, including, but not limited to, our Annual Report on Form 10-K for the yearended December 31, 2020, which was filed with the Securities and Exchange Commission (SEC) on February 26, 2021 and our latest Quarterly Report on Form 10-Q for the quarter ended March 31, 2021,which was filed with the SEC on May 5, 2021. Align undertakes no obligation to revise or update publicly any forward-looking statements for any reason.

4© 2021 Align Technology, Inc. All rights reserved.
About Non-GAAP Financial Measures• To supplement our condensed consolidated financial statements, which are prepared and presented in accordance with generally accepted accounting
principles in the United States ("GAAP"), we may provide investors with certain non-GAAP financial measures which may include gross profit, gross margin, operating expenses, income (loss) from operations, operating margin, interest income and other income (expense), net, net income (loss) before provision for (benefit from) income taxes, provision for (benefit from) income taxes, effective tax rate, net income (loss) and/or diluted net income (loss) per share, which exclude certain items that may not be indicative of our fundamental operating performance including discrete cash and non-cash charges or gains that are included in the most directly comparable GAAP measure. Unless otherwise indicated, when we refer to non-GAAP financial measures they will exclude the effects of stock-based compensation, amortization of acquired intangibles, non-cash deferred tax assets and associated amortization related to the intra-entity transfer of non-inventory assets, acquisition-related costs, and arbitration award gain, and, if applicable, any associated tax impacts.
• We use non-GAAP financial measures for financial and operational decision-making and as a means to evaluate period-to-period comparisons. Our management believes that the use of certain non-GAAP financial measures provide meaningful supplemental information regarding our recurring core operating performance. We believe that both management and investors benefit from referring to these non-GAAP financial measures in assessing our performance and when planning, forecasting, and analyzing future periods. These non-GAAP financial measures also facilitate management's internal evaluation of period-to-period comparisons. We believe these non-GAAP financial measures are useful to investors both because (1) they allow for greater transparency with respect to key metrics used by management in its financial and operational decision-making and (2) they will be provided to and used by our institutional investors and the analyst community to help them analyze the performance of our business.
• There are limitations to using non-GAAP financial measures, though, because they are not prepared in accordance with GAAP and may be different from non-GAAP financial measures used by other companies. The non-GAAP financial measures are limited in value because they exclude certain items that may have a material impact upon our reported financial results. In addition, they are subject to inherent limitations as they reflect the exercise of judgments by management about which charges are excluded from the non-GAAP financial measures. We compensate for these limitations by analyzing current and future results on a GAAP as well as a non-GAAP basis and also by providing GAAP measures in our public disclosures. The presentation of non-GAAP financial information is meant to be considered in addition to, not as a substitute for or in isolation from, the directly comparable financial measures prepared in accordance with GAAP. We urge investors to review the reconciliation of our GAAP financial measures to the comparable Non-GAAP financial measures included in this presentation and not to rely on any single financial measure to evaluate our business. For more information on these non-GAAP financial measures, please see the table captioned "Unaudited GAAP to Non-GAAP Reconciliation."
5© 2021 Align Technology, Inc. All rights reserved.
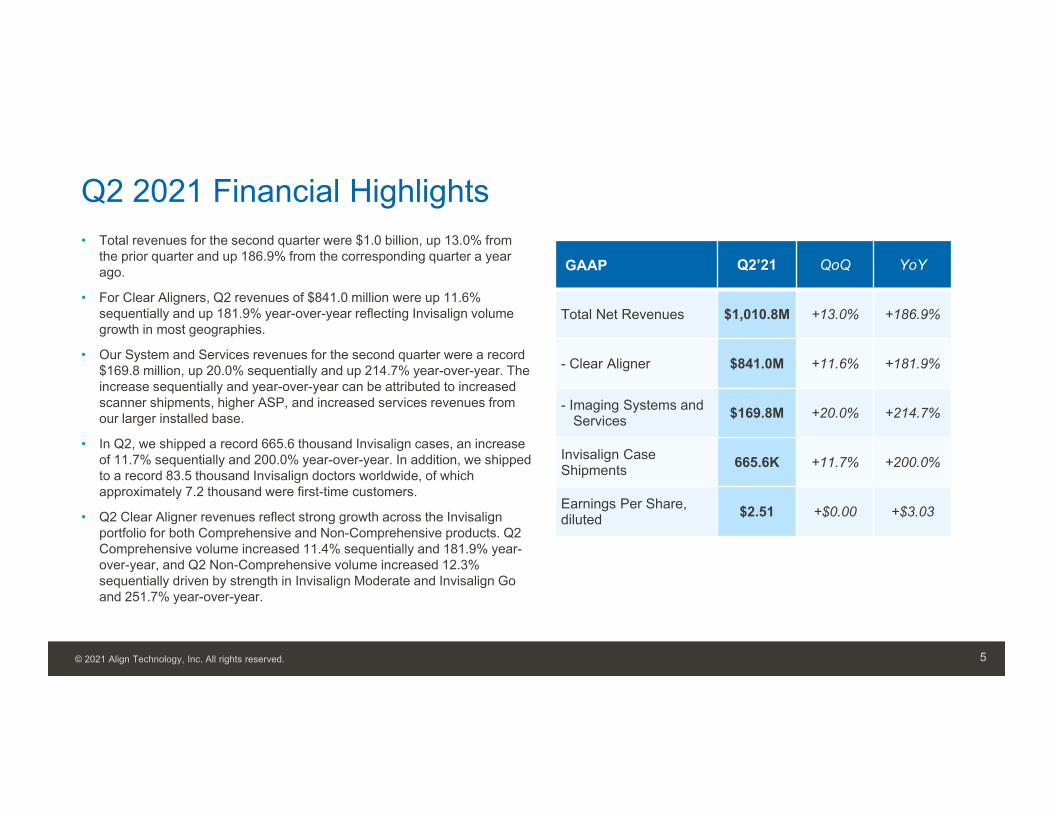
Q2 2021 Financial Highlights• Total revenues for the second quarter were $1.0 billion, up 13.0% from
the prior quarter and up 186.9% from the corresponding quarter a year ago.
• For Clear Aligners, Q2 revenues of $841.0 million were up 11.6% sequentially and up 181.9% year-over-year reflecting Invisalign volume growth in most geographies.
• Our System and Services revenues for the second quarter were a record $169.8 million, up 20.0% sequentially and up 214.7% year-over-year. The increase sequentially and year-over-year can be attributed to increased scanner shipments, higher ASP, and increased services revenues from our larger installed base.
• In Q2, we shipped a record 665.6 thousand Invisalign cases, an increase of 11.7% sequentially and 200.0% year-over-year. In addition, we shipped to a record 83.5 thousand Invisalign doctors worldwide, of which approximately 7.2 thousand were first-time customers.
• Q2 Clear Aligner revenues reflect strong growth across the Invisalign portfolio for both Comprehensive and Non-Comprehensive products. Q2 Comprehensive volume increased 11.4% sequentially and 181.9% year-over-year, and Q2 Non-Comprehensive volume increased 12.3% sequentially driven by strength in Invisalign Moderate and Invisalign Go and 251.7% year-over-year.
GAAP Q2’21 QoQ YoY
Total Net Revenues $1,010.8M +13.0% +186.9%
- Clear Aligner $841.0M +11.6% +181.9%
- Imaging Systems and Services $169.8M +20.0% +214.7%
Invisalign Case Shipments 665.6K +11.7% +200.0%
Earnings Per Share, diluted $2.51 +$0.00 +$3.03

6© 2021 Align Technology, Inc. All rights reserved.
$298.3$620.8
$700.7$753.3
$841.0
$54.0
$113.4$133.8 $141.5
$169.8
Q2'20 Q3'20 Q4'20 Q1'21 Q2'21
WW Net Revenues ($M)
Clear Aligner Systems & Services
$734.1
$1,010.8
Trended GAAP Financials
221.9
496.1568.0 595.8
665.6
Q2'20 Q3'20 Q4'20 Q1'21 Q2'21
Clear Aligner Shipments (#K)
63.7%
72.7% 73.2%75.7% 75.0%
Q2'20 Q3'20 Q4'20 Q1'21 Q2'21
Gross Margin %
-20.7%
24.1% 25.5% 25.2% 26.6%
Q2'20 Q3'20 Q4'20 Q1'21 Q2'21
Operating Margin %
Percentages are based on actual values. Rounding may affect totals
$352.3
$834.5 $894.8

7© 2021 Align Technology, Inc. All rights reserved.
• We’re pleased to report our first $1 billion revenue quarter with record volumes reflecting continued momentum from both Clear Aligners and Systems and Services.
• For Q2, Systems and Services revenues reflects strong growth across all regions and the strategic value of the iTero business with continued adoption of the iTero Element 5D Plus Series of next-generation scanners and imaging systems which launched in February. Increasingly, doctors are seeing the strategic impact and value of iTero scanners in their practices, in addition to its role in Invisalign case submissions – it is a true workhorse and digital enabler in every type of practice and across every type of orthodontic and restorative workflow.
• Q2 sequential Clear Aligner volumes were primarily driven by strength in both adult and teen market segments and across customer channels and regions, especially from the Americas and EMEA regions, reflecting the expanding opportunity for Invisalign treatment among adults globally, as well as the underlying orthodontic market as we continue to build awareness of the Invisalign brand and drive utilization among teens and younger patients.
• For Q2’21, Invisalign clear aligner volumes for teens were up 9.5% sequentially and 156.3% year-over-year to 181.0 thousand teens, representing 1/3 of total cases shipped, with strong growth from North America and EMEA orthodontists. During the quarter we hosted several teen-focused, peer-to-peer events designed to build clinical confidence in teen treatment and highlight the teen digital treatment journey with Invisalign treatment. The recent APAC virtual symposium featured leading providers focusing on clinical excellence with teen treatment, and North America hosted the Invisalign Teen Forum: Virtual Edition for Invisalign doctors, bringing together clinical speakers, digital industry experts, and teen patient panelists to share their insights. In May, Align focused on the Align Digital Platform at the 2021 AAO annual session, featuring a dynamic virtual line-up of Invisalign doctors describing how they have grown their practices through adoption of digital technology.
• Our Q2 results also reflect the positive impact of our investments in consumer marketing, generating billions of impressions and a 33% year-over-year increase in leads for Invisalign doctors. During the quarter we launched the next phase of our Mom/Teen multi-touch campaign, as well as a new “Invis is a Powerful Thing” campaign designed to engage teens and young adults. We also deepened our partnership with influencers like Charli D'Amelio with the first limited-edition aligner case as part of our new e-Commerce initiative featuring custom cases, cleaning and oral care products, as well as accessories like Invisalign Stickables all of which are available on Invisalign.com (https://www.invisalignaccessories.com/). These and other consumer initiatives are important in supporting doctors’ practices especially through the busy summer teen season and beyond. They also build on our investments in digital technology and innovation that are the foundation of the Align Digital Platform, including integrated digital workflows and virtual tools designed to improve clinical confidence, treatment efficiency, and patient outcomes.
• A year ago, we released Invisalign Virtual Appointment and Invisalign® Virtual Care tools within our MyInvisalign app, in response to the global pandemic to enable Invisalign doctors to provide continuity of care for their patients. Today, Invisalign Virtual Care is available globally in 60 markets and the My Invisalign App has been downloaded by 1 million Invisalign patients worldwide. It was recently recognized as the “Best Virtual Care Platform” by the MedTech Breakthrough Awards program and as “Digital Innovation of the Year” by Healthcare Asia Medtech Awards. As part of Invisalign Virtual Care, patients use the My Invisalign App to stay engaged in their treatment and convey progress photos to their doctor, fostering two-way communication with their doctor throughout their Invisalign treatment journey.
Opening Commentary

8© 2021 Align Technology, Inc. All rights reserved.
Q2 2021 Financial HighlightsTeens and Adults
• Approximately 10.9M total Invisalign patients to date, with 2.8M teens.
• Continuing to build upon the teen market, in Q2, 181.0 teens and pre-teens started treatment with Invisalign Clear Aligners.
• In Q2, teens or younger patients increased 9.5% sequentially and 156.3% year-over-year.
• Q2 adult patients increased 12.6% sequentially and 220.4% year-over-year.

9© 2021 Align Technology, Inc. All rights reserved.
• For the Americas region, Q2 was another strong quarter – with Invisalign case volume up 10.9% sequentially and up 260.7% year-over-year, reflecting growth across the region especially in the US and Canada, from both comprehensive and non-comprehensive products, and increased Invisalign utilization from Orthodontic and GP channels. DSO utilization continues to be a strong growth driver as well, led by Heartland and Smile Doctors.
Q2 2021 Financial HighlightsAmericas
Q2'20 Q1'21 Q2'21
+10.9% Q/Q
+260.7% Y/Y
*number of cases shipped/number of doctors to whom cases were shipped
Americas Invisalign Metrics
NA Ortho
NA GP
North Americas Utilization*
Americas Shipments
11.011.0 26.826.8 29.429.4
2.52.5 4.84.8 5.35.3
Q2’20 Q1’21 Q2’21

10© 2021 Align Technology, Inc. All rights reserved.
• For our International business, Q2 Invisalign case volume was up sequentially 12.7%. On a year-over-year basis, International shipments were up 149.2%.
EMEA• For EMEA, Q2 volumes were up sequentially 16.9% and 264.7% year-over-year with broad-
based growth across all markets, led by Iberia, UKI, and Italy along with continued growth in our expansion markets. In Q2, growth from both channels was strong, with orthodontic channel growth reflecting increased Invisalign utilization, and GP channel growth driven by increased Invisalign submitters.
• For Q2, EMEA growth also reflects adoption of the Invisalign First product - designed to treat a broad range of teeth straightening issues in growing children, from simple to complex, including crowding, spacing, and narrow dental arches. Aiding in treatment engagement for these younger patients, Invisalign Stickables are innovative accessories designed exclusively for use with the patented SmartTrack® material in Invisalign clear aligners. Available in an array of designs, colors, shapes, and themes, Invisalign Stickables are a fun way for patients to show their personal style during Invisalign treatment.
• During the quarter, we also hosted a successful virtual edition of GP Growth Summit attended by over 1,200 doctors from the EMEA region.
APAC• For APAC, Q2 volumes were up sequentially 4.8% and 49.8% on a year year-over-year
basis, reflecting growth across the region, led by Japan, China and ANZ, despite new and or extended COVID restrictions in several APAC markets. APAC performance reflects strength in GP Channel with increased Invisalign submitters, especially in Japan which continues to deliver strong growth.
• During the quarter, we also hosted our China Forum, attended by over 1,500 doctors from private clinics, our APAC Virtual Symposium, attended by over 1,400 doctors, as well as the China Public Hospital Forum in June.
Q2 2021 Financial HighlightsInternational
Q2'20 Q1'21 Q2'21
International Invisalign Metrics
+12.7% Q/Q
+149.2% Y/Y
4.74.7 6.86.8 7.17.1
Q2’20 Q1’21 Q2’21
International Shipments
*number of cases shipped/number of doctors to whom cases were shipped
International Utilization*

11© 2021 Align Technology, Inc. All rights reserved.
Invisalign Consumer Marketing
• Our consumer marketing is focused on educating consumers about the Invisalign system and driving that demand to Invisalign doctors’ offices, ultimately capitalizing on the massive market opportunity to transform 500 million smiles. We have provided many of our key metrics that show increased activity and engagement with the Invisalign brand in our Q2 quarterly presentation slides available on aligntech.com.
• In Q2, we launched the next generation of the “Invis Is” multi-touch campaign driving reach and awareness with adult, mom and teen consumers yielding more than 198% Y/Y growth in visitors globally to our websites and more than 82% increase in searches for an Invisalign trained doctor. Leading with the Invis is Not Your Parents Braces campaign, we connected with teens, utilizing digital media such as YouTube, Twitch, and social media. We also continued with our Invisalign ChangeMakers program that celebrated and recognized teens driving change in their communities which was covered by multiple media outlets such as Elite Daily, Refinery29, Yahoo! Unwind, Hollywood Life, SheKnows, J-14, Yahoo Finance, Parents.com, Glamour and NewBeauty and generated more than 600 million impressions.
• In the EMEA region, our new marketing campaign to drive engagement, “Invis is a powerful thing,” went live in the UK, Germany, and France during the quarter resulting in more than 169% Y/Y increase in unique visitors and 136% Y/Y increase in doctor locater searches. We will continue to roll out the campaign to additional markets in the region during the third quarter.
• We continued to expand our consumer advertising in the APAC region in Australia, Japan, and China and saw more than an 812% Y/Y increase in consumer engagement and a 55% Y/Y increase in leads.
• Lastly, we continue to build strong relationships with global search and social media giants like Google, Snapchat, and TikTok in order to further leverage our best-in-class consumer demand programs more effectively globally. These partners recognize the power of the Invisalign brand and are helping us amplify and gain efficiencies from our investments.

12© 2021 Align Technology, Inc. All rights reserved.
• Social media and influencer marketing• Teen, Adult and Moms of teens
AMERICAS EMEA
• Social media and influencer marketing
APAC
• Social media and influencer marketing• KOL campaigns
Q2 2021 Invisalign Brand Consumer Marketing
9.4MWebsite Visitors
181KDoc Locator Searches
8.7Website Visitors
650KDoc Locator Searches
3.1MWebsite Visitors
580KDoc Locator Searches

13© 2021 Align Technology, Inc. All rights reserved.
Worldwide Invisalign Brand Consumer Highlights
+143.9MWebsite visitors
+13.5MSocial media fans
+16.4MDoc locator searches
+7.4MSmile assessments
Data is cumulative as of 06/30/21.

14© 2021 Align Technology, Inc. All rights reserved.
• For our Systems and Services business, Q2 revenues were up 20.0% sequentially and up 214.7% year-over-year reflecting strong scanner shipments and services. This represents the 4th consecutive quarter of sequential revenue growth.
• The iTero Element 5D Plus Imaging System continues gaining traction across all regions with strong adoption with new customers in the APAC and EMEA regions and with existing customers in the Americas region.
• In APAC, the iTero Element 2 intraoral scanner did well during the quarter, helping to transform digital workflows and chairside consults for doctors.
• During the quarter we announced the new iTero Workflow 2.0 software and previewed auto-upload functionality on the iTero Element 5D Imaging System.
‐ The iTero Workflow 2.0 software’s advanced features, including faster scanning, improved visualization, and enhanced patient communication tools, were rolled out regionally in all markets where the iTero Element Plus imaging systems are sold.
‐ The iTero Element 5D imaging system auto-upload feature will eliminate steps and streamline Invisalign case submissions with intraoral color scan images that can be used in place of traditional intraoral photos. The auto-upload functionality is scheduled for release during the third quarter of 2021.
• There is great symmetry between the Systems and Services business and the Clear Aligner business reflected in the positive correlation between the deployment of scanners and increased utilization of Invisalign Clear Aligners.
• In terms of digital scans used for Invisalign case submissions, total digital scans in Q2 increased to 82.2% from 78.5% in Q2 last year. International scans increased to 76.2% up from 72.0% in the same quarter last year. For the Americas, 86.6% of cases were submitted digitally compared to 85.7% a year ago.
• Cumulatively, over 40.1 million orthodontic scans and 8.4 million restorative scans have been performed with iTero scanners.
• We’re also pleased to share that Align received regulatory approval for the iTero Element 5D Plus series in Japan on July 1, with a formal launch event planned for August.
Q2 2021 Financial HighlightsSystems and Services
$54.0
$141.5$169.8
Q2'20 Q1'21 Q2'21
+20.0% Q/Q
+214.7% Y/Y(M)
Imaging Systems and CAD/CAM Services
Systems and Services Revenue
Invisalign scans include but not limited to additional aligner order scans, progress tracking, and does not reflect total Invisalign case shipments. Data on file at Align TechnologyThe iTero Element 2 and the iTero Element Flex intraoral scanners are currently available in the U.S., Canada, China, and majority of EMEA and APAC markets. The iTero Element 5D imaging system is available in the U.S., Canada, the majority of EMEA and select APAC and LATAM markets
Americas 77.5% 78.8% 79.5% 80.5% 85.7% 83.2% 84.0% 85.5% 86.6%
International 60.9% 62.6% 64.7% 68.7% 72.0% 72.1% 73.7% 75.1% 76.2%
Q2’19 Q3’19 Q4’19 Q1’20 Q2’20 Q3’20 Q4’20 Q1’21 Q2’21
.

15© 2021 Align Technology, Inc. All rights reserved.
• During the quarter, exocad launched the Creator Center, the new exocad one-stop-shop for online and in-person educational events with a database consisting of 35 educational webinars showcasing the highlights and add-on features of exocad’s software solutions, DentalCAD Galway 3.0 and exoplan 3.0 Galway. More than 2,500 users and distributors have been trained on the new software releases worldwide.
• exocad also expanded their market coverage with a new global OEM partner, Ivoclar Vivadent (IV) – one of the largest manufacturers in the dental industry. This strategic collaboration will give exocad access to thousands of new IV users worldwide and will also provide exocad users with access to production processes within removable prosthetics, in the future.
• Earlier this month, exocad also released PartialCAD 3.0 Galway, its module for removable partial denture frameworks, which has new and advanced features for the design of high-quality partial dentures. This new release enhances digital CAD/CAM possibilities for exocad users and dental technicians by providing simpler design solutions for complex cases. PartialCAD 3.0 Galway provides both experts and new users with smooth, improved integration with DentalCAD, exocad’s leading software for dental laboratories.
• Bringing the iTero and exocad businesses together makes us more viable within the GP segment and more relevant in day-to-day comprehensive dentistry for our customers. The combination of Invisalign Clear Aligners and iTero scanners have long provided a seamless workflow for orthodontic treatment. The integration of exocad’s expertise in restorative dentistry, implantology, guided surgery, and smile design takes the Align technology portfolio beyond our established footprint in orthodontics to ortho-restorative and restorative treatment, and paves the way for new, cross-disciplinary workflows that span from visualization and treatment planning to lab production to chairside. exocad also broadens Align’s platform reach in the digital dentistry with over 200 partners and more than 40,000 licenses installed worldwide.
Chart space
Q2 2021 Financial HighlightsSystems and Services continued

16© 2021 Align Technology, Inc. All rights reserved.
Q2 2021 Financial Review
For Align Technology and many companies, Q2 2020 was significantly impacted by COVID-19 business disruptions and comparisons of our results for Q2 2021 should be considered accordingly.

17© 2021 Align Technology, Inc. All rights reserved.
Revenues TrendQ2’21 highlights
$298.3
$620.8$700.7
$753.3$841.0
$54.0
$113.4$133.8
$141.5$169.8
Q2'20 Q3'20 Q4'20 Q1'21 Q2'21
$M
Clear Aligner Systems & Services
+13.0% Q/Q
+186.9%Y/Y
• Total revenues for the second quarter were $1.0 billion, up 13.0% from the prior quarter and up 186.9% from the corresponding quarter a year ago.
• For Clear Aligners, Q2 revenues of $841.0 million were up 11.6% sequentially and up 181.9% year-over-year reflecting Invisalign volume growth in most geographies.
• Q2 Clear Aligner revenues reflect strong growth across the Invisalign portfolio for both Comprehensive and Non-Comprehensive products. Q2 Comprehensive volume increased 11.4% sequentially and 181.9% year-over-year, and Q2 Non-Comprehensive volume increased 12.3% sequentially driven by strength in Invisalign Moderate and Invisalign Go and 251.7% year-over-year. Q2 adult patients increased 12.6% sequentially and 220.4% year-over-year. In Q2, teens or younger patients increased 9.5% sequentially and 156.3% year-over-year.
• Clear Aligner revenues were unfavorably impacted by foreign exchange of approximately $3.4 million or approximately 0.5 points sequentially. On a year-over-year basis, Clear Aligner revenues were favorably impacted by foreign exchange of approximately $36.7 million or approximately 12.3 points.
• For Q2 Invisalign Comprehensive ASPs decreased sequentially and year-over-year. On a sequential basis, Invisalign Comprehensive ASPs reflect higher discounts, credits, and foreign exchange, partially offset by regional mix. On a year-over-year basis, Comprehensive ASPs reflect the increase in net revenue deferrals for new Invisalign cases versus additional aligner shipments partially offset by foreign exchange. Recall Q2 2020 ASPs increased as a result of more additional aligner shipments as doctors were focused on maintaining treatment progress for existing Invisalign patients. This trend reversed itself after practices reopened in Q3 and demand for new cases ramped up significantly.
• Q2 Invisalign Non-Comprehensive ASPs increased sequentially and were flat year-over-year. On a sequential basis, Invisalign Non-Comprehensive ASPs reflect lower discounts partially offset by foreign exchange. On a year-over-year basis Invisalign Non-Comprehensive ASPs were favorably impacted by foreign exchange offset by the higher mix of new Invisalign cases versus additional aligner shipments.
• Clear aligner deferred revenues on the balance sheet increased $101 million sequentially and $337 million year-over-year and will be recognized as the additional aligners are shipped.
• Our System and Services revenues for the second quarter were a record $169.8 million, up 20.0% sequentially and up 214.7% year-over-year. The increase sequentially and year-over-year can be attributed to increased scanner shipments, higher ASP, and increased services revenues from our larger installed base.
• Our Systems and Services deferred revenue on the balance sheet was up 22% sequentially and up 135% year-over-year primarily due to the increase in scanner sales and the deferral of service revenues, which will be recognized ratably over the service period.
$352.3
$734.1$834.5
Q/Q and Y/Y percentages are based on actual values. Rounding may affect totals
$894.8$1,010.8

18© 2021 Align Technology, Inc. All rights reserved.
Invisalign Average Selling Price (ASP)Product groups
Comprehensive Products: Comprehensive Products include, but are not limited to, Invisalign Comprehensive, Invisalign Assist and Invisalign First
Non-Comprehensive Products: Non-Comprehensive Products include, but are not limited to, Invisalign Moderate, Invisalign Lite, Invisalign Express packages and Invisalign Go
ASP: Invisalign case revenue / Invisalign case shipments
Q2'19 Q3'19 Q4'19 Q1'20 Q2'20 Q3'20 Q4'20 Q1'21 Q2'21 Comprehensive Products $1,310 $1,335 $1,320 $1,340 $1,330 $1,245 $1,230 $1,265 $1,250 Non-comprehensive Products $990 $1,025 $1,020 $1,050 $1,035 $1,005 $1,000 $1,030 $1,040
$700
$900
$1,100
$1,300
$1,500

19© 2021 Align Technology, Inc. All rights reserved.
Clear Aligner Shipments TrendQ2’21 highlights
Q/Q and Y/Y percentages are based on actual values. Rounding may affect totals
+200.0% Y/Y
+11.7% Q/Q• In Q2, we shipped a record 665.6 thousand
Invisalign cases, an increase of 11.7% sequentially and 200.0% year-over-year.
• In addition, we shipped to a record 83.5 thousand Invisalign doctors worldwide, of which approximately 7.2 thousand were first-time customers.
221.9
496.1568.0 595.8
665.6
Q2'20 Q3'20 Q4'20 Q1'21 Q2'21
(#K)

20© 2021 Align Technology, Inc. All rights reserved.
GAAP Gross Margin TrendQ2’21 highlights
Q/Q and Y/Y percentages are based on actual values. Rounding may affect totalsSee reconciliation of GAAP to Non-GAAP
63.7%
72.7% 73.2%75.7% 75.0%
Q2'20 Q3'20 Q4'20 Q1'21 Q2'21
(0.6)% pts
+11.4% pts• Second quarter overall gross margin was 75.0%, down 0.6 points
sequentially and up 11.4 points year-over-year. On a non-GAAP basis, excluding stock-based compensation and amortization of intangibles related to our exocad acquisition, overall gross margin was 75.4% for the second quarter, down 0.7 points sequentially and up 11.0 points year-over-year. Overall gross margin was favorably impacted by approximately 1.1 points on a year-over-year basis due to foreign exchange and relatively unchanged sequentially.
• Clear Aligner gross margin for the second quarter was 76.9%, down 0.7 points sequentially due to higher freight costs and slightly lower ASPs.
• Clear Aligner gross margin was up 12.4 points year-over-year due to increased manufacturing efficiencies from higher production volumes, partially offset by lower ASPs.
• Systems and Services gross margin for the second quarter was a record 65.9%, up 0.5 points sequentially primarily due to higher ASPs, partially offset by manufacturing variances and higher freight costs.
• Systems and Services gross margin was up 6.6 points year-over-year due to higher ASPs and service revenues, in addition to improved manufacturing efficiencies from higher production volumes, partially offset by higher freight costs.

21© 2021 Align Technology, Inc. All rights reserved.
GAAP Operating Expense TrendQ2’21 highlights
$297.3$357.0
$397.3$451.7
$489.6
Q2'20 Q3'20 Q4'20 Q1'21 Q2'21
$M +8.4% Q/Q
+64.7% Y/Y
• Q2 operating expenses were $489.6 million, up sequentially 8.4% and up 64.7% year-over-year. The sequential increase in operating expenses is due to increased consumer marketing spend, increased compensation related to additional headcount and higher commissions, and other general and administrative costs. Year-over-year, operating expenses increased by $192.3 million, reflecting our continued investment in marketing and sales and R&D activities and investments commensurate with business growth.
• On a non-GAAP basis, which excludes stock-based compensation and amortization of intangibles related to our exocad acquisition, operating expenses were $461.2 million, up sequentially 8.6% and up 73.6% year-over-year due to the reasons described above.
Q/Q and Y/Y percentages are based on actual values. Rounding may affect totalSee reconciliation of GAAP to Non-GAAP

22© 2021 Align Technology, Inc. All rights reserved.
-20.7%
24.1% 25.5% 25.2% 26.6%
Q2'20 Q3'20 Q4'20 Q1'21 Q2'21
GAAP Operating Margin and Earnings Per Share TrendQ2’21 highlights
$(0.52) $1.76 $2.00 $2.51 $2.51
+1.4% pts
+47.3% pts• Our second quarter operating income of $268.9 million resulted in an operating margin
of 26.6%, up 1.4 points versus prior quarter and up 47.3 points year-over-year. The sequential increase in operating margin was attributable primarily to operational leverage. The year-over-year increase in operating margin was primarily attributable to higher gross margin and operating leverage as well as the favorable impact from foreign exchange by approximately 1.8 points.
• On a non-GAAP basis, which excludes stock-based compensation and amortization of intangibles, operating margin for the second quarter was 29.8%, up 1.2 points sequentially, and up 40.8 points year-over-year.
• On a non-GAAP basis, which excludes stock-based compensation and amortization of intangibles, operating margin for the second quarter was 29.8%, up 1.2 points sequentially, and up 40.8 points year-over-year.
• Interest and other income & expense, net for the second quarter was a loss of $0.1 million, down sequentially by $36.3 million primarily due to the SDC arbitration award gain recorded in the first quarter.
• With regards to the second quarter tax provision, our GAAP tax rate was 25.7%, which was higher than the prior quarter rate of 23.4% primarily due to lower excess tax benefits from stock-based compensation. Our GAAP tax rate was lower than the same quarter last year, which was 44.8%, primarily due to foreign income taxed at lower rates.
• The second quarter tax rate on a non-GAAP basis was 19.5% compared to 20.2% in the prior quarter and 27.8% in the prior year. The second quarter non-GAAP tax rate was lower than the prior quarter and the second quarter of the prior year rates due to foreign income taxed at lower rates.
• Second quarter net income per diluted share was $2.51, flat sequentially and up $3.03 compared to the prior year. On a non-GAAP basis, net income per diluted share was $3.04 for the second quarter, up $0.55 sequentially and up $3.39 year-over-year.
Q/Q and Y/Y percentages are based on actual values. Rounding may affect totalsSee reconciliation of GAAP to Non-GAAP
Diluted Earnings (Loss) Per Share

23© 2021 Align Technology, Inc. All rights reserved.
Balance Sheet and Cash Flow Highlights
*Free cash flow is defined as cash flow from operations less purchase of property, plant and equipment and is a non-GAAP measureRounding may affect totals
($ in millions except for DSO)Q2’20 Q1’21 Q2’21
Accounts Receivables, net $473.3 $719.0 $808.1
DSO 121 days 72 days 72 days
Cash and Cash Equivalents $404.4 $1,131.7 $1,086.4
Cash Flow from Operations $59.9 $227.2 $317.5
Capital Expenditures $(34.4) $(43.4) $(124.2)
Free Cash Flow* $25.5 $183.8 $193.3
• As of June 30, 2021, cash and cash equivalents were $1.1 billion, flat sequentially. Of our $1.1 billion of cash and cash equivalents, $551.0 million was held in the US and $535.3 million was held by our International entities.
• Q2 accounts receivable balance was $808.1 million, up approximately 12.4% sequentially. Our overall days sales outstanding (DSO) was 72 days, flat sequentially and down approximately 49.1 days as compared to Q2 last year.
• Cash flow from operations for the second quarter was $317.5 million.
• Capital expenditures for the second quarter were $124.2 million, primarily related to our continued investment in increasing aligner capacity and facilities.
• Free cash flow, defined as cash flow from operations less capital expenditures, amounted to $193.3 million.
• We also have $300.0 million available under the revolving line of credit.
• Under our $1 Billion Repurchase Program announced in May 2021, we have $900.0 million remaining available for repurchase of our common stock.

24© 2021 Align Technology, Inc. All rights reserved.
Financial Outlook for Full Year 2021 Turning to our outlook and the factors that inform our view for the remainder of the year.
• Overall, we are very pleased with our second-quarter results and our continued strong performance across regions, customer channels and products. While there continues to be uncertainty around the pandemic and increasing restrictions related to COVID-19 in certain geographies, we are continuing to invest in our strategic growth initiatives, including sales, marketing, innovation and manufacturing capacity, to drive demand and conversion globally and are confident in our competitive position and ability to execute. At the same time, we are also anticipating more pronounced summer seasonality across all regions than we have experienced in recent years, as doctors, their staff and patients take long overdue vacations.
• Notwithstanding seasonality, given our strong performance and continued confidence in the huge market opportunity, our industry leadership, and our ability to execute, we are increasing our 2021 revenue guidance provided in April on the Q1’21 earnings call to a range of $3.85 billion to $3.95 billion. Additionally, we now expect our second half year-over-year revenue growth rate to be above the mid-point of our long-term operating model target of 20% to 30%. On a GAAP basis, we now anticipate our 2021 operation margin to be better than our prior guidance, in the range of 24.0% and 25.0%. On a Non-GAAP basis, we expect the 2021 operating margin to be approximately 3 points higher than our GAAP operating margin, after excluding stock-based compensation and intangible amortization.
• In addition, during Q3'21 we expect to repurchase up to $75 million of our common stock through either or a combination of open market repurchases, or an accelerated stock repurchase agreement.
• For 2021, we expect our investments in capital expenditures to be approximately $500.0 million. Capital expenditures primarily relate to building construction and improvements as well as additional manufacturing capacity to support our international expansion. Thisincludes our planned investment in a new manufacturing facility in Wroclaw, Poland, our first one in the EMEA region.

25© 2021 Align Technology, Inc. All rights reserved.
Closing Commentary• Q2 was a terrific quarter and we’re very pleased with the improvements we’ve seen in recovery in doctor’s practices. We truly value their
increasing adoption of digital treatment approaches. Their confidence in the unique Align Digital Platform that spans from iTero scanners to the world’s most sophisticated treatment planning, the largest 3D printing business on the globe to a patient app with over 1 million consumers along with the world’s most recognized orthodontic brand has driven strong performance across the business. Our performance over the last year confirms the incredible size of our target market and demonstrates that our strategy and investments in recent years have helped further solidify our competitive position. We have numerous growth drivers in a vastly underpenetrated market. And while we continue to see some lasting impact and continued uncertainty due to COVID, we remain confident in both the enormous opportunity we have to lead the evolution of digital orthodontics and comprehensive dentistry with our doctor customers, and in our ability to execute our strategy to increase adoption of Invisalign treatment globally.
• We are also confident in and excited about the benefits of digital treatment that more and more doctors are experiencing by transforming their practices with Invisalign digital orthodontics and iTero scanners for chairside treatment planning and visualization. In fact, Invisalign treatment requires on average 30% fewer doctor visits than fixed appliances – creating efficiency gains for the doctors and a better patient experience. And 85% of orthodontists surveyed agree that adopting the Align digital platform has made a huge difference in their practice – it provides ways to improve their efficiency and productivity.
• We look forward to updating you at our GP Summit and Investor Day in October in Las Vegas and sharing more examples of how Align ishelping doctors transform their practices and their approach to treatment.
(1) References• Buschang et al; Comparative time efficiency of aligner therapy and conventional edgewise braces. Angle Orthod 1 May 2014; 84 (3): 391–396. • Borda et al; Outcome assessment of orthodontic clear aligner vs fixed appliance treatment in a teenage population with mild malocclusions. Angle Orthod 1 July 2020; 90 (4): 485–490. (2) Disclaimer: • *Based on a survey in Dec 2020 to Mar 2021 of n=275 Invisalign Orthodontists who have used at least one digital Align solution over the past 12 months in their workflow: My Invisalign App; SmileView; Invisalign Virtual Appointment; iTero &/or Invisalign Outcome Simulator; Invisalign Photo
Uploader; ClinCheck Pro 6.0 &/or ClinCheck In-Face Visualization tool; Invisalign Virtual Care**, who were asked, how much do you agree or disagree with the following statement: “Adopting Align Technology’s digital solutions has made a huge difference in my practice – it provided ways to improve our efficiency and productivity.” in an agreement scale of 1-4 with 1 being “strongly agree’ and 4 being ‘strongly disagree.’ Doctors were surveyed in NA, EMEA, APAC and LATAM. Data on file at Align Technology, as of July 20, 2021.

26© 2021 Align Technology, Inc. All rights reserved.

27© 2021 Align Technology, Inc. All rights reserved.
Appendix

28© 2021 Align Technology, Inc. All rights reserved.
Chart space
Notes:1) Amortization of intangible assets related to our exocad
acquisition.
2) During 2021, acquisition related costs were for professional fees related to our exocad acquisition. During 2020, acquisition costs included third party advisory, legal, tax, accounting, banking, valuation, and other professional or consulting fees and foreign exchange losses related to a forward contract for the purchase commitment related to our exocad acquisition.
3) During Q1'21, we recorded a $43.4 million gain from the SDC arbitration award regarding the value of Align's capital account balance.
4) During Q1'20, we recorded a one-time net tax benefit for the deferred tax asset and certain costs associated with the intra-entity transfer of certain intellectual property rights and assets to our Swiss subsidiary. For the periods presented, we recorded amortization and certain adjustments to the benefit from the transferred intangible assets of our Swiss entity.
ALIGN TECHNOLOGY, INC.UNAUDITED GAAP TO NON-GAAP RECONCILIATION(in thousands, except per share data)
Unaudited GAAP to Non-GAAP reconciliation
2021 2020 2021 2020
GAAP gross profit 758,538$ 224,328$ 1,435,636$ 618,684$ Stock-based compensation 1,418 891 2,724 2,238 Amortization of intangibles (1) 2,175 1,650 4,350 1,650
Non-GAAP gross profit 762,131$ 226,869$ 1,442,710$ 622,572$
GAAP gross margin 75.0% 63.7% 75.3% 68.5%Non-GAAP gross margin 75.4% 64.4% 75.7% 68.9%
GAAP operating expenses 489,636$ 297,328$ 941,288$ 621,766$ Stock-based compensation (27,437) (24,116) (53,372) (45,696) Amortization of intangibles (1) (887) (1,595) (1,775) (1,595) Acquisition related costs (2) (68) (5,968) (104) (7,307)
Non-GAAP operating expenses 461,244$ 265,649$ 886,037$ 567,168$
GAAP income (loss) from operations 268,902$ (73,000)$ 494,348$ (3,082)$ Stock-based compensation 28,855 25,007 56,096 47,934 Amortization of intangibles (1) 3,062 3,245 6,125 3,245 Acquisition related costs (2) 68 5,968 104 7,307
Non-GAAP income (loss) from operations 300,887$ (38,780)$ 556,673$ 55,404$
GAAP operating margin 26.6% (20.7)% 25.9% (0.3)%Non-GAAP operating margin 29.8% (11.0)% 29.2% 6.1%
(100)$ (493)$ 36,075$ (17,056)$ Acquisition related costs (2) - 1,012 - 10,187 Arbitration award gain (3) - - (43,403) -
(100)$ 519$ (7,328)$ (6,869)$
268,802$ (73,493)$ 530,423$ (20,138)$ Stock-based compensation 28,855 25,007 56,096 47,934 Amortization of intangibles (1) 3,062 3,245 6,125 3,245 Acquisition related costs (2) 68 6,980 104 17,494 Arbitration award gain (3) - - (43,403) -
300,787$ (38,261)$ 549,345$ 48,535$
69,088$ (32,891)$ 130,333$ (1,497,667)$ Tax impact on non-GAAP adjustments 6,218 19,702 13,373 19,838 Tax related non-GAAP items (4) (16,651) 2,555 (34,845) 1,496,049
58,655$ (10,634)$ 108,861$ 18,220$
GAAP effective tax rate 25.7% 44.8% 24.6% 7,437.0%Non-GAAP effective tax rate 19.5% 27.8% 19.8% 37.5%
GAAP net income (loss) 199,714$ (40,602)$ 400,090$ 1,477,529$ Stock-based compensation 28,855 25,007 56,096 47,934 Amortization of intangibles (1) 3,062 3,245 6,125 3,245 Acquisition related costs (2) 68 6,980 104 17,494 Arbitration award gain (3) - - (43,403) - Tax impact on non-GAAP adjustments (6,218) (19,702) (13,373) (19,838) Tax related non-GAAP items (4) 16,651 (2,555) 34,845 (1,496,049)
Non-GAAP net income (loss) 242,132$ (27,627)$ 440,484$ 30,315$
GAAP diluted net income (loss) per share 2.51$ (0.52)$ 5.02$ 18.70$ Non-GAAP diluted net income (loss) per share 3.04$ (0.35)$ 5.52$ 0.38$
79,638 78,769 79,737 79,016
Non-GAAP net income (loss) before provision for (benefit from) income taxes
Non-GAAP provision for (benefit from) income taxes
Shares used in computing diluted net income (loss) per share
GAAP provision for (benefit from) income taxes
Three Months EndedJune 30,
Six Months EndedJune 30,
GAAP interest income and other income (expense), net
Non-GAAP interest income and other income (expense), net
GAAP net income (loss) before provision for (benefit from) income taxes

29© 2021 Align Technology, Inc. All rights reserved.