algebra on the oregon coast - amazon web services · web viewcity-data ( ): latitude, longitude,...
TRANSCRIPT

Algebra on the Oregon Coast document.doc
Algebra on the Oregon Coast: Data 01
Bob Albrecht ([email protected]) & Brian Hanna ([email protected])
This work is licensed under a Creative Commons Attribution-Noncommercial 3.0 license.http://creativecommons.org/licenses/by-nc/3.0/
Algebra on the Oregon Coast is a collection of instructional units in which algebra is presented in the context of exploring the Oregon Coast from Astoria in the north to Harbor and the California Border in the south.
Most units are Microsoft Word files that you can download and edit.
Algebra on the Oregon Coast units are posted on the Internet at Curriki:
Go to http://www.curriki.org and search for algebra oregon coast
This unit: Algebra on the Oregon Coast: Data 01 (Algebra-ORC-Data01.doc) is a reference unit containing data about Oregon Coast counties and cities. Each section contains ideas for activities called Things to Do with the Data.
CONTENTS OF THIS UNIT [click on a link to go to that section]
United States and Oregon Population
US and Oregon populations, years 2000 through 2008
Oregon Coast Counties
Population in the year 2008Area in square kilometers and square miles
Oregon Coast Cities
Latitude, longitude, and elevation above sea level Area in square milesPopulation in 2008 and population change from 2000 to 2008
Oregon Coast Cities – Population 2000-2005
Population for years 2000 through 2005Percent population change from the previous year for years 2001-2005
About Linear and Quadratic Regression
TI-84 linear regression [LinReg (ax+b)] and quadratic regression [QuadReg].
Algebra on the OR Coast: Data 01 1 5/13/2023
Algebra on the Oregon Coast document.doc
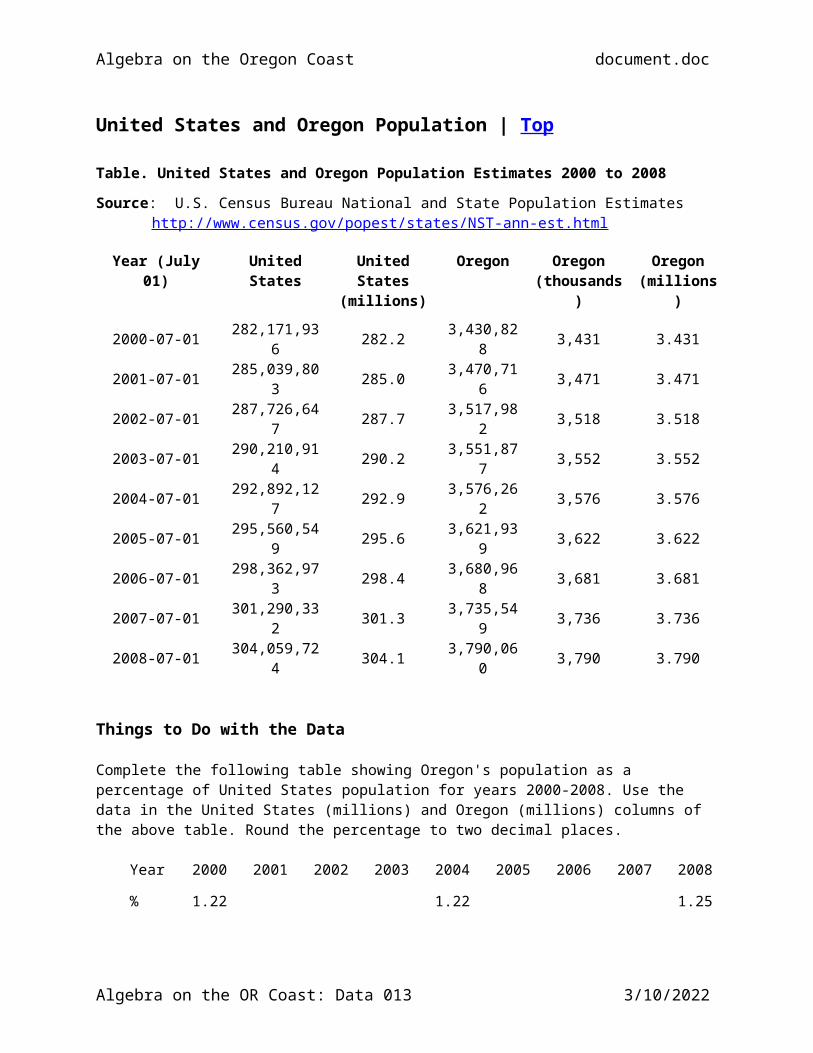
United States and Oregon Population | Top
Table. United States and Oregon Population Estimates 2000 to 2008Source: U.S. Census Bureau National and State Population Estimates
http://www.census.gov/popest/states/NST-ann-est.html
Year (July 01) United States United States(millions)
Oregon Oregon(thousands)
Oregon(millions)
2000-07-01 282,171,936 282.2 3,430,828 3,431 3.431
2001-07-01 285,039,803 285.0 3,470,716 3,471 3.471
2002-07-01 287,726,647 287.7 3,517,982 3,518 3.518
2003-07-01 290,210,914 290.2 3,551,877 3,552 3.552
2004-07-01 292,892,127 292.9 3,576,262 3,576 3.576
2005-07-01 295,560,549 295.6 3,621,939 3,622 3.622
2006-07-01 298,362,973 298.4 3,680,968 3,681 3.681
2007-07-01 301,290,332 301.3 3,735,549 3,736 3.736
2008-07-01 304,059,724 304.1 3,790,060 3,790 3.790
Things to Do with the Data
Complete the following table showing Oregon's population as a percentage of United States population for years 2000-2008. Use the data in the United States (millions) and Oregon (millions) columns of the above table. Round the percentage to two decimal places.
Year 2000 2001 2002 2003 2004 2005 2006 2007 2008
% 1.22 1.22 1.25
Calculate the percent increase in population from 2000 to 2008 of (a) US population and (b) Oregon's population. We will do the US calculation. You do the Oregon calculation.
US: = = 7.76%
OR: =
Algebra on the OR Coast: Data 01 2 5/13/2023
Algebra on the Oregon Coast document.doc
We used a TI-84 Graphing Calculator to make a scatter plot of US population for years 2000-2008. We used Year – 2000 for the horizontal axis and Population (millions) for the vertical axis.
It looked right-on linear, so we then did a TI-84 linear regression [LinReg (ax+b)] and got the following linear model of US population in the years 2000 through 2008:
y = 2.722x + 282.2 [Aha! Good old y = mx + b]
slope: m = 2.72 million/year, y-intercept: b = 282.2 million
Year – 2000
012345678
Population(millions)
282.2285.0287.7290.2292.9295.6298.4301.3304.1
Over yonder are:
TI-84 scatter plot, and TI-84 graph of the linear
model of the data:
y = 2.722 + 282.2
r2 = 0.9997
r = 0.9998
The graph of y = 2.722 + 282.2 fits the data very well. Each data point is on or very close to the graph. As part of the linear regression calculation, the TI-84 calculates "goodness of fit" values r2 and r. If these values are close to 1, the fit is a good fit – the closer to 1, the better the fit. If r2 and r are both equal to 1, the fit is a perfect fit – every data point is on the graph.
y = 2.722 + 282.2 enjoys goodness of fit values r2 = 0.9997 and r = 0.9998. The fit is very good.
Another way to check goodness of fit is to calculate the percent difference of the model value and the actual value for each year 2000 to 2008. In the table below, %diff values are rounded to 2 decimal places.
Year – 2000 Population (millions)
y = 2.722 + 282.2(millions) % diff Comments
012345678
282.2285.0287.7290.2292.9295.6298.4301.3304.1
282.2284.9287.6290.4293.1295.8298.5301.3304.0
0.000.040.03 0.07 0.07 0.07 0.03 0.000.03
y-intercept
The percent differences are very small, less than 0.1%.
For the years 2000 through 2008, the linear model fits the data very well.
Your Turn. Before you peek at our stuff below, make a scatter plot Year – 2000 Population
Algebra on the OR Coast: Data 01 3 5/13/2023

Algebra on the Oregon Coast document.doc
of Oregon's population for years 2000-2008. Use Year – 2000 for the horizontal axis and Population (millions) for the vertical axis. Compare your scatter plot with ours below.
Does it look linear? If yes, do a linear regression and fit a linear function to the data. We did it and got the following linear model of Oregon's population in the years 2000 through 2008:
y = 0.04378x + 3.422 [Yup, y = mx + b again.]
slope: m = 0.04378 million/year, y-intercept: b = 3.422 million
012345678
(millions)3.4313.4713.5183.5523.5763.6223.6813.7363.790
Over yonder are our:
TI-84 scatter plot, and TI-84 graph of the linear
model of the data:
y = 0.04378x + 3.422
r2 = 0.9882r = 0.9941
The graph of y = 0.04378x + 3.422 fits the data very well. Each data point is on or close to the graph. y = 0.04378x + 3.422 enjoys TI-84 goodness of fit values r2 = 0.9882 and r = 0.9941. The fit is very good.
Check goodness of fit by calculating the percent difference of the model value and the actual value for each year 2000 to 2008. Round % diff values to 2 decimal places. We did the calculations for 2000 and 2005.
Year – 2000 Population (millions)
y = 0.04378x + 3.422(millions) % diff Comments
0 3.431 3.422 0.26 The model is 0.26% low.
1 3.471
2 3.518
3 3.552
4 3.576
5 3.622 3.641 0.52 The model is 0.52% high.
6 3.681
7 3.736
8 3.790
Algebra on the OR Coast: Data 01 4 5/13/2023

Algebra on the Oregon Coast document.doc
We made a TI-84 scatter plot of US population for years 2000 through 2003. We used Year – 2000 for the horizontal axis and Population (millions) for the vertical axis.
We then did a TI-84 linear regression [LinReg (ax+b)] and got the following linear model of US population 2000-2003.
y = 2.670x + 282.3 [Of course, y = mx + b again.]
slope: m = 2.670 million/year, y-intercept: b = 282.3 million
Year – 2000
0123
Population(millions)
282.2285.0287.7290.2
Over yonder you see:
TI-84 scatter plot, and Graph of the linear
model of the data:
y = 2.670x + 282.3
r2 = 0.9994r = 0.9997
How well does our linear model for 2000-2003 predict US population for years 2004 through 2008? In the table below, %diff values are rounded to 2 decimal places.
Year – 2000 Population (millions)
y = 2.670 + 282.3(millions) % diff Comments
45678
292.9295.6298.4301.3304.1
293.0295.7298.3301.0303.7
0.03 0.030.030.100.13
The model is 0.03% high.The model is 0.03% high.The model is 0.03% low.The model is 0.10% low.The model is 0.13% low.
The linear model y = 2.670x + 282.3 predicts US population for 2004, 2005, and 2006 very well: 0.03%. The predictions for 2007 and 2008 are also good: 0.10% for 2007 and 0.13% for 2008.
The model is based on data for years 2000, 20001, 2002, and 2003. The farther into the future from 2003, the less reliable is the model for predicting US population.
Algebra on the OR Coast: Data 01 5 5/13/2023

Algebra on the Oregon Coast document.doc
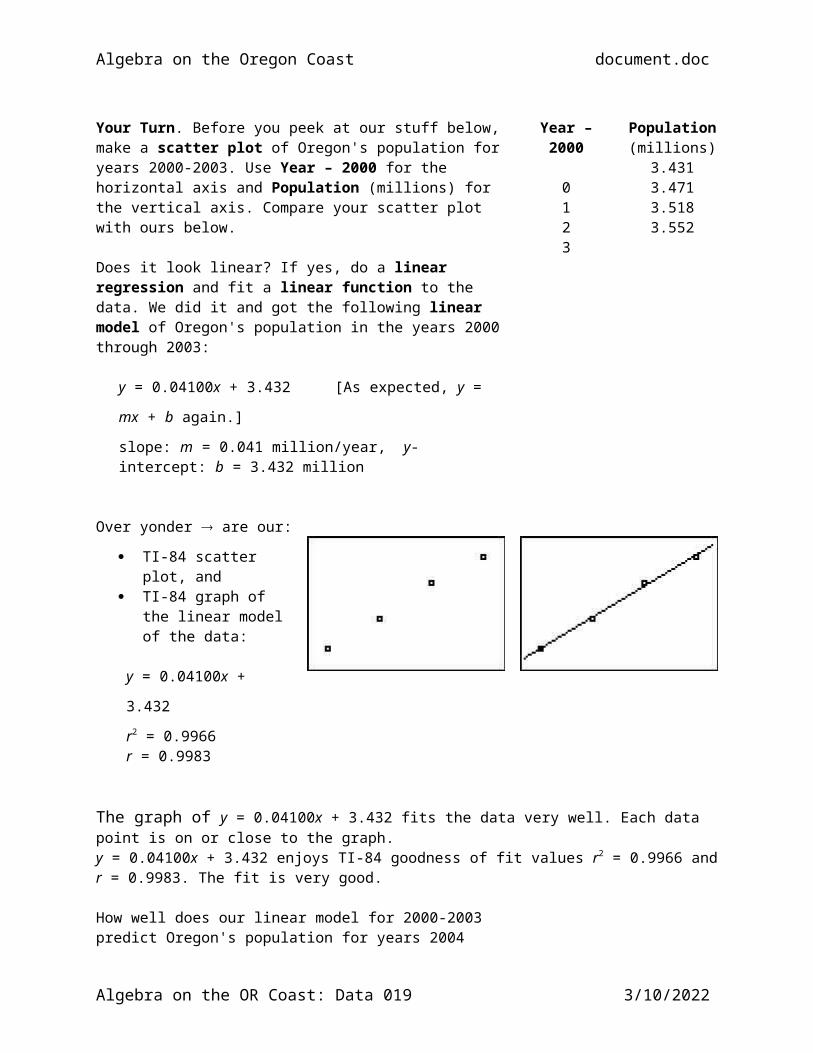
Your Turn. Before you peek at our stuff below, make a scatter plot of Oregon's population for years 2000-2003. Use Year – 2000 for the horizontal axis and Population (millions) for the vertical axis. Compare your scatter plot with ours below.
Does it look linear? If yes, do a linear regression and fit a linear function to the data. We did it and got the following linear model of Oregon's population in the years 2000 through 2003:
y = 0.04100x + 3.432 [As expected, y = mx + b again.]
slope: m = 0.041 million/year, y-intercept: b = 3.432 million
Year – 2000
0123
Population(millions)
3.4313.4713.5183.552
Over yonder are our:
TI-84 scatter plot, and TI-84 graph of the linear
model of the data:
y = 0.04100x + 3.432
r2 = 0.9966r = 0.9983
The graph of y = 0.04100x + 3.432 fits the data very well. Each data point is on or close to the graph. y = 0.04100x + 3.432 enjoys TI-84 goodness of fit values r2 = 0.9966 and r = 0.9983. The fit is very good.
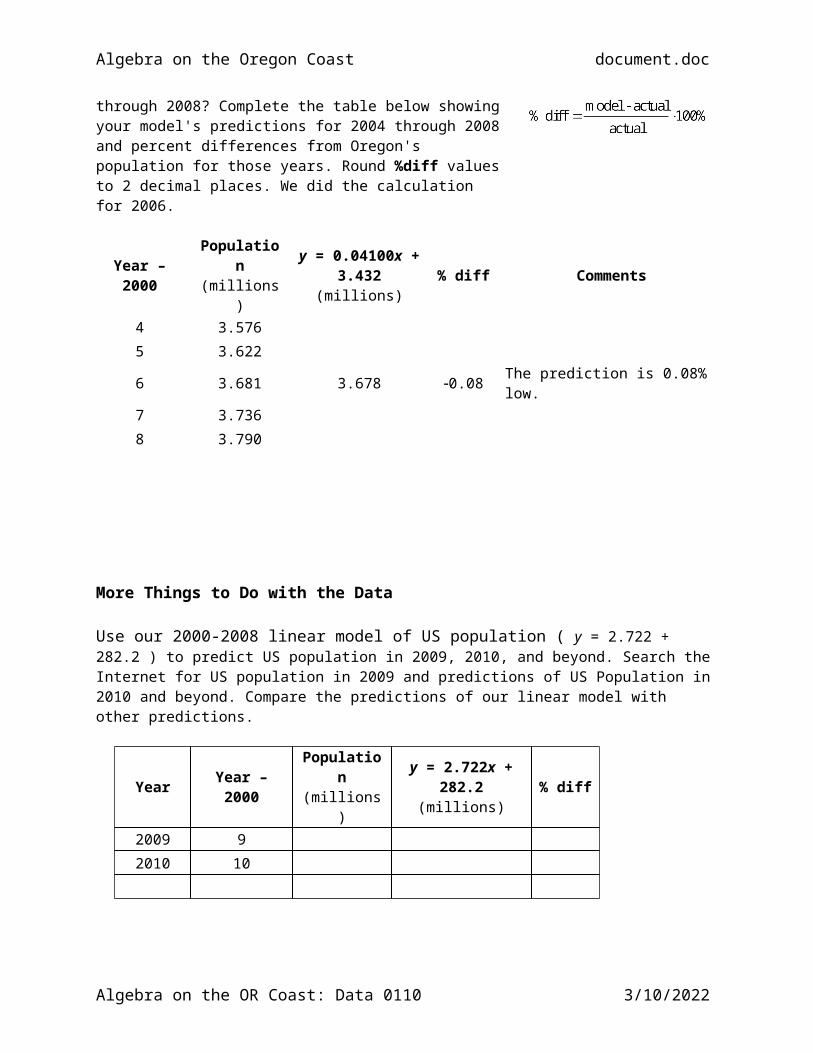
How well does our linear model for 2000-2003 predict Oregon's population for years 2004 through 2008? Complete the table below showing your model's predictions for 2004 through 2008 and percent differences from Oregon's population for those years. Round %diff values to 2 decimal places. We did the calculation for 2006.
Year – 2000 Population (millions)
y = 0.04100x + 3.432(millions) % diff Comments
4 3.576
5 3.622
6 3.681 3.678 0.08 The prediction is 0.08% low.
7 3.736
8 3.790
Algebra on the OR Coast: Data 01 6 5/13/2023

Algebra on the Oregon Coast document.doc
More Things to Do with the Data
Use our 2000-2008 linear model of US population ( y = 2.722 + 282.2 ) to predict US population in 2009, 2010, and beyond. Search the Internet for US population in 2009 and predictions of US Population in 2010 and beyond. Compare the predictions of our linear model with other predictions.
Year Year – 2000 Population (millions)
y = 2.722x + 282.2(millions) % diff
2009 9
2010 10
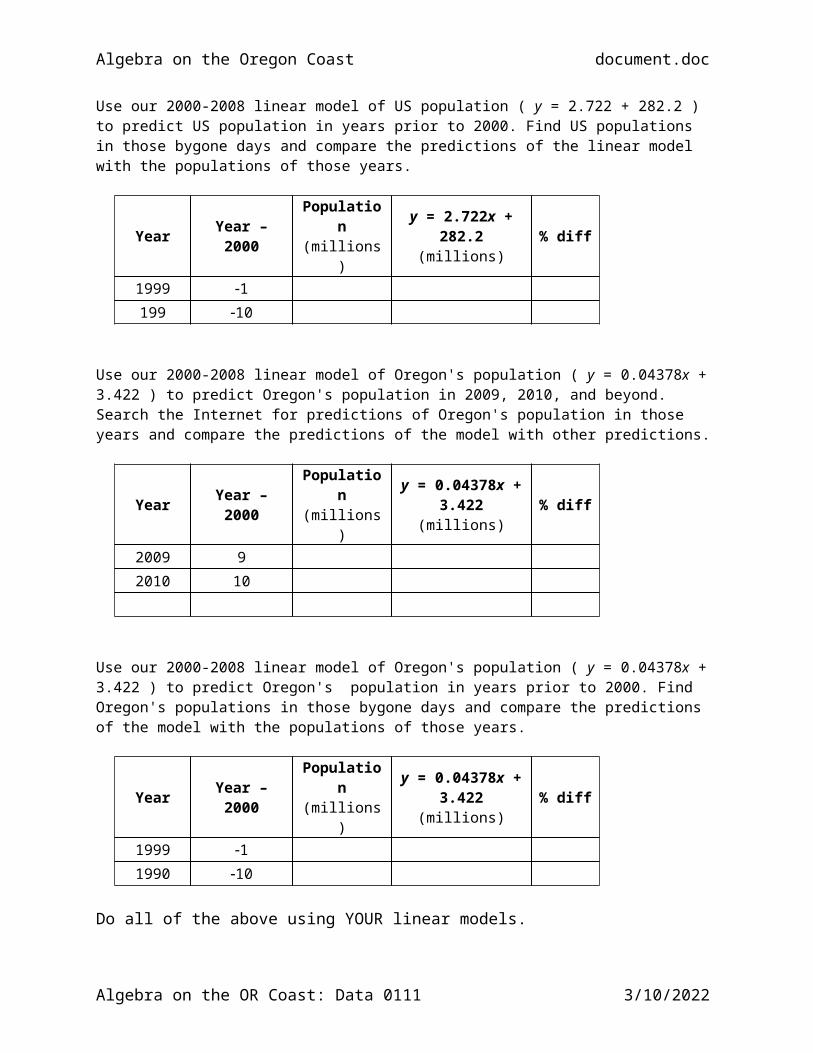
Use our 2000-2008 linear model of US population ( y = 2.722 + 282.2 ) to predict US population in years prior to 2000. Find US populations in those bygone days and compare the predictions of the linear model with the populations of those years.
Year Year – 2000 Population (millions)
y = 2.722x + 282.2(millions) % diff
1999 1
199 10
Use our 2000-2008 linear model of Oregon's population ( y = 0.04378x + 3.422 ) to predict Oregon's population in 2009, 2010, and beyond. Search the Internet for predictions of Oregon's population in those years and compare the predictions of the model with other predictions.
Year Year – 2000 Population (millions)
y = 0.04378x + 3.422(millions) % diff
2009 9
2010 10
Use our 2000-2008 linear model of Oregon's population ( y = 0.04378x + 3.422 ) to predict Oregon's population in years prior to 2000. Find Oregon's populations in those bygone days and compare the predictions of the model with the populations of those years.
Year Year – 2000 Population (millions)
y = 0.04378x + 3.422(millions) % diff
1999 1
1990 10
Do all of the above using YOUR linear models.
Algebra on the OR Coast: Data 01 7 5/13/2023

Algebra on the Oregon Coast document.doc
Oregon Coast Counties | Top
Seven of Oregon's 36 counties border the Pacific Ocean on the Oregon Coast.
Table. Oregon Coast Counties, Populations, and Areas
Sources:
Population: U.S. Census Bureau
Area: Various Internet sources, including ( http://en.wikipedia.org/wiki/List_of_counties_in_Oregon )
Map provided by Digital Map Store ( http://www.digital-topo-maps.com )
County (north to south)
Population(2008)
Area(km2)
Area(mi2)
Clatsop 37,404 2,810 1,085
Tillamook 24,927 2,934 1,133
Lincoln 45,946 3,092 1,194
Lane 346,560 12,230 4,722
Douglas 104,059 13,297 5,134
Coos 63,453 4,678 1,806
Curry 21,523 5,151 1,989
Things to Do with the Data
1. Calculate the population density of each county:
a. Clatsop:
b. Clatsop:
2. Calculate the population densities of the other six counties.
3. Calculate the total population of the six Oregon Coast counties.
4. Calculate the total area of the Oregon Coast counties in square kilometers and square miles.
5. Calculate the Oregon Coast population density: (total population) / (total area)
Algebra on the OR Coast: Data 01 8 5/13/2023
Algebra on the Oregon Coast document.doc
Oregon Coast Cities | Top
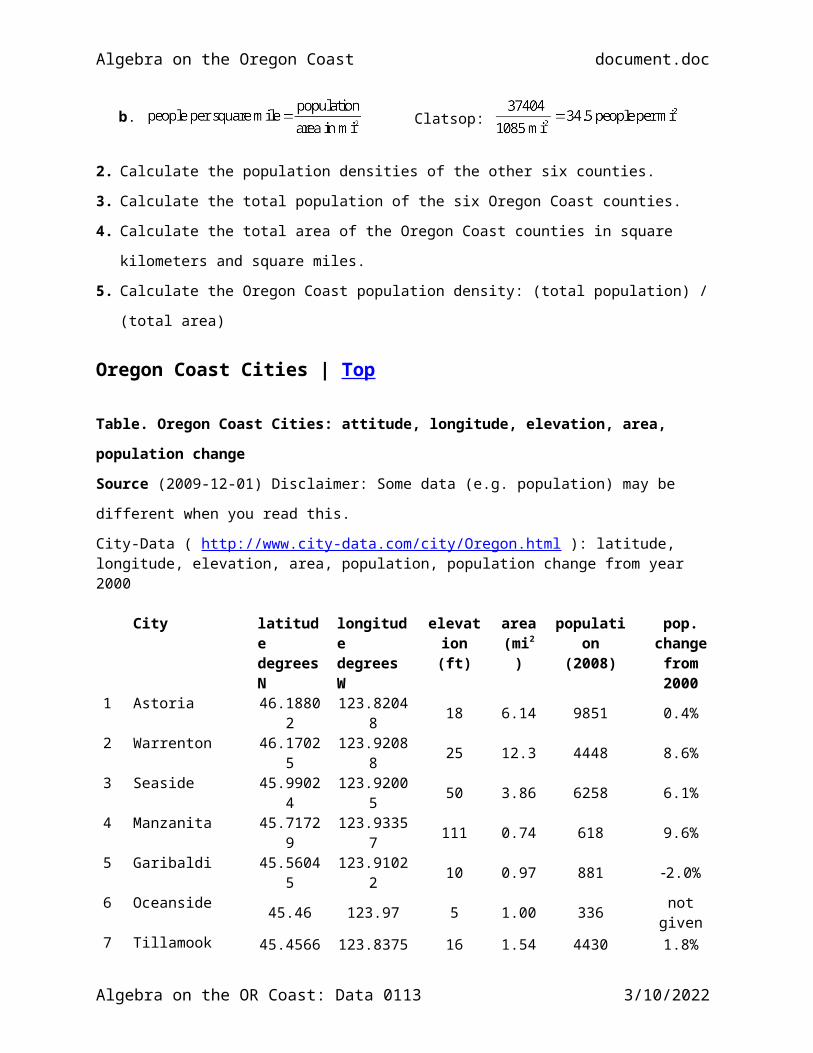
Table. Oregon Coast Cities: attitude, longitude, elevation, area, population change Source (2009-12-01) Disclaimer: Some data (e.g. population) may be different when you read this.
City-Data ( http://www.city-data.com/city/Oregon.html ): latitude, longitude, elevation, area, population, population change from year 2000
City latitudedegrees N
longitudedegrees W
elevation (ft)
area(mi2)
population(2008)
pop. changefrom 2000
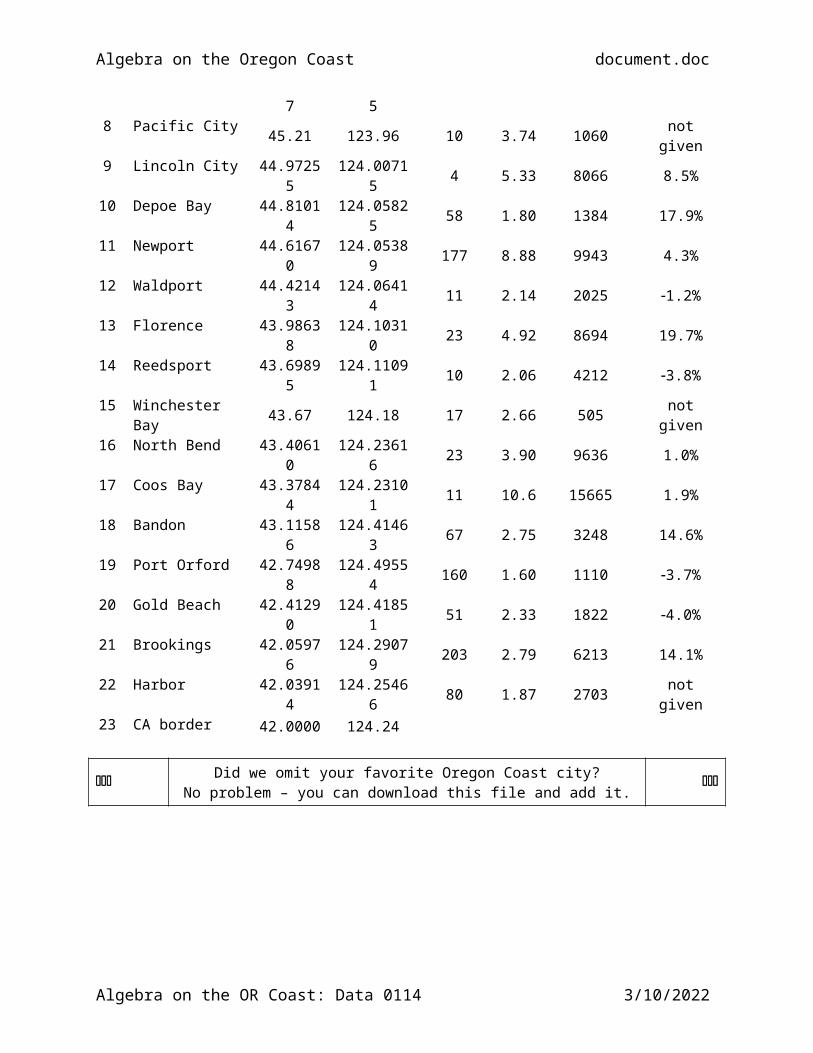
1 Astoria 46.18802 123.82048 18 6.14 9851 0.4%2 Warrenton 46.17025 123.92088 25 12.3 4448 8.6%3 Seaside 45.99024 123.92005 50 3.86 6258 6.1%4 Manzanita 45.71729 123.93357 111 0.74 618 9.6%5 Garibaldi 45.56045 123.91022 10 0.97 881 2.0%6 Oceanside 45.46 123.97 5 1.00 336 not given7 Tillamook 45.45667 123.83755 16 1.54 4430 1.8%8 Pacific City 45.21 123.96 10 3.74 1060 not given9 Lincoln City 44.97255 124.00715 4 5.33 8066 8.5%10 Depoe Bay 44.81014 124.05825 58 1.80 1384 17.9%11 Newport 44.61670 124.05389 177 8.88 9943 4.3%12 Waldport 44.42143 124.06414 11 2.14 2025 1.2%13 Florence 43.98638 124.10310 23 4.92 8694 19.7%14 Reedsport 43.69895 124.11091 10 2.06 4212 3.8%15 Winchester Bay 43.67 124.18 17 2.66 505 not given16 North Bend 43.40610 124.23616 23 3.90 9636 1.0%17 Coos Bay 43.37844 124.23101 11 10.6 15665 1.9%18 Bandon 43.11586 124.41463 67 2.75 3248 14.6%19 Port Orford 42.74988 124.49554 160 1.60 1110 3.7%20 Gold Beach 42.41290 124.41851 51 2.33 1822 4.0%21 Brookings 42.05976 124.29079 203 2.79 6213 14.1%22 Harbor 42.03914 124.25466 80 1.87 2703 not given23 CA border 42.0000 124.24
Did we omit your favorite Oregon Coast city?No problem – you can download this file and add it.
Algebra on the OR Coast: Data 01 9 5/13/2023
Algebra on the Oregon Coast document.doc
Things to Do with the Data
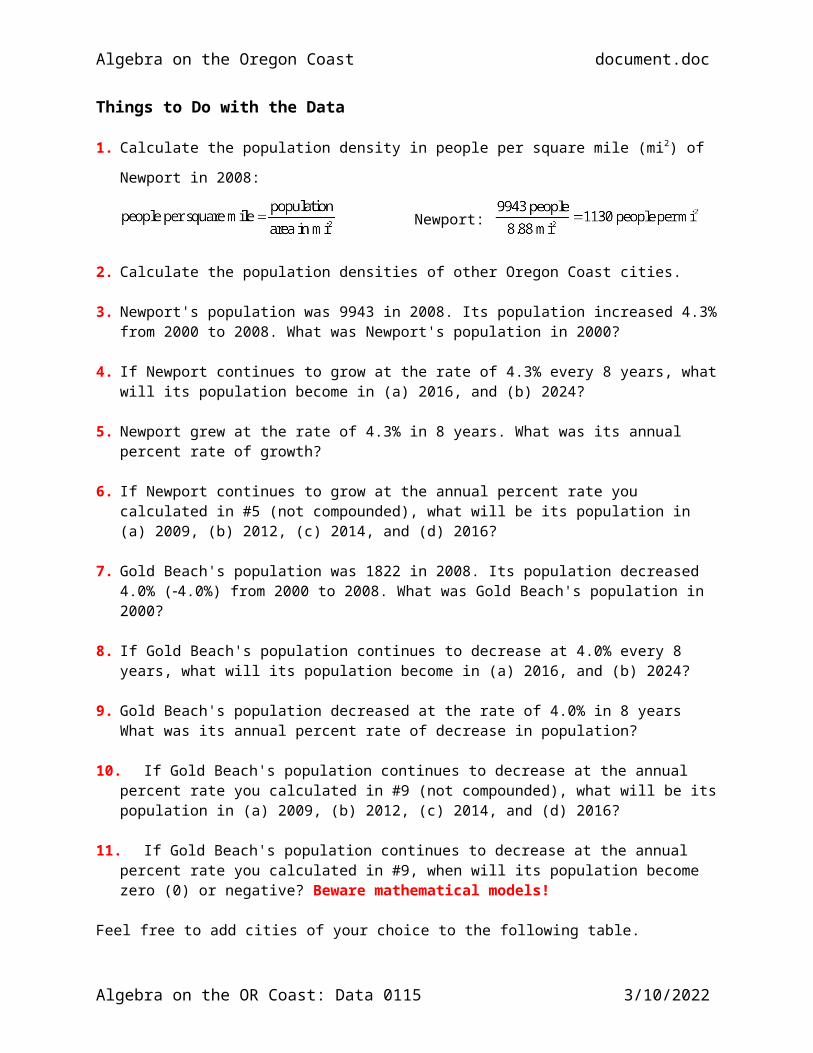
1. Calculate the population density in people per square mile (mi2) of Newport in 2008:
Newport:
2. Calculate the population densities of other Oregon Coast cities.
3. Newport's population was 9943 in 2008. Its population increased 4.3% from 2000 to 2008. What was Newport's population in 2000?
4. If Newport continues to grow at the rate of 4.3% every 8 years, what will its population become in (a) 2016, and (b) 2024?
5. Newport grew at the rate of 4.3% in 8 years. What was its annual percent rate of growth?
6. If Newport continues to grow at the annual percent rate you calculated in #5 (not compounded), what will be its population in (a) 2009, (b) 2012, (c) 2014, and (d) 2016?
7. Gold Beach's population was 1822 in 2008. Its population decreased 4.0% (4.0%) from 2000 to 2008. What was Gold Beach's population in 2000?
8. If Gold Beach's population continues to decrease at 4.0% every 8 years, what will its population become in (a) 2016, and (b) 2024?
9. Gold Beach's population decreased at the rate of 4.0% in 8 years What was its annual percent rate of
decrease in population? 10. If Gold Beach's population continues to decrease at the annual percent rate you calculated in #9 (not
compounded), what will be its population in (a) 2009, (b) 2012, (c) 2014, and (d) 2016? 11. If Gold Beach's population continues to decrease at the annual percent rate you calculated in #9, when
will its population become zero (0) or negative? Beware mathematical models!
Feel free to add cities of your choice to the following table.
City 2008population
% increasefrom 2000
2000population
Annual %change
Population in 2108
Astoria 9851 0.4 9812 0.05 10,344
Tillamook 4430 1.8 4352 0.225 5427
Reedsport 2212 3.8 2299 0.475 6194*
Port Orford 1110 3.7 1153 0.4625 2997*
* Oops! Negative population. Beware mathematical models used to predict far beyond the data!
Algebra on the OR Coast: Data 01 10 5/13/2023
Algebra on the Oregon Coast document.doc
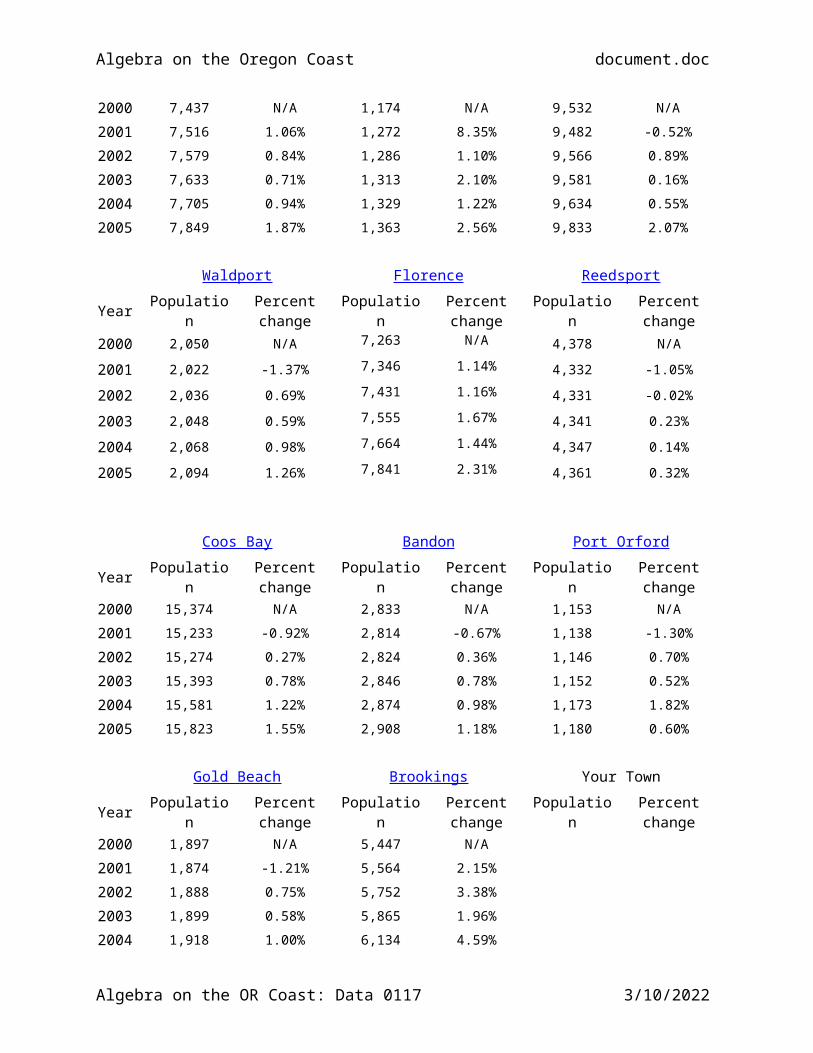
Oregon Coast Cities: Population 2000 – 2005 | Top
A deluge of data about Oregon cities resides at Oregon Profile ( http://www.idcide.com/citydata/or/ ).
Scroll down to Cities & Towns and click on a city or town. Like kids in a toy store with mom's credit card, we selected a bunch of Oregon Coast cities. In the tables down yonder, click on the name of a city to go to the Oregon Profile for that city and enjoy a cornucopia of data, data, data.
Astoria Seaside Tillamook
Year Population Percentchange
Population Percentchange
Population Percentchange
2000 9,813 N/A 5,900 N/A 4,352 N/A
2001 9,728 -0.87% 5,882 -0.31% 4,353 0.02%
2002 9,713 -0.15% 5,889 0.12% 4,485 3.03%
2003 9,710 -0.03% 5,961 1.22% 4,493 0.18%
2004 9,747 0.38% 6,018 0.96% 4,475 -0.40%
2005 9,784 0.38% 6,116 1.63% 4,471 -0.09%
Lincoln City Depoe Bay Newport
Year Population Percentchange Population Percent
change Population Percentchange
2000 7,437 N/A 1,174 N/A 9,532 N/A
2001 7,516 1.06% 1,272 8.35% 9,482 -0.52%
2002 7,579 0.84% 1,286 1.10% 9,566 0.89%
2003 7,633 0.71% 1,313 2.10% 9,581 0.16%
2004 7,705 0.94% 1,329 1.22% 9,634 0.55%
2005 7,849 1.87% 1,363 2.56% 9,833 2.07%
Waldport Florence Reedsport
Year Population Percentchange Population Percent
change Population Percentchange
2000 2,050 N/A 7,263 N/A 4,378 N/A
2001 2,022 -1.37% 7,346 1.14% 4,332 -1.05%
2002 2,036 0.69% 7,431 1.16% 4,331 -0.02%
2003 2,048 0.59% 7,555 1.67% 4,341 0.23%
2004 2,068 0.98% 7,664 1.44% 4,347 0.14%
2005 2,094 1.26% 7,841 2.31% 4,361 0.32%
Algebra on the OR Coast: Data 01 11 5/13/2023

Algebra on the Oregon Coast document.doc
Coos Bay Bandon Port Orford
Year Population Percentchange Population Percent
change Population Percentchange
2000 15,374 N/A 2,833 N/A 1,153 N/A
2001 15,233 -0.92% 2,814 -0.67% 1,138 -1.30%
2002 15,274 0.27% 2,824 0.36% 1,146 0.70%
2003 15,393 0.78% 2,846 0.78% 1,152 0.52%
2004 15,581 1.22% 2,874 0.98% 1,173 1.82%
2005 15,823 1.55% 2,908 1.18% 1,180 0.60%
Gold Beach Brookings Your Town
Year Population Percentchange Population Percent
change Population Percentchange
2000 1,897 N/A 5,447 N/A
2001 1,874 -1.21% 5,564 2.15%
2002 1,888 0.75% 5,752 3.38%
2003 1,899 0.58% 5,865 1.96%
2004 1,918 1.00% 6,134 4.59%
2005 1,930 0.63% 6,297 2.66%
Algebra on the OR Coast: Data 01 12 5/13/2023
Algebra on the Oregon Coast document.doc
Things to Do with the Data We made a TI-84 scatter plot of Astoria's population for years 2000 through 2005 with Year – 2000 on the horizontal axis and Population on the vertical axis.
Definitely not linear, so we tried a TI-84 quadratic regression [QuadReg] and got a quadratic model of Astoria's population in the years 2000 through 2005:
y = 14.61x2 – 75.64x + 9804
Year – 2000
012345
Population
981397289713971097479784
Over yonder are:
TI-84 scatter plot, and Graph of the quadratic
model of the data:
y = 14.61x2 – 75.64x + 9804
R2 = 0.9419
The graph of the quadratic model y = 14.61x2 – 75.64x + 9804 fits the data fairly well. Each data point is on or close to the graph. The TI-84 calculates a "goodness of fit" value R2. If this value is close to 1, the fit is a good fit – the closer to 1, the better the fit. If R2 is equal to 1, the fit is a perfect fit.
y = 14.61x2 – 75.64x + 9804 enjoys goodness of fit value R2 = 0.9419. The fit is good.
Check goodness of fit by calculating the percent difference of the model value and the actual value for each year 2000 to 2008. In the table below, % diff values are rounded to 2 decimal places.
Year – 2000 Population y = 14.61x2 – 75.64x + 9804 % diff Comments0 9813 9804 0.09 The model is 0.09% low.
1 9728
2 9713
3 9710
4 9747 9735 0.12 The model is 0.12% low.
5 9784 .
Astoria's population in 2008 was 9851. How well does the quadratic model for 2000-2005 predict Astoria's 2008 population?
The quadratic model's prediction is high by only 2.9%. Not too shabby!
y = 14.61x2 – 75.64x + 9804
y = 14.61(82) – 75.64(8) + 9804 = 10134
= 2.9%
Algebra on the OR Coast: Data 01 13 5/13/2023
Algebra on the Oregon Coast document.doc
Coos Bay is the largest city on the Oregon Coast. We made a scatter plot of Coos Bay's population for years 2000 through 2005 with Year – 2000 on the horizontal axis and Population on the vertical axis.
Yup, not linear. Looks radically quadratic, so let's do a TI-84 QuadReg. We got the following quadratic model of Astoria's population in the years 2000 through 2005:
y = 44.70x2 – 126.1x + 15352
Year – 2000
012345
Population
153741523315274153931558115823
Over yonder are:
TI-84 scatter plot, and Graph of the quadratic
model of the data:
y = 44.70x2 – 126.1x + 15352
R2 = 0.9885
The graph of the quadratic model y = 44.70x2 – 126.1x + 15352 fits the data quite well. Each data point is on or close to the graph.
y = 44.70x2 – 126.1x + 15352 enjoys a goodness of fit value R2 = 0.9885. The fit is good.
Check goodness of fit by calculating the percent difference of the model value and the actual value for each year 2000 to 2005. Round % diff values to 2 decimal places.
Year – 2000 Population y = 44.70x2 – 126.1x + 15352 % diff Comments0 15374 15352 0.14 The model is 0.14% low.
1 15233
2 15274
3 15393
4 15581 15563 0.12 The model is 0.12% low.
5 15823
Coos Bay's population in 2008 was 15665. How well does the quadratic model for 2000-2005 predict Astoria's 2008 population?
y = 44.70(8)2 – 126.1(8) + 15352 =
% diff =
Our quadratic model predicted that Coos Bay's population would increase from 2005 to 2008. It didn't – it decreased from 15,823 in 2005 to 15,665 in 2008. Beware mathematical models, especially when used to predict the future!
Algebra on the OR Coast: Data 01 14 5/13/2023
Algebra on the Oregon Coast document.doc
Your Turn Pick another Oregon Coast city, make a scatter plot of the 2000-2005 population data, and then choose linear regression, quadratic regression, or another regression to fit a function to the data. Calculate the percent difference of the model value and actual value for each year 2000-2005. Use your model to predict the city's population in 2008. Calculate the percent difference of the model's prediction from the city's 2008 population. We copied 2000-2005 and 2008 data for a few Oregon Coast cities below.
Tillamook Lincoln City Florence
Year - 2000 Population Year - 2000 Population Year – 2000 Population
012345
8
435243534485449344754471
4430
012345
8
743775167579763377057849
8066
012345
8
725373467431755576647841
8694
Newport Brookings Your Town
Year – 2000 Population Year – 2000 Population Year - 2000 Population
012345
8
9,5329,4829,5669,5819,6349,833
9,943
012345
8
544755645752586561346297
6213
012345
8
Several Oregon Coast cities decreased in population from 2000 to 2001, and then increased in population in 2002, 2003, 2004, and 2005. For these cities, try a linear regression for years 2001-2005 and use it to predict the 2008 population.
Newport Coos Bay Gold Beach
Year – 2000 Population Year – 2000 Population Year - 2000 Population
12345
8
9,4829,5669,5819,6349,833
9,943
12345
8
1523315274153931558115823
15665
12345
8
1,8741,8881,8991,9181,930
1822
Algebra on the OR Coast: Data 01 15 5/13/2023

Algebra on the Oregon Coast document.doc
About Linear and Quadratic Regression | Top
To learn more about linear and quadratic regression using the TI-83, TI-84, or Microsoft Excel, crank up your favorite search engine and search for these key words and phrases:
linear regression line of best fit quadratic regression coefficient of determination correlation coefficient
We like these:
Regression (Curve Fitting) with the TI-83/TI-84 Calculatorhttp://fym.la.asu.edu/~tturner/MAT_117_online/Regression/Linear%20Regression%20Using%20the%20TI-83%20Calculator.htm
Linear regression Quadratic regression
Line of Best Fit http://mathbits.com/mathbits/TISection/Statistics1/LineFit.htm
Paper and pencil solution (use a straight strand of spaghetti to "eyeball" a line of best fit) Graphing calculator linear regression solution (StatPlot, LinReg)
Best Fit Lines http://honolulu.hawaii.edu/distance/sci122/SciLab/L6/bestfit.html
How to draw the "best fit line" Slope (m) and y-intercept (b) of the best fit line Regression coefficient (R)
NCTM Illuminations: Correlation and the Regression Linehttp://illuminations.nctm.org/LessonDetail.aspx?ID=L456
Linear regression lesson plan and interactive applet
What is linear regression? http://cs.gmu.edu/cne/modules/dau/stat/regression/linregsn/nreg_1_frm.html
Page of a sequence of tutorial pages. Click on the > button to move on. Page titles:
What is simple linear regression? Scatter plots Errors in linear regression What is simple linear regression analysis? Solving the regression equation Residual analysis Correlation and regression coefficients Exercises using linear regression (multiple choice)
Algebra on the OR Coast: Data 01 16 5/13/2023
Algebra on the Oregon Coast document.doc
Exploring space through algebra (NASA PDF file) http://humanresearch.jsc.nasa.gov/education/downloads/AL_ED_ShuttleAscent_5-08.pdf
Scroll down to find linear regression and quadratic regression models of Space Shuttle mass and altitude as functions of time during a shuttle launch.
Excel Tutorial #11: Linear Regression http://phoenix.phys.clemson.edu/tutorials/excel/regression.html
Sample data, graph of the data, trendline (linear fit), linear equation of the trendline, coefficient of determination R2
Correlation and Regression (Excel) http://cs.wellesley.edu/~cs199/lectures/35-correlation-regression.html
Correlation and regression Curve fitting The method of least squares Regression in Excel Correlation coefficient ( r ) Fundamental assumptions of regression Problems with regression
Quadratic Regression (TI-84) http://calculator.maconstate.edu/quad_regression/index.html
Setting up a viewing rectangle (Window) Making a scatterplot (StatPlot) Calculating the quadratic regression (QuadReg) Graphing the quadratic equation
Quadratic regression QuadReg description (TI-84)http://www.prenhall.com/divisions/esm/app/calculator/medialib/Technology/Documents/TI-83/desc_pages/quad-reg.html
The END of this unit. Look for more Algebra on the Oregon Coast units at Curriki.
Go to http://www.curriki.org and search for algebra oregon coast.
Algebra on the OR Coast: Data 01 17 5/13/2023